27
International experience with greenhouse gas and fuel economy standards Drew Kodjak, Executive Director March 8, 2010 Mexico City, Mexico
| Date post: | 20-Aug-2015 |
| Category: |
Documents |
| Upload: | international-council-on-clean-transportation |
| View: | 1,059 times |
| Download: | 1 times |
International experience with greenhouse gas and fuel economy standards
Drew Kodjak, Executive Director
March 8, 2010 Mexico City, Mexico

The International Council on Clean Transportation (ICCT)
Slide 2 Slide 2
The mission of the ICCT is to dramatically improve the environmental performance and efficiency of cars, trucks, buses, and transportation systems in order to protect and improve public health, the environment, and quality of life.
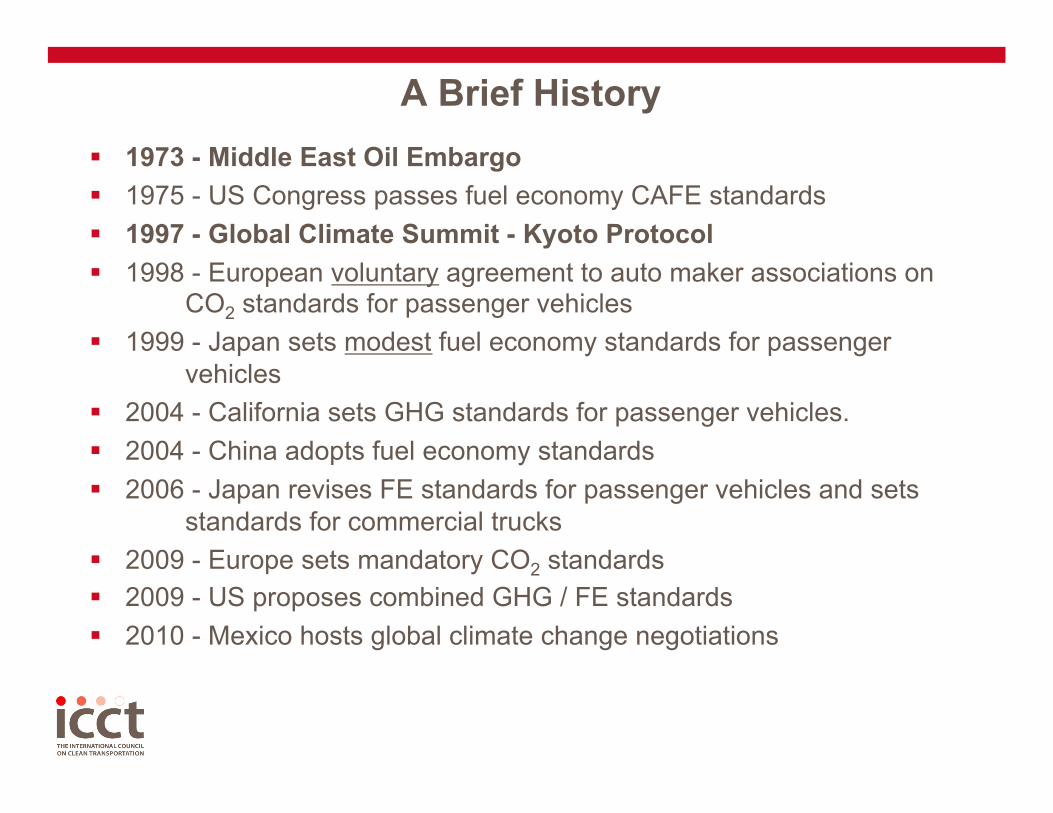
A Brief History 1973 - Middle East Oil Embargo 1975 - US Congress passes fuel economy CAFE standards 1997 - Global Climate Summit - Kyoto Protocol 1998 - European voluntary agreement to auto maker associations on
CO2 standards for passenger vehicles 1999 - Japan sets modest fuel economy standards for passenger
vehicles 2004 - California sets GHG standards for passenger vehicles. 2004 - China adopts fuel economy standards 2006 - Japan revises FE standards for passenger vehicles and sets
standards for commercial trucks 2009 - Europe sets mandatory CO2 standards 2009 - US proposes combined GHG / FE standards 2010 - Mexico hosts global climate change negotiations
United States
World’s First Fuel Economy Standards

US CAFE - Key Statistics According to the National Academy of Sciences 2002 CAFE
study from 1975 to 2000: – 2.8 MBD reduction in US oil consumption, 1/3 less oil use
from passenger cars and light trucks, 14% reduction in US oil consumption.
– 100 million metric tons reduction in CO2, or 7% reduction in total US CO2 emissions.
Several public opinion polls in 2005 - 2006 found very strong support for increasing fuel economy standards. – Depending on the poll, between 77 - 86% supported
government policies to improve fuel economy. – Public support was consistent across political parties and when
increased vehicle price was included in the question.

6
Fuel Economy Policy: CAFE Corporate Average Fuel Economy (CAFE) standards and actual automobile fuel economy in the U.S., 1975-2005
12
14
16
18
20
22
24
26
28
30
1975 1980 1985 1990 1995 2000
Model year
Fuel
eco
nom
y (m
pg)
Actual Passenger carsCAFE Passenger carsActual Light trucksCAFE Light trucks
Cars
Light trucks
7
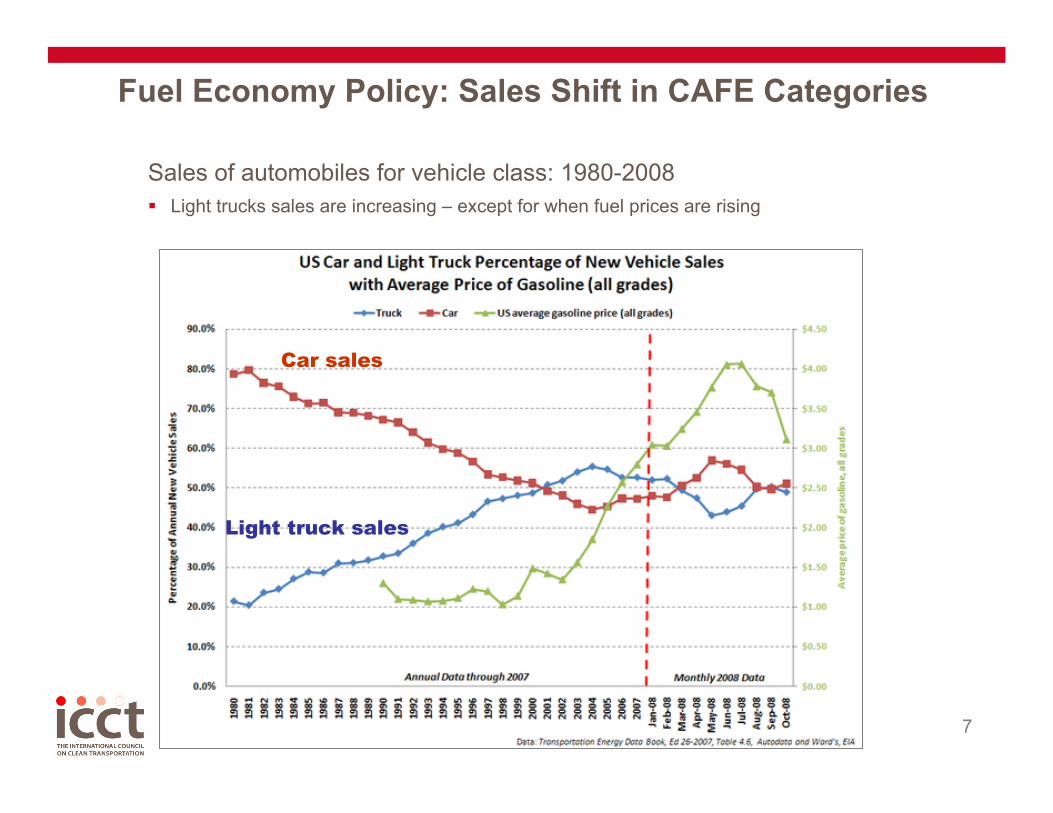
Fuel Economy Policy: Sales Shift in CAFE Categories
Sales of automobiles for vehicle class: 1980-2008 Light trucks sales are increasing – except for when fuel prices are rising
Car sales
Light truck sales
8
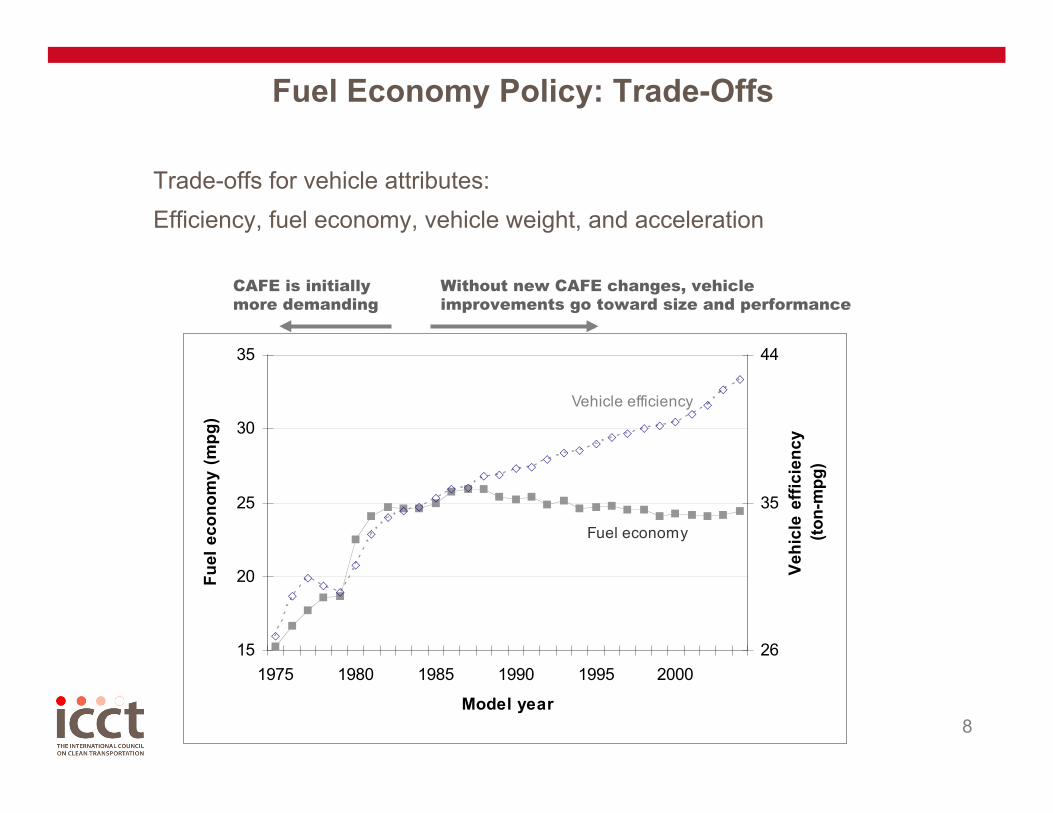
Fuel Economy Policy: Trade-Offs
Trade-offs for vehicle attributes: Efficiency, fuel economy, vehicle weight, and acceleration
CAFE is initially more demanding
Without new CAFE changes, vehicle improvements go toward size and performance
15
20
25
30
35
1975 1980 1985 1990 1995 2000
Model year
Fuel
eco
nom
y (m
pg)
26
35
44
Vehi
cle
effic
ienc
y (to
n-m
pg)
Vehicle efficiency
Fuel economy
9
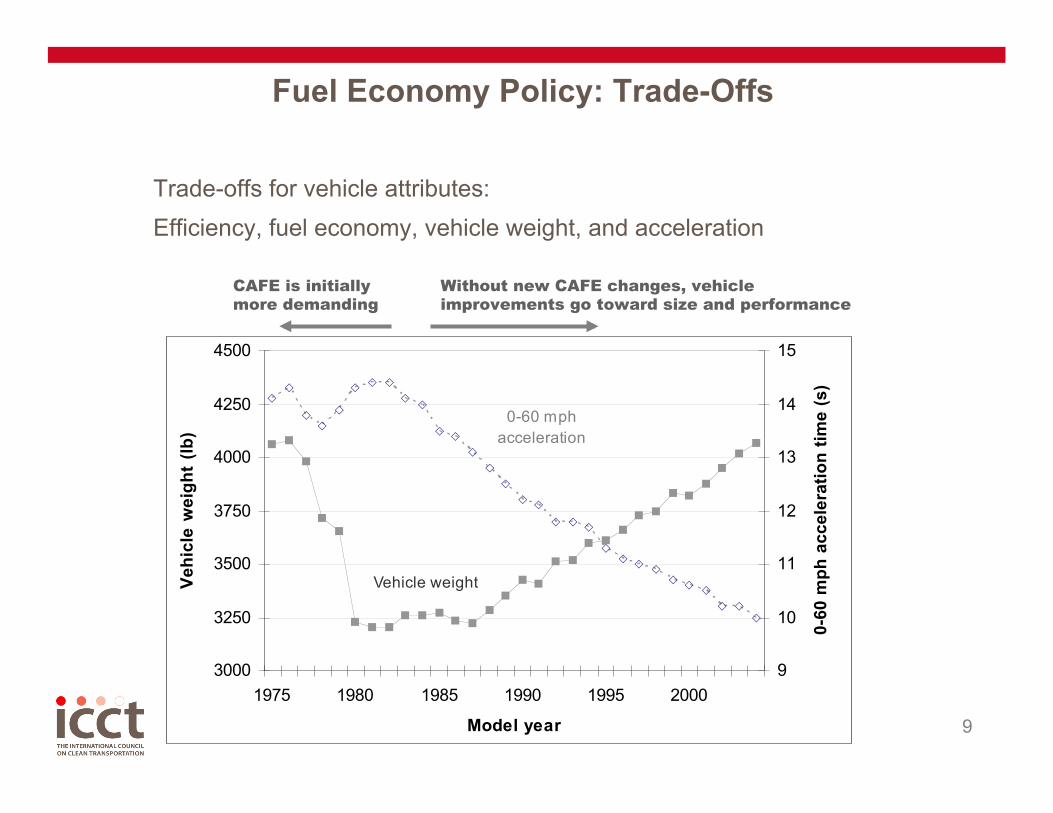
Fuel Economy Policy: Trade-Offs
Trade-offs for vehicle attributes: Efficiency, fuel economy, vehicle weight, and acceleration
3000
3250
3500
3750
4000
4250
4500
1975 1980 1985 1990 1995 2000
Model year
Vehi
cle
wei
ght
(lb)
9
10
11
12
13
14
15
0-60
mph
acc
eler
atio
n tim
e (s
)
Vehicle weight
0-60 mph acceleration
CAFE is initially more demanding
Without new CAFE changes, vehicle improvements go toward size and performance

10
U.S. FE/GHG Rulemaking: Cars
New federal U.S. standards for GHG emissions and fuel economy (approx) Different MY2016 target setting for Cars (~39 mpg, ~228 g CO2e/mi)
Footprint-based GHG/FE slopes will give different standards for different automakers

Performance by Vehicle Make and Model
Toyota Prius
Toyota Yaris
Toyota Camry Hybrid
Honda Civic Hybrid Smart Fortwo
Toyota CamryHonda Accord
Toyota CorollaHonda Civic
Dodge Charger
Chevy Impala
Ford Es cape Hybrid
Ford F-Series
Chevy Silverado
Dodge Ram
Honda CR-V
Honda Odys sey
Toyota Highlander
100
150
200
250
300
350
400
450
500
10203040506070Rated fuel economy (miles/gallon)
GH
G e
miss
ion
rate
(g C
O 2
e/m
ile)
30 highest selling light truck models 30 highest selling pas senger car models Models achieving overall MY2016 target (35.5 mpg)
35.5 mpg
250 g CO 2 e/mile
Nis san Altima
Ford Focus 26.2 mpg
339 g CO 2e/mile
Sales-weighted average MY2008 light-duty vehicles
• Pay attention to best selling models • Size and weight largely determine performance • Hybrids are an important technology

Europe
World’s First CO2 standards

European Integrated Approach Overall objective to reduce GHG emissions by 20 / 30% by 2020 from
1990 levels. Transportation is Europe’s second largest sector. Integrated Approach
– Vehicle standards – Consumer information (labeling) – Fiscal measures
CO2 regulatory design should be “competitively neutral” and maintain ability of car market to “cater to different consumer needs.” (Regulation EC 443/2009).
130 g/km standard + 10 g/km complimentary measures (technologies and biofuels) by 2015
Eco-innovation to promote measures outside of test procedure. Target - 95 g/km by 2020 with technology review in 2013.
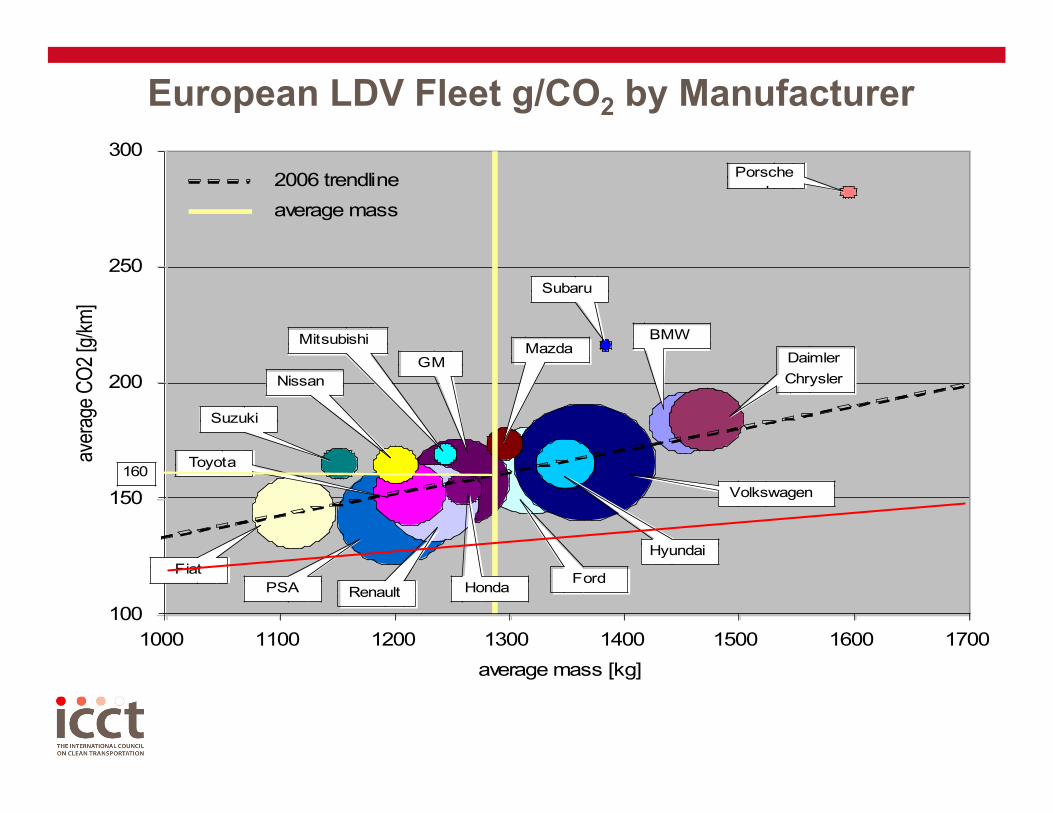
European LDV Fleet g/CO2 by Manufacturer
100
150
200
250
300
1000 1100 1200 1300 1400 1500 1600 1700average mass [kg]
aver
age C
O2 [g
/km]
Fiat
Porschet
Subaru
Suzuki
DaimlerChrysler
BMWMitsubishi
Ford
Mazda
Hyundai
Volkswagen
Nissan
PSA Renault
Toyota
GM
2006 trendlineaverage mass
Honda
160
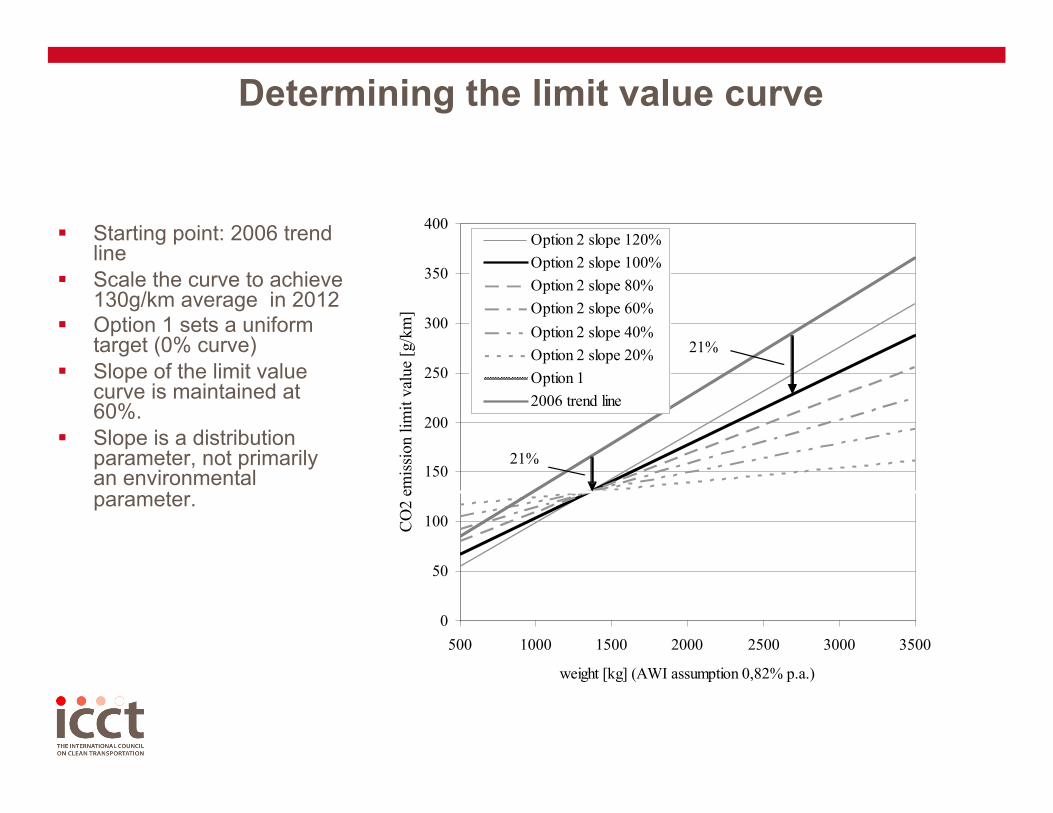
Determining the limit value curve
Starting point: 2006 trend line
Scale the curve to achieve 130g/km average in 2012
Option 1 sets a uniform target (0% curve)
Slope of the limit value curve is maintained at 60%.
Slope is a distribution parameter, not primarily an environmental parameter.
0
50
100
150
200
250
300
350
400
500 1000 1500 2000 2500 3000 3500
weight [kg] (AWI assumption 0,82% p.a.)
CO
2 em
issio
n lim
it va
lue
[g/k
m]
Option 2 slope 120%Option 2 slope 100%Option 2 slope 80%Option 2 slope 60%Option 2 slope 40%Option 2 slope 20%Option 12006 trend line
21%
21%

2020 “Target” of 95 g/km
CO2 from cars: EU reduction
0
20
40
60
80
100
120
140
160
180
200
1995 2000 2005 2010 2015 2020
Ave
rage
em
issi
ons
[g/
km]
0
2
4
6
8
10
12
14
16
18
20
Impr
ovem
ent r
ate
[g/
km p
er y
ear]
7 years

Japan
Top Runner Program to Improve Fuel Economy Of Passenger Vehicles and Commercial Trucks

Japan Top Runner Standards
Kyoto Protocol obligation 6% below 1990 levels. Transportation is 20% of CO2 emissions First standards set in 1999 with modest standards for 2010. In 2004, 80% of petrol vehicles met the 2010 standards, in
part due to supportive green tax policies. In 2005, new standards for 2015 were developed along with
important regulatory changes. – Fuel Neutral: separate standards for petrol and diesel vehicles
were combined into one standard. – Credit trading across all bins: 1999 regulation did not allow
trading across compliance bins, and thus did not promote overachievement.
– New test procedure to reflect real world conditions.

Methodology for Top Runner Fuel Efficiency Standard (Example for one weight class )
Fuel efficiency (km/L)
Sale
s Vol
ume
in J
apan
ese
Mar
ket
Top level
Technology Improvement In the future
Standard value
Improvement toward the top
level
Average
Present Target year for standard value
Standard value is decided by two-step approach.
13

Source:JAMA
Estimated in 1998
Estimated in 1998
Variable valve timing
Penetration Rates of Efficiency Technologies To Meet the 2010 Standards

12 Source:METI, MLIT
Average Fuel Efficiency 2015 Targets for Vehicles
Passenger cars
Commercial
Vehicles
(GVW≦3.5t)
Buses (11passengers< & GVW≦2.5t)
Target :
Target :
Target :
2004 Performance :
2004 Performance :
2004 Performance : 8.3km/ℓ
Improvement rate 23.5%
Improvement rate 12.6%
Improvement rate 7.2%
Calculated on the basis of weighted average values of fuel economy performance for the respective vehicle weight categories, assuming the same respective shipment volume ratios for 2015 as those recorded in 2004.

Global Perspective and
Lessons Learned
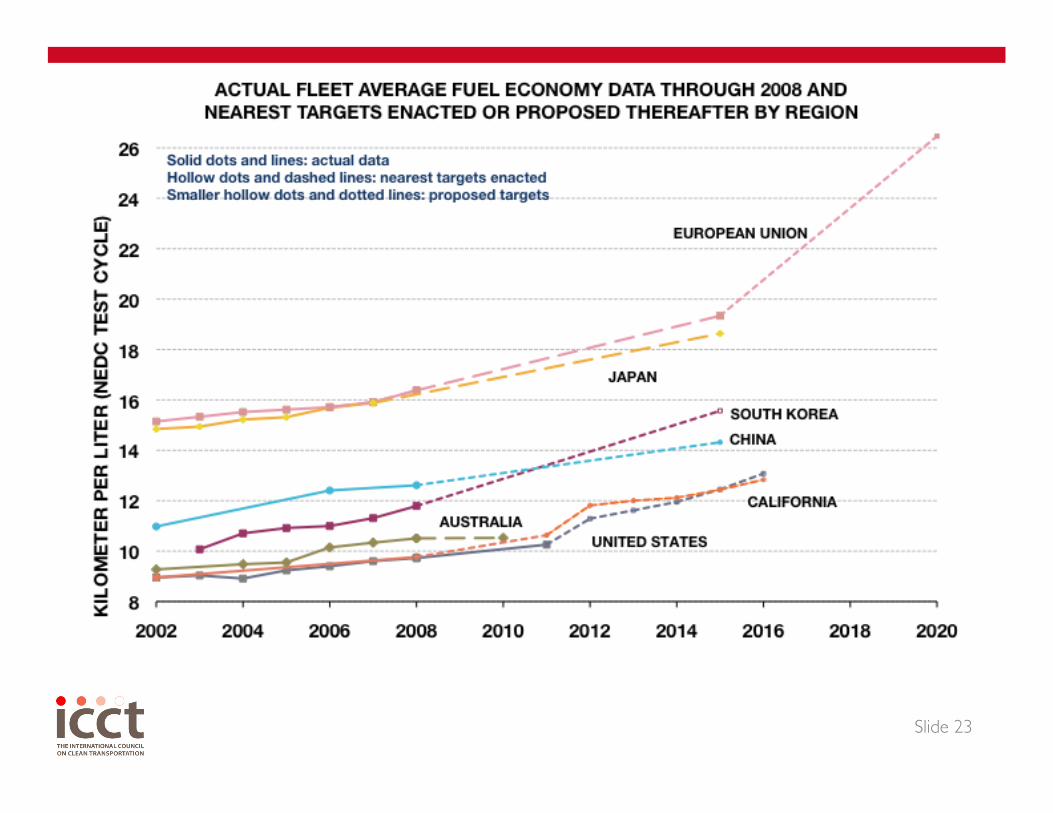
Slide 23

24
Differences in US, EU and Japan Fleets
Attribute Japan Europe U.S.
Vehicle weight (kg) 1245 1334 1875
Engine size (L) 1.5 1.7 3.3
Vehicle size (m2) - - 4.5
Fuel economy (km/L) 17.3 17.2 11.1

25
Technology Differences: U.S. and Mexico U.S and Mexico fleets are similar in size and fuel economy
– But, for 2008 vehicles, there are several notable technology differences…
Technology/variable Mexico United States
Fuel economy (km/L) 11.8 11.1
Vehicle footprint size (m2) 4.0 4.5
Engine size (cylinders / displacement) 4.6 / 2.4L 5.6 / 3.3L
Engine
Specific power (kW/L) 49.1 50.0 Percent 4 valves/cylinder 68% 74% Variable valve timing/lift 20% 53% Cylinder deactivation 0.3% 6% Direct injection gasoline 0.3% 4%
Transmission Auto/manual 57%/43% 95%/5% 6+ gears 9% 21% Continuously variable (CVT) 2% 8%
Percent hybrids 0.03% 2.2%
Percent diesels 3% 0.1%
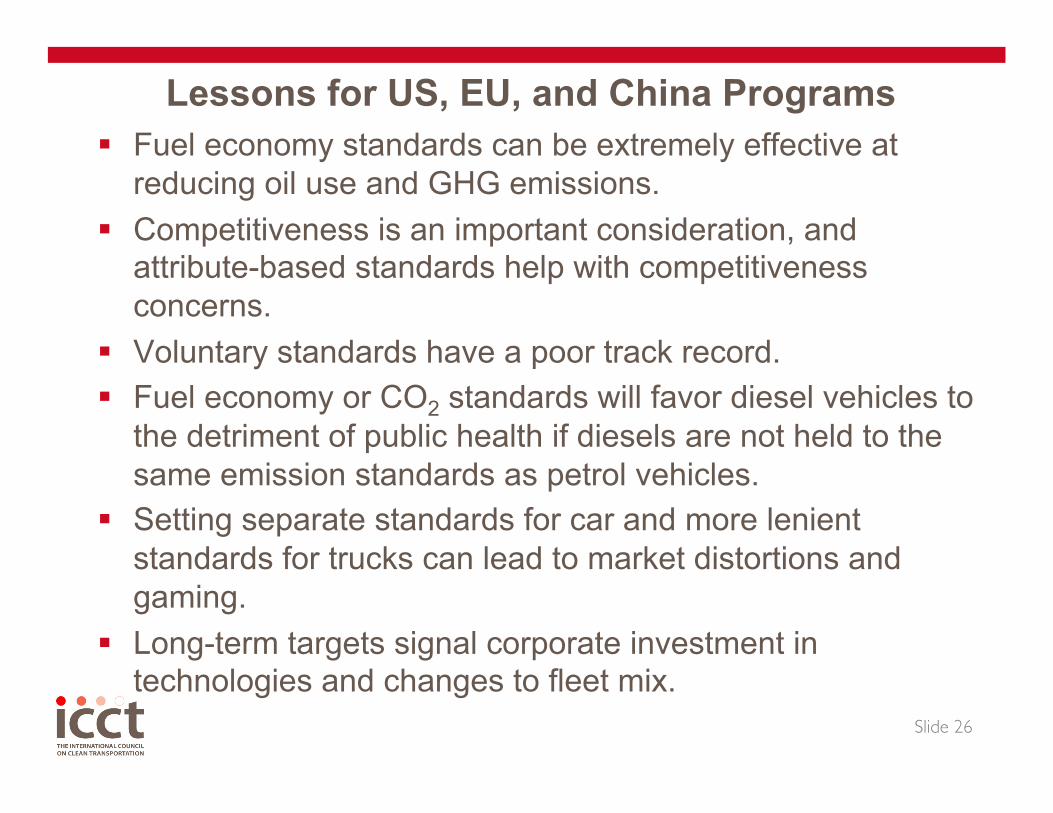
Lessons for US, EU, and China Programs Fuel economy standards can be extremely effective at
reducing oil use and GHG emissions. Competitiveness is an important consideration, and
attribute-based standards help with competitiveness concerns.
Voluntary standards have a poor track record. Fuel economy or CO2 standards will favor diesel vehicles to
the detriment of public health if diesels are not held to the same emission standards as petrol vehicles.
Setting separate standards for car and more lenient standards for trucks can lead to market distortions and gaming.
Long-term targets signal corporate investment in technologies and changes to fleet mix.
Slide 26

Slide 27
Drew Kodjak
International Council on Clean Transportation (ICCT) 1225 Eye St. NW
Suite 900 Washington D.C. 20005


