International Journal for the Scholarship of Teaching and Learning Volume 8 | Number 2 Article 15 July 2014 Time Efficiency, Wrien Feedback, and Student Achievement in Inquiry-Oriented Biology Labs John M. Basey University of Colorado at Boulder, [email protected]Anastasia P. Maines University of Colorado at Boulder, [email protected]Clinton D. Francis California Polytechnic State University, [email protected]Recommended Citation Basey, John M.; Maines, Anastasia P.; and Francis, Clinton D. (2014) "Time Efficiency, Wrien Feedback, and Student Achievement in Inquiry-Oriented Biology Labs," International Journal for the Scholarship of Teaching and Learning: Vol. 8: No. 2, Article 15. Available at: hps://doi.org/10.20429/ijsotl.2014.080215
Transcript
International Journal for the Scholarship ofTeaching and Learning
Volume 8 | Number 2 Article 15
July 2014
Time Efficiency, Written Feedback, and StudentAchievement in Inquiry-Oriented Biology LabsJohn M. BaseyUniversity of Colorado at Boulder, [email protected]
Anastasia P. MainesUniversity of Colorado at Boulder, [email protected]
Clinton D. FrancisCalifornia Polytechnic State University, [email protected]
Recommended CitationBasey, John M.; Maines, Anastasia P.; and Francis, Clinton D. (2014) "Time Efficiency, Written Feedback, and Student Achievement inInquiry-Oriented Biology Labs," International Journal for the Scholarship of Teaching and Learning: Vol. 8: No. 2, Article 15.Available at: https://doi.org/10.20429/ijsotl.2014.080215
Time Efficiency, Written Feedback, and Student Achievement in Inquiry-Oriented Biology Labs
AbstractWe examined how different styles of written feedback by graduate-student teaching assistants (GTAs) incollege intro biology lab (USA) influenced student achievement and related the different styles to timeefficiency. We quantified GTA feedback on formative lab reports and student achievement on two differenttypes of assessments, a quiz in 2010 and a summative lab report in 2011. We evaluated the extent to whichthree categories of written feedback impacted student achievement (grade discrepancy between actual andideal, short direct comments, and in-depth explanatory comments). Student achievement was best explainedby both grade discrepancy and short direct comments in 2010 and grade discrepancy only in 2011. In-depthexplanations were not part of the best-fit models in either year. Results also indicated that GTAs provided littleencouraging feedback, most feedback was targeted and asked students to expand on explanations. Results arediscussed in relation to relative time efficiency and GTA training.
Keywordsscience education, feedback, evaluation, science teaching, and educational research
Cover Page FootnoteFunding was provided by the President’s Teaching and Learning Collaborative and the integrating STEM(iSTEM) Education Initiative. CDF was supported by the University of Colorado Graduate School and theNational Evolutionary Synthesis Center (NESCent; NSF #EF-0905606). We also thank the ScienceEducation Initiative, and the various graduate students and undergraduates who participated in this project.
Introduction
In recent years, the push in science education to move from teacher-centered instruction to student-centered instruction has
increased the prevalence of write-to-learn educational strategies as exemplified by the well-documented and well-used “Science
Writing Heuristic” (Keys et al. 1999, Poock et al. 2007). Going hand-in-hand with this transformation is the importance of
written feedback. In a recent review of assessment feedback Li and De Luca (2012) found limited studies addressing actual
feedback practices in higher education and due to discipline specific variations, they advocated that more studies on
feedback are needed especially in diverse disciplines. Biology is a field in higher education that often uses write-to-learn
pedagogies especially in the lab setting. In the United States (USA) large universities rely on
graduate-student teaching assistants (GTAs) to instruct the
laboratory (lab) component of large introductory science classes, and biology is no exception (Luft et al. 2004; Kendall and
Schussler 2012). For introductory biology labs, Sundberg et al. (2005) estimated that 91% of the sections at research
universities were taught by GTAs. For instance, in the fall semester 2013 at the University of Colorado at Boulder (CU) in
the Department of Ecology and Evolutionary Biology all 57 sections of introductory biology lab were taught by GTAs and
68% were first-time GTAs. In addition to their lack of experience, GTA’s are also limited on the time they can invest in
their teaching. The most common expectation is 20 hours per week. Thus to improve student learning, information on the
benefits of various types of GTA feedback relative to the cost in time efficiency (i.e. student learning per time invested by GTA)
can be extremely valuable.
Research has indicated written feedback provided in a timely manner has great potential to influence student learning
(Huxham 2007, Hattie and Timperley 2007, Ambrose et al. 2010). However, written feedback is highly time intensive and
may not substantially improve student achievement (Crisp 2007). Voelkel and Mello (2014) compared the effectiveness of
written feedback and auditory feedback in a write-to-learn module of undergraduate comparative animal physiology in the
1
IJ-SoTL, Vol. 8 [2014], No. 2, Art. 15
https://doi.org/10.20429/ijsotl.2014.080215
UK. They found that students preferred auditory feedback to
written feedback, but written feedback was significantly less time intensive for the instructor. They also found that neither written
nor auditory feedback on the formative assessments improved student performance on the subsequent summative assessment.
In Australia, Lizzio and Wilson (2008), gathered data from undergraduate students in several disciplines concerning their
perceptions of helpful and unhelpful written feedback. A factor analysis revealed three dimensions of helpful feedback:
developmental, encouraging and fair. In this study we focused on developmental and encouraging feedback.
Providing students with an understanding of the performance gap between the actual performance and the ideal
performance expected by the assessor is of key importance in developmental feedback (DeNisi and Kluger 2000). The most
common way to inform students of this gap is through a grade or
some numerical evaluation of how close a student came to the ideal performance. Outside grades is a continuum of written
feedback ranging from short words and statements to lengthier in-depth explanations that may be several sentences to
paragraphs in length. Thus, there are several potential strategies instructors can utilize for written feedback that take
considerably different time investments by instructors. Table 1 shows the assumed relationship between four
strategies of written feedback as they relate to overall time investment. In this study, we examined three questions.
2
Time Efficiency, Written Feedback, and Student Achievement in Biology Labs
https://doi.org/10.20429/ijsotl.2014.080215
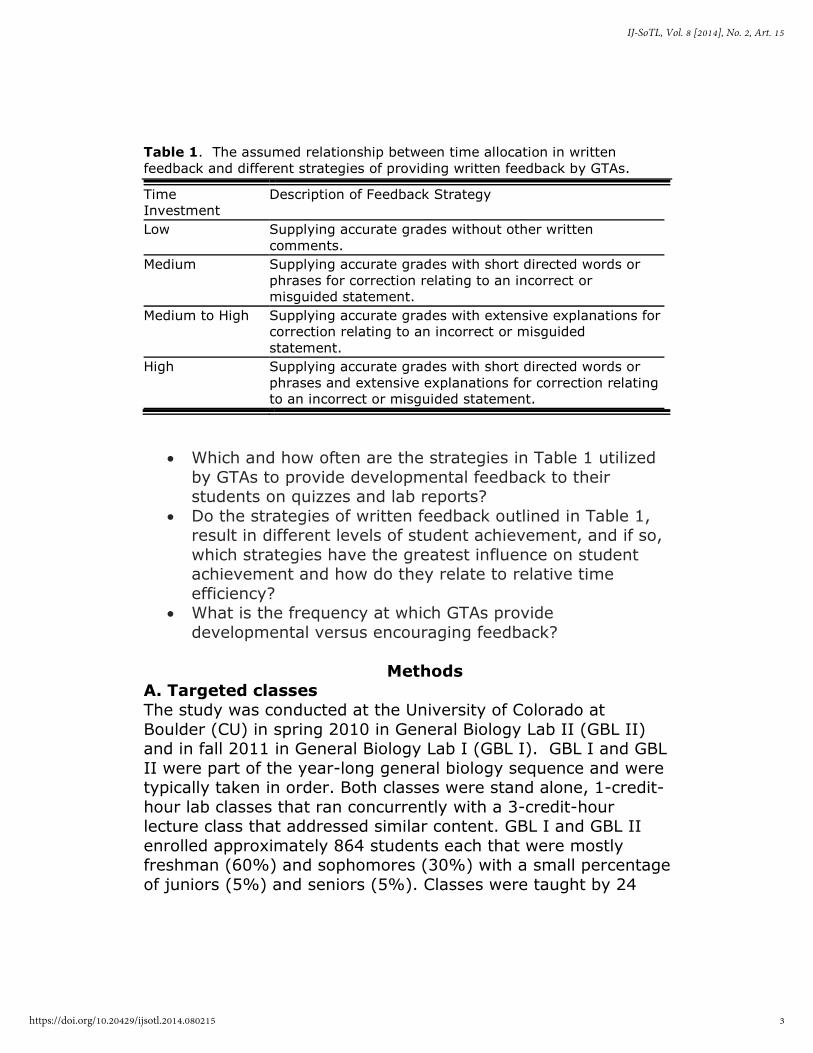
Table 1. The assumed relationship between time allocation in written
feedback and different strategies of providing written feedback by GTAs.
Time
Investment
Description of Feedback Strategy
Low
Supplying accurate grades without other written
comments.
Medium
Supplying accurate grades with short directed words or
phrases for correction relating to an incorrect or
misguided statement.
Medium to High
Supplying accurate grades with extensive explanations for
correction relating to an incorrect or misguided
statement.
High
Supplying accurate grades with short directed words or
phrases and extensive explanations for correction relating
to an incorrect or misguided statement.
• Which and how often are the strategies in Table 1 utilized
by GTAs to provide developmental feedback to their students on quizzes and lab reports?
• Do the strategies of written feedback outlined in Table 1, result in different levels of student achievement, and if so,
which strategies have the greatest influence on student achievement and how do they relate to relative time
efficiency? • What is the frequency at which GTAs provide
developmental versus encouraging feedback?
Methods A. Targeted classes
The study was conducted at the University of Colorado at
Boulder (CU) in spring 2010 in General Biology Lab II (GBL II) and in fall 2011 in General Biology Lab I (GBL I). GBL I and GBL
II were part of the year-long general biology sequence and were typically taken in order. Both classes were stand alone, 1-credit-
hour lab classes that ran concurrently with a 3-credit-hour lecture class that addressed similar content. GBL I and GBL II
enrolled approximately 864 students each that were mostly freshman (60%) and sophomores (30%) with a small percentage
of juniors (5%) and seniors (5%). Classes were taught by 24
3
IJ-SoTL, Vol. 8 [2014], No. 2, Art. 15
https://doi.org/10.20429/ijsotl.2014.080215
GTAs who facilitated two lab sections each that had up to 18
students. In GBL I, students participated in a series of inquiry-oriented experimental labs that culminated in an open-ended
research-based student-project. GBLII was comprised of a mix of experimental and non-experimental labs.
B. Research design for spring 2010 in GBL II
In GBL II, a substantial part of the semester covers biodiversity. Biodiversity labs are hands-on, non-experimental experiences
with the following targeted learning goals.
• Compare and contrast life cycles of various groups of organisms.
• Use evidence to defend the contention that a group of organisms (plants or animals) began in water and radiated
to land.
• Justify how the current diversity of a particular group can be explained by evolution through natural selection using
specific examples examined in lab.
We focused our study on the plant biodiversity lab. Two formative labs covering biodiversity of unicellular/colonial
eukaryotes and animals were completed prior to the lab on plant biodiversity. During each lab, students filled out a lab report;
the GTA graded the lab report and provided written feedback (formative assessments). One week following the plant
biodiversity lab, students were evaluated with a practical short-answer quiz comprised of five stations. Three stations assessed
using Bloom’s lower-order foundational information and two stations assessed using Bloom’s higher-order integration
extending from the foundation.
Quizzes from participating students with grades and comments from participating GTAs were photocopied. Two of the
authors in this study, JMB and APM, re-graded the quizzes with a rubric. The two researchers started by independently re-grading
the same 30 quizzes. Re-grades were compared on each question with a t-test and no significant differences in re-grading
were present on any of the questions (all, P > 0.05). The remaining quizzes were re-graded in an identical manner to the
4
Time Efficiency, Written Feedback, and Student Achievement in Biology Labs
https://doi.org/10.20429/ijsotl.2014.080215
first 30 except no t-test comparisons were performed.
Comments were then coded by JMB (see subsection D). Nineteen GTAs participated and the # of students/GTA ranged from 25 -
35 with an average of 30 students/GTA. The GTAs consisted of 15 females and 4 males with 11 having one semester of teaching
experience at CU and 8 with more than one semester of teaching experience at CU.
C. Research design for fall 2011 in GBL I
In GBL I, one overarching set of learning goals relates to science process skills. In this study we targeted one of these learning
goals.
• Describe the evidence associated with an investigation and explain how the evidence from the investigation relates to
the hypothesis(es).
Early in the semester, students completed 3 guided inquiry
lab investigations that all had a formative assessment question addressing the learning goal. In all three labs, GTAs graded the
assessments and provided comments. Following the 3 practice events, students derived and designed their own investigations
that had a summative assessment question addressing the same learning goal. Assessments of participating students from the
first formative lab and the student project lab (summative) with grades and comments from participating GTAs were
photocopied. The photocopies were re-graded and feedback was coded by JMB. Eighteen GTAs participated and the # of
students/GTA ranged from 17 - 36 with an average of 30 students/GTA. The GTAs consisted of 13 females and 5 males
with 10 having no prior teaching experience at CU and 8 with
more than 1 semester of teaching experience at CU.
D. Coding feedback from GTAs Written feedback was first delineated as encouraging or
developmental. Encouraging feedback referred to some aspect of the student discussion that was completed well. Encouraging
comments were coded as either vague or specific. Vague encouraging comments were not directed to any specific aspect
5
IJ-SoTL, Vol. 8 [2014], No. 2, Art. 15
https://doi.org/10.20429/ijsotl.2014.080215
of the answer. An example is “Great job!” written adjacent to the
answer. Specific encouraging comments were directed at some aspect of the answer that was completed particularly well either
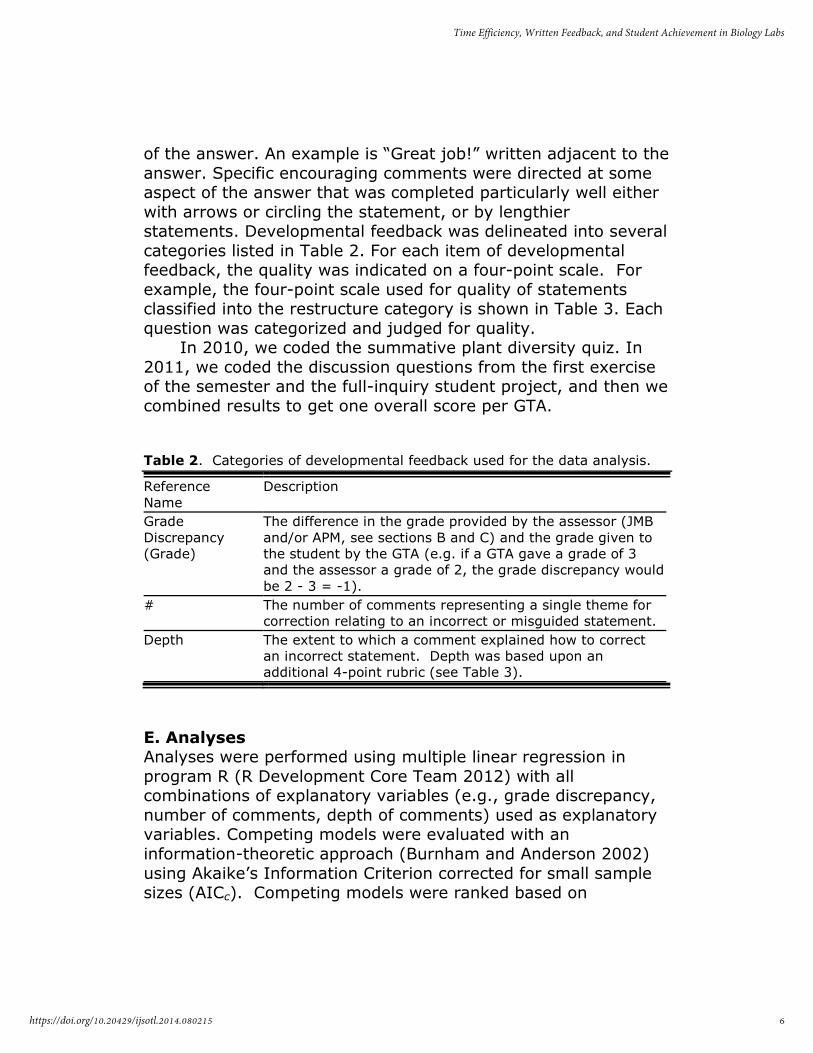
with arrows or circling the statement, or by lengthier statements. Developmental feedback was delineated into several
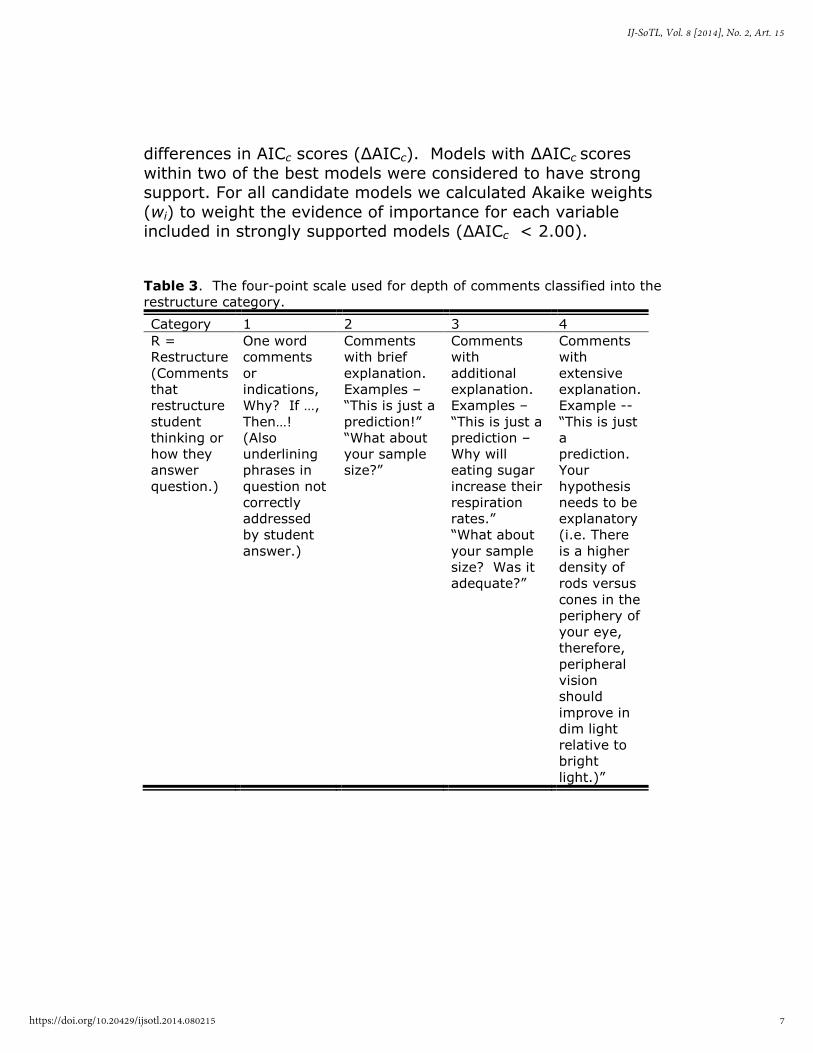
categories listed in Table 2. For each item of developmental feedback, the quality was indicated on a four-point scale. For
example, the four-point scale used for quality of statements classified into the restructure category is shown in Table 3. Each
question was categorized and judged for quality. In 2010, we coded the summative plant diversity quiz. In
2011, we coded the discussion questions from the first exercise of the semester and the full-inquiry student project, and then we
combined results to get one overall score per GTA.
Table 2. Categories of developmental feedback used for the data analysis.
Reference
Name
Description
Grade
Discrepancy
(Grade)
The difference in the grade provided by the assessor (JMB
and/or APM, see sections B and C) and the grade given to
the student by the GTA (e.g. if a GTA gave a grade of 3
and the assessor a grade of 2, the grade discrepancy would
be 2 - 3 = -1).
#
The number of comments representing a single theme for
correction relating to an incorrect or misguided statement.
Depth
The extent to which a comment explained how to correct
an incorrect statement. Depth was based upon an
additional 4-point rubric (see Table 3).
E. Analyses Analyses were performed using multiple linear regression in
program R (R Development Core Team 2012) with all combinations of explanatory variables (e.g., grade discrepancy,
number of comments, depth of comments) used as explanatory variables. Competing models were evaluated with an
information-theoretic approach (Burnham and Anderson 2002)
using Akaike’s Information Criterion corrected for small sample sizes (AICc). Competing models were ranked based on
6
Time Efficiency, Written Feedback, and Student Achievement in Biology Labs
https://doi.org/10.20429/ijsotl.2014.080215
differences in AICc scores (∆AICc). Models with ∆AICc scores
within two of the best models were considered to have strong support. For all candidate models we calculated Akaike weights
(wi) to weight the evidence of importance for each variable included in strongly supported models (∆AICc < 2.00).
Table 3. The four-point scale used for depth of comments classified into the
restructure category.
Category 1 2 3 4
R =
Restructure
(Comments
that
restructure
student
thinking or
how they
answer
question.)
One word
comments
or
indications,
Why? If …,
Then…!
(Also
underlining
phrases in
question not
correctly
addressed
by student
answer.)
Comments
with brief
explanation.
Examples –
“This is just a
prediction!”
“What about
your sample
size?”
Comments
with
additional
explanation.
Examples –
“This is just a
prediction –
Why will
eating sugar
increase their
respiration
rates.”
“What about
your sample
size? Was it
adequate?”
Comments
with
extensive
explanation.
Example --
“This is just
a
prediction.
Your
hypothesis
needs to be
explanatory
(i.e. There
is a higher
density of
rods versus
cones in the
periphery of
your eye,
therefore,
peripheral
vision
should
improve in
dim light
relative to
bright
light.)”
7
IJ-SoTL, Vol. 8 [2014], No. 2, Art. 15
https://doi.org/10.20429/ijsotl.2014.080215
Results A. How does the variation in written feedback
differentially impact student achievement? The grade discrepancy, number of comments and depth of
comments were highly variable, and the number of comments and depth of comments were different for the quiz than they
were for the lab report (Χ2 = 791, d.f. = 5, P < 0.001, Figure 1).
A high proportion of GTAs did not put any comments on the quiz
in 2010 other than a grade and the depth of comments tended to be concise and specific relative to the depth of comments on
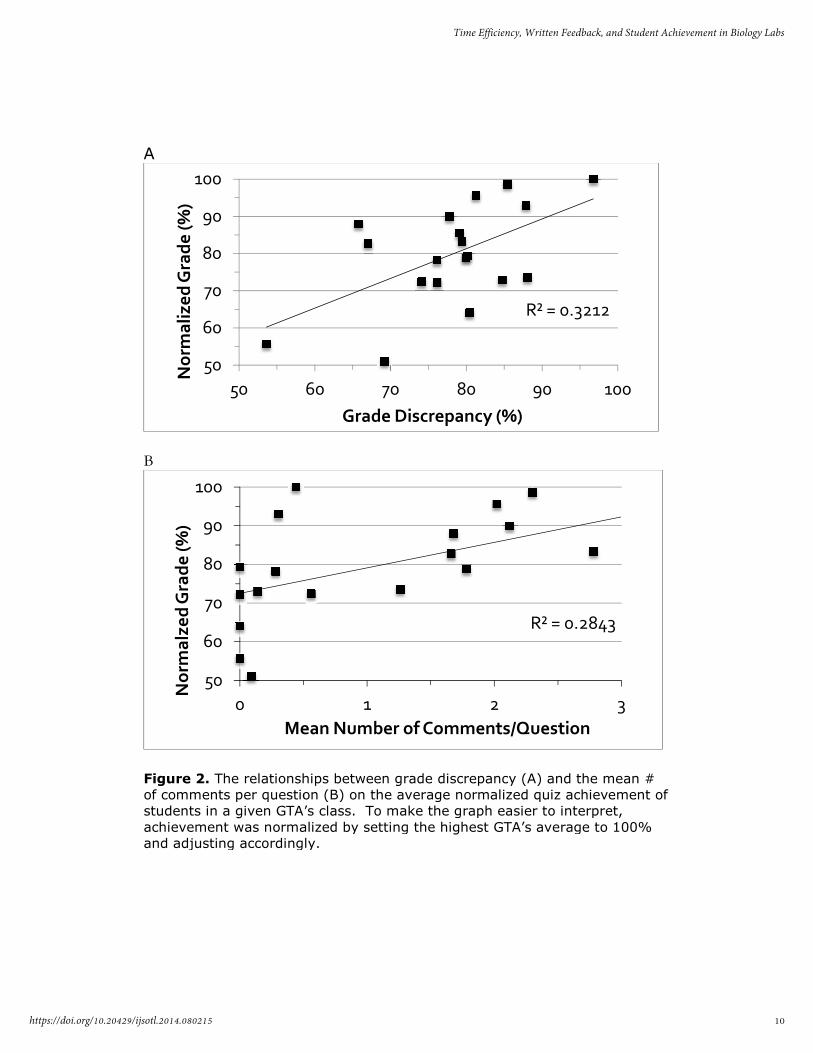
the lab report in 2011 (Figure 1). In 2010, an analysis of all of the developmental
explanatory variables (grade discrepancy, number of comments, depth of comments, and number times depth) and their effects
on students’ achievement for the practical quiz on plant
biodiversity indicated that the best-fit model only included grade discrepancy and number of comments (Table 4). Neither depth
nor the combination of depth and number of comments were parts of any models competing with the best-fit model (∆AICc >
2.00). A multiple regression analysis with quiz achievement as the dependent variable and grade discrepancy and number of
comments as independent variables indicated that both independent variables had a significant effect on the quiz
achievement (grade discrepancy, P = 0.006; number of comments, P = 0.010), with a substantial percentage of the
variance in grade explained by the model (multiple adjusted R2 = 0.5032, Figure 2).
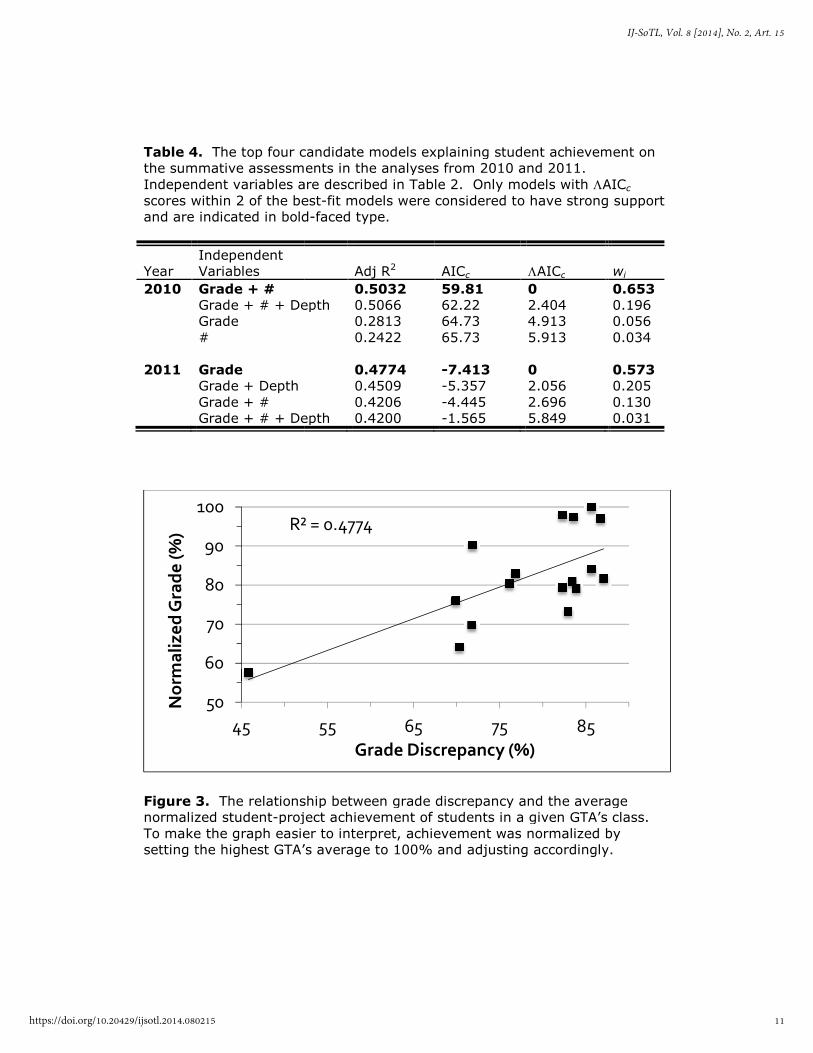
In 2011, the analysis of the explanatory variables and their impacts on the achievement for the summative student project
lab report indicated that the best-fit model only included grade
discrepancy (Table 4). The number of comments, the depth of comments or the combination of number and depth were parts
of any models competing with the best-fit model (∆AICc > 2.00). The best-fit model, with grade discrepancy as the
independent variable revealed a significant effect by grade discrepancy on the student project lab report achievement score
(P = 0.002), with a substantial percentage of the variance in
8
Time Efficiency, Written Feedback, and Student Achievement in Biology Labs
https://doi.org/10.20429/ijsotl.2014.080215
achievement score explained by the model (multiple adjusted
= 0.4774, Figure 3).
A
B
C
Figure 1. The distributions of grade discrepancy (A), mean number of
comments per question (B), and mean explanatory depth of feedback per
comment (C) for GTAs for the quiz in 2010 and lab reports in 2011.
0
2
4
6
8
< 70 70-
Nu
mb
er o
f G
TA
s
Grade Discrepancy (%)
0
5
10
0-0.5
Nu
mb
er o
f G
TA
s
Mean # of Comments /Question
0
2
4
6
8
0-0.3 0.3
Nu
mb
er o
f G
TA
s
Mean Explanatory Depth/Comment
explained by the model (multiple adjusted
).
The distributions of grade discrepancy (A), mean number of
comments per question (B), and mean explanatory depth of feedback per
comment (C) for GTAs for the quiz in 2010 and lab reports in 2011.
-75 75-80 80-85 85-90 >90
Grade Discrepancy (%)
0.5-1 1-1.5 1.5-2 >2
Mean # of Comments /Question
0.3-0.6 0.6-1.2 1.2-1.5 >1.5
Mean Explanatory Depth/Comment
explained by the model (multiple adjusted R2
The distributions of grade discrepancy (A), mean number of
comments per question (B), and mean explanatory depth of feedback per
2010
2011
2010
2011
2010
2011
9
IJ-SoTL, Vol. 8 [2014], No. 2, Art. 15
https://doi.org/10.20429/ijsotl.2014.080215
A
B
Figure 2. The relationships between grade discrepancy (A) and the
of comments per question
students in a given GTA’
achievement was normalized by setting the hi
and adjusting accordingly.
50
60
70
80
90
100
50
No
rma
lize
d G
rad
e (
%)
50
60
70
80
90
100
0
No
rma
lze
d G
rad
e (
%)
Mean Number of Comments/Question
The relationships between grade discrepancy (A) and the mean
per question (B) on the average normalized quiz achievement of
’s class. To make the graph easier to interpret,
achievement was normalized by setting the highest GTA’s average to 100%
and adjusting accordingly.
R² = 0.3212
60 70 80 90 100
Grade Discrepancy (%)
R² = 0.2843
1 2
Mean Number of Comments/Question
mean #
(B) on the average normalized quiz achievement of
s class. To make the graph easier to interpret,
s average to 100%
R² = 0.3212
100
R² = 0.2843
3
10
Time Efficiency, Written Feedback, and Student Achievement in Biology Labs
https://doi.org/10.20429/ijsotl.2014.080215
Table 4. The top four candidate models explaining student achievement on
the summative assessments in the analyses from 2010 and 2011.
Independent variables are described in Table 2. Only models
scores within 2 of the best
and are indicated in bold
Year
Independent
Variables
2010 Grade + #
Grade + # + Depth
Grade
#
2011
Grade
Grade + Depth
Grade + #
Grade + # + Depth
Figure 3. The relationship between grade discrepancy and the average
normalized student-project achievement of students in a given GTA
To make the graph easier to interpret, achievement was normalized by
setting the highest GTA’
R² = 0.4774
50
60
70
80
90
100
45
No
rma
lize
d G
rad
e (
%)
The top four candidate models explaining student achievement on
the summative assessments in the analyses from 2010 and 2011.
Independent variables are described in Table 2. Only models with ΛAIC
scores within 2 of the best-fit models were considered to have strong support
and are indicated in bold-faced type.
Adj R2
AICc
ΛAICc
Grade + # + Depth
0.5032
0.5066
0.2813
0.2422
59.81
62.22
64.73
65.73
0
2.404
4.913
5.913
Grade + # + Depth
0.4774
0.4509
0.4206
0.4200
-7.413
-5.357
-4.445
-1.565
0
2.056
2.696
5.849
The relationship between grade discrepancy and the average
project achievement of students in a given GTA’s class.
To make the graph easier to interpret, achievement was normalized by
’s average to 100% and adjusting accordingly.
R² = 0.4774
55 65 75 85
Grade Discrepancy (%)
The top four candidate models explaining student achievement on
AICc
fit models were considered to have strong support
wi
0.653
0.196
0.056
0.034
0.573
0.205
0.130
0.031
The relationship between grade discrepancy and the average
s class.
To make the graph easier to interpret, achievement was normalized by
sting accordingly.
11
IJ-SoTL, Vol. 8 [2014], No. 2, Art. 15
https://doi.org/10.20429/ijsotl.2014.080215
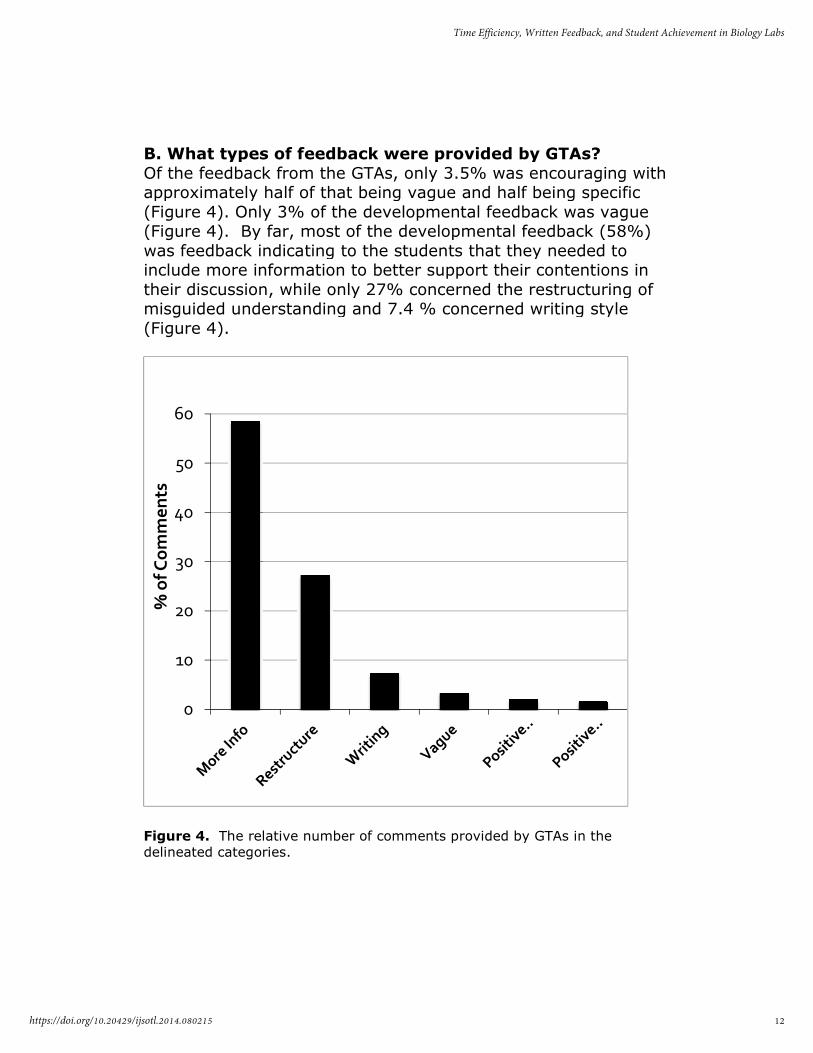
B. What types of feedback were provided by GTAs?
Of the feedback from the GTAs, only 3.5% was encouraging with approximately half of that being vague a
(Figure 4). Only 3% of the developmen(Figure 4). By far, most of the developmental feedback (58%)
was feedback indicating to the students that they needed to include more information to better support their contentions in
their discussion, while only 27% concerned the restructuring of misguided understanding and 7.4 % c
(Figure 4).
Figure 4. The relative number of comments provided by GTAs in the
delineated categories.
0
10
20
30
40
50
60
% o
f C
om
me
nts
. What types of feedback were provided by GTAs?
Of the feedback from the GTAs, only 3.5% was encouraging with approximately half of that being vague and half being specific
). Only 3% of the developmental feedback was vague). By far, most of the developmental feedback (58%)
was feedback indicating to the students that they needed to include more information to better support their contentions in
their discussion, while only 27% concerned the restructuring of ided understanding and 7.4 % concerned writing style
The relative number of comments provided by GTAs in the
Of the feedback from the GTAs, only 3.5% was encouraging with nd half being specific
tal feedback was vague ). By far, most of the developmental feedback (58%)
was feedback indicating to the students that they needed to include more information to better support their contentions in
their discussion, while only 27% concerned the restructuring of oncerned writing style
The relative number of comments provided by GTAs in the
12
Time Efficiency, Written Feedback, and Student Achievement in Biology Labs
https://doi.org/10.20429/ijsotl.2014.080215
Discussion
A. Did written feedback improve student achievement? Crisp (2007) questioned whether the effect of formative written
feedback on student summative achievement was worth the extensive time required for the written feedback. Results of this
study show that written feedback from GTAs in introductory biology labs had differential impacts depending on the form of
the feedback. Lengthy explanatory written feedback was not a part of the best-fit model for the summative quiz or the lab
report, while correctness in providing students a grade that matched the ideal was a part of the best-fit model for both the
summative quiz and lab report (Table 4). In addition, for the quiz numerous short and specific comments were also a part of
the best-fit model. These results are consistent with literature. Ambrose et al. (2010) contend that too much feedback is
problematic for students and can have a negative impact on
learning. According to Hattie and Timperley (2007), a key to effective feedback is to “reduce the discrepancy between current
and desired understanding”. A grade is basically informing the students how far they are from the ideal answer and the more
accurately GTAs informed students of the discrepancy the better students performed.
One confounding element in this analysis is that we did not quantify or observe non-written feedback. Non-quantified in-
class observations indicate that GTAs differentially provide verbal feedback during lab time. Some GTAs thoroughly review quizzes
and lab reports while others do not. Theoretically, the variability in verbal feedback could decrease the ability of this study design
to discern strategies that would be incorporated into a best-fit model. Thus, it is possible that if other forms of feedback were
factored out, the parameters examined could have had a greater
impact than that seen in this study. However, we argue that the opposite would not be true and the results of this study likely
represent the most effective strategies demonstrating a positive effect on student achievement.
B. How do feedback strategies relate to time efficiency?
For this study time efficiency is defined as student learning per time invested in written feedback from the GTA. One limitation
13
IJ-SoTL, Vol. 8 [2014], No. 2, Art. 15
https://doi.org/10.20429/ijsotl.2014.080215
of this study is that we never quantified the time investment for
different strategies of written feedback. Instead we used a logical argument to infer time investment for the various
strategies (Table 1). It is possible that accurate grading plus some form of commentary occupied more time than haphazard
grading plus a greater quantity of commentary. However, it is most likely that the category of number times quality in Table 1
represents the most time consuming strategy and grade discrepancy represents the least time consuming strategy since
all GTAs were required to assign a grade. One of the most simplistic models of time efficiency related
to feedback would be one of a positive linear association of written feedback and student achievement. It follows that if
overall time investment in feedback relates directly to learning, the best-fit model in this study should have been the model
incorporating correctness and number times quality of
comments, and the least effective model should have been the null model followed by a sole model of correctness in grading
(Table 1). For written lab reports, the results of this study indicate that the most time efficient strategy was supplying an
accurate grade without other written comments. For quizzes the most time efficient form of feedback was not as clear. The
results of this study indicated two potential strategies: an accurate grade with many short but specific words or comments,
or just an accurate grade depending on the time discrepancy of adding brief commentary versus the amount of help the
comments provided (Figures 3a and 3b). More research is needed that quantifies the time commitment by GTAs in
providing written comments as well as learning gains. Science education literature indicates other potential
methods of providing written feedback in biology classes.
Huxham (2007) categorized the written feedback addressed in this research as “personal comments”. Huxham (2007)
compared feedback in the form of personal comments to feedback in the form of model papers in two non-lab biology
courses and found on the summative assessment that students receiving the formative model papers significantly outperformed
the students who received the formative personal comments. Huxham (2007) also found that students preferred personal
14
Time Efficiency, Written Feedback, and Student Achievement in Biology Labs
https://doi.org/10.20429/ijsotl.2014.080215
comments to model papers. Although Huxham (2007) did not
quantify time allocation for the two different methods, model papers should be less time consuming than personal comments
because all students receive a single set of model papers that can be distributed all at once.
C. Training GTAs with limited training time.
Prior to teaching their first classes, GTAs at large universities in the USA have one to two weeks to be trained (Burke, et al.,
2005). If a GTAs’ first experience teaching is negative, he/she may not pursue science teaching as a future career or may elect
to focus on research. Recruitment and retention, especially of women in science, is an important consideration (Shen, 2013)
and research shows that GTA teaching experience improves their research skills (Feldon, et al., 2011). A key component for
success of these novice GTAs is training (French, & Russel,
2002; Roerig, et al., 2003; Luft, et al., 2004; Burke, et al., 2005). Due to the limited available time to train GTAs prior to
their first teaching experience, information on costs and benefits of different aspects of GTA training and their impacts on student
learning as well as student attitudes towards their GTAs can be extremely informative. Results of this study can also be used to
inform training policies for these first-time GTAs. Research has indicated that feedback is most effective
when it is targeted towards learning goals and it is specific (Hattie and Timperley 2007). Results of this study indicate that
approximately 92% of the overall feedback by the GTAs was targeted and specific. From a meta-analysis, Kluger and DeNisi
(1996) indicated that the most effective feedback was encouraging and highlighted correct aspects of performance.
Results of this study indicated that only 1.6% of the feedback
from GTAs was encouraging and specific (Figure 1). Aside from grades, most of the developmental feedback
from GTAs involved informing the students that they needed to include more information to support contentions in their
evidence-based discussions or answers to quiz questions. For the lab reports in 2011, the key question analyzed was a full
discussion of the students’ experimental results and evidence-based conclusions. In the formative lab reports, students were
15
IJ-SoTL, Vol. 8 [2014], No. 2, Art. 15
https://doi.org/10.20429/ijsotl.2014.080215
provided with guidance on how to answer the discussion
questions and what components to include, but the summative assessment was more open-ended and did not provide specific
details on what to include. This indicates that students likely commonly left out vital pieces of available information in making
their evidence-based arguments. Thus, to improve student achievement, a larger investment in educating the students
about evidence-based argumentation at the beginning of the semester may be a successful strategy.
C. Educational Implications
Large introductory science classes at universities have a tendency to be taught by GTAs who often have minimal teaching
experience, limited training time prior to their first teaching encounter, and limited time overall. Results of this study
indicate that GTAs may be able to save time by foregoing
extensive written feedback by accurately grading student work and providing short specific comments, then enhance the
feedback with more efficient forms of feedback such as model papers. Beyond the situation-specific implications, lab
instructors in general may want to consider results of this study in determining how they provide feedback to students on lab
reports and quizzes. In addition, lab coordinators who train these first-time
GTAs often must make difficult decisions on how to train these GTAs. Results of this study indicate that these novice GTAs are
doing fairly well at providing specific feedback directed toward the learning goals, but do a poor job at indicating specific
components of excellent work (praise) In addition, assessing student work and indicating quality with a grade had the
greatest impact on student achievement. Therefore, a workshop
on assessing and grading, and the production of a more extensive rubric for the GTAs may be a better use of the limited
available training time than a workshop completely devoted to written feedback.
Overall, educators should recognize that these results are preliminary and more research is required to expand on and to
verify these results.
16
Time Efficiency, Written Feedback, and Student Achievement in Biology Labs
https://doi.org/10.20429/ijsotl.2014.080215
Acknowledgements
Funding was provided by the President’s Teaching and Learning Collaborative and the Integrating STEM (iSTEM) Education
Initiative. CDF was supported by the University of Colorado Graduate School and the National Evolutionary Synthesis Center
(NESCent; NSF #EF-0905606). We also thank the Science Education Initiative, and the various graduate students and
undergraduates who participated in this project.
References Ambrose, S. A., Bridges, M., DiPietro, M., Lovet, M., Norman, M.,
& Mayer R. (2010). How Learning Works: Seven Research-Based Principles for Smart Teaching. San Francisco: Wiley.
Burke, K. A., Hand, B., Poock, J., & Greenbowe T. (2005). Using
the Science Writing Heuristic: Training Chemistry Teaching
Assistants. Journal of College Science Teaching, 35(1), 36-41.
Burnham, K. P., & Anderson, D.R. (2002). Model Selection and Inference: a Practical Information-Theoretic Approach. New
York: Springer-Verlag.
Crisp, B. R. (2007). Is it worth the effort? How feedback influences students’ subsequent submission of assessable work.
Assessment & Evaluation in Higher Education, 32(5), 571-581.
De Nisi, A. & Kluger, A. N. (2000). Feedback effectiveness: can 360-degree appraisals be improved? Academy of Management
Executive, 14, 129–139.
Feldon, D. F., Peugh, J., Timmerman, B. E., Maher, M. A., Hurst,
M., Strickland D., Gilmore, J. A., & Stiegelmeyer, C. (2011).
Graduate Students’ Teaching Experiences Improve Their Methodological Research Skills. Science, 333, 1037-1039.
French, D., & Russell, C. (2002). Do graduate teaching
assistants benefit from teaching inquiry-based laboratories? BioScience, 52(11), 1036-1041.
17
IJ-SoTL, Vol. 8 [2014], No. 2, Art. 15
https://doi.org/10.20429/ijsotl.2014.080215
Hattie, J. and Timperley H. (2007). The Power of Feedback.
Review of Educational Research, 77(1), 81–112.
Huxham, M. (2007). Fast and effective feedback: are model answers the answer? Assessment and Evaluation in Higher
Education, 32(6), 601-611.
Kendall, K. D., and Schussler E. E. (2012). Evolving
Impressions: Undergraduate Perceptions of Graduate Teaching Assistants and Faculty Members Over a Semester. CBE-- Life
Science Education, 12(1), 92-105.
Keys, C. W., Hand, B., Prain, V., & Collins, S. (1999). Using the Science Writing Heuristic as a Tool for Learning From Laboratory
Investigations in Secondary Science. Journal of Research in
Science Teaching, 36(10), 1065-1084.
Kluger, A. N., & DeNisi, A. (1996). The Effects of Feedback Interventions on Performance: A Historical Review, a Meta-
Analysis, and a Preliminary Feedback Intervention Theory. Psychological Bulletin, 119 (2), 254 - 284.
Li, J. & De Luca, R. (2012). Review of assessment feedback.
Studies in Higher Education, 39(2), 378-393
Lizzio, A., & Wilson, K. (2008). Feedback on assessments: students’ perceptions of quality and effectiveness. Assessment
& Evaluation in Higher Education, 33(3), 263-275.
Luft, J. A., Kurdziel, J. P., Roehrig, G. H., and Turner, J.
(2004). Growing a Garden Without Water: Graduate Teaching Assistants in Introductory Science Laboratories at a
Doctoral/Research University. Journal of Research in Science Teaching, 41(3), 211 - 233.
Poock, J. R., Burke, K. A., Greenbowe, T. J., & Hand, B. M.
(2007). Using the Science Writing Heuristic in the general
18
Time Efficiency, Written Feedback, and Student Achievement in Biology Labs
https://doi.org/10.20429/ijsotl.2014.080215
chemistry laboratory to improve students’ academic
performance. Journal of Chemical Education, 84(8), 1371-1379.
R Core Team. (2012). R: A Language and Environment for Statistical Computing. R Foundation for Statistical Computing,
Vienna, Austria.
Roehrig, G. H., Luft, J. A., Kurdziel, J., & Turner, J. (2003).
Graduate Teaching Assistants and Inquiry-Based Instruction: Implications for Graduate Teaching Assistant Training. Journal
of Chemical Education, 80, 1206-1210.
Shen, H. (2013). Mind the Gender Gap. Nature, 495, 22 - 24.
Sundberg, M. D., Armstrong, J. E., and Wischusen, E. W. (2005). Reappraisal of the Status of Introductory Biology
Laboratory Education in U.S. Colleges & Universities. The
American Biology Teacher, 67(9), 525 - 529.
Voelkel, S., & Mello, L. V. (2014). Audio feedback – better feedback? Bioscience Education, 0(0), 1-15.