Date post: | 09-Mar-2018 |
Category: |
Documents |
Upload: | duongkhanh |
View: | 217 times |
Download: | 1 times |
Ple
ase
note
tha
t th
is is a
n a
uth
or-
pro
du
ce
d P
DF
of
an
art
icle
acce
pte
d fo
r p
ub
lica
tio
n fo
llow
ing
pee
r re
vie
w. T
he
de
fin
itiv
e p
ublis
he
r-au
then
tica
ted
ve
rsio
n is a
va
ilab
le o
n t
he
pu
blis
her
We
b s
ite
1
International Journal of Environmental Analytical Chemistry 1985, Volume 23, Issue 1-2, Pages 37-58 http://dx.doi.org/10.1080/03067318508076433 The original publication is available at http://www.tandf.co.uk/journals/
Archimer http://archimer.ifremer.fr
Distribution and Characterization of Tar Ball Pollution on Beaches in Brittany (France) and Indonesia
G. Bodenneca, L. Loubersac
a & J. Bilal
b
a IFREMER, Centre de Brest , B.P. 337, 29273, Brest, France
b Oil and Gas Technology Development Center LEMIGAS , B.P. 89 JKT, Jakarta, Indonesia
Abstract:
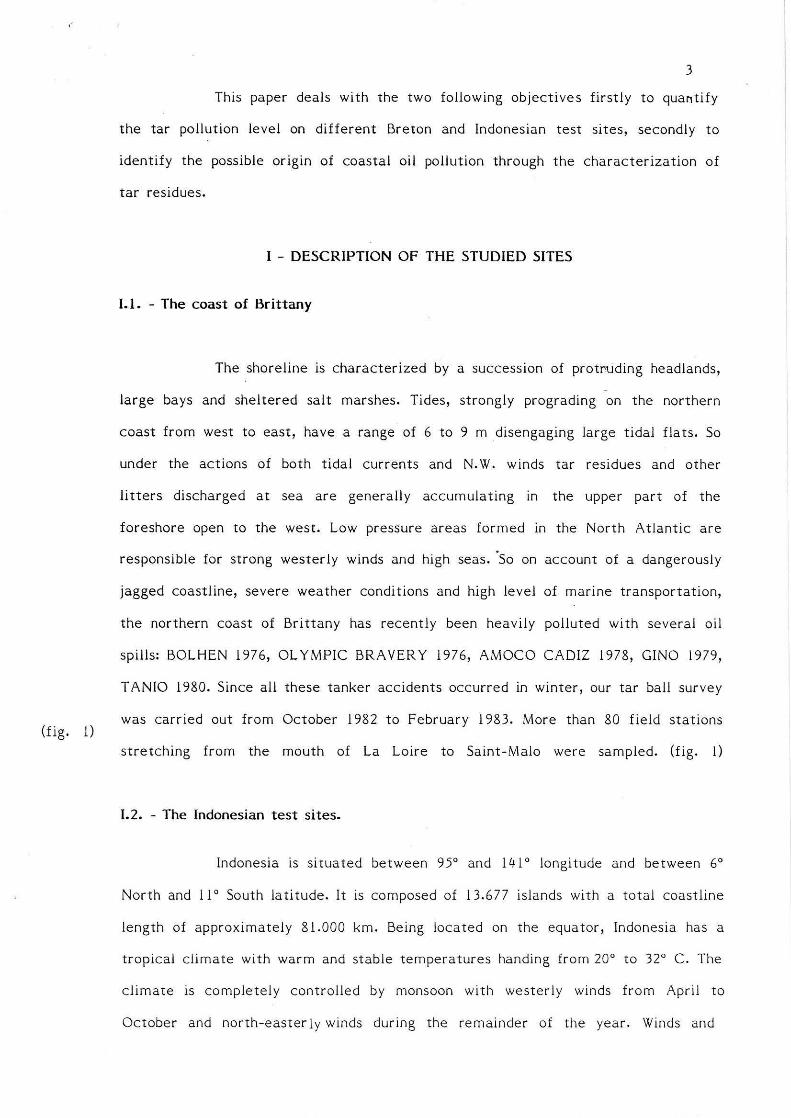
Stranded tar along the Brittany coast and four test sites in Indonesia (Jakarta Bay, Malacca and Makassar Straits, Central South Java) were surveyed in 1982 in order to quantify and identify the possible origin of oil pollutants. The estimation of tar pollution was determined by a statistical methodology based on a stratified random sampling. Western Brittany and Jakarta Bay must be regarded among the areas most vulnerable to chronic oil pollution with respectively gross weight values of 76.9 ±115.6g/m and 812.7±219g/m, comparable to those of other coasts along major tanker routes such as Kuwait or Bermuda. The levels on the other sampled sites were relatively low in spite of such dense maritime traffic as in Malacca straits (15.4 ±5.4 g/m) or near the mouth of La Loire (12.2±15.9 g/m and less than 0.5 g/m in the Bay of Saint-Brieuc).
Hydrocarbons in tar samples were examined by liquid and gas chromatography for a classification in crude oil residues, sludge residues and fuel oil. A multimethod approach combining GC, IR, SFUV and sulfur content was used for a characterization of oil extracts and their tentative matching with the physico-chemical parameters of some reference oils.
Keywords: Stranded tar pollution ; quantitative assessment ; possible sources and origins ; coastal pollution in Brittany and Indonesia
2
INTRODUCTION
The presence of petroleum residues on beaches is becoming a wide
spread phenomenon in every coastal country. The oil entering the marine en
vironment cornes from various sources: accidentai or intentional oil sp illages re
sulting from off shore activities and tanker traffic , natura l submarine oil seepages,
domestic and indust rial petroleum waste discharges from coastal ri ve rs or factories
and atmospheric fa II-out. Among these sources, the oil spi liage from tank washing
and deballasting operations at sea seems to be the main contributor y factor in the
extensive damage to marine Iife and seaside resorts through the accumulation of tar
balls on account of thei r heavy and punctual inputs. The growing a mount of
petroleum products carried by tanker s or exploited by offshor e platforms may
increase the leve l of coastal pollution. The Na tional Academy of Science 1 has
shown that there exists a ver y close correlation between the density of tar residues
washed ashore and the maritime lanes used by t anke rs. The most sensiti ve zones a re
loca ted in areas of oil production and near tanke r routes especiall y in enclosed seas:
Persian Gui f, Red Sea, Medit erranean Sea, Gulf of Mexico, or near sorne important
strai ts and capes. Mos t particularl y the shorelines of Br i ttany (Francè) and Indones ia
are charac t e rized by an intense tanker traff ic in the direct vic init y of the
coastline. An average of 180 fr e ighters including 15 tankers are indexed every day
at the English Channel western entrance . A si mila r tanker traffic could be expected
near Indonesian coasts since more than 90 % of the oil supply for the Pacific
countr ies , particul a rl y Japan and the United States is shipped from the Midd le East
through the Malacca and Makassar Strait s (Indonesia) . So the shore lines of Indonesia
and Britt any could be among the are as most exposed to oil po llu tion . It could be
interesting t o compare the level and the source of tar contamina tion in these two
areas characterized by differences in the geographical location, hyd rographical and
topographical featu res .
(fig. 1)
3
This paper deals with the two following objectives firstly to quantify
the tar pollution level on different Breton and Indonesian test sites, secondly to
identify the possible origin of coastal oil pollution through the characterization of
tar residues.
1 - DESCRIPTION OF THE STUDIED SITES
1.1. - The coast of Brittany
The shoreline is characterized by a succession of protruding headlands,
large bays and sheltered salt marshes. Tides, strongly prograding on the northern
coast from west to east, have a range of 6 to 9 m disengaging large tidal flats. 50
under the actions of both tidal currents and N. W. winds tar residues and other
litters discharged at sea are generally accumulating in the upper part of the
fore shore open to the west. low pressure areas formed in the North Atlantic are
responsible for sHong wester ly winds and high seas. '50 on account of a dangerously
jagged coastline, severe weather conditions and high level of marine transportation,
the northern coast of Brittany has recently been heavily polluted with several oil
spills: BOlHEN 1976, Ol YMPIC BRAVER y 1976, AMOCO CADIZ 1978, GINO 1979,
T ANIO 1980. Since all these tanker accidents occurred in win ter , our tar ball sur vey
was carried out from October 1982 to February 1983. More than 80 field stations
stretching from the mouth of la Loire to Saint-Malo were sampled. (fig. 1)
1.2. - The Indonesian test sites.
Indonesia is situated between 95° and 1 ~ 1 ° longitude and between 6°
North and Il ° South latitude. It IS composed of 13.677 islands with a total coastline
length of approximately 81.000 km. Being located on the equator, Indonesia has a
tropical climate with warm and stable temperatures handing from 20° to 32° C. The
climate is completely controlled by monsoon with westerly winds from April to
October and north-easter Iy winds during the remainder of the year. Winds and
fig. 2.
4
surface currents play the major role in the direction of oil slicks and floating tar
drift 2 The tide is ma inly se mi-diurnal with mean range of about 2 m. The islands,
which di splay a considerable coastal diversity , are mostl y mangrove swamps mainly
composed of sonneriata and rhizophora with sometimes at low tide large expanses of
mudflats. Sandy beaches and co ral reefs are common and weil distributed through
out the archipelago. Based on conside rations about prevailing cur rents, oil activities
location and shipping routes, four t est sites namely Kepulauan Seribu, Kepulauan
Riau, the southern-west coast of Sulawesi (Langga beac h) and the south coast of
Java near Jogjakarta were observed and surveyed in August 1982 (east monsoon) and
in May 1984 (west monsoon). The location of the test sites is indica ted in fig . 2.
Kepulauan Seribu is an archipelago located in the Java sea at about 40 km to the
northwest of Jakarta. Two islands: Pulau Pari and Pulau Tikus were selected in this
uchipelago during our 1982 and 1984 surveys. Kepulauan Riau is an a rchipelago
situated south of Singapore island in the Malacca Straits . Numerous oil terminais
and refineries with some productive offshore fields loca t ed on both sides of the
Straits could be, with the ir intense tra ffic, regarded as oil a nd tar pollution sources.
Five isla nds we re sampled in the main strait . Langga beach located abo ut 180 km
north of Ujung Pandang was the only test site surveyed on the south-western coast
of Sulawesi. This sand y beach is an area representat ive of chronic tar pollution
from oil transportation in the Makassar straits . The tes t sites on the south coast of
J ava are composed of t wo beaches Krakal and Kukup (near Jogjakarta) weil exposed
to the open ocean swell.
II - SAMPLING AND ANAL YTICAL M:THODS
II.1 - Quantitative assessm ent of tar pollution
The aim of the de veloped methodology is to obt ai n an estimation as
precise as poss ible of the quantity of str anded tar ove r a determined test site ,
taking into accoun t that the tar load ing a re not homogeneous. The st rat ified rando m
1
5
sampling adopted in this study has the advantage of giving a good precision of the
estimated mean and of notably minimizing the variance of this mean. Briefly the
sampling methodology cou Id be divided into two steps.
* The first step is made of a rapid reconnaissance of the test area in
or der to div ide it into strata representative of a type of accumulation
(i.e. very high, medium, low ... ) each of which is internally homo-
geneous.
* The second consists in selecting, in each stratum, a random sampling
composed of n beach profiles in which ail surface tars are co llected ln
a 1 m wide strip of beach extending from the waterline at the time of
sampling to the extreme upper line of the investigated zone. Tar
concentrations are expressed in grams per Iinear meter of beach tg/ml.
This unit has the advantage being independent of beach width and tide
level. Usually tar is concentrated in d}stinct bands parallel to the
water line, which facilitates c1eanup but makes the usef ulness of
ex pressing its concentra tion in units of g/m' (as it is in che IGOSS
methodology 3) questionable.
For data processing the following formulas were used in a computerized program in
order to estimate tar concentration and confidence limits of the sampled area.
N = NI + N2 + ••. NL = total number of units (L strata). The suffix h denotes the
st ratum h wi th -total length Nh
.
nh = total number of sampling units taken in stratum h.
y hi = value of the i th unit in the stratum h
i ~ ~.Jh = 2 = stratum \1eight.
N
E = h
sampling fraction ln tlle stratu~.
Estima tion of the mean per unit over the whole population
L E :'h Yh Samp l e mean h=l N
Estimation of the standard deviation sh in stratum h.
or Sh""'! 1 nEy 2 _(Ey)2" V 'n(n-l)
Estimation of the whole population
Estimation of the variance of y st
L E h=l
2 sh
nh
L
Y =E Ny st h-l h h
Es timati on "o f the variance of the whole population
v (y ) = N2 .V (- ) s t Yst .
n e
Approximation o f L
(E gh S2)2 h=l h
L L 0 2 52
h=l~ nh - 1
with
Confid ence limi t s
the number of degrees of freedom of s (Ys t
)
. estimated mean : Ys t
± tp
x s (y ) st
with t ob t a ined f r om Student' s t ab l es for the probab i lity p and p
the number o f degre es o f freedom ne .
Optima l a l locat i on :
In a rder ta minimize the var lance of (Ys t
) for a tota l numbe r of
s ampled units n , nh
must bi :
nh
n Nh \ L 1: Nh s h
h= l
6
7
Although tar was one of the commonest pollutants on most of the
beaches sampled, we noted the following spectacular dominance of plastic litter,
pieces of wood and metallic containers in Brittanny, plastic litter in lndonesia.
II.2 - Analytical methods
The analytical procedure used in this study has been described
elsewhere 4. Briefly after extraction with chloroform in a Soxhlet and complete
removal of solve nt, some physical parameters (specific gravit y, sulfur and met al
contents, infrared analysis) could be done on the raw extract. However the analyses
carried out .by gas ch romatography (GC) and UV spect rofluorimetr y (SF UV) could be
performed once the oil extract had been broken down into paraffinic and aromatic
hydrocarbon fractions via conventional adsorption liquid chromatography. The IR
spectrum was scanned between 2.000 cm and 600 cm on a Perkin Elmer 399B using
absorbance mode and a KBr ce ll. UV fluorescence was measured on a Perkin Elmer
spectrofluorimeter 3.000 equipped with synchronous excitation and emission mono
chromator modules. The experimental condi tions were as follows: excitation slit la
nm, emission slit 5 nm, scan speed 60 nm per minute, synchronous scannmg of
emission and excitation wavelength with 15 nm, a la nm simple quartz sample cell,
scanning between 250 and 500 nm. AH the samples were analysed with the same
conditions (IO mgJJ) and instrument setting to minimize quenching errors. This
technique could show the distribution of the aromatic fraction according to the
number of a romatic rings in the molecule by a series o f peaks at va rious emission
wavelengths. lt was an interesting fingerprinting method for comparison between the
sample co llected in the same area.
Gas ch romatographic analyses were carried out on a Hewlett Packard
5840 A model equipped with a flame ionisation detector, splitless injection and a Cp
Sil 5 capi llary co lumn. The ana lytica l conditions were similar to those descr ibed by
CALDER et al 5, for the analysis of crudes oils and petroleum residues by Ge.
m - RESUL TS AND DISCUSSION
m . 1. - Tar pollution in Brittanny
m.1.1 - Assessment of pollution level
8
The geographica l location of the 81 test si tes sur veyed along the
shoreline of Brittany is represented on fi g. 1 by a ci rc le charac t e ri z ing its level of
tar cont amination. Each site was sampled on a beach length between 150 and 2.000
m (m: 603.::. 340 ml. The total sampled coast is abo ut 50 km. The beaches surveyed
were regrouped by "regions" based on coast a l geology and exposure (tab le 1). Tar
concentrations on the the survey a rea display high variability according to the
geograph ical location and exposure of the sitero?revailing winds and currents. Usually
the standard deviation for a ser ies of test-sites exceeds t he mean. The most
polluted areas include mainly west fac ing beaches situated near the Channel western
entrance as 5ta.52 at Ushant (7 60 g/m), 5t a . 56 (242 g/m) and 57 (387 g/m) at
Plouguerneau while the coastline of Bay of Saint-Brieuc and Gulf of Morbihan were
not or less polluted. The Breton N. W. coast looked more vulnerable to chronic t ar
pollution than the S. W. si de as a result of the fact that tank washing and
deballasting operations could be regarded as the maIn source of tar pollution along
this area. Along the western part (5ta. 18 to 5ta. 68) the me an and st andard
dev iation we re estimated ·to the va lues . ln gross weight ' : 76,9 .::. 115,6 g/m dur ing
our 1982- 1983 sur vey. Tar distribution is strongly depe nding on the coast a l geo
morphology and time of sam pling. A fo llow-up stud y on the accumulat ion of
stranded tar was carried out at Portsall (5ta,53) between 5eptember and June 1982 .
Tar concent ration was be tween 130,4 g/m and 25 1,6 g/m with a maximum va lue in
March 3 . Tar was one of the commonest pollu tants on the beaches sampled and
corresponded on some sites: Ushant island. (59 %), at 5t a . 56 (87 %) 5ta. 57 (76 %) or
a t 5ta. 68 (87 %) to the most important pollutant (in weight) fo und on the beaches.
,.
9
ln addition to the estimation of tar pollution on beaches discussed
above, detailed analytical work was conducted on the oil extract using liquid
chromatographic partition (LC), infrared (IR) and synchronous spect rofluores-
cence (SEES) analyses.
111.1.2 - Chemical characterization of samples collected in Brittany
The main results on the chemical analysis of 21 samples collected
ln Brittany are summarized in table Il. The oil content in stranded tars generally
represents more than 60 % (62 .:!:. 23 %) of the tar's dr y weight. The percentage
of sulfur ranges between 0,99 and 3,98 % wi th an average value of 2,38.:!:.
0,71 % while the nîtrogen content was roughly similar (mean 0, 14.:!:. 0,05 %). The
oil extract was frac tionned by Iiquid chromatography into saturated hydro-
carbons, aromatic hydrocarbons and heavy produc ts (polar compounds, resins and
asphaltens). The relati ve amount of heav y products in co mparison with the hy-
drocarbon content is represented in table Il by the ratio A = heavy products /
saturated and aromatic fractions. The values of this parameter ranged from 0,16
to 0,89 (mean 0,40 .:!:. 0,25) showed generally a low degree of weathering in
comparison with the average value 0,22 .:!:. 0,06 measured usually in Middle East
and North Afr ica (+ 1500 c) oils. This fact was confirmed by IR and GC
analyses. The first n - alkane detected by GC was in most analysed samples
below n C 12. The volatile fraction defined by the ratio
_1..5 ':::>. ~ 5 5-.> n - alkanes/ - I"T "'-10
n - alkanes ranged from 1,02 to 2,78. The mean (1,67
4 .:!:. 0,55) was lower than the value measured in reference oils t opped at 1 50~
(2,01 .:!:. 0,65). According to the n - alkane distribution and the shape of the
unresolved envelope, the chromatograms of the analyzed sample have been
c lassified in fou r patterns: A, B, C and D.Chromatogram A shows a regular
distribution of n - alkanes from Cil to C40
(and more) characte risti c of a
slightl y weathered paraffinic crude oil or li ght fuel oil s. Chromatogram B
displays a bimodal n - alkane distribution with two maxima at approximative ly
10
nC 17 and nC 32 characteristic of crude and gas-oil sludges (i. e . tanker wall
washings). Chromatogram C with an unimodal alkane di stribution fram C 16 to
more than C40 illustra tes the profile of heavy fuel oil similar to refined No 6
fuel or grease with high wax content . Chro matogram D shows onl y a few
detectable GC signais emerging from an unresolved envelope (U.C.M.) charac
teristic of a highly weathered residue of inde termined origin. Hait of the
analvsed . tar sampled on the Breton coast showed a bimodal profile (type B)
wh ile a third had an unimodal n - al ka ne distribution similar to weathered crude
o ils (type A) and the remaining portion looked Üke heavy fe w oil s (type Cl.
These data strongly support transportation activities as the major sources of tar
precursors at the west ern English Channel entrance . This may results from
discha rges of oi ly ballast water by small tankers without load on t op equipments
on inward-bound voyages to north European countries t erminais or productive oil
fields in the North 5ea. Local fishing activities seemed to be a minor con
tribut or since no relationship could be found on the polluted areas between tar
loadings and fishing gear (plastic boxes and ropes) lost or di scharged at sea 6.
The fact tha t most samples showed a bim odal n - alkanes di stribut ion was
likewise determined along Mediterranean coast 7, 8 but usuall ly an uni modal
distribution was observed 9, 10, II, 12.
50 gas ch romatograph y has been useful in show ing si mila rities
between samples collecting fro m diffe rent locations, in de tect ing bimodality or
unimodalit y in tar residues, and in giving some ide nt ifica ti ve proofs of the
possible origin of pe troleum products, if the samples are fresh and if com
parative reference oi l are available. However a lot of tar samples are in
different st age of weathering. 50 in th is study GC identifying parameters has
been used onl y on the case of sligh ly weathered samples (A < 0,7) showing an
unimodal or bimoda l n-alkane distr ibu tion (t ypes A or B) wi t h a light hy
drocarbon content (B > 1,2). In these conditions, the ratios nC 17/P ristane,
nC 1 8!Phytane, Pr ist ane!Phy tane and biologica l makers such as the C 20 - C40
Fig. 3
Il
acyclic isoprenoïds, C27 + steranes and triterpanes could be matched with
reference oil samples. Yet pinpointing sources of the stranded beach tars
requires in most cases, additional data as sulfur, trace element content, or other
informations obtained by other analytical techniques. In particular Fig. 3
illustrates the relation between Pristane/Phytane ratio and sulfur content values.
On account of the weathering processes , a rough correlation was expected with
the data from the possible pollutant sources. No analysed tar sample looked like
N.A. oils (Algeria and Lybia) or North Sea oil (Ekofi s~). On the other hand, a
good similitude could be observed with compositional parameters of originating
Middle East . or Mexico oils for almost ail the tar samples (it is very difficult
to differentiate the se two kinds of oils in weathered tar samples). One ex-
planation of this possible origin of tar samples could be the relatively low
European consumption of other crudes and the difficulty for some North African
crudes to form oils patches because of their low asphalten· and par affin
13 P . h 1 (S 32 40 64) Id b . . . contents . resumptlOns t at some samp es t. " cou e ongmatmg
from U.S. c rude oils are given by GC and sulfur. measurements and the
observation of barnacles Oepas ana tifera) li ving on them. lt may be that floa ting
tars are colonized soon after they enter the marine environ ment and that the
type of organisms found on them indicates the kind of environment to which
the y are first exposed. The size of these barnacles (max 15 mm long) is probabl y
not a reliable measure of the residence time of the tar in the water, until more
is known about the factors influencing the growth rates of organisms associated
with the tars. However the presence on tar samples of these mollusks unknown
on temperate climate should indicated that the discharges occurred far in the
open Atlantic ocean be fore to wash ashore in Brittany unde r the action of
c urrent (Gulf Stream) and W. winds (common in thi s area).
II1.2 - Tar pollution on the Indonesian test si tes.
II1.2.1 - Assessment of pollution level
12
The general estimation of stranded tar ball pollution on the sites
surveyed in 1982 and 1984 is indicated on table III. The data (mean and
confidence limits) are expressed ln gram per unit beach lenght (g/m) of the
residues collected before {values in gross weightl and after removal of non
petroleum compound (values in net weight). Oil contents in tar samples was
determined by the chemical analyses (50xhlet extraction) of about fifty samples
randomly distributed on each studied test site. The data expressed in net weight
represent respectively about 40 % and 30 % of the values in gross weight
reported in 1982 and 1984. 50 looking only on the data expressed in gross weight
may lead to incorrect evaluation and comparison between the pollution level on
. two sites wh en the values are very close together. ln this study the results
expressed in gross or net weight do not change the order in the pollution level
of the studied sites. In the other points of the discussion only the va lues
expressed in gross weight will be used.
Kepulauan 5eribu in Jakarta Bay appeared to be about one hundred
times (j 984 sur ve y) and twenty two times (1982 survey) more polluted than the
average leve l measured on Malacca and Makassar test si tes. We also observed a
great fluctuation of tar pollution during the two seasonal surveys. The tar
pollution level determined in May 1984 was three times as high ilS in August
1982. The increase in deposition in May could be due to a change in the coasta l
circulation pattern and wind direction during the northwest monsoon. In the case
of Malacca st raits test sites it was ve ry su rpri sing to find that the area in front
of 5ingapore harbour was among the lowest contaminated zones . This fact could
be explained by the presence of strong currents. It seems that the studied sites
do not act, as Pulau Pari does,as a trap for tar residues. In this case there IS
no accumulation of tar but on ly transit. This was observed in Pulau Takong in
the middle of the straits. Fresh tars were coming with the flood tide and going
13
back with the ebb tide and the st rong drift associated to it. The same portion of
the island shore showed a complete redistribution of t a r depositions in 24 h
although the level of pollution in weight had not changed.
We observe between August 1982 and May 1984 an increase of tar
concentration in Kepulauan Seri bu by a fac tor of about three times. On the
other sites no characteristic flu ctua tions in tar loading are noted wh en
compared to the two su rve ys. The inc rease of deposition in May could be due to
changes in coastal circulations pattern and wind direct ion during the north
western monsoon. At that seasonal period, the weather conditions could be
fa vourab le to tar and other wast es floating a t sea (somet imes for a long time) t o
wash ashore ln a great deal. ln particular on the northern coast the oi l
depositions were found in soft and smelted conditions due to the heat and thus
get mixed with sand to form large lumps di scontinuously distributed along the
beach. This t ype of tar distribution was typical of an oil spillage resulting from
different sources: tanker accident or tank deballasting at sea , sp illage in
relation to offshore production activities. The main sh ipping la nes to and from
Jakarta harbo ur goes northwards the vicinity of Pulau Pari.
III.2.2 - Chemical characterization of samples co llec ted in Indones ia
More than fift y tar res idues we re ra ndomly sampled during our
1982 field surve y and analysed as previously described. The results are re
presented in table IV by the ave rage values (mean !. standard deviation) of oil
extract's composition in samples collec ted in the same a rea. A str ic t comparison
between the data is difficult because the samples are in different st age of
weathering. On the same sampling si te we observe that the ratio heav y
produc t s/hydrocarbon fractions (A values) has a coeff ic ient of var iation (CV %)
be tween 5 and 62 % (mean 32 !. 18 %). However each site showed a particular
aspect of tar pollution. For example, on the south coast of Pulau Pari (Ke
pulauan ser ibu are a) oil pollution was in form of small tar balls and oil pa tches
14
often lying on the sea bottom at low tidal zone level . . The oil content
represented about 25 % of the sample's weight. The oil extract had low va lues
of sulfur content (0,6 .:!:. 0,7 %) and nC 17/Pristane (0,4 .:!:. 0,5) in comparison with
the high Pristane/Phytane value (7,5 .:!:. 2,2). The northern coast of Pulau Pari
was polluted by discontinuous large oily patches lying at the upper beach zone.
The contamination seemed to result from the same oil slick. The oil con tent was
very low (6,6 .:!:. 0,9 %). The organic extract was characterized by relati ve ly high
values for sulfur content (2,4.:!:. 0,9 %) and n C 17/Pr (1,6.:!:. 0,9) and a low Pr/Ph
value (1,5 .:!:. 0,8). 50 these data pointed out that the sources and the origin of oil
contamination on the northern coast seemed different from those found of the
southern part. The majority of the tar samples collected there (54%) displayed
agas chromatogram with a bimodal paraffinic distribution while about 10 %
looked like a slighly weathered crude, and 16 % were similar to a heavy fuel oil.
All the samples from Pulau Pari North had an unimodal chromatographic profi le
characteristic of a weathered crude oil. Oil production ln lndonesian offshore
fields is coming mainly from continental shelves located ln the North East and
North West Java, Kutel and Natuna baSinS 14 The majorit y of the oil found in
these reservoirs is paraffin based from medium to high gravit y with a low
sulphur content. The main characteristic parameters of analysed lndonesian
crude oils may be separated in two groups (table V). Oil sample coming from
offshore fields located in the north western part of Kepulauan 5eribu labelled Il
was characterized by a high value of Cl /Pr and Cl 8/Ph ratios while the others
(12 to 1 5) had a high Pr /Ph (9,2 .:!:. 0,3) and a low value nC 17/pr (0,33 .:!:. 0,12)
values. Most lndonesian oi ls have a low sulfur content (5 < 0,4 %).
Fig 4.
15
The values of Pr/Ph ratio with sulfur contents measured in
Kepulauan Seribu tar samples are represented on the Fig. 4. We observed on this
graph that the data of samples labelled l, 2, 4, 5, 7 were grouped with oils 12 to
15 while samples 14, 16, 17, 18, 19 seemed to be similar to reference oils from
Middle East, Africa or Mexico. In order to get better identifying proofs about
the possible origin of tar samples, analyses by infrared spectrometry and
synchronous spectrofluorimetry were carried out. Various non linear combination
15 of IR absorbance ratios are poss ible A determination Iimited to the
-1 -1 -1 absorbance at the frequences 1600 c m ,810 cm and 720 cm provides an
additional tool for oil identification. In partic ula r an interesting recognition of
Fig. 5. tar samples probably coming fr om Indones ian c rude oil Il could be noticed on
Fig. 5.
The aromatic extracts fro m tar balls were ana lysed using syn-
chronous fluorescence spect roscopy technique. The method is based on the fac t
that the fluorescen ce maxima of a romatic compounds OGcur at different emis-
sion wavelengths according to the aromatic structure. Thus oil s of similar origin
have unique mixture of aromatic compounds which exhibit charac t eristic lumi-
nescence fingerprint. The intensi ties of the fluoresce nce spectra were measured
a t wavelengths corresponding to peak max ima at 280-300 nm (l ring), 310-320
nm (2 rings), 365-410 nm (3 - y rings)390-480 nm (5 and la rger rings). Syn-
chronous scannig of fluorescence from 250 to 500 nm revealed significant
qualitative differences in the spectra of samples from diffe rent loca tions. The
relative contr ibution to fluo rescence by live rings and la rger a romatic com-
pounds was determined by express ing the peak height at 405 nm in relat ion to
the value at 350 nm (I 405/1 350). A rough correlation could be expected
between the va lues in tar balls and in its possible crude oil sources on account
of the re lat ive solubili t y of ligh t aromatic hyd rocarbons in sea wate r before
lump and tar bail forma tion f rom the sp i lied oil . However these analyti cal data
seemed roughly in agreement with the other identifying parameters to assess the
16
possible source and origin of the pollution in each studied site .
1 - South Pulau beaches showed a widespread tar contamination probably
resulting from sever al sources. Most 01 sa mples displayed agas chromat ogram
with a bimodal paraffinic di stribution characteristic of tanker sludge residues or
gas-oils and analytical parameters similar to Indonesian oi ls labelled 12 to 15" ln
thi s area, pollution could be mainly attributed to local shipping and fi shing
activities · About ten percent of samples looked like weathered crude oils (t ype Il)
probably coming from offshore acti vities in N. W. Kepulauan Seribu area while
about twenty percent of tar samples were assigned to foreign countries oils.
2 - Oil pollution on the north Pulau Pari coast was mainl y made of large oily
patches homogeneoustly distributed along the upper flat. Ali the samples are
characterized by an uni modal gas chromatogram pattern and a sulfur content
value similar to that of many oils produced in the Middle East countries . This
coast is particularly exposed to chron ic po llut ion wi th its loca lisation in the
vic inity of the main shipping routes to and Irom Jaka rta harbour.
3 - Pulau Tikus showed the lowest leve l of oil contamination in the studied area.
The main analytical parameter of the coHec ted samples could be co mpared to
those found on South Pulau Pari coas t.
4 - The level of tar accumula tion a t the Kepu lauan Riau area was relatively
low ([ 6 g/m) in spite of the important traffic acc ross t he Straits of Malacca.
Twen t y two samples we re coHect ed on the surveyed areas. Three samples were
charac t erized by a sulfur content higher t han l , aH the othe rs had a low va lue
(iTi: 0,33 ~ 0,18 %) . Two third of the analysed samples had a GC pattern looking
li ke ligh tl y weathered crude oil s and on ly th ree samp les showed a bimodal
distribut ion characterist ic of tanker sludge residues.
17
Sulfur content, GC and IR data of the collected samples were
arranged in two main groups. About one third of them were grouped around the
reference oil [1 while the others could be correlated with oils from other
[ndonesian or South Asia oil fields similar to reference oils labelled [2 to [5"
5 - The two other pilot areas: Langga beach on the western coast of Sulawesi
(Makassar Straits) and Kukup beach on the Central Java coast were charac
terized by a [ow tar pollution. Ali the analysed tars had a low sulfur content (m:
0,3 .:!:. 0,3). One sam pIe showed a bimodal n - alkane distribution while the others
seemed to be weathered crude oils of indetermined origin.
18
CONCLUSION
This paper gives a first assessment and charac t er ization of tar
depositions on some sites ln French Brittany and Indonesia vulnerable to
chronical oil pollution. The main results are co mpared in table VI with data
obtained on some areas more extensively studied as Mediterranean, Gulf of
Mexico or Kuwait coastlines . Stranded tar pollution on Kepulauan Seribu (Jakarta
Bay) during our 1982 and 1984 surveys was among the highest values found on
coastal areas of major tanker routes as Kuwait, Bermuda or Israel. Pollution
levels observed aIong Malacca and Makassar Straits are comparable with the less
polluted coastlines such as Trinidad and Tol:ago coasts. With an estimation of
about 80g/m, the western part of Brittany is notabily subjected to oil conta-
mination.
The characterization of tar samples is important in order to define
the possible pollutant sources and origin. The classification of samples was based
on suIfur content, gravimetric and molecular compositions (gas chromatography),
IR and fluorescence spectra. Tar samples co llected in Brittany looked ve r y
fresh; so sulfur content and gas chromatographie data were a good approach for
identifying oil pollutants. On the other hand, most tars co llected in Indonesia
significant marks of degradation and it was necessary to use other fingerprinting
methods as biologicaI markers 22 (triterpanes and steranes) or infrared and fluo-
rescence spectra.
ACKNOWLEDGEMENTS
We would Iike especially to tha nk Mr M. JOANNY, J.L. LHE
VEDE R, B. PRASEY TO for their skil fu l field assistance and their help in the
data processing and Mrs E.H. LEGOWO for som e chemical analyses on the
Indonesian sa mples.
19
REFERENCES
1 - National Academy of Sciences (NAS) 1975. Petro leum in the Marine
Environment. NAS Washington
2 - UNESCO. Manuel de surveillance continue du pétrole et des hydrocarbures
en mer et sur les plages. COI/OMS/PNUE. 1977 Supp. 2 Par is
UNESCO. Manual and guides, 1982 nO II, 38 pp.
3 - L. LOUBERSAC. Pollution chronique des plages par les résidus pé troliers.
C NEXO-MRE report 1982, 26 pp.
4 - G. BODENNEC. Pollution du littoral français par les macrodéchets. Ana
lyse des résidus pétroliers. CNEXO-MRE report 1983, 106 pp.
5 - J .A. CALDER and P .D. BOEHM in the International Symposium on the
Amoco Cadiz: Fates and effects of the oil spill. Brest (France) Nov. 19-22
1979. CNEXO Paris 198 1, pp. 149-158
6 - J.L. LHEVEDER. Pollution du littora l armoricain par les macrodéchets.
CN EXO-ENITR TS report 1983, 167 pp.
7 - J. ALB AIGES, J. BORDON and J. ROS. IV è mes journées Etud. Pollutions.
C .I.E.S. An talya, 103 (1 978)
8 - V. SHEKEL and R. DAVID. En vi r. Sei . Technol. U' 502 (1977)
9 - J.N. BUTLER. Mar. Chem.l, 9 (197 5)
10 - L.M. JEFFREY, W.E. PEQUENAT, E.A. KENNEDY, A. VOS, B.M . J AMES .
Marine Pollution Monitoring (Petro leum) NBS SP 409, 1974 Washington
D.C. pp. 234-235
II - G. BODEN NE C, L. LOUBERSAC, J. BILAL, E.H. LEG OWO and B.
PR ASEYTO Oc:urren:e of tar pollution along shores in Indonesia in August
1982. CNEXO-LE MIG AS report 1983 , 110 pp.
12 - M.C. KENNICUTT and J.M. BROOKS . Marine Po llu tion Bulletin l!!., 335
(1983)
20
13 - M. SAVAGE and C.H. WARD. Marine Pollution BulletinQ, 174 (j 984)
14 - J. BILAL and W.W. KUHNHOLD. Marine oil pollution in Southeast Asia.
FAO/UNEP, SCS/80/WP/92 Manila 1980", 85 pp.
15 - J.S. MATTSON. Classification of oi ls by the app lication of pattern reco
gnition techniques to infrared spectra. US Department of transpor tat ion
Washington D.C. 1976, 45 pp.
16 - S.G. WAKEHAM. Environ. Sei. Techno!. .!.L, 272 (j 977)
17 - B.L. OOSTDAM. Mar. Pollut. Bull., .!.L, 301 (j 984)
18 - C. GEORGES and B.L. OOST DA M. Mar. Pollut. Bull ., li, 170 (j 983
19 - B.L. OOSTDAM and W. ANDERLlNI. Oil spills and tar pollution along the
coast of Kuwait. Mar. Pollu t. Program KISR, Special report (1978)
20 - J .N . BUTLER, B.F. MORRIS and J.S ASS. Pelagie tar from Bermuda and
the 5argasso 5ea. Bermuda Biological Station Spec. Pub!. N" 10 (1973)
21 - 5.D. WAHB y and K.Z. EL DEEB. A study of the state of pollution by
petroleum hydrocarbons along the Alexandria coast. V Journées Etud.
Pollut. CIESM (1 980)
22 - J. ALBAIGES, and J. BORBON. J of chromatography 204, 491 (1 98 1)
Table 1 TAR POLLUTION ON BEACHES IN BRITT ANY
(Octobe r 1982 - January 1983 survey)
Survey area total length tar concentration (g/m) tar / other li tter
(test site n O) sampled (km) range mean + 5.0. (% gross weight)
Loire Atlantique
Sta 1 - Sta 10 5,6 o - 49 12,2 .:!:. 15,9 1,7 .:!:. 2,2
max Sta 5: 5,8%
Morbihan
Stall-Sta20 4,4 o - 82 7,9.:!:. 27,3 2,3 .:!:. 1,4
max Sta 18: 3,8%
Sta 21 - Sta 26 3,5 10 - 208 57 + 72 4,9 .:!:. 4,3
max Sta 26: 12, 5%
Finistère
Sta 27 - Sta 32 3,3 o - 88 42,1 .:!:. 46,7 4,8 .:!:. 1,6
max Sta 32: 6,5%
Sta 33 - Sta 38 5,3 o - 203 72,2 .:!:. 75,2 Il,4 .:!:. . 13,4
max Sta 37: 33,9%
Sta 39 - Sta 44 5,2 15 - 235 91 + 84 10,0 .:!:. 56
max Sta 39: 16,8%
Sta 45 - Sta 50 3,6 o - 142 35,2 .:!:. 54,2 Il, 2.:!:. 15,2
max Sta 49: 37,5%
Sta 51 - Sta 56 3,4 12 - 760 19 7 + 296 35,O.:!:. 30,2
max Sta 56: 87,4%
Sta 57 - Sta 61 3,6 o - 387 65 + 160 36,9 .:!:. 30,6
max Sta 57 : 75,6%
Côtes-du-Nord
Ille-et Vilaine
Sta 62 - Sta 71 4,3 o - 130 36 + 49 32,1 .:!:. 40,4
max St a 65 : 94,8%
Sta 72 - Sta 81 7,1 o - 4 0,5
TABLE Il Summary of chemicaJ data for tar samples collected in Brittany
Sampling site station oil sulfur
content content
(!Ii)
Pornichet 7 40,2 2,08
Erdeven 2 1 42,5 2,02
Graves 22 92,5 2,09
Kerlriant 29 70,5 2,36
Sables Blancs 32 56,9 2,06
Kerve llec 33 39,7 2,45
La Torche 34 18,9 2,38
Pors Peron 39 86,4 2,05
Plage du Ris 40 74,4 0,99
Trez-Be llec 42 53,4 3,21
Abe r 43 82,9 1,49
La Palud 44 89,8 2,27
Tou linguet 46 71,3 1,78
Plougastel 48 86,2 3,20
Posmilin 49 80,7 2,80
Blancs Sablons 50 72,8 3,98
Portsall 53 89 .. 3,28
Bouenou 54 50,7 2,22
Vougeot 56 50,7 2,82
Roscoff 59 24,6 3,07
Trozoul 64 28,5 1,48
A gas chromatography
(1) profile
type
0,16 A
0,70 B
0,47 B
0,43 B
0,19 B
0,86 A
0,78 C
0,36 A
0,18 C
0,25 C
0,89 B
0,43 B
0,55 B
0,25 B
0,60 B
0,78 C
0,58 A
0,85 B
0,36 A
0,30 B
0,25 A
B
0,99
2,70
. 2,28
2,06
1,61
1,91
0,14
2,38
0,44
0,59
2,45
l,53
l,9O
2,13
1,44
0,19
3,2
2,02
2,30
1,08
2,51
[1] A = Heavy products (%Vsaturated + aromatic hydrocarbons (%)
[2] B = L~: n - alkanes/ :E~'; n - alkanes
nC17
Pr
0,92
1,76
1,60
l ,50
3,02
l,50
0,20
2,20
0,83
0,50
l, gz.
1,29
1,60
0,91
1,17
0,20
2,60
1,23
2,68
0,90
2,35
nC18 Ph
0,77
0,73
0,79
0,83
2,02
0,71
l,10
1,03
1,98
0,63
0, ?-2-
0,74
0,76
0,42
0,71
1,30
0,89
0,70
0,86
0,77
1,09
Pr
Ph
1,78
1,21
1,78
2,78
2,73
1,21
1,29
l,58
1,22
1,25
l, &.9
1,21
l,8O
1,46
1,10
1,02
2, 1 1
1 ,4"9
2,37
l, 8O
2,45
Table III
Geographical loca tion
Pulau Pari South
Pulau Pari Nor th
Pulau Tikus
General estimation at
Kepulauan Seribu
Pulau Takong
Pulau Pelampong
Pulau Nirup
PuJau Labon Kecil
Pulau Kapal Besar
General estimation at
Kepulauan Riau
Makassar Straits (Langga)
Central Java coast (Kukup)
T AR POLLUTION ON INDONESIAN BEAC HES
in August 1982 and May 1984
(data expressed in g/m)
1982 sur vey
mean in mean in
gross weigh t net weight
102 + 45 25,9.:!:. 11,4
2867 + 840 189 + 55
61, 1 .:!:. 49,4 18,1 + 10,8
812,7 .:!:. 219 67.:!:. 15,3
29,8 .:!:. 18,2
J5,2.:!:.16,5
Il,3 .:!:. 13,1
9;6.:!:. 13,7
24, 1 .:!:. 20,7
15,4 ~ 5,4
56,8 .:!:. 36,5
< 1
8,14 .:!:. 7
7,6 .:!:. 8,2
8,5 .:!:. 9,9
5,5 .:!:. 7,9
Il,3 .:!:. 10,1
7,8 .:!:. 3,4
30,7 .:!:. 21,1
1984 sur vey
mean in mean in
gross weight net weight
542 + 394 112,3 .:!:. 85,8
9554 + 5979 1880 + 1224
86.:!:. 37,8 19,8 .:!:. 9,8
2460 + 1349 494 + 270
53,6 .:!:. 77,6
6,57
5,21 .:!:. 9,64
2,85 .:!:. 1,88
41 ,2.:!:. 37,8
13,7 .:!:. 19,8
0,95
1,68 .:!:. 3, 10
1,02 .:!:. 0,67
18,3 + 16,8
16,03 :t. 12,4 4,80.:!:. 2,95
22,6 .:!:. 9,3
7,5.:!:. 2,7
9,08 .:!:. 3,32
3,13 .:!:. 2,53
Table IV Summary of chemical data for lndonesian tar samples
, test 5 i te
Kepulauan Seri bu are a
Pulau Pari South
Pulau Pari North
Pulau Tikus
Kepulauan Riau are a
Pulau Takong
Pulau Pelampong
Pulau Nirup
Pulau Labou Kecil
Pulau Kapal Besar
Makassar Straits (Langga)
Central Java coast
nb. of samples
13
6
5
5
2
8
3
3
4
2
(1) as defined ih table II
(2) as defined in this paper
oil content sulfur (%) mean + s.d. mean + s.d.
25,42:. 10,4
'6,62:. 0,9
48,72:. 40 ,9
24,12:. 11 ,4
50 + 30
69,52:. 16,2
67,12:. 17 ,2
46,92:. 6,2
0,62:. 0,7
2,42:. 0,9
0,32:. 0,1
0,62:. 0,4
1,12:. 1,1
0,4 2:. 0,3
0,32:. 0,2
0,5 + 0,2
53,42:. 17 ,9 0,32:. 0,3
81,22:.11,7 0,32:. 0,1
A
(1)
0,72:. 0,4
0,52:. 0,2
0,8 2:. 0,5
0,2 2:. 0,02
0,42:. 0,1
0,32:. 0,1
0,42:. 0,02
1,02:. 0,3
0,62:. 0,2
0,92:. 0,2
G.C. parameters mean + s.d.
nC 17/Pr Pr /ph
0,42:. 0,5
1,62:. 0,9
1,22:. 1,0
0,72:. 0,1
1,12:. 0,4
0,72:. 0,1
1,8 2:. 0,2
7,52:. 2,2
1,52:. 0,8
3,52:. 0,8
6,72:. 1,0
5,8 2:. 0,5
6,62:. 0,6
3,7 + 0,5
1,12:. 0,5 3,22:. 0,4
1,3 2,6
UV SF (2)
l 405/1 350
0,72:. 0,1
0,52:. 0,1
0,42:. 0,2
0,92:. 0,2
0,72:. 0,1
0,62:. 0,1
0,42:. 0,1
0,72:. 0,1
Table V: Physico-chemical and chromatographie characteristics of sorne reference oils
sample code sulphur nb content
Indonesian crudes IIAP AR PT # 2
AR DST # 3
AR DST # 4 AR DST # 5
Il 0,10
12 0,13
13 0,16
14 0,30
15 0,12
Middle East oils Arabian light (+ 150) Ar 1,82
Iranian light (+ 150) Ir 1,85
Iraq (crude) Iq 1, 81
Other countries Nigeria Ng Gabon (Mandj i) Ga Mex i co (1 x toc) Mx North sea (Ekofish) Ek Algeria(Hassi Messaoud) Ah Alger i a (Zarzeti ne ) Az Libya (Zueitina) Lz Vene zu ela (Boscan) Vb U. S. A. (Texas) Ut U. S. A. (Luisiana) Ul
(1) def ined as table IV.
0,30
1,10
1,80
0,22
0,13
0,08
0,23
5,5 1,0
1,1
A
( 1 )
0,28
0,26
0,25
0, 18
0,18
0,44
0,29
0,27
0,07
0,11
0,16
0,16
0,19
0,21
0,13
1,08
0,07
0,07
G.C. parameters C17/Pr C18/Ph Pr/Ph
3,55
0, 40
0,48
0,25
0,20
5,66
5,92
6,96
0,61
1,06
3,64
2,53
2,75
3,03
2,58
0,62
1,25
1,10
8,20
4,47
4,66
3,09
2,51
2,44
2,81
2,98
2, 19
0,69
2,28
2,72
3,40
.3,49
1,60
0,51
4,40
3,0
3,30
9,20
8,78
9,40
9,45
0,46
0,55
0,50
0,55
0,35
0,61
1,23
1,40
1, 44
1,68
0,83
4,80
2,73
UV SF (2) 405/1 350
0,92
0,39
0,32
0,36
0,41
0,55
0,55
0,50
0,34
0,32
0,40
0,18
0,33
(2) spectrofluorescence data defined by the ratio of fluorescence intensity at 405 nm and at 350 nm.
Table VI Estimation of stranded pollution on sorne geographical areas
location
The Netherlands (North Sea)
Australia (Darwinand vicinity
Mauritus (regional average)
Indonesia (Sumatra Sibolga)
Indonesia Central Java coast
Seychelles (Mahi)
Singapore (regional average)
India (West coast)
Indonesia (Malacca straits)
Thailand (gulf average)
South Africa (Cape Town Durban vicinity)
Indonesia (Makassar straits)
Saudi Arabia (Jedda)
Kenya (regional average)
Sri Lanka (re9ional average)
Trinidad and Tobago
Sud an (Port Sudan vicinity)
France (W. Brittany)
Malaysia (Gulf of Thailand)
Kuwait (regional average)
Bermuda
Indonesia (Kepulauan Seribu)
Israel
(Mediterranean coast)
beach tar concentration references
profi les (g/m)
Nos. mean + s . d.
10
8
46
12
5
32
19
35
32
38
43
12
3
14
38
10
50
43
58
47
47
0,2~0,3
0, 4 ~ 1
5,5 ~ 9,7
1,4 ~ 4,7
7,5~2,7
10,1 ~ 12,3
10,0 ~ 1,2
13, 1 ~ 15,6
16,0 ~ 12,4
17,8 ~ 36,6
27,8 ~ 15,6
22,5 ~ 9,3
29,8 ~ 27,4
42,8 ~ 40,8
46,4 ~ 51,4
54
107,1 ~ 87,8
76,9 ~ 115,6
125,1 ~ 129,4
155,1 ~ 87,1
700
813 + 219
2460 + 349
3625
17
17
17
17
this study
17
17
17
this study
17
17
this study
17
17
17
18
17
this study
17
19
20
1982 sur vey
1984 survey
21
GINO
o
• • • • • •
uShâfln, islan -~2
" .
10 0
25 0
70 ô
1~O
250
3S0 Ù -1:30 gm
T ANIQ
o
1 ioo·
ENGLISH CHANNEL
!u LJ._.
f.-..ib'4. Bay of (i.ltnnnr~n 6~'SI. Arieuc ~~lnII1Q ro
1 ." 1aV~ ""L 82 7 )'!, iTi Il
, ' ~~~ co 01 -:-T Tl ' P ,
s~rnl.811.uc
COT~S·DU·NORD
B .RITTANY l'ENNE'i
J;!
ILL~.Èr.VlLAIN~
o l!l 1,) sn f{m "
Â--A. _ â _ __ . •
Fig. 1 - Localisation of studied sites and distribution of tar pollution
on Brittany (France)
G. BODENNEC etal. Tar pollu t ion studies
EQUATEUR
,
Joo Kms 1000 E
: STUDIED TEST SITS CD KEPU~AU SERIBU /"
® KEPULAU RIAU ( MALACCA STRAITS)
@ LANGNGA (MAKASSAR STRAITS)
8) CENTRAL JAVA - . •
KALIMANTAN
p.
Figure 2 - Studied test sites along shores in Indonesia
G. BODENNEC etaJ. Ta r pollu ti on stud ies
Pristane/phytane
10 . l,
8
6 Indonesia
4 li< l,
North
1
0,6
° 0,2
0,1 0,1
USA
Africa
Ek *
Norway
0,2 0,4 0,6
© u, *
•
, 1
fAR SAMPlE * reference Oll *
* 50 .. * * "*/. vb
~ * * ',ii*' Venezuela M ~.2
M~ .' * iddle Ar *1'1 Ir ..
Eas1
, , , • 0/0 2 4 6 Sulfur
Figure 3 - Relationship between pristane/phytane ratio and sulfur content
in tar samples collected in Brittany (France)
G. BODENNEC etaJ. Tar pollution studies
Pristane phytatle
10
7,5
5
2,5
0
i 1. ùflf I.lf ' 1,'" -,
1
13
• • •
• .. " • • 1. 13
1(0..
• .n •
Ng •
1
KEPULAU SERIBU
'1 18 • • Go la,. Ir • • Ar
Indonesian oil. other oils ·tar samples
Mx •
2
:
17 -.. •
*
.. -
3
•
Figure If - Relationship between pristane ta phytane ratio
and sulfur content in Kepulau Seribu samples
" -
G. BODENNEC etaI. Ta r pollution s tudies