International Journal of PharmTech Research CODEN (USA): IJPRIF, ISSN: 0974-4304 Vol.8, No.6, pp 128-146, 2015 A stability-indicating RP-HPLC method development and validation for the related substances determination of Imatinib process impurities and their degradation products in tablet dosage form. Pratik Shah 1,2 , Rutesh Shah 3 * 1 Intas Pharmaceutical Limited-Astron Division, S.G.Highway, Bodakdev, Ahmedabad, Gujarat, India. 2 Department of Chemistry, School of Sciences, Gujarat University, Ahmedabad, Gujarat, India. 3* K KShah Jarodwala Maninagar Science College, Gujarat University, Ahmedabad, Gujarat, India. Abstract: A sensitive, robust and selective stability indicating RP-HPLC method for the related substances determination of process impurities and their degradation products of Imatinib in tablet dosage form was developed and validated. Stability indicating power of the method was established by forced degradation experiments and mass balance study. The chromatographic separation was performed on Symmetry C18 (150 mm ´ 4.6 mm) 5m make: Waters column, using gradient elution of mobile phase-A (prepare a mixture of 500 volumes of pH 3.0 buffer solution and 500 volumes of methanol) and mobile phase-B (prepare a mixture of 40 volumes of pH 3.0 buffer solution and 960 volumes of methanol) at a flow rate of 1.0 ml/minute. The buffer solution was prepared by dissolving 7.5 g of 1-octane sulfonic acid sodium salt in water and adjusting the pH to 3.0 with ortho-phosphoric acid. The column oven temperature and sample temperature was maintained at 27°C and ambient respectively. Detection was performed at 240 nm. The injection volume was set to 20μl and the run time of this method is 65 minutes. The retention time of the Imatinib peak was found to be about 21 minute. The method was further evaluated for its stability indicating capability by acid hydrolysis, alkali hydrolysis, water hydrolysis, oxidation degradation, thermal degradation and photolytic degradation. All acceptance criteria of International Conference on Harmonization guideline for validation were covered in method validation. This method can be used for quality control sample during manufacture and during stability sample analysis. Keywords: Related substances, Imatinib, Stability-indicating, Development, Validation. 1. Introduction Imatinib is an antineoplasticdrug used to treat leukemia, especially chronicmyelogenousleukemia (CML), certain types of adult acute lymphocytic leukemia and number of other cancers. It is also used in the treatment of gastrointestinal stromal tumors (GISTs) and a muscle cancer called dermatofibrosarcoma protuberans. Imatinib is chemically a 2-phenylaminopyrimidine derivative which functions as a specific inhibitor of a number of tyrosine kinase. Imatinib is like all tyrosine-kinase inhibitors acts by inhibiting a tyrosine kinase enzyme in this case BCR-Abl from phosphorylating subsequent proteins and starting the signalling cascade necessary for cancer growth and death. Thus, preventing the growth of cancer cells and
Transcript
International Journal of PharmTech ResearchCODEN (USA): IJPRIF, ISSN: 0974-4304
Vol.8, No.6, pp 128-146, 2015
A stability-indicating RP-HPLC method development andvalidation for the related substances determination of
Imatinib process impurities and their degradation productsin tablet dosage form.
Abstract: A sensitive, robust and selective stability indicating RP-HPLC method for therelated substances determination of process impurities and their degradation products ofImatinib in tablet dosage form was developed and validated. Stability indicating power of themethod was established by forced degradation experiments and mass balance study. Thechromatographic separation was performed on Symmetry C18 (150 mm ´ 4.6 mm) 5m make:Waters column, using gradient elution of mobile phase-A (prepare a mixture of 500 volumesof pH 3.0 buffer solution and 500 volumes of methanol) and mobile phase-B (prepare amixture of 40 volumes of pH 3.0 buffer solution and 960 volumes of methanol) at a flow rateof 1.0 ml/minute. The buffer solution was prepared by dissolving 7.5 g of 1-octane sulfonicacid sodium salt in water and adjusting the pH to 3.0 with ortho-phosphoric acid. The columnoven temperature and sample temperature was maintained at 27°C and ambient respectively.Detection was performed at 240 nm. The injection volume was set to 20μl and the run time ofthis method is 65 minutes. The retention time of the Imatinib peak was found to be about 21minute. The method was further evaluated for its stability indicating capability by acidhydrolysis, alkali hydrolysis, water hydrolysis, oxidation degradation, thermal degradationand photolytic degradation. All acceptance criteria of International Conference onHarmonization guideline for validation were covered in method validation. This method canbe used for quality control sample during manufacture and during stability sample analysis.Keywords: Related substances, Imatinib, Stability-indicating, Development,Validation.
1. Introduction
Imatinib is an antineoplasticdrug used to treat leukemia, especially chronicmyelogenousleukemia(CML), certain types of adult acute lymphocytic leukemia and number of other cancers. It is also used in thetreatment of gastrointestinal stromal tumors (GISTs) and a muscle cancer called dermatofibrosarcomaprotuberans. Imatinib is chemically a 2-phenylaminopyrimidine derivative which functions as a specificinhibitor of a number of tyrosine kinase. Imatinib is like all tyrosine-kinase inhibitors acts by inhibiting atyrosine kinase enzyme in this case BCR-Abl from phosphorylating subsequent proteins and starting thesignalling cascade necessary for cancer growth and death. Thus, preventing the growth of cancer cells and
Rutesh Shah et al /Int.J. PharmTech Res. 2015,8(6),pp 128-146. 129
leading to their death by apoptosis. The BCR-Abl tyrosine kinase enzyme is over expressed in cancer cells only.Imatinib is one of the first anticancer drug to showthe potential targeted action [1-6].
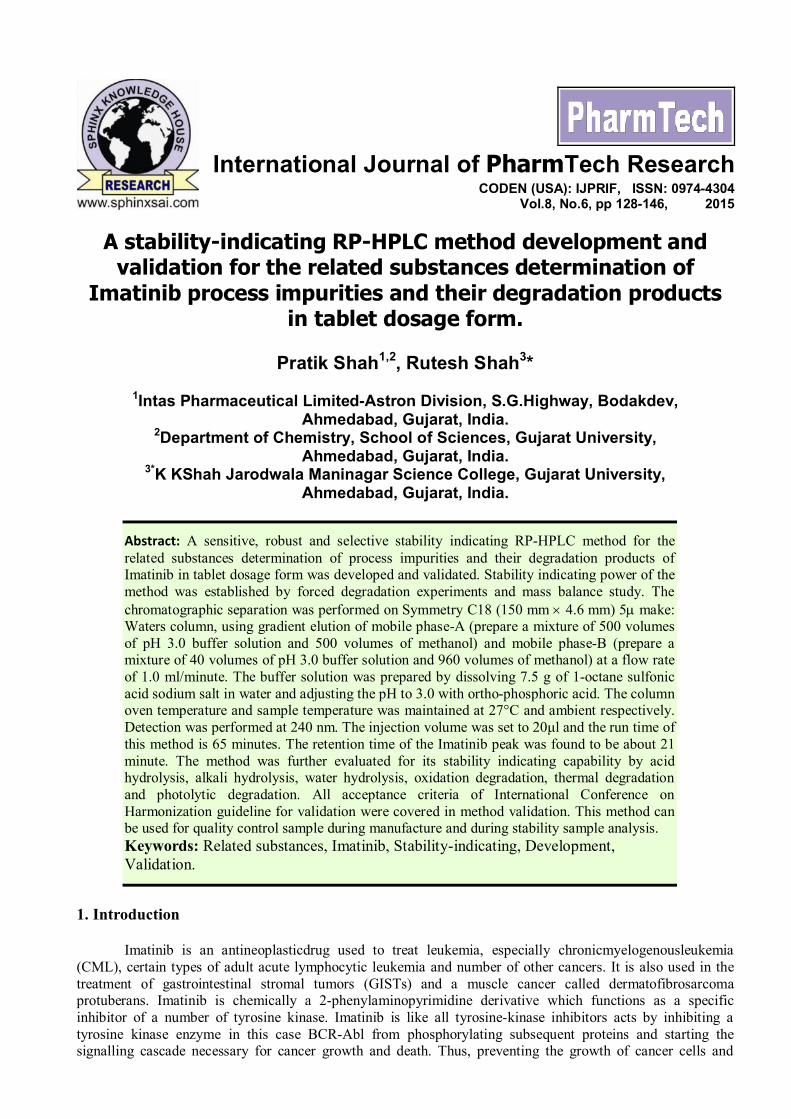
Chemically Imatinib mesylate is 4-[(4-Methyl-1-piperazinyl) methyl]-N-[4-methyl-3-[[4-(3-pyridinyl)-2-pyrimidinyl]amino]phenyl]benzamid methane sulfonate with molecular weight 589.7 g/mol. The chemicalstructure has shown in Figure 1. Imatinib mesylate is approved by the US food and drug administration for thetreatment of chronic myeloid leukemia (CML) a rare kind of cancer. Imatinib is being sold under the tradename “Gleevec” or “Glivec” with dosage forms of 100mg and 400mg respectively. Imatinib has been alsoregistered in Indian Pharmacopoeia (IP).
Figure 1: Imatinibmesylate
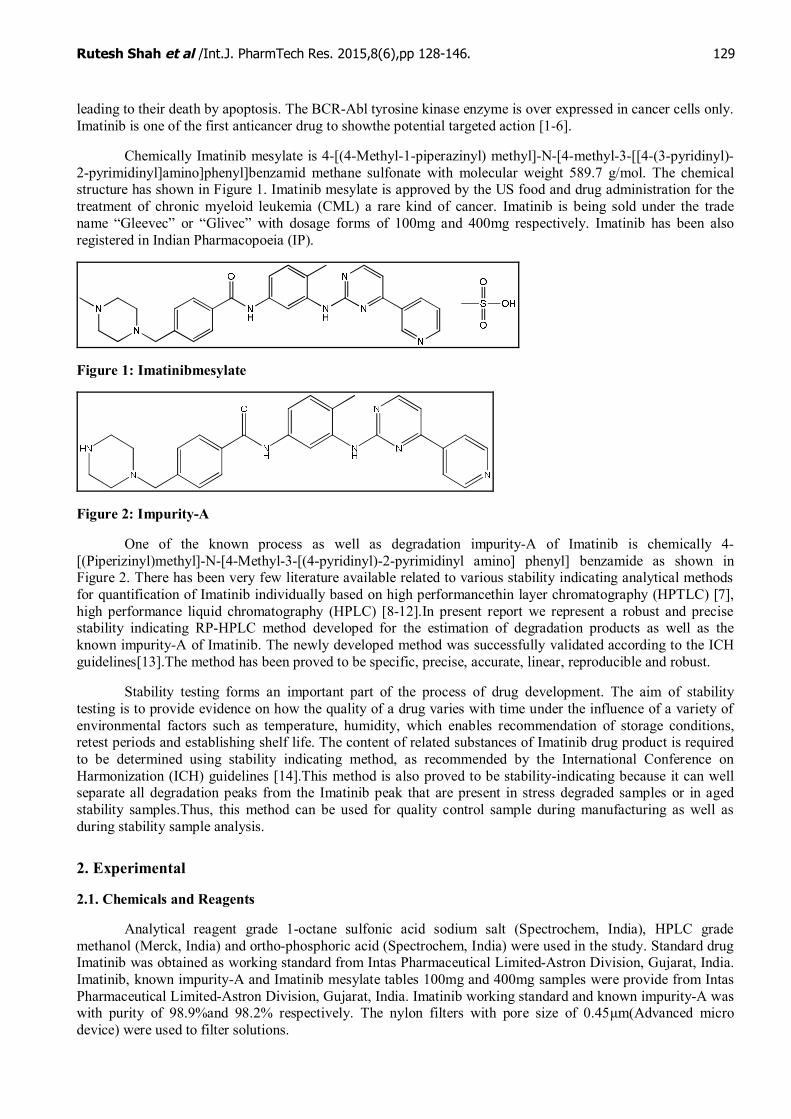
Figure 2: Impurity-A
One of the known process as well as degradation impurity-A of Imatinib is chemically 4-[(Piperizinyl)methyl]-N-[4-Methyl-3-[(4-pyridinyl)-2-pyrimidinyl amino] phenyl] benzamide as shown inFigure 2. There has been very few literature available related to various stability indicating analytical methodsfor quantification of Imatinib individually based on high performancethin layer chromatography (HPTLC) [7],high performance liquid chromatography (HPLC) [8-12].In present report we represent a robust and precisestability indicating RP-HPLC method developed for the estimation of degradation products as well as theknown impurity-A of Imatinib. The newly developed method was successfully validated according to the ICHguidelines[13].The method has been proved to be specific, precise, accurate, linear, reproducible and robust.
Stability testing forms an important part of the process of drug development. The aim of stabilitytesting is to provide evidence on how the quality of a drug varies with time under the influence of a variety ofenvironmental factors such as temperature, humidity, which enables recommendation of storage conditions,retest periods and establishing shelf life. The content of related substances of Imatinib drug product is requiredto be determined using stability indicating method, as recommended by the International Conference onHarmonization (ICH) guidelines [14].This method is also proved to be stability-indicating because it can wellseparate all degradation peaks from the Imatinib peak that are present in stress degraded samples or in agedstability samples.Thus, this method can be used for quality control sample during manufacturing as well asduring stability sample analysis.
2. Experimental
2.1. Chemicals and Reagents
Analytical reagent grade 1-octane sulfonic acid sodium salt (Spectrochem, India), HPLC grademethanol (Merck, India) and ortho-phosphoric acid (Spectrochem, India) were used in the study. Standard drugImatinib was obtained as working standard from Intas Pharmaceutical Limited-Astron Division, Gujarat, India.Imatinib, known impurity-A and Imatinib mesylate tables 100mg and 400mg samples were provide from IntasPharmaceutical Limited-Astron Division, Gujarat, India. Imatinib working standard and known impurity-A waswith purity of 98.9%and 98.2% respectively. The nylon filters with pore size of 0.45μm(Advanced microdevice) were used to filter solutions.
Rutesh Shah et al /Int.J. PharmTech Res. 2015,8(6),pp 128-146. 130
2.2. Instrumentations
HPLC system (Make: Agilent HPLC 1100/1200 series, USA) equipped withauto sampler andquaternary pump with degasser was used.The column component having temperature control, UVdetector andDAD detector was used during the analysis. Symmetry C18 (150 mm X 4.6 mm, 5µ) Make: Waters column wasused.Chromatographic data were monitored and processed by using Chromeleon software.Calibrated analyticalbalance Sartorius (Model: BT 224S), Mettler Toledo (Model: MX5), pH meter of lab India (Model: Pico+) andultrasonic cleaner of equitron were used during the analysis.
2.3. Chromatographic conditions
The chromatographic separation was carried out on a Symmetry C18 column (150 mm ´ 4.6 mm) 5m ofwaters make. The separation was achieved by at flow rate of 1.0 ml/minute with a gradient program of (T/%B)0.01/00; 15/20; 45/65; 55/65; 60/00; 65/00. The detection was observed at a wavelength of 240 nm. The columnoven temperature was maintained at 27°C and sample temperature was maintained at ambient temperature. Theinjection volume was 20μl. The retention time of Imatinib peak was obtained about 21 minute. Prepare amixture of 450 ml volumes of water and 550 ml volumes of methanol and mix well as diluent.
2.4. Preparation of buffer solution
Dissolved an accurately weighed 7.5g of 1-octane sulfonic acid sodium salt in to 1000 ml of water.Adjust the pH 3.00 with ortho-phosphoric acid. Filter through 0.45 µ nylon filter.
2.5. Preparation of Mobile phase-A
Prepare a mixture of 500 ml volumes of buffer solution and 500 ml volumes of methanol and mix well.Degas before use.
2.6. Preparation of Mobile phase-B
Prepare a mixture of 40 ml volumes of buffer solution and 960 ml volumes of methanol and mix well.Degas before use.
2.7. Preparation of solutions
2.7.1. Diluted standard preparation
Diluted standard preparation was prepared by dissolve Imatinib working standard in diluent to obtainthe concentration of 1μg/ml of imatinib.
2.7.2. Sample preparation
Transfer an accurately weigh quantity of 5 intact tablets in to 250 ml volumetric flask. Add 150 ml ofdiluent, disperse for about 15 minutes and sonicate for 15 minutes taking care to maintain temperature ofultrasonic bath below 20°C. Dissolve and dilute to volume with diluent, mix well (concentration of samplestock preparation was 2000µg/ml). Centrifuge the solution at 1500 rpm for 10 minutes and then filter through0.45µ nylon filter. Discard first few ml of the filtrate. Further, transfer an accurately 5.0 ml of this solution intoa 20 ml volumetric flask and dilute to volume with diluent and mix well. Concentration of sample preparationwas 500μg/ml.
2.8. Method validation
The proposed method was validated for the related substances of Imatinib by HPLC as per ICHguidelines for perform all parameters like specificity, stability of analyte in solution, limit of detection (LOD),limit of quantification (LOQ), linearity, precision, accuracy and robustness. Validation shown the method isspecific, accurate, precise, reliable and reproducible. Analytical method validation covers all acceptance criteriadefined in ICH guidelines.
2.8.1. Specificity
Specificity studies were performed to show selectivity and stability indicating capacity of the proposedmethod. Specificity of the method was studied by injecting single injection of diluent, placebo preparation (asper sample preparation method) containing all inactive ingredients in the same proportion as in the formulation.
Rutesh Shah et al /Int.J. PharmTech Res. 2015,8(6),pp 128-146. 131
Known impurity-A preparation for identification was prepared by dissolve in methanol to obtain theconcentration of 1μg/ml and final dilution was prepared with diluent. Prepare diluted standard preparation,sample preparation as per method and Sample preparation spiked with known impurity-A as per mentionedbelow.
Sample preparation spiked with known impurity-A: Transfer 5 ml of this sample stock preparation(concentration of 2000µg/ml) into 20 ml volumetric flask and add 1 ml known impurity-A stock preparationinto the volumetric flask. Dilute to volume with diluent and mix well. Concentration of known impurity-A stockpreparation was 20μg/ml.
Inject single injection of known impurity-A preparation for identification and injection of dilutedstandard preparation, sample preparation, sample preparation spiked with known impurity-A in to liquidchromatographic system & record the chromatograms. Identify the peaks due to these known impurity-A andImatinib by retention time.
Force degradation studies were performed on Imatinib formulation to evaluate the stability indicatingnature of the proposed method for the determination of assay(for mass balance only) and related substances ofImatinib mesylate in Imatinib mesylate tablet in the presence of excipients.Individual impurity, total impuritiesand degradation products were calculated by diluted standard preparation. Assay was calculated by areanormalization for mass balance only. Blank as diluent, placebo, Imatinib diluted standard and sample of tabletswere exposed to acid hydrolysis (Treat 5 intact tablets with 4.0 ml of 5M hydrochloric acid and keepundisturbed for 24 hours at 60°C temperature), Alkali hydrolysis (Treat 5 intact tablets with 4.0 ml of 2Msodium hydroxide methanolic and keep undisturbed for 4 hours at 60°C temperature), Peroxide oxidationdegradation (Treat 5 intact tablets with4.0 ml of 3% hydrogen peroxide and keep undisturbed for 90 minutes atroom temperature), Thermal degradation (Heat intact tablets for 72 hours at 105°C in oven), photolyticdegradation (Expose the intact tablets under UV light for 72 hours) and water hydrolysis (Treat 5 intact tabletswith 4.0 ml of water and keep undisturbed for 72 hours at 60°C temperature) degradation conditions.All forcedegradation conditions sample preparations were analyzed by proposed method on photodiode array detector.
2.8.2.Stability of analyte in solution
Stability of analyte in solution for diluted standard preparation prepared as per method and samplepreparation spiked with known impurity-A prepared as per specificity have been performed at 23-27°C and notprotected from light. Store above prepared solution under 23-27°C and not protected from light in tight flask.Inject single injection of the stored solution at different time intervals at about initial, 8, 16, 24 and 48 hours andrecord the peak response at each time interval. In diluted standard preparation, calculate the relative standarddeviation of the initial and each time interval area individually. Establish the time interval up to which thestandard is stable based on the relative standard deviation value. In sample preparation spiked with knownimpurity-A, determine the percentage impurity and calculate the absolute difference or percentage difference asapplicable in results value at each time interval against respective initial results.
2.8.3. Limit of detection (LOD) & Limit of quantification (LOQ)
For LOD and LOQ determination, prepare five different concentration level linearity of knownimpurity-A and Imatinib ranging from 10% to 25% of limit concentration as per ICH guideline (limitconcentration of known impurity-A and Imatinib 100% linearity level is 1µg/ml). Inject each standard solutionand plot a linearity curve of area versus concentration. From the linearity data, find out the slope(S) and residualstandard deviation (σ) of the regression line. Calculate the LOD and LOQ concentration from the equation aregiven 3.3*σ/S and 10*σ/S respectively.
For LOD and LOQ confirmation, prepare the LOD and LOQ solutions obtained from the aboveformula. The LOD and LOQ solutions containing both Imatinib and known impurity-A were injected sixreplicate injections to achieve LOD and LOQ by signal to noise ratio (S/N) method as per ICH guideline. Thepercentage relative standard deviation values were determined for each peak by injecting six replicates at LOQconcentration level.
Rutesh Shah et al /Int.J. PharmTech Res. 2015,8(6),pp 128-146. 132
2.8.4. Linearity
The linearity of the method was prepared different linearity level solutions in diluent with finalconcentrations from LOQ, 0.500, 0.700, 0.900, 1.000, 1.100 and 1.200μg/ml (LOQ to 120%) of limitconcentration (1µg/ml) for Imatinib and known impurity-A.Plot a linearity curve of concentration in µg/mlverses area. Calculate the response factor for each concentration level. Calculate correlation coefficient, slope ofregression line, Y-intercept, R2value, %Y-intercept bias at 100% concentration level. Calculate relative standarddeviation of response factor for 50% to 120% concentration level.
2.8.5. Precision
2.8.5.1. System precision
Prepare diluted standard preparation as per method. Inject six replicate injections of diluted standardpreparation in to liquid chromatographic system and record the chromatograms. Determine the mean andrelative standard deviation of replicate injections with respect of area and retention time for Imatinib peak.Record tailing factor and theoretical plates for the Imatinib peak.
2.8.5.2. Method precision
Prepare six sets of sample preparation spiked with known impurity-A prepare same as per specificity.Calculate the mean and relative standard deviation of test results.
2.8.5.3. Intermediate precision
To demonstrate the intermediate precision study, repeat the method precision study using same samplepreparation but under different conditions like different day, different analyst, different instrument, differentcolumn (Same dimension, same supplier with different serial no. column).Calculate the mean and relativestandard deviation of six sets test results. Compare the results obtained between method precision andintermediate precision study.Calculate absolute difference or percentage difference as applicable in impurityresults value obtained between method precision and intermediate precision study.
2.6. Accuracy (Recovery)
To perform the accuracy of the proposed method, recovery experiments were carried out by standardaddition technique. The accuracy of the method was calculated in triplicate preparation at four differentconcentration levels - LOQ, 50%, 100% and 120% of the limit concentration 1μg/ml considering 100%accuracy level.
To prepare recovery solution for known impurity-A, prepare sample preparation as such to be used forsubtracting the known impurity-A result in the recovery solutions. Known impurity-A stock solutionpreparation was prepared by dissolve known impurity-A in methanol and make up with diluent to obtain theconcentration of 20μg/ml. Prepare recovery solution for known impurity-A as per below mentioned Table 1.
Table 1: Recovery solution for Impurity-A
Recovery level
Weight ofsample tobe taken
in mg
Impurity-Astock
solution tobe taken in
ml
Recoverysolution in
diluent(Stock
solution)
Stocksolution takenin ml
Finalvolume
withdiluent in
ml
Concentrationof Impurity-A
in µg/ml
LOQ To be decided after LOQ confirmation50% 25.0 250 5.0 20 0.500
100% 50.0 250 5.0 20 1.000120%
5 Intacttablet
60.0 250 5.0 20 1.200
Rutesh Shah et al /Int.J. PharmTech Res. 2015,8(6),pp 128-146. 133
Table 2: Recovery solution for unknown impurities
Recovery level
Weight ofplacebo tobe taken in
mg
Imatinibstock
solution tobe taken in
ml
Recoverysolution
in diluent(Stock
solution)
Stocksolutiontaken in
ml
Finalvolume
withdiluent in
ml
Concentrationof Imatinib in
µg/ml
LOQ 377.5 To be decided after LOQ confirmation50% 377.5 1.0 250 5.0 20 0.500
To prepare recovery solution for unknown impurities spiked Imatinib working standard, into placebo.Transfer an accurately weigh quantity of placebo powder and required volume of Imatinib stock solution as perbelow mentioned Table 2. Imatinib stock solution preparation was prepared by dissolve Imatinib workingstandard in diluent to obtain the concentration of 500μg/ml.
Calculate the percentage recovery for known impurity-A and Imatinib for all recovery samples.Calculate the mean percentage recovery, relative standard deviation for each level. Also calculate the overallpercentage recovery and relative standard deviation for all results.
2.7. Robustness
To determine the robustness of the analytical method, experimental conditions were deliberatelyaltered. The small change in chromatographic condition were studied by testing influence of minor variation inthe flow rate (±0.2 ml/minute) (0.8 ml/minute and 1.2 ml/minute), variation in column oven temperature (±2°C)(25°C and 29°C), variations in pH of mobile phase buffer (±0.2 pH) (2.8 pH and 3.2 pH), variation in extractiontime (± 5 minute) (i.e. 10 minute and 20 minute), variation in mobile phase-A composition (± 5%) (i.e. ±5% ofmethanol solvent in mobile phase-A mixture) and variation in mobile phase-B composition (± 2%) (i.e. ±2% ofmethanol solvent in mobile phase-B mixture). Calculate the absolute difference or percentage differenceasapplicable in individual impurity and total impurities results value obtained between the varied method andmethod precision study results value. If system suitability is not comparable with unaltered method, perform therobustness with less variable parameters.
3. Results and Discussion
3.1. Method development and optimization of chromatographic parameters
The method was started to develop at lower carbon loading Hypersil BDS C18 (150 mm ´ 4.6 mm) 5mcolumn with isocratic elution by using as mobile phase a mixture of contain 7.5 g/l potassium dihydrogenphosphate adjust pH 3.0 with ortho-phosphoric acid as buffer solution and methanol ratio of 50:50 (V/V) at aflow rate 1.0 ml/minute, column oven temperature was 27°C, detection was performed at 240 nm, sampleconcentration was 500µg/ml and 20µl injection volume was injected. But this method trail known impurity-Apeak merged with imatinib peak. Then, higher carbon loading column may be helpful to well separate bothpeak. So, Hypersil BDS C18 (150 mm ´ 4.6 mm) 5m column was replaced by Symmetry C18 (150 mm ´ 4.6mm) 5m column. But this trial in Symmetry C18 column both peak Imatinib and known impurity-A were notseparate. Further, ion pairing reagent may be helpful for well separation peak. Hence, potassium dihydrogenphosphate reagent which was used in mobile phase as buffer solution replaced with 1-octane sulfonic acidsodium salt. But till peak shape of imatinib was not good. Peak of known impurity-A and Imatinib were mergedwith each other impurity. However, to further the gradient program was used with a gradient elution where thegradient program (T/%B) was set as 0.01/0; 15/20; 45/40; 55/65; 60/0; 65/0 at flow rate 1.0 ml/minute. In thisgradient program, this method was introduced for separation of all impurities and Imatinib peak in whichmobile phase-A contain 7.5 g/l of 1-Octane sulfonic acid sodium salt adjust pH 3.00 with ortho-phosphoric acidas buffer and methanol ratio 50:50 (V/V), While mobile phase-B Contain same buffer and Methanol ratio 4:96(V/V) in with both peak Imatinib and known impurity-A are well separate but during force degradation studyunknown peak are merged with known impurity-A peak.So, further the gradient program was changed with agradient elution where the gradient program (T/%B) was set as 0.01/0; 15/20; 45/65; 55/65; 60/0; 65/0 at flowrate 1.0 ml/minute. Known impurity-A, Imatinib and unknown impurities peaks are well separated in this
Rutesh Shah et al /Int.J. PharmTech Res. 2015,8(6),pp 128-146. 134
gradient program. Hence, force degradation study was conducted in this final program and finalized this methodfor further validation.
3.2. Method validation
3.2.1. Specificity
No interference is observed at the retention time of Imatinib and known impurity-A peak due to thediluent and placebo preparation. Peak obtained due to known impurity-A at the retention time of 17.602 minuteinknown impurity-A solution for identification. Imatinib peak is observed at the retention time of 21.066 minutein diluted standard preparation. Peak obtained due to Imatinib and four unknown impurity at the retention time20.966, 5.977, 11.201, 14.231 and 31.730 minutes respectively in sample preparation as such. Peak obtaineddue to known impurity-A, Imatinib and unknown impurity at the retention time of 17.730, 21.065 and 31.688minutes respectively in sample preparation spiked with known impurity-A. Imatinib peak is well separated fromknown impurity-A and all unknown impurities peaks. Imatinib peak in the sample preparation spiked withknown impurity-A is spectrally pure. Peak purity match value is 998 and 999 respectively known impurity-Aand Imatinib for sample preparation spiked with known impurity-A. Chromatograms of specificity werepresented in Figure 3.
(A)
(B)
(C)
Rutesh Shah et al /Int.J. PharmTech Res. 2015,8(6),pp 128-146. 135
(D)
(E)
(F)
(G)
(H)
Rutesh Shah et al /Int.J. PharmTech Res. 2015,8(6),pp 128-146. 136
(I)
(J)
(K)
(L)
Figure 3: Chromatograms for specificity and force degradation studies (A) Diluent (B) Placebopreparation (C) diluted standard preparation (D) Impurity-A preparation for identification (E) Samplepreparation spiked with known impurity-A (F) Sample preparation (Test as such) (G) Acid hydrolysis(H) Alkali hydrolysis (I) Peroxide oxidation degradation (J) Thermal degradation (K) Photolyticdegradation (L) water hydrolysis
Rutesh Shah et al /Int.J. PharmTech Res. 2015,8(6),pp 128-146. 137
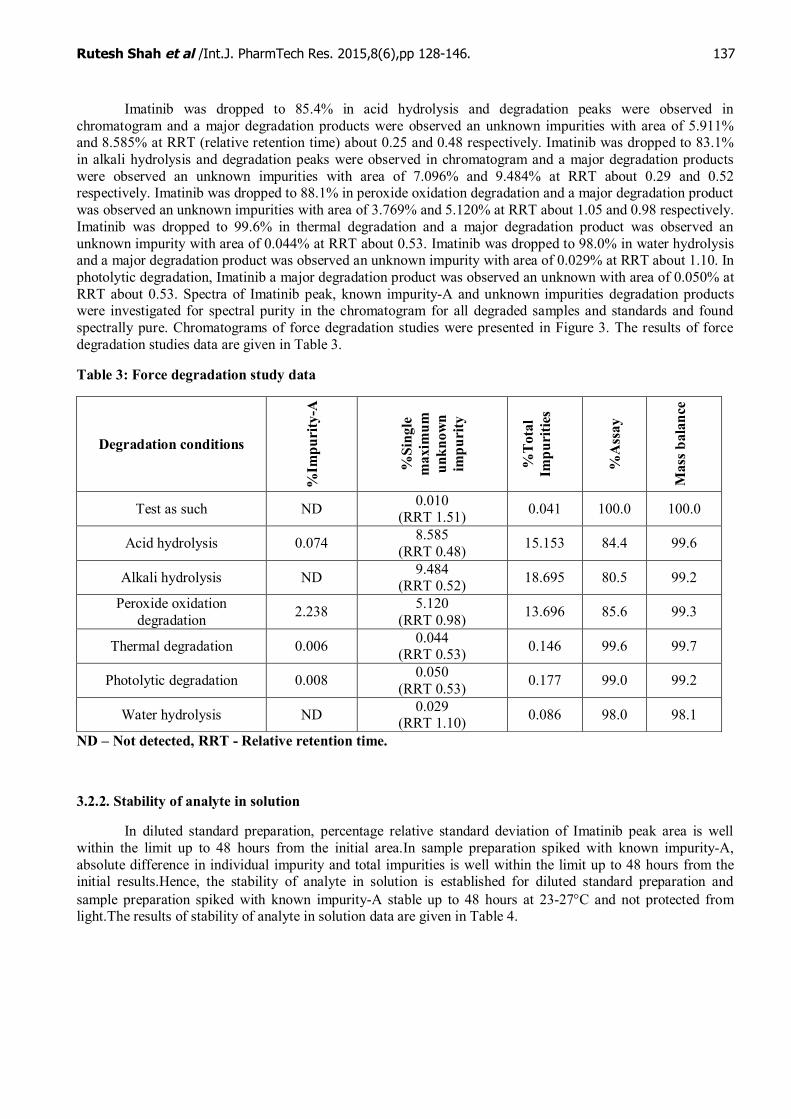
Imatinib was dropped to 85.4% in acid hydrolysis and degradation peaks were observed inchromatogram and a major degradation products were observed an unknown impurities with area of 5.911%and 8.585% at RRT (relative retention time) about 0.25 and 0.48 respectively. Imatinib was dropped to 83.1%in alkali hydrolysis and degradation peaks were observed in chromatogram and a major degradation productswere observed an unknown impurities with area of 7.096% and 9.484% at RRT about 0.29 and 0.52respectively. Imatinib was dropped to 88.1% in peroxide oxidation degradation and a major degradation productwas observed an unknown impurities with area of 3.769% and 5.120% at RRT about 1.05 and 0.98 respectively.Imatinib was dropped to 99.6% in thermal degradation and a major degradation product was observed anunknown impurity with area of 0.044% at RRT about 0.53. Imatinib was dropped to 98.0% in water hydrolysisand a major degradation product was observed an unknown impurity with area of 0.029% at RRT about 1.10. Inphotolytic degradation, Imatinib a major degradation product was observed an unknown with area of 0.050% atRRT about 0.53. Spectra of Imatinib peak, known impurity-A and unknown impurities degradation productswere investigated for spectral purity in the chromatogram for all degraded samples and standards and foundspectrally pure. Chromatograms of force degradation studies were presented in Figure 3. The results of forcedegradation studies data are given in Table 3.
Water hydrolysis ND 0.029(RRT 1.10) 0.086 98.0 98.1
ND – Not detected, RRT - Relative retention time.
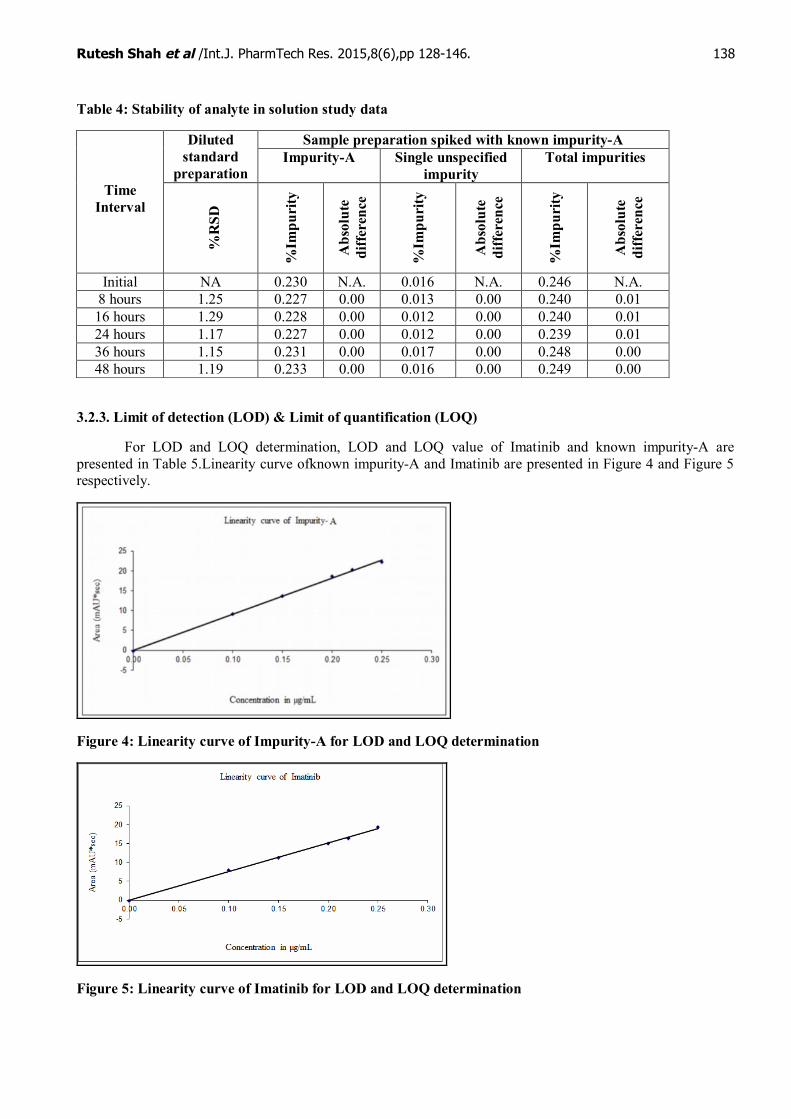
3.2.2. Stability of analyte in solution
In diluted standard preparation, percentage relative standard deviation of Imatinib peak area is wellwithin the limit up to 48 hours from the initial area.In sample preparation spiked with known impurity-A,absolute difference in individual impurity and total impurities is well within the limit up to 48 hours from theinitial results.Hence, the stability of analyte in solution is established for diluted standard preparation andsample preparation spiked with known impurity-A stable up to 48 hours at 23-27°C and not protected fromlight.The results of stability of analyte in solution data are given in Table 4.
Rutesh Shah et al /Int.J. PharmTech Res. 2015,8(6),pp 128-146. 138
Table 4: Stability of analyte in solution study data
Sample preparation spiked with known impurity-ADilutedstandard
3.2.3. Limit of detection (LOD) & Limit of quantification (LOQ)
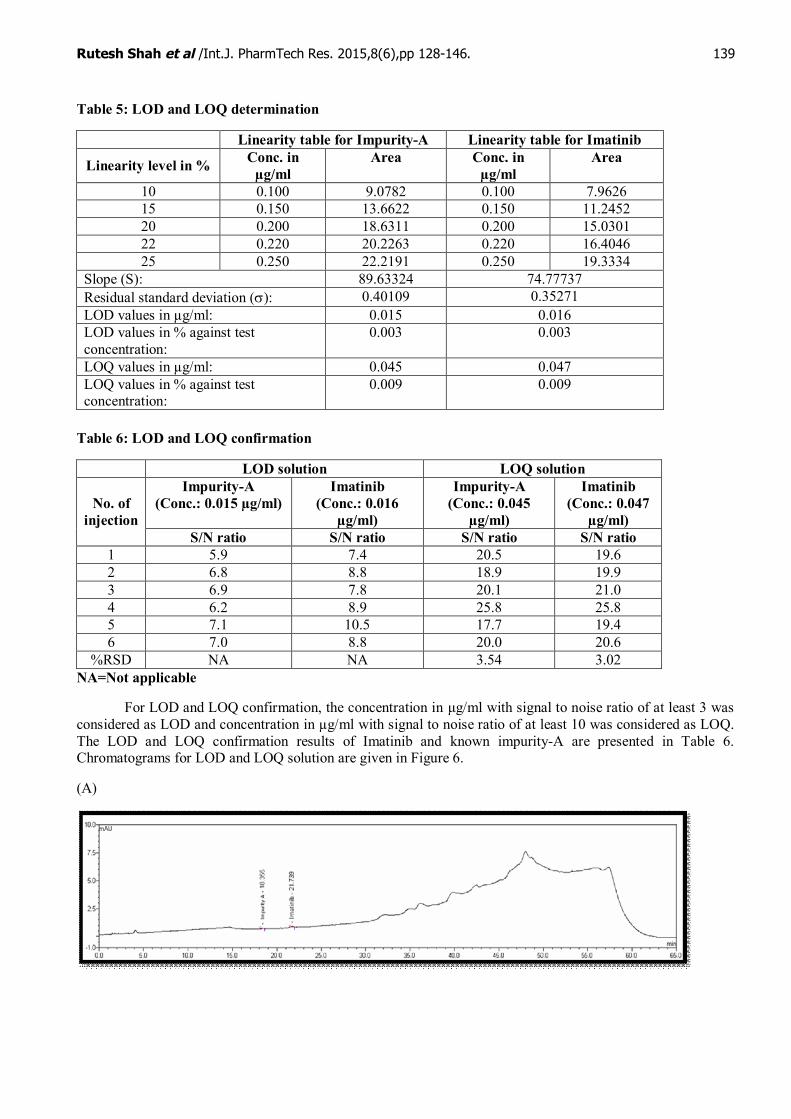
For LOD and LOQ determination, LOD and LOQ value of Imatinib and known impurity-A arepresented in Table 5.Linearity curve ofknown impurity-A and Imatinib are presented in Figure 4 and Figure 5respectively.
Figure 4: Linearity curve of Impurity-A for LOD and LOQ determination
Figure 5: Linearity curve of Imatinib for LOD and LOQ determination
Rutesh Shah et al /Int.J. PharmTech Res. 2015,8(6),pp 128-146. 139
Table 5: LOD and LOQ determination
Linearity table for Impurity-A Linearity table for Imatinib
For LOD and LOQ confirmation, the concentration in μg/ml with signal to noise ratio of at least 3 wasconsidered as LOD and concentration in µg/ml with signal to noise ratio of at least 10 was considered as LOQ.The LOD and LOQ confirmation results of Imatinib and known impurity-A are presented in Table 6.Chromatograms for LOD and LOQ solution are given in Figure 6.
(A)
Rutesh Shah et al /Int.J. PharmTech Res. 2015,8(6),pp 128-146. 140
(B)
Figure 6: Chromatograms for (A) LOD solution (B) LOQ solution
3.2.4. Linearity
Linearity curve of known impurity-A and Imatinib are presented in Figure 7 and Figure 8 respectively.The results of linearity for known impurity-A and Imatinib are given in Table 7 and Table 8 respectively.
Figure 7: Linearity curve of Impurity-A
Figure 8: Linearity curve of Imatinib
Rutesh Shah et al /Int.J. PharmTech Res. 2015,8(6),pp 128-146. 141
Table 7: Linearity table for Impurity-A
Linearity levelin % Concentration in µg/mL Area Response FactorLOQ 0.045 4.1949 93.220
Correlation Coefficient: R2 value: Y-Intercept: Slope: %RSD of Response factor: % Y-Intercept bias at 100 % level:
Relative response factor:
0.999580.99916-0.0378872.19700
1.84-0.11.00
3.2.5. Precision
3.2.5.1. System precision
System suitability parameters are well within the limit. System suitability acceptance Criteria andresults are given in Table 9.
Table 9: System precision
3.2.5.2. Method precision and Intermediate precision
Percentage relative standard deviation of six results for each individual impurity and total impurities iswell within the limit. Absolute difference in individual impurity and total impurities is well within the limitfrom the impurity values obtained from method precision study. Method precision and intermediate precisionresults are given in Table 10.
System suitability parameters Results Acceptance Criteria%Relative standard deviation of replicate injections for Imatinib peak area 0.45% Not more than 5.00%Theoretical plates (by tangent method) for Imatinib peak 25533 Not less than 2000Tailing factor for Imatinib peak 1.21 Not more than 2.0% Relative standard deviation of replicate injections for retention time forImatinib peak 0.20 Not more than 1.0
Rutesh Shah et al /Int.J. PharmTech Res. 2015,8(6),pp 128-146. 142
Table 10: Comparison between method precision and intermediate precision
Recovery of known impurity-A and Imatinib is well within the limit. Percentage relative standarddeviation for recovery at each level is well within the limit. Over all percentage relative standard deviation forall the levels is well within the limit. Accuracy results are given in Table 11.
Table 11: Accuracy (Recovery)
Recovery data forImpurity-A Recovery data forImatinib
Rutesh Shah et al /Int.J. PharmTech Res. 2015,8(6),pp 128-146. 143
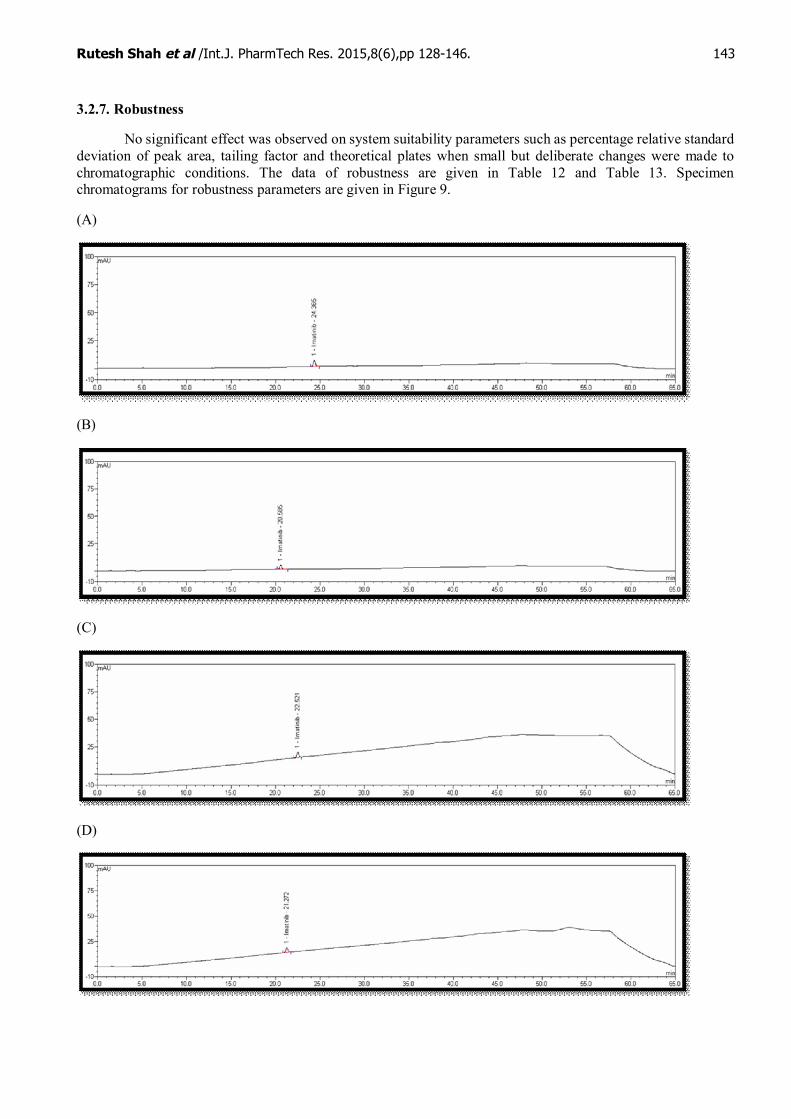
3.2.7. Robustness
No significant effect was observed on system suitability parameters such as percentage relative standarddeviation of peak area, tailing factor and theoretical plates when small but deliberate changes were made tochromatographic conditions. The data of robustness are given in Table 12 and Table 13. Specimenchromatograms for robustness parameters are given in Figure 9.
(A)
(B)
(C)
(D)
Rutesh Shah et al /Int.J. PharmTech Res. 2015,8(6),pp 128-146. 144
(E)
(F)
(G)
(H)
(I)
Rutesh Shah et al /Int.J. PharmTech Res. 2015,8(6),pp 128-146. 145
(J)
Figure 9: Specimen chromatograms for robustness parameters(A) Variation in flow rate (- 0.2 mL/minute): 0.8 mL/minute (Actual 1.0 mL/minute)(B) Variation in flow rate (+ 0.2 mL/minute): 1.2 mL/minute (Actual 1.0 mL/minute)(C) Variation in column oven temperature (- 2°C): 25°C (Actual 27°C)(D) Variation in column oven temperature (+ 2°C): 29°C (Actual 27°C)(E) Variation in pH of mobile phase buffer: (- 0.2 pH): 2.8 pH (Actual 3.0 pH)(F) Variation in pH of mobile phase buffer: (+ 0.2 pH): 3.2 pH (Actual 3.0 pH)(G) Variation in mobile phase-A composition (-5% methanol solvent)(H) Variation in mobile phase-A composition (+5% methanol solvent)(I) Variation in mobile phase-B composition (-2% methanol solvent)(J) Variation in mobile phase-B composition (+2% methanol solvent)
Table 12: Comparison of system suitability between precision and altered robustness parameters
Rutesh Shah et al /Int.J. PharmTech Res. 2015,8(6),pp 128-146. 146
4. Conclusion
A stability indicating reverse phase high performance liquid chromatography method was effectivelydeveloped and validated for the related substances determination of process impurities and degradation productsof Imatinib in tablet dosage form. The developed method was validated in accordance with ICH guidelines andrecommended stress condition. The method validation results has been proved that the method to be specific,precise, linear, accurate and robust with stability indicating power. Hence, the method can be used for routinequality control analysis and also stability sample analysis. The degradation study results shows that the drug isstable at thermal, photolytic and water hydrolysis conditions.
Acknowledgement
The authors are thankful to Intas Pharmaceutical Limited-Astron Division for providing all thenecessary facilities to carry out this work.
References
1. Imatinib-Wikipedia, (http://en.wikipedia.org/wiki/Imatinib). Accessed 05 June 2014.2. Bakhtiar R., Khemani L., Hayes M., Bedman T., Tse F., Quantification of theanti-leukemia drug
STI571 (GleevecTM) and its metabolite (CGP 74588) inmonkey plasma using a semi-automated solidphase extraction procedure andliquid chromatography-tandem mass spectrometry, J. Pharm. Biomed.Anal., 2002, 28, 1183–1194.
3. Fausel C., Targeted chronic myeloid leukemia therapy: Seeking a cure, Am J Health Syst Pharm., 2007,64, S9-15.
4. Goldman J.M., Melo J.V., Chronic myeloid leukemia-advances in biology and new approaches totreatment, N. Engl. J. Med., 2003, 15, 1451–64.
5. Stegmeier F., Warmuth M., Sellers W.R., Dorsch M., Targeted cancer therapies in the twenty-firstcentury: lessons from imatinib, Clin. Pharmacol. Ther., 2010, 5, 543–52.
6. Frost M.J., Ferrao P.T., Hughes T.P., Ashman L.K.,Juxtamembrane mutant V560GKit is more sensitiveto Imatinib (STI571) compared with wild-type c-kit whereas the kinase domain mutant D816VK it isresistant, Mol. Cancer Ther., 2002, 1, 1115-1124.
7. Vadera N., Subramanian G., Musmade P., Stability-indicating HPTLC determination ofImatinibMesylate in bulk drug and pharmaceutical dosage form, J. Pharm. Biomed. Anal., 2007, 43,722–726.
8. Vivekanand V.V., Sreenivas Rao D., Vaidhyanathan G., Sekhar N.M., AvijitKelkar S., RamachandraPuranik P., A validated LC method for ImatinibMesylate, J. Pharm. Biomed. Anal., 2003, 33, 879–889.
9. Ivanovic D., Medenica M., Jancic B., Malenovic A., Reversed-phase liquid chromatographyanalysis ofImatinibMesylate and impurity product in Glivec®capsules, J. Chromatogr. B, 2004, 800, 253–258.
10. Medenica M., Jancic B., Ivanovic D., Malenovic A., Experimental design inreversed-phase high-performance liquid chromatographic analysis of ImatinibMesylate and its impurity, J. Chromatogr. A,2004, 1031, 243–248.
11. Alkharfy K.M., Khan R.M., Al-Asmari M., Alhadeyah B.H., Ahmad A., Quantitative1 determination ofImatinib Stability under various stress condition, J. Pharm. Bioall. Sci., 2013, 5, 49-52.
12. Maria A.R.,Maria A.M., Maria T.P., Adriana I.S., Validation of an HPLCMethod for the Determinationof ImatinibMesylate in Pharmaceutical dosage, J. Liq. Chrom. Rel. Tech., 2005, 28, 3283-3292.
13. ICH Q2 (R1), Validation of Analytical Procedures: Text and Methodology, 2005.14. ICH Q1A (R2), Stability Testing of New Drug Substances and Products, 2003.