+ All Categories
Home > Documents > International Materials Institute for

International Materials Institute for

Date post: 30-Nov-2021
Category:
Upload: others
View: 0 times
Download: 0 times
Share this document with a friend
30
June 2005 International Materials Institute for NEW FUNCTIONALITY IN GLASSES Glass Tutorial Glass structure by infrared reflectance spectroscopy E.I. Kamitsos Theoretical and Physical Chemistry Institute National Hellenic Research Foundation, Athens, Greece Glass Tutorial Series: prepared for and produced by the International Material Institute for New Functionality in Glass An NSF sponsored program – material herein not for sale Available at www.lehigh.edu/imi
Transcript

June 2005 International Materials Institute for

NEW FUNCTIONALITY IN GLASSES Glass Tutorial

Glass structure by infrared reflectance spectroscopy E.I. Kamitsos

Theoretical and Physical Chemistry InstituteNational Hellenic Research Foundation, Athens, Greece

Glass Tutorial Series: prepared for and produced by theInternational Material Institute for New Functionality in Glass

An NSF sponsored program – material herein not for sale Available at www.lehigh.edu/imi

Outline of presentation

1. Basic principles of vibrational spectroscopy • Comparison of infrared / Raman: common characteristics & differences

in mechanism and selection rules

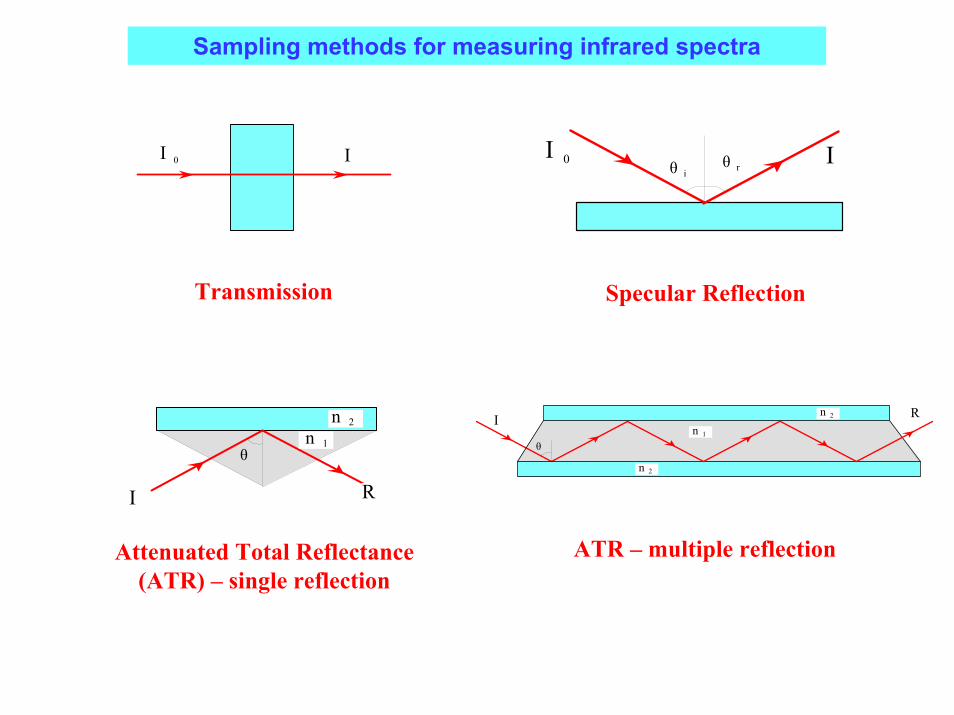
2. Sampling methods in infrared spectroscopy• Advantages of infrared reflectance spectroscopy

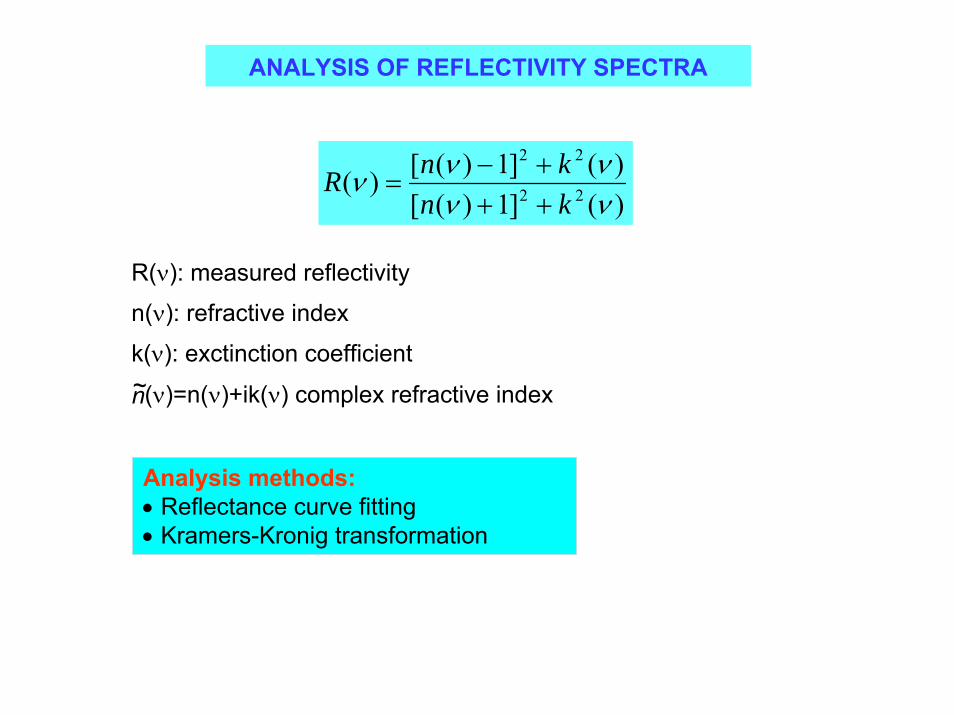
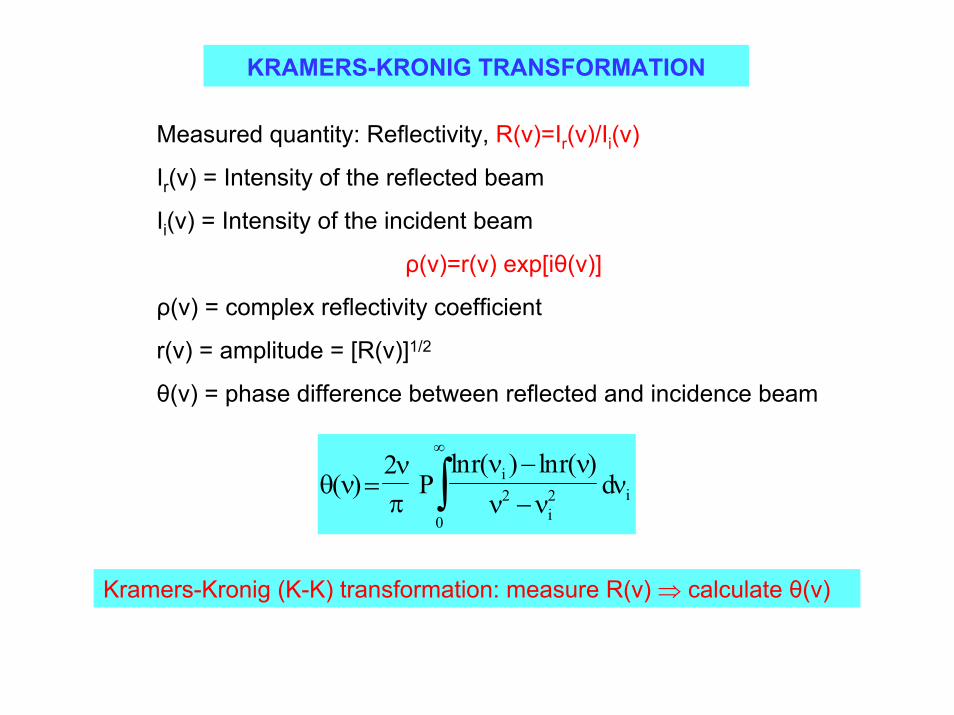
3. Methods of analysis of infrared reflectance spectra • Fitting of reflectivity using classical dispersion theory • Kramers-Kronig (K-K) transformation• Comparison of K-K and reflectivity fitting results

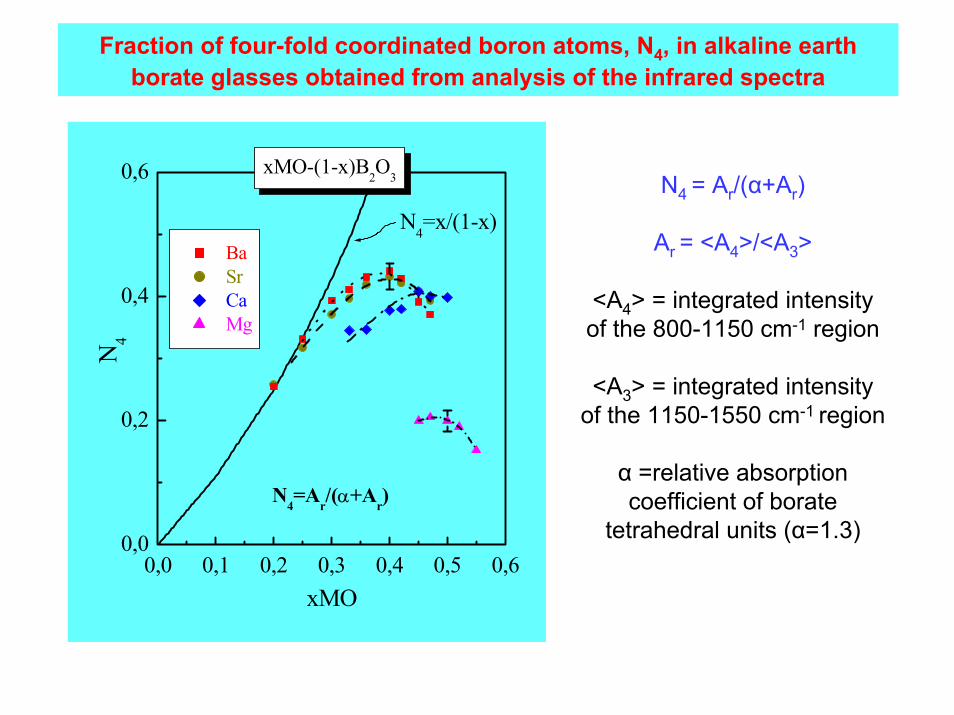
4. Examples of IR reflectance spectroscopy in glass structural studies • Single alkali & alkaline earth borate glasses:

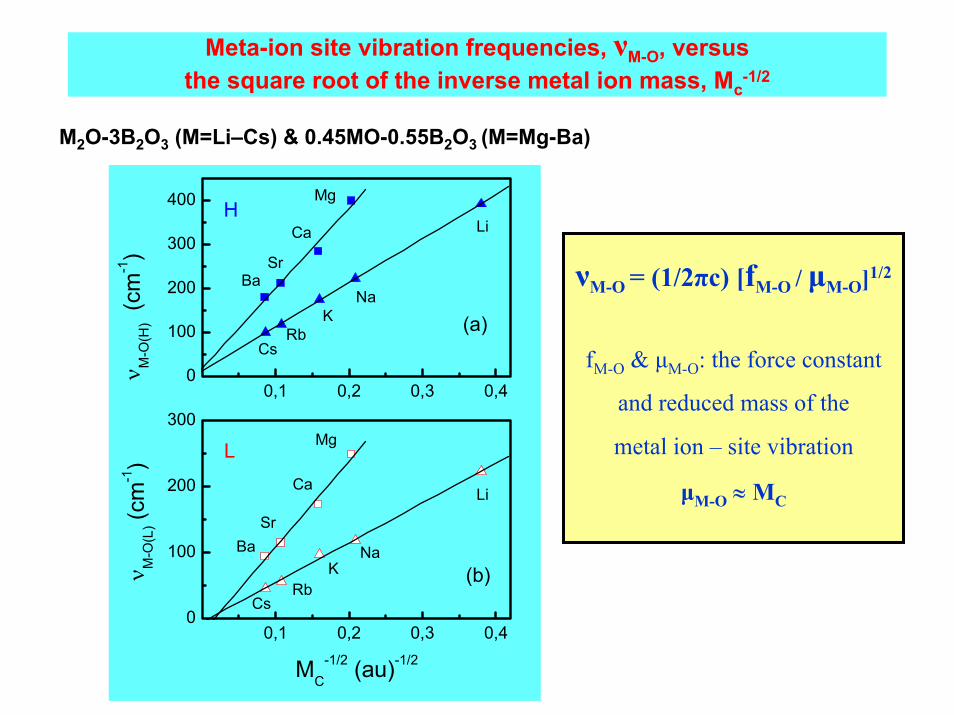
structure of glass network & metal ions sites

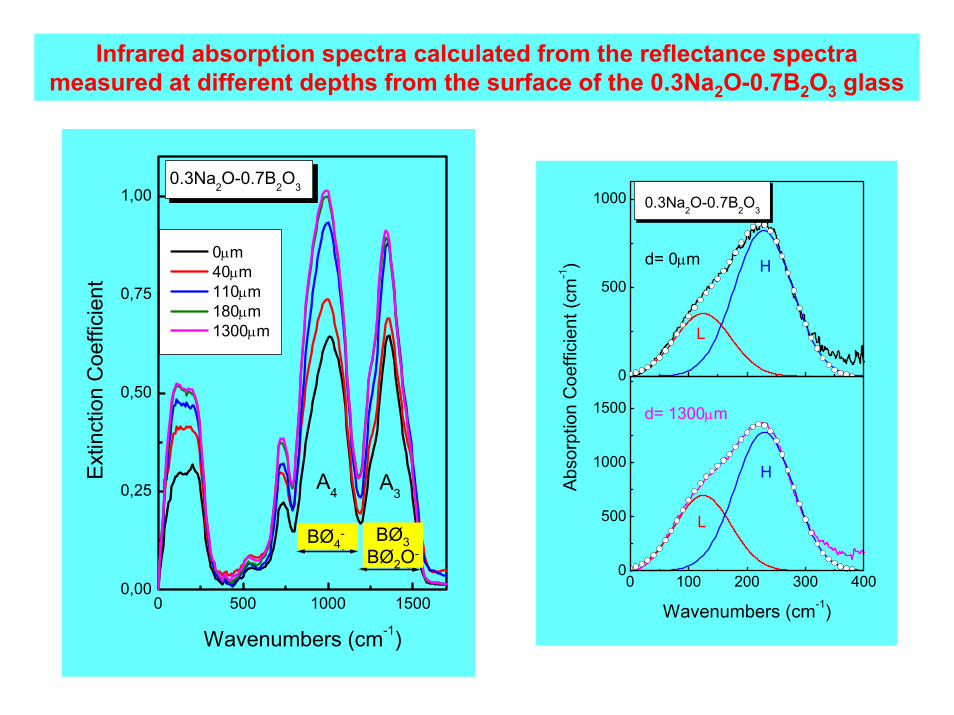
• Dependence of Na-borate glass structure on depth from the glass surface.

Basic principles of vibrational spectroscopy

Electronic, vibrational, rotational transitions

Vibrationaltransition

(in infrared)

Electronictransition

(in optical or uv)

Infrared & Raman spectroscopy in materials scienceCommon characteristics: • Probe structure and bonding through molecular vibrations• Can probe both crystalline and amorphous phases (no long-range order required)• Widely used in materials science

Infrared & Raman spectroscopy: differences in mechanism & selection rules

INFRARED

∆Ε=hνvib

Infrared:• Resonance phenomenon: Ε=hν0=∆Ε=hνvib

• Selection rules (harmonic oscillator): ⇒ ∆n=±1, n: quantum number⇒ (∂µ/∂x)0 ≠ 0, µ: dipole moment

Infrared & Raman spectroscopy: differences in mechanism & selection rules, cont.

RAMAN

inelastic anti-Stokes Raman

<<0.01%

elasticRayleigh>>99.99%

inelasticStokes Raman

<<0.01%

νο νονο-νvibνο νο νο+νvib

∆Ε=hνvib ∆Ε=hνvib ∆Ε=hνvib

Raman:

• Scattering phenomenon: Ε=hν0 >> ∆Ε=hνvib

• Selection rules (harmonic oscillator): ⇒ ∆n=±1, n: quantum number⇒ (∂α/∂x)0 ≠ 0, α: polarizability (µind=αE)

Sampling methods for measuring infrared spectra

I 0 I I 0 Iθ iθ r

Transmission Specular Reflection

I R

θ

n 2

n 2

n 1

I

θ

n 2

R

n 1

ATR – multiple reflectionAttenuated Total Reflectance (ATR) – single reflection

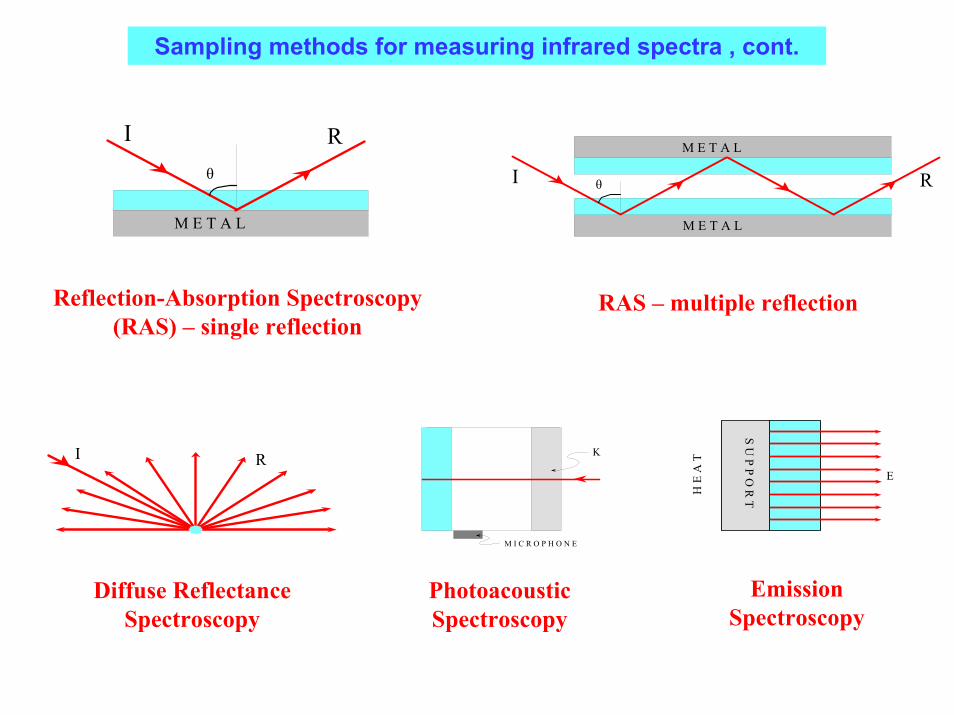
Sampling methods for measuring infrared spectra , cont.

R

M E T A L

Iθ RI θ

M E T A L

M E T A L

Reflection-Absorption Spectroscopy (RAS) – single reflection

RAS – multiple reflection

H E

A T

S U P P O

R T

E

K

M I C R O P H O N E

I R

Emission Spectroscopy

Diffuse Reflectance Spectroscopy

PhotoacousticSpectroscopy

Advantages of infrared reflectance spectroscopy

• True band shapes: - no band distortion and hydrolysis effects associated with the use of alkali halide salts as matrix materials in traditional transmission measurements,

-no saturation effects and background interference patterns encountered in transmission measurements on films.

• Use the same samples for data acquisition in a broad frequency range covering both the mid- and far-infrared (ca. 20 – 5000 cm-1).

• Combined with the use of modern Fourier-transform spectrometers and the availability of software, infrared reflectance leads to the quantitative determination of the frequency-dependent optical and dielectric properties of materials.

⇒ Infrared reflectance spectroscopy is a powerful tool in materials science.

)(]1)([)(]1)([)( 22

22

ννννν

knknR

+++−

=

ANALYSIS OF REFLECTIVITY SPECTRA

R(ν): measured reflectivity

n(ν): refractive index

k(ν): exctinction coefficient

(ν)=n(ν)+ik(ν) complex refractive index

Analysis methods:• Reflectance curve fitting • Kramers-Kronig transformation

n~

REFLECTANCE CURVE FITTING

Use a model for the dielectric function, , to fit the reflectivity spectrum. . Classical dispersion theory:)(~)()()(~ νενikνnνn =+≡

)(~ νε

~( ) ' ( ) ' ' ( )ε ν ε ν ε ν εν

ν ν νΓ= + = +

− −∞ ∑ii

j j

j jj

∆ε 2

2 2

Lorentzian oscillators:νj = resonance frequency; Γj = bandwidth; ∆εj = dielectric strength ε∞ = high frequency dielectric constant

ε ν ν ν εν ν ν

ν ν ν' ( ) ( ) ( )

( )( )

= − = +−

− +∞ ∑n k j j j

j jj

2 22 2 2

2 2 2 2 2

∆ε

Γ

ε ν ν νν ν

ν ν ν' ' ( ) ( ) ( )

( )= =

− +∑22

2 2 2 2 2n k j j j

j jj

∆ε Γ

Γ

Example of Reflectance Curve Fitting

)](''),('[)(])([)(])([)( νενεf

νkνnνkνnνR =

+++−

= 22

22

11

The adjustable parameters (νj, Γj, ∆εj, ε∞) are determined by best fitting the calculated R(ν) spectrum to the experimental reflectivity spectrum.

0 500 1000 15000,0

0,1

0,2

0,3

0,0

0,1

0,2

fit exp

x=0.5

REF

LEC

TAN

CE

WAVENUMBERS (cm-1)

x=0.4

xCuI-(1-x)Cu2MoO4

fit

0 250 500 750 10000

1

2

3

4

5

0 250 500 750 10000

4

8

12

0 250 500 750 10000,0

0,2

0,4

0,6

0,8

0 250 500 750 10001,01,52,0

2,53,03,5

ε"

WAVENUMBERS (cm-1)

ε'

WAVENUMBERS (cm-1)

kn0.5CuI-0.5Cu2MoO4

Dispersion parameters obtained by fitting the reflectivity data of xCuI-(1-x)Cu2MoO4 glasses

0.4CuI-0.6Cu2MoO4 0.5CuI-0.5Cu2MoO4

j νj(cm-1)

Γj(cm-1)

∆εj νj(cm-1)

Γj(cm-1)

∆εj

1 58.0 110.0 3.422 62.8 110.0 6.2542 113.8 115.0 1.029 110.0 112.1 1.6623 175.0 50.0 0.025 180.0 50.0 0.0434 301.0 90.0 0.109 310.0 113.7 0.4305 390.0 144.6 0.161 399.4 145.2 0.3946 490.0 100.0 0.048 501.9 91.2 0.1677 579.2 79.9 0.034 570.3 88.3 0.1928 670.0 70.0 0.010 684.4 58.2 0.0779 782.5 104.8 0.441 779.0 110.7 0.50010 881.5 30.3 0.011 875.1 40.0 0.027

ε∞=3.4 ε∞=4.4

KRAMERS-KRONIG TRANSFORMATION

Measured quantity: Reflectivity, R(ν)=Ir(ν)/Ii(ν)

Ir(ν) = Intensity of the reflected beam

Ii(ν) = Intensity of the incident beam

ρ(ν)=r(ν) exp[iθ(ν)]

ρ(ν) = complex reflectivity coefficient

r(ν) = amplitude = [R(ν)]1/2

θ(ν) = phase difference between reflected and incidence beam

θ ννπ

ν νν ν

ν( )ln ( ) ln ( )

=−−

∫22 2

0

Pr r

di

ii

Kramers-Kronig (K-K) transformation: measure R(ν) ⇒ calculate θ(ν)

⇒ Optical response functions for normal incidence (Fresnel relations):

⇒ Dielectric functions:

⇒ Absorption coefficient:

nr

r r( )

( )( ) ( ) cos ( )

νν

ν ν θ ν=

−+ −

11 2

2

2

kr

r r( )

( ) sin ( )( ) ( ) cos ( )

νν θ ν

ν ν θ ν=

+ −2

1 22

′ = −ε ν ν ν( ) ( ) ( )n k2 2

′′ =ε ν ν ν( ) ( ) ( )2 n k

α ν πν ν( ) ( )= 4 k

⇒ Optical conductivity: σ(ν) = (2πcε0)νε′′(ν)

Kramers-Kronig transformation, cont.

Optical (n, k) and dielectric (ε′, ε′′) properties of the 0.5CuI-0.5Cu2MoO4 glass obtained by K-K analysis and fitting of reflectivity spectra

0.5CuI-0.5Cu2MoO4

0 500 1000 15000,0

0,1

0,2

0,3

REF

LEC

TAN

CE

WAVENUMBERS (cm-1)

0.5CuI-0.5Cu2MoO4

0 250 500 750 10000

1

2

3

4

5

0 250 500 750 10000

4

8

12

0 250 500 750 10000,0

0,2

0,4

0,6

0,8

0 250 500 750 10001,01,52,02,53,03,5

ε'' K-K fit

WAVENUMBERS (cm-1)

ε' K-K fit

WAVENUMBERS (cm-1)

k K-K fitn K-K

fit

K-K

fit

Infrared absorption spectra of alkali diborate glasses obtained by K-K analysis of the reflectance spectra

0 200 400 600 800 10001200140016000

2

4

6

8

10

12

14

16

18

M+-Site vibr.

Network def.

BO3 str.BO4 str.

M2O.2B2O3

Li

NaKRbCs

Abs

orpt

ion

Coe

ffici

ent (

103 c

m-1)

Wavenumbers (cm-1)

Mid-Infrared (above ca. 500 cm-1)

⇒ Vibrations of Short Range Order (SRO) borate network units

Far-Infrared (below ca. 500 cm-1)

⇒ Metal ion–site (M-O) vibrations

Normalized infrared intensity A4 versus the fraction of four-fold coordinated boron atoms, N4, determined from NMR

3,05 3,10 3,15 3,20 3,25 3,30600

650

700

750

800

0,28 0,30 0,32 0,34 0,36 0,38 0,4050

55

60

65

70

75

80

CsRb

K Na

Li

(b)

T g (K)

Nb

M2O.2B

2O

3

(a)

CsRb

KNa

Li

A 4 (10

6 cm

/mol

)

N4

A4= <A4> Vmol

<A4> = integrated intensityof the 800-1200 cm-1 region

Vmol = glass molar volume

Glass transition temperature, Tg, versus number of bridging B-O

bonds per boron atom, Nb.

Nb=2.5+2N4

Infrared absorption spectra of alkaline earth borate glasses obtained by K-K analysis of the reflectance spectra

0 200 400 600 800 1000 1200 1400 1600

MgCaSr

Ba

x=0.45

Wavenumbers (cm-1)

CaSr

Ba

xMO-(1-x)B2O3

x=0.33In

frare

d A

bsor

ptio

n Mid-Infrared:

⇒ SRO structure depends on both MO content and type

Fraction of four-fold coordinated boron atoms, N4, in alkaline earth borate glasses obtained from analysis of the infrared spectra

0,0 0,1 0,2 0,3 0,4 0,5 0,60,0

0,2

0,4

0,6

N4=Ar/(α+Ar)

xMO-(1-x)B2O

3

Ba Sr Ca Mg

N4=x/(1-x)

N4

xMO

N4 = Ar/(α+Ar)

Ar = <A4>/<A3>

<A4> = integrated intensityof the 800-1150 cm-1 region

<A3> = integrated intensityof the 1150-1550 cm-1 region

α =relative absorption coefficient of borate

tetrahedral units (α=1.3)

Comparison of N4 values of alkaline earth borate glasses obtained from IR, NMR, neutron diffraction (ND) and molecular dynamics (MD) studies

0,0

0,2

0,4

0,6

Ba IR NMR ND MD

N4=x/(1-x)

0,0

0,2

0,4NMR: Bray &Moon et al. Sr

0,0

0,2

0,4ND, MD: Fukunaga & Umesaki et al.

N4

N4

N4

Ca

N4

0,0 0,1 0,2 0,3 0,4 0,5 0,60,0

0,2

0,4Mg

xMO-(1-x)B2O3

xMO

Proper analysis of infrared reflectance

spectra can lead to the quantitative determination

of the short-range order borate structure

Far-Infrared absorption spectra of alkali triborate glasses, M2O-3B2O3, resulted from K-K analysis of the reflectance spectra

0 100 200 300 400 500 600

0 100 200 3000 100 200

L

H

Li

LH

Wavenumbers (cm-1)

Na

L

H

K

Infra

red

Abs

orpt

ion

(arb

.uni

ts)

L

H

Rb

L

H

Cs

Far-Infrared absorption spectra of alkaline earth borate glasses resulted from K-K analysis of the reflectance spectra

0 200 400 600

0 150 300 450

H

L

Mg

0 150 300 450

H

L

Wavenumbers (cm-1)

Ca

H

L

Sr

Infra

red

Abs

orpt

ion

(arb

. uni

ts)

0 150 300 450

Ba

H

L

0.45MO-0.55B2O3

Meta-ion site vibration frequencies, νM-O, versus the square root of the inverse metal ion mass, Mc

-1/2

M2O-3B2O3 (M=Li–Cs) & 0.45MO-0.55B2O3 (M=Mg-Ba)

0,1 0,2 0,3 0,40

100

200

300

400 H

BaSr

Ca

Mg

CsRb

KNa

Li

(a)

ν M-O

(H)

(cm

-1)

0,1 0,2 0,3 0,40

100

200

300

L

(b)Cs

RbK

Na

Li

BaSr

Ca

Mg

ν M-O

(L) (

cm-1)

MC-1/2 (au)-1/2

νΜ-Ο = (1/2πc) [fM-O / µΜ-Ο]1/2

fM-O & µΜ-Ο: the force constant

and reduced mass of the

metal ion – site vibration

µΜ-Ο ≈ΜC

Meta-ion site vibration frequencies, νM-O, versus qCMC-1/2

where qC and MC are the charge and mass of metal ion

M2O-3B2O3 (M=Li–Cs) 0.45MO-0.55B2O3 (M=Mg-Ba)

Far-IR spectra:•presence of two type of sites where M-O vibrations give rise to bands H & L

MD simulations on Li-borate glasses:

•H band: M-O vibrations in nb-type sites (non-bridging & bridging oxygen atoms)

•L band: M-O vibrations in b-type sites (bridging oxygen atoms)

0,0 0,1 0,2 0,3 0,40

100

200

300

400

MgLi

Ca

SrNa

KBa

RbCs

L

H

ν M-O

(cm

-1)

qCMC-1/2

fM-O ∝ qC2

νΜ-Ο∝ qC ΜC-1/2

Dependence of Na-borate glass structure on depth from the glass surface

0 500 1000 1500 2000 25000,00

0,05

0,10

0,15

0,20

0.3Na2O-0.7B2O3

0µm 40µm 110µm 180µm 1300µm

Ref

lect

ance

Wavenumbers (cm-1)

⇒ Glass disks were prepared by quenching from the melt, with diameter: 15mm, thickness: 2mm

⇒ Controlled removal of glass layers by grinding & polishing the same specimen on an automatic polishing machine

⇒ Recording infrared reflectance spectra at various depths from the original glass surface

Infrared absorption spectra calculated from the reflectance spectra measured at different depths from the surface of the 0.3Na2O-0.7B2O3 glass

0 500 1000 15000,00

0,25

0,50

0,75

1,00

BO3

BO4

A3A4

0.3Na2O-0.7B2O3

0µm 40µm 110µm 180µm 1300µm

Extin

ctio

n C

oeffi

cien

t

Wavenumbers (cm-1)

BØ3BØ2O-

BØ4-

0

500

1000 0.3Na2O-0.7B2O3

d= 0µm

H

L

Abso

rptio

n C

oeffi

cien

t (cm

-1)

0 100 200 300 4000

500

1000

1500 d= 1300µm

H

L

Wavenumbers (cm-1)

0.3Na2O-0.7B2O3 Glass: Na Ion – Site Vibrations

Deconvolution of far infrared absorption spectra into Gaussian component bands

0 400 800 12000,28

0,32

0,36

A L/(A H

+AL)

d (µm)

L-component band (b-type) of the Na-O (site) vibration gains relative intensity up to ca. 200 µm

0.3Na2O-0.7B2O3 glass: Short-Range Order (SRO) Borate Structure

0 400 800 12000,47

0,48

0,49

0,50

d (µm)A 4/(

A 3+A 4)

Borate SRO structure: • Tetrahedral units: BØ4

- (intensity A4, mole fraction X4)• Trigonal units: BØ3 & BØ2O- (intensity A3, mole fractions X3 & X2)

mass balance: X4+X3+X2=1⇒ X3= [BØ3]=0.57

charge balance: X4+X2=0.3/0.7=0.43

BØ2O- ⇒ BØ4-

Cooling rate gradient from the surface to the core of the glass sample

0.3Na2O-0.7B2O3 Glass: Mid-IR & Far-IR correlations

Mid-Infrared: Short-Range Order (SRO) Borate Structure Far-Infrared: Na Ion – Site Vibrations

0 400 800 12000,28

0,32

0,36

A L/(A H

+AL)

d (µm)

0 400 800 12000,47

0,48

0,49

0,50

d (µm)

A 4/(A 3+

A 4)

BØ2O- ⇒ BØ4- nb-type ⇒ b-type

Na-O sites

Infrared reflectance spectroscopy facilitates the simultaneous study of the SRO borate structures (mid-IR) and their effect on the relative population of

the network sites hosting metal ions (far-IR)

ACKNOWLEDGMENT

Thanks to:

• Colleagues at NHRF, Athens, for original infrared spectral data.

• IMI – New Functionality in Glass, for support.


Recommended