34
International Policy Update & Producer Opportunities Parr Rosson Professor & Director Center for North American Studies Department of Agricultural Economics Texas A&M University C NAS
International Policy Update &
Producer Opportunities
Parr Rosson
Professor & Director
Center for North American Studies
Department of Agricultural Economics
Texas A&M University
CNAS

Overview
Trade Trends
International Institutions
Trade Agreements
Conclusions & Implications
Trade Trends &
International Setting
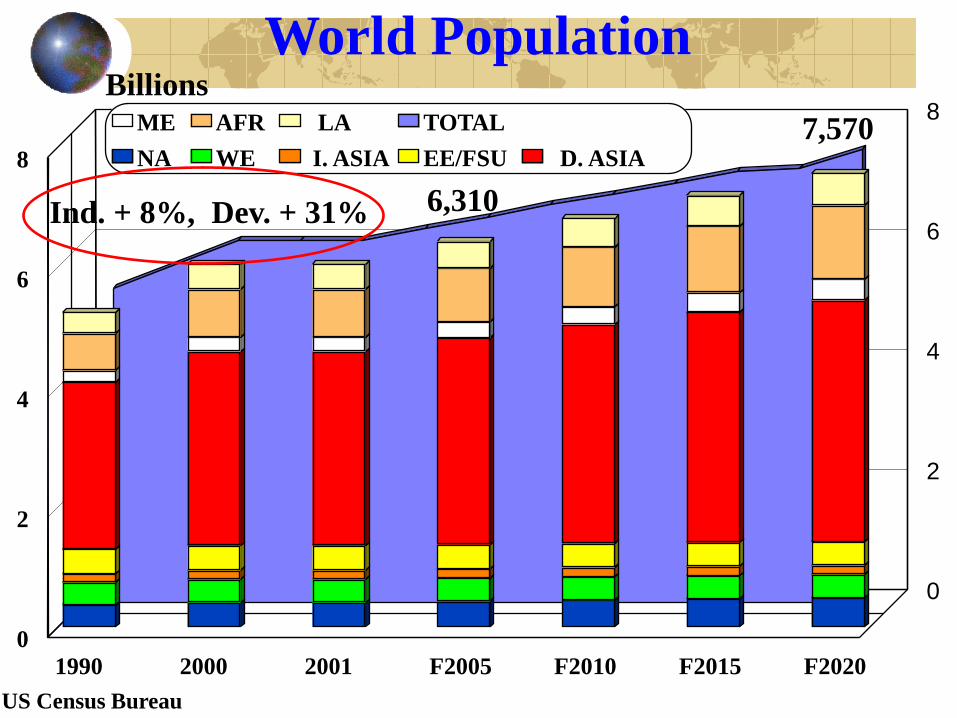
World Population
US Census Bureau
1990 2000 2001 F2005 F2010 F2015 F2020 0
2
4
6
8
0
2
4
6
8
NA WE I. ASIA EE/FSU D. ASIA
ME AFR LA TOTAL
Billions
6,310
7,570
Ind. + 8%, Dev. + 31%

World Economic Output
Global Insight, Inc., World Economic Outlook, 2002.
1990 2000 2001 F2005 F2010 F2015 F2020 $0
$10
$20
$30
$40
$50
$60
$70
NA WE I. ASIA EE/FSU
D. ASIA ME AFR CSA
GDP, Trillion 1997 Dollars
Ind. + 64%, Developing + 140%
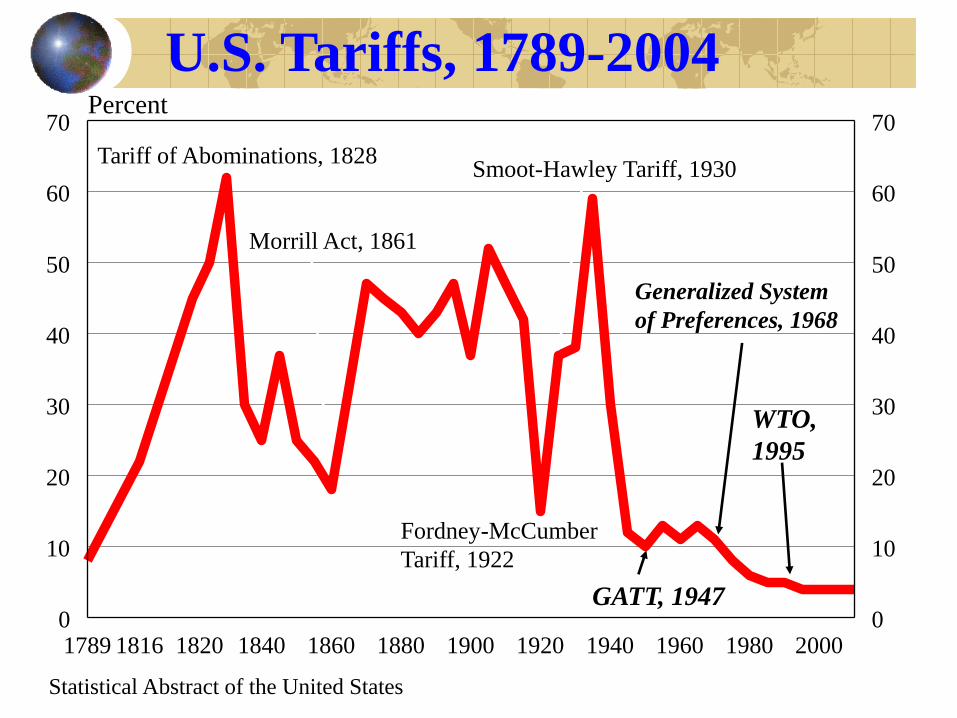
U.S. Tariffs, 1789-2004
Statistical Abstract of the United States
1789 1816 1820 1840 1860 1880 1900 1920 1940 1960 1980 2000 0
10
20
30
40
50
60
70 Percent
0
10
20
30
40
50
60
70
Tariff of Abominations, 1828
Morrill Act, 1861
Smoot-Hawley Tariff, 1930
Generalized System
of Preferences, 1968
Fordney-McCumber
Tariff, 1922
GATT, 1947
WTO,
1995

World Average Agricultural Tariffs, 2002
Source: WTO & ERS/USDA
115
85
55
40 30 25
10
0
20
40
60
80
100
120
140
Percent
Region Average
World Average
62%

Source: U.S. Trade Internet System, www.fas.usda.gov/ustrade
2000 2001 2002 2003 2001 2005
$0.0
$2.0
$4.0
$6.0
$8.0
$10.0
$12.0
Billion Dollars
Canada Mexico Japan EU-25 China/HK
Taiwan Korea Turkey Indonesia Russia
Top 10 U.S. Ag Export Markets

U.S. Agricultural Trade, 1970-2006F
Source: U.S. Trade Internet System, www.fas.usda.gov/ustrade
2006 Forcast for Fiscal Year f rom USDA/FAS (Feb 06 Forecast)
19701975
19801985
19901995
20002005
2006F
$0.0
$10.0
$20.0
$30.0
$40.0
$50.0
$60.0
$70.0Billion Dollars
Exports Imports
Since 2000:
Exports + 25%
Imports + 50%
Trade Surplus Vanishes

Observations
Disparity in Population & Income
Growth
Disparity in Use of Trade Barriers
Disparity in Agricultural Trade Growth
Finally Seeing China Emerge as
Market, Cuba Growing
Questions About Role & Future
Importance of Trade

International Institutions &
Trade Strategies

U.S. Trade Strategy
Unilateral
Generalized System of Preferences (GSP)
CBI/CBERA
African Growth Opportunities Act (AGOA)
Regional/Bilateral
NAFTA, CAFTA-DR, Others
Multilateral
World Trade Organization
Only Forum Where All 150 Member Countries Are Present & Farm Policy Is Negotiated
Concurrent
Initiatives

Doha Development Agenda in the
World Trade Organization (2001-6?)
The Hong Kong
Ministerial
December 13-18, 2005
Agreement on Reductions by April 30, 2006
Draft Schedules Due July 31, 2006
Conclude Negotiations December 31, 2006

Three Pillars for Negotiations in
Agriculture
Market Access
Export Competition
Domestic Support
Negotiations Under Tight Timeline
Due to Expiration of TPA July
2007

Hong Kong, December 2005
Little Progress Made in Hong Kong
EU Trade Commissioner said state of negotiations was “serious but not desperate.”
Agreement to Eliminate Export Subsidies by 2013
Greater “Quota-Free, Duty-Free” Access Granted LDCs, Up to 97% of Products
LDC’s want it above 99% and Prepared to Veto
While Many Fundamental Issues Remain Unresolved, Deadlines Have Been Set
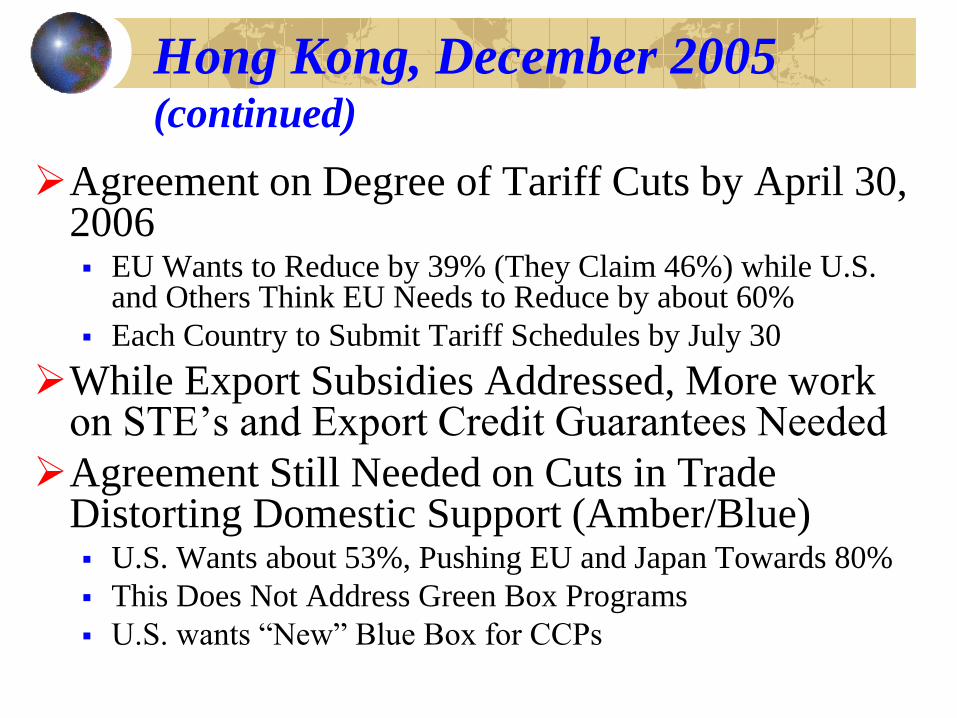
Hong Kong, December 2005 (continued)
Agreement on Degree of Tariff Cuts by April 30, 2006 EU Wants to Reduce by 39% (They Claim 46%) while U.S.
and Others Think EU Needs to Reduce by about 60%
Each Country to Submit Tariff Schedules by July 30
While Export Subsidies Addressed, More work on STE’s and Export Credit Guarantees Needed
Agreement Still Needed on Cuts in Trade Distorting Domestic Support (Amber/Blue) U.S. Wants about 53%, Pushing EU and Japan Towards 80%
This Does Not Address Green Box Programs
U.S. wants “New” Blue Box for CCPs
Other Negotiating/Related Issues
NAMA (Non-Ag Market Access)
The Cotton Case (DS 267)
U.S. Budget Situation
Dissension within EU (France vs.
Everyone Else)
Observations
WTO Could Result in No Substantial
Agreement
Future of WTO May Be On the Line
Agreement Important to U.S.
Open Markets
Get Rid of Export Subsidy Distortions
Minimize Litigation Over Farm Policy

Role of Trade Agreements

Why Regional Agreements?
2d Best After MTN
WTO Has Been Slower than Desired
Outcome is Uncertain
Economic Incentives
Open Markets
Increase Business Efficiency
Keep Pressure on MTN to Perform

Strategic Considerations
Secure Strategic Materials
Oil, Fertilizer, Natural Gas
Stem Illegal Immigration by Creating
Economic Opportunity in Other
Countries
Create ‘Buffer Zone’ Against
Terrorism (9/11 Commission Report)

Australia ‘05
Bahrain ‘05 CAFTA-DR
‘05
Chile ‘04
FTAA ‘06
Morocco ‘04
Southern African
Customs Union ‘06
Singapore ‘03
Jordan ‘01
U.S. Trade Agreements
NAFTA ‘94 Israel ‘85
CUSTA, ‘89
Andean FTA
‘06
Panama ‘06
Thailand ‘06
MEFTA
‘06
S. Korea
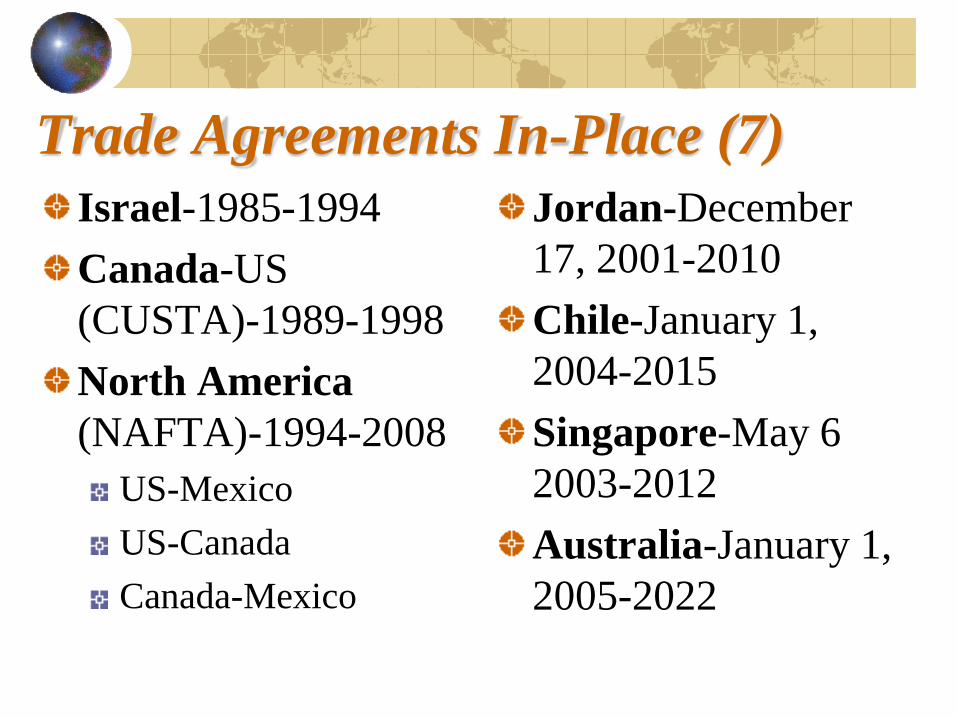
Trade Agreements In-Place (7)
Israel-1985-1994
Canada-US
(CUSTA)-1989-1998
North America
(NAFTA)-1994-2008
US-Mexico
US-Canada
Canada-Mexico
Jordan-December
17, 2001-2010
Chile-January 1,
2004-2015
Singapore-May 6
2003-2012
Australia-January 1,
2005-2022

Trade Agreements-Pending (10)
Morocco-President
Signed 8/17/04, Pending
Signature, King of
Morocco
CAFTA-DR-Signed by
President, (20 Years to
Full Implementation)
Bahrain-Pending
Submission to Congress
Panama-Nine
Negotiating Sessions
Held, Panama Delays
Colombia, Ecuador,
Peru (ANDEAN)-
Nine Rounds,
Negotiations Continue
Thailand-Three
Rounds Held
S. Korea - 2007
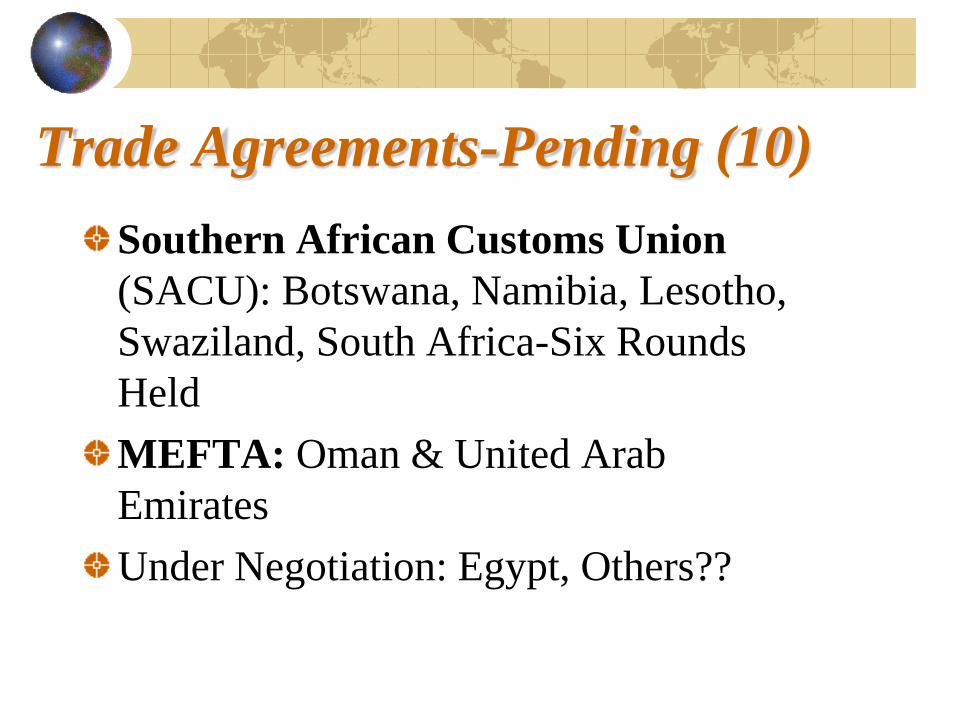
Trade Agreements-Pending (10)
Southern African Customs Union
(SACU): Botswana, Namibia, Lesotho,
Swaziland, South Africa-Six Rounds
Held
MEFTA: Oman & United Arab
Emirates
Under Negotiation: Egypt, Others??
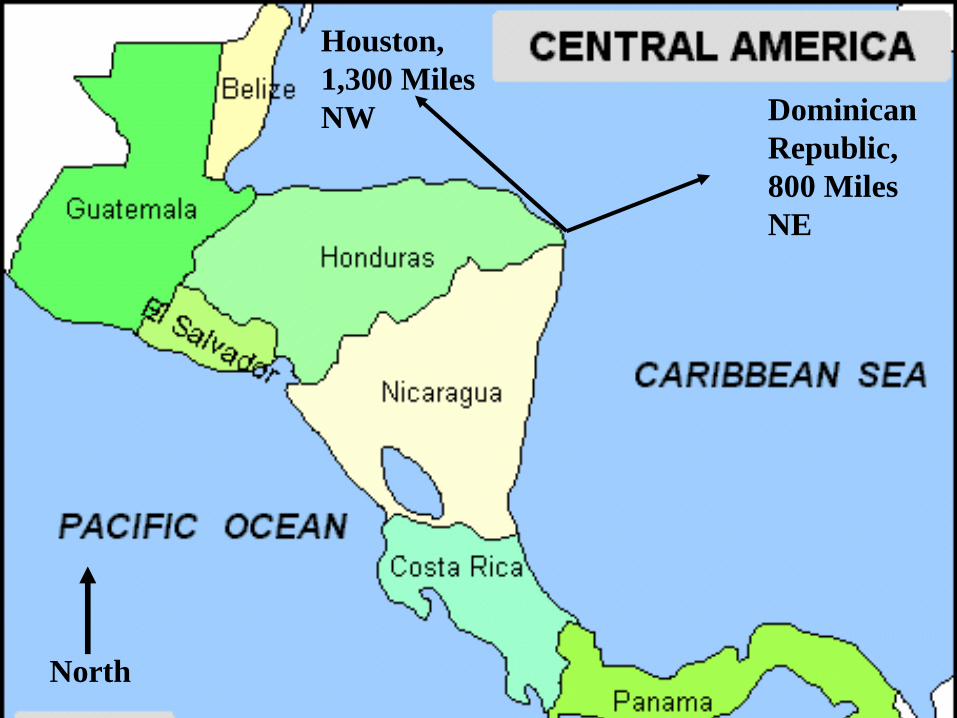
Dominican
Republic,
800 Miles
NE
North
Houston,
1,300 Miles
NW
Mexico
Country Pop.
(mil)
GDP/
Person
Poverty
%
Lit.
%
Ag. Pop.
%
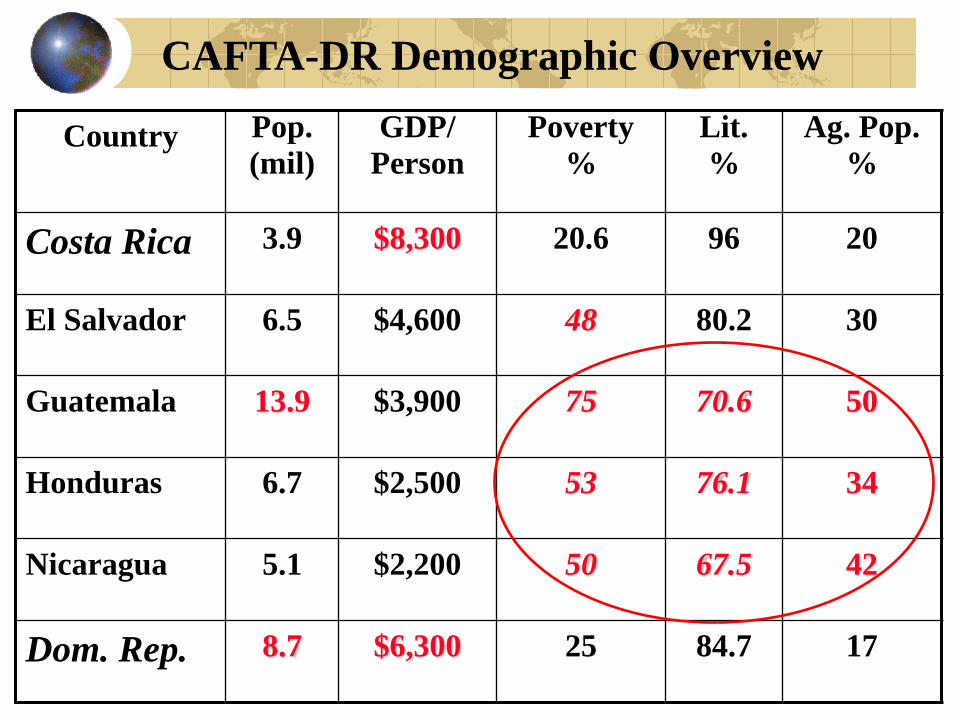
Costa Rica 3.9 $8,300 20.6 96 20
El Salvador 6.5 $4,600 48 80.2 30
Guatemala 13.9 $3,900 75 70.6 50
Honduras 6.7 $2,500 53 76.1 34
Nicaragua 5.1 $2,200 50 67.5 42
Dom. Rep. 8.7 $6,300 25 84.7 17
CAFTA-DR Demographic Overview

CAFTA-DR Prospects
U.S. Ag. Export Gains of $1.5 Billion Annually
Near Term: HQ Beef, Cotton, Wheat & Soybeans
Long Term: Rice, Dairy, Pork, Poultry & Corn
Challenges: Sugar, Cantaloupe, Honeydew
Limitations: Infrastructure, Income Growth/Distribution, Plant & Animal Health
Other Opportunities: Investment

CAFTA-DR Ag. Trade, 2003
USDA, FATUS.
Grains & Feeds
43.5%
Oilseeds
19.4%
Meats
15.2% Veg/Fruit
8.7%
Cotton
3.5%
Other
9.6%
Bananas
25.4%
Fruit/Veg
19.9%
Fish
18.0%
Coffee
17.3%
Sugar
7.1% Other
12.4%
US Exports: $1,339 million US Imports: $2,654 million

Observations
Agreements May Be Necessary Condition for Opening New Markets for Agriculture
Time is Crucial Due to Expiration of TPA
Some Agreements Easier than Others
Future of Free Trade of the Americas in Serious Doubt

Conclusions and Implications
Conclusions & Implications
U.S. Market Is Open, Rest of World Is Not
U.S. Export Growth Lags Import Growth
If Trade Growth is Important, Disparities Must
Be Addressed
Progress in WTO Important to U.S. & Texas
for at Least 2 Reasons:
Markets
Farm Policy

Conclusions & Implications
Reductions in Trade Distorting Domestic
Support Likely Substantial Some Adjustment for U.S. Producers
Absent WTO Progress, Expect More
Litigation in WTO Aimed at Farm U.S. Policy
Trade Reform is at a Crossroads: Protection or
Progress? If Export Markets Are Important, Trade Agreements &
WTO Progress Are Necessary, But Not Sufficient

Thank You!
Questions?
Parr Rosson
Department of Agricultural Economics
Texas A&M University
College Station, TX 77843-2124
E-mail: [email protected]
Telephone: 979-845-3070


