STATISTICS ON THE PRODUCTION AND TRADE OF FOREST SEEDS AND OTHER FOREST PLANT MATERIAL Introduction The purpose of this short study was to examine the possibility of collecting information on the production and trade in forest seeds and other forest plant material from existing national and international statistics. An additional objective was to examine statistics on production and trade of other types of seed, to see if these could be used to make comparisons between forestry and the rest of the agricultural sector. This paper has been prepared to explain the various classification systems used for production and trade and to present the results of the investigation. Overview There is a variety of classification systems in use around the world to distinguish between different productive activities and commodities or products. Broadly speaking, the aim of these different systems is to distinguish between different products or productive activities in national statistics. The different systems can be grouped into three distinct types: • Economic activities: one type of classification system is used to distinguish between different economic activities. These systems are generally used to record information about macroeconomic variables such as the quantity and value of production, value- added, employment and investment. Classifications of economic activities generally do not go into a great level of detail. • Products: a second type of classification system is used to distinguish between different types of product. Product classifications are used to record quantities and values of production in national statistics. They are also used to specify individual products for the purposes of implementing national regulations (e.g. product standards, building codes, taxes and subsidy rates). Product classifications go into more detail. • Trade: the third type of classification system is used to distinguish between different types of product that are traded. Trade classification systems are used to record quantities and values of trade and are used by customs authorities to implement trade policies such as phytosanitary regulations, product regulations and tariffs. Although similar to product classification systems, classification systems for trade often go into much more detail. All classification systems are organised into hierarchies that go into varying levels of detail. The different levels of detail are given names such as: sections; chapters; divisions; groups; and classes. They can be coded using letters, numbers or a combination of the two. When they are coded using numbers, it is common to refer too the level of detail in any presentation of the statistics as the “digit-level”. Higher digit levels refer to greater levels of detail and digit levels sometimes increase by a factor of two (i.e. the 2-digit level is the broadest classification and an 8-digit or 10-digit level is much more detailed).
Transcript
STATISTICS ON THE PRODUCTION AND TRADE OF FOREST SEEDS AND OTHER FOREST PLANT MATERIAL
Introduction The purpose of this short study was to examine the possibility of collecting information on the production and trade in forest seeds and other forest plant material from existing national and international statistics. An additional objective was to examine statistics on production and trade of other types of seed, to see if these could be used to make comparisons between forestry and the rest of the agricultural sector. This paper has been prepared to explain the various classification systems used for production and trade and to present the results of the investigation. Overview There is a variety of classification systems in use around the world to distinguish between different productive activities and commodities or products. Broadly speaking, the aim of these different systems is to distinguish between different products or productive activities in national statistics. The different systems can be grouped into three distinct types:
• Economic activities: one type of classification system is used to distinguish between different economic activities. These systems are generally used to record information about macroeconomic variables such as the quantity and value of production, value-added, employment and investment. Classifications of economic activities generally do not go into a great level of detail.
• Products: a second type of classification system is used to distinguish between
different types of product. Product classifications are used to record quantities and values of production in national statistics. They are also used to specify individual products for the purposes of implementing national regulations (e.g. product standards, building codes, taxes and subsidy rates). Product classifications go into more detail.
• Trade: the third type of classification system is used to distinguish between different
types of product that are traded. Trade classification systems are used to record quantities and values of trade and are used by customs authorities to implement trade policies such as phytosanitary regulations, product regulations and tariffs. Although similar to product classification systems, classification systems for trade often go into much more detail.
All classification systems are organised into hierarchies that go into varying levels of detail. The different levels of detail are given names such as: sections; chapters; divisions; groups; and classes. They can be coded using letters, numbers or a combination of the two. When they are coded using numbers, it is common to refer too the level of detail in any presentation of the statistics as the “digit-level”. Higher digit levels refer to greater levels of detail and digit levels sometimes increase by a factor of two (i.e. the 2-digit level is the broadest classification and an 8-digit or 10-digit level is much more detailed).
Although there have been many efforts to try to standardise classification systems, some variation still exists between most countries. In particular, many of the largest economies in the World still maintain their own national classification systems, although many also provide tables of cross-references to assist with reclassifying their statistics into a comparable international format. In addition, some regional groups of countries have developed standardised classification systems between themselves. A brief description of some of the major classification systems in use around the World is given in Table 1. Table 1 Examples of some of the main classification systems used in national statistics
Region Name, version (and abbreviation) Status Main purpose
Notes
International Standard Industrial Classification of All Economic Activities, Revision 3.1 (ISIC Rev. 3.1)
Draft A Will replace ISIC Rev. 3. Goes to 4-digit level (4 levels)
Central Product Classification, Version 1.1 (CPC 1.1) Draft P/T Will replace CPC 1.0.
Standard International Trade Classification, Third Revision (SITC Rev.3) Current T
Harmonized Commodity Description and Coding System 1996 (HS 1996) Current T
Global
Harmonized Commodity Description and Coding System 2002 (HS 2002) Current T
HS 2002 is used for international trade and tariff statistics to 6-digit level (3 levels). This is extended to 10-digit level (5 levels) by countries. Some countries still use earlier systems.
Statistical Classification of Economic Activities in the European Community, Revision 1.1 (NACE Rev. 1.1)
Current A EU version of ISIC, giving more detail.
Statistical Classification of Products by Activity in the European Economic Community, 2002 Version (CPA 2002)
Current P EU version of CPC, giving more detail.
PRODCOM list (List of PRODucts of the European COMmunity), 2003 version (PRODCOM List 2003) Current P Used to link CPA with CN and
HS.
Europe
Combined Nomenclature, 2003 (CN 2003) Current P/T Used for trade in EU, to go from 6-digit HS 1996 to 8 digits.
North America
North American Industry Classification System (NAICS) Current A Used in USA, Canada and
Mexico. Standard Industrial Classification for Japan (JSIC) Current A Australian and New Zealand Standard Industrial Classification (ANZSIC) Current A Asia-
Pacific The Australian and New Zealand Standard Product Classification (ANZSPC) Current P
Source: RAMON - Eurostat's Classifications Server, 2003 (available at: http://europa.eu.int/comm/eurostat/ramon). Note: for main purpose; A = systems used to classify economic activities; P = product classifications; and T = trade classification systems. Seed production statistics If available, statistics on the production of forest seeds, other seeds and other forest plant material would be found in statistics that are classified using either a classification of economic activities or a product classification system. The availability of such statistics in some of the main classification systems is described below. International Standard Industrial Classification of all economic activities, Revision 3.1 The International Standard Industrial Classification of all economic activities, Revision 3.1 (ISIC Rev. 3.1) is divided into four levels of detail, called; sections; divisions; groups; and classes. The fundamental level of detail in ISIC Rev. 3.1 is the division, which is represented
by a 2-digit code. Sections are used to group together similar activities (defined at the level of the division) and are identified by a letter. They can be used present information at broader level of detail. Below the division level, ISIC Rev. 3.1 is further sub-divided into groups (3-digit code) and classes (4-digit code). Forestry occurs as a separate economic activity at the division level in ISIC Rev. 3.1 and forms part of Section A (agriculture, hunting and forestry). However, different activities within the forestry sector are not identified separately at higher digit levels (i.e. groups and classes). In other words, the forestry sector division contains only one group and only one class. The position of the forestry sector within the ISIC Rev. 3.1 hierarchy is shown in Table 2 below. Table 2 The position and classification of the forestry sector in ISIC Rev. 3.1 Section Division Group Class Description A AGRICULTURE, HUNTING & FORESTRY 01 Agriculture, hunting & related service activities 011 Growing of crops; market gardening; horticulture 0111 Growing of cereals & other crops n.e.c. 0112 Growing of vegetables, horticulture, nursery 0113 Growing of fruit, nuts, beverage & spice crops 012 Farming of animals 0121 Farming of cattle, sheep, horses, dairy farming 0122 Other animal farming, animal products 013 0130 Mixed farming (crops & animals) 014 0140 Agriculture & animal husbandry services (except veterinary) 015 0150 Hunting, trapping, game propagation & related services 02 020 0200 Forestry, logging & related service activities
Source: UN Classifications registry (at: http://millenniumindicators.un.org/unsd/cr/registry/regcst.asp?Cl=17&Lg=1). Class 0200 (forestry, logging and related service activities) includes the following activities:
• growing of standing timber: planting, replanting, transplanting, thinning and conserving of forests and timber tracts;
• growing of coppice and pulpwood; • operation of forest tree nurseries; • growing of Christmas trees; • logging: felling of timber and production of wood in the rough such as pit-props, split
poles, pickets or fuel wood; • forestry service activities: forestry inventories, timber evaluation, fire fighting and
protection, forest management including afforestation and reforestation; • logging service activities: transport of logs within the forest; • production of charcoal, when done in the forest; and • gathering of wild growing forest materials, except mushrooms, truffles, berries or
nuts: balata and other rubber-like gums, cork, lac, resins, balsams, vegetable hair, eelgrass, acorns, horse-chestnuts, mosses, lichens.
The production of forest seeds and other forest plant material is included in Class 0200 (operation of forest tree nurseries), but it would not be possible to use any national statistics organised according to ISIC Rev. 3.1 to identify this separately from other forestry activities.
Similarly, ISIC Rev. 3.1 does not go into sufficient detail to identify seed production in the rest of the agricultural sector. ISIC Rev. 3.1 is currently being revised (to produce ISIC Rev. 4). There is a proposal to create one or more separate classes for seed production under the group: “agriculture and animal husbandry services (except veterinary)”, but this may not be accepted. There are also proposals to sub-divide the forestry sector into more groups and classes, but none of these includes a proposal to create a separate class for seed production. Central Product Classification Version 1.1 The Central Product Classification Version 1.1 (CPC 1.1) constitutes a comprehensive classification of all goods and services. CPC 1.1 presents categories for all products that can be the object of domestic or international transactions or that can be entered into stocks. It includes products that are an output of economic activity, including transportable goods, non-transportable goods and services. CPC 1.1 was developed to serve as an instrument for assembling and tabulating all kinds of statistics requiring product detail. Such statistics may cover production, intermediate and final consumption, capital formation, foreign trade or prices. They may refer to commodity flows, stocks or balances and may be compiled in the context of input/output tables, balance of payments and other analytical presentations. CPC 1.1 classifies products based on the physical characteristics of goods or on the nature of the services rendered. It was developed primarily to enhance harmonization among various fields of economic and related statistics and to strengthen the role of national accounts as an instrument for the coordination of economic statistics. It provides a basis for recompiling basic statistics from their original classifications into a standard classification for analytical use. CPC 1.1 consists of: 10 "Sections" (1-digit level); 70 "Divisions" (2-digit level); 305 "Groups" (3-digit level); 1,167 "Classes" (4-digit level); and 2,096 "Subclasses" (5-digit level). The forestry sector appears in CPC 1.1 as one of the divisions under Section 0 (agriculture, forestry and fishery products). The forestry sector is further sub-divided into three groups and 10 classes and sub-classes (i.e. each class has only one sub-class). None of the individual sub-classes in CPC 1.1 mentions the production of forest seeds. Furthermore, it is not readily apparent where forest seeds may be put under this classification system. Based on the titles of the sub-classes, sub-class 03920 would be the most obvious candidate, but the title of this sub-class suggests that it should only include ornamental plants. Therefore, it would not be possible to collect information about forest seed production in statistics prepared according to CPC 1.1, due to the lack of detail and ambiguity about where it may be placed. The situation with respect to agricultural and horticultural seeds is not much better. There are possibly seven sub-classes where seeds and planting material may comprise a significant proportion of the sub-class (shown in bold and underlined in Table 3). However, by far the most important component of seed production is the production of seeds for cereal crops. Because these seeds are also the consumed product (and are included as such), it is not possible to use CPC 1.1 to obtain total agricultural seed production.
Table 3 The position and classification of the forestry sector in CPC 1.1 under Section 0 (agriculture, forestry and fishery products)
Div. Group Class S-C Description 01 PRODUCTS OF AGRICULTURE, HORTICULTURE AND MARKET
GARDENING 011 Cereals 0111 01110 Wheat and meslin 0112 01120 Maize (corn) 0113 01130 Rice, not husked 0114 01140 Husked rice 0115 01150 Barley 0116 01160 Rye, oats 0119 01190 Other cereals 012 Vegetables 0121 01210 Potatoes 0122 01220 Dried leguminous vegetables, shelled 0123 Other vegetables, fresh or chilled 01231 Locust beans 01239 Other vegetables, fresh or chilled n.e.c. 0124 01240 Edible roots and tubers with high starch or inulin content 013 Fruit and nuts 0131 01310 Dates, figs, bananas, coconuts, brazil nuts, pineapples, avocados, mangoes,
guavas, mangosteens, fresh or dried 0132 01320 Citrus fruit, fresh or dried 0133 01130 Grapes, fresh 0134 Other fruit, fresh 01341 Melons 01349 Other fruit, fresh n.e.c. 0135 01350 Other fruit, dried 0136 01360 Other nuts, fresh or dried, whether or not shelled 014 Oil seeds and oleaginous fruit 0141 01410 Soya beans 0142 01420 Ground nuts 0143 01430 Sunflower, sesamum, safflower, rape, colza and mustard seeds 0144 01440 Cotton seeds 0149 01490 Oil seeds n.e.c. and oleaginous fruit 015 Living plants; cut flowers and flower buds; flower seeds and fruit seeds;
vegetable seeds 0151 01510 Live plants; bulbs, tubers and roots; cuttings and slips; mushroom
spawn 0152 01520 Cut flowers and flower buds including bouquets, wreaths, floral baskets and
similar articles 0153 01530 Flower seeds and fruit seeds 0154 01540 Vegetable seeds, except beet seeds 016 Beverages and spice crops 0161 Beverage crops 01611 Coffee, not roasted, not decaffeinated 01612 Green tea (not fermented), black tea (fermented) and partly fermented tea, in
immediate packing of a content exceeding 3 kg 01613 Mate 01614 Cocoa beans, raw or roasted 0162 01620 Spices, whether or not processed 017 Unmanufactured tobacco 0171 01710 Cured stemmed/stripped tobacco leaves 0179 01790 Other unmanufactured tobacco
Div. Group Class S-C Description (01) 018 Plants used for sugar manufacturing 0181 01810 Sugar beet 0182 01820 Sugar cane 019 Raw vegetable materials n.e.c. 0191 01910 Cereal straw and husks, unprepared, whether or not chopped, ground, pressed
or in the form of pellets; swedes, mangols, fodder roots, hay, clover, sainfoin, forage, kale, lupines, vetches and similar forage products, whether or not in the form of pellets
0192 Raw vegetable materials used in textile 01921 Cotton, whether or not ginned 01922 Jute and other textile bast fibres, raw or retted, except flax, true hemp and
ramie 01923 Flax and true hemp, raw or retted; sisal and other textile fibres of the genus
Agave, raw; coconut, abaca, ramie and other vegetable textile fibres, raw 0193 01930 Plants and parts of plants used primarily in perfumery, in pharmacy, or
for insecticidal, fungicidal or similar purposes 0194 01940 Sugar beet seeds, other beet seeds and seeds of forage plants 0199 01990 Other raw vegetable materials 02 LIVE ANIMALS AND ANIMAL PRODUCTS ... 2 groups ... 11 classes ... 21 sub-classes 03 FORESTRY AND LOGGING PRODUCTS 031 Wood in the rough 0311 03110 Logs of coniferous wood 0312 03120 Logs of non-coniferous wood 0313 03130 Fuel wood, in logs, in billets, in twigs, in faggots or in similar forms 0319 03190 Other wood in the rough (including split poles and pickets) 032 Natural gums 0321 03210 Natural rubber in primary forms or in plates, sheets or strip 0322 03220 Balata, gutta-percha, guayule, chicle and similar natural gums 0323 03230 Lac; other natural gums, resins and other vegetable saps and extracts 039 Other forestry products 0391 03910 Natural cork, raw or simply prepared 0392 03920 Parts of plants, without flowers or flower buds, and grasses, mosses and
lichens, suitable for ornamental purposes 0393 03930 Vegetable materials of a kind used primarily for plaiting or as stuffing or
padding; raw vegetable materials of a kind used primarily for dyeing or tanning; vegetable products n.e.c.
04 FISH AND OTHER FISHING PRODUCTS ... 3 groups ... 8 classes ... 8 sub-classes
Source: United Nations, 2002, Central Product Classification: CPC Version 1.1, Draft Paper ESA/STAT/SER.M/77/Ver.1.1 submitted to the United Nations Statistical Commission, 5-8 March 2002. Available at: http://unstats.un.org/unsd/statcom/doc02/cpc.pdf. North American Industry Classification System The North American Industry Classification System (NAICS) provides common industry definitions for Canada, Mexico and the United States, to facilitate economic analyses that cover the economies of the three North American countries. NAICS is organised into a hierarchy of five different levels and contains the following: 20 Level 1 Categories (2-digit level); 70 Level 2 Categories (3-digit level); 223 Level 3 Categories (4-digit level); and 460 Level 4 Categories (5-digit level). Some Level 4 Categories are further sub-divided to the
6-digit level. The basic structure of NAICS is broadly comparable with the 2-digit level of ISIC Rev. 3.1. Table 4 The position and classification of the forestry sector in NAICS
2002 NAICS Codes 2002 NAICS Title 11 AGRICULTURE, FORESTRY, FISHING AND HUNTING 111 Crop Production 1111 Oilseed and Grain Farming 11111 111110 Soybean Farming 11112 111120 Oilseed (except Soybean) Farming 11113 111130 Dry Pea and Bean Farming 11114 111140 Wheat Farming 11115 111150 Corn Farming 11116 111160 Rice Farming 11119 Other Grain Farming 111191 Oilseed and Grain Combination Farming 111199 All Other Grain Farming 1112 Vegetable and Melon Farming 11121 Vegetable and Melon Farming 111211 Potato Farming 111219 Other Vegetable (except Potato) and Melon Farming 1113 Fruit and Tree Nut Farming 11131 111310 Orange Groves 11132 111320 Citrus (except Orange) Groves 11133 Non-citrus Fruit and Tree Nut Farming 111331 Apple Orchards 111332 Grape Vineyards 111333 Strawberry Farming 111334 Berry (except Strawberry) Farming 111335 Tree Nut Farming 111336 Fruit and Tree Nut Combination Farming 111339 Other Non-citrus Fruit Farming 1114 Greenhouse, Nursery, and Floriculture Production 11141 Food Crops Grown Under Cover 111411 Mushroom Production 111419 Other Food Crops Grown Under Cover 11142 Nursery and Floriculture Production 111421 Nursery and Tree Production 111422 Floriculture Production 1119 Other Crop Farming 11191 111910 Tobacco Farming 11192 111920 Cotton Farming 11193 111930 Sugarcane Farming 11194 111940 Hay Farming 11199 All Other Crop Farming 111991 Sugar Beet Farming 111992 Peanut Farming 111998 All Other Miscellaneous Crop Farming
2002 NAICS Codes 2002 NAICS Title
(11) 112 ... ... ... Animal Production (includes 41 sub-divisions) 113 Forestry and Logging 1131 11311 113110 Timber Tract Operations 1132 11321 113210 Forest Nurseries and Gathering of Forest Products 1133 11331 113310 Logging 114 ... ... ... Fishing, Hunting and Trapping (includes 8 sub-divisions) 115 Support Activities for Agriculture and Forestry 1151 11511 Support Activities for Crop Production 115111 Cotton Ginning 115112 Soil Preparation, Planting, and Cultivating 115113 Crop Harvesting, Primarily by Machine 115114 Post harvest Crop Activities (except Cotton Ginning) 115115 Farm Labour Contractors and Crew Leaders 115116 Farm Management Services 1152 11521 115210 Support Activities for Animal Production 1153 11531 115310 Support Activities for Forestry
Source: US Census Bureau, 2002, 2002 NAICS Codes and Titles (at: http://www.census.gov/epcd/naics02/naicod02.htm). Forestry is identified as a separate activity at the second level of the hierarchy (3-digit level), as part of “agriculture, forestry, fishing and hunting”. It is further sub-divided into three categories at the 4-digit level, but is not sub-divided beyond this (see Table 4). Forest seeds and other plant material production would be included under NAICS Code 1132 (forest nurseries and gathering of forest products). However, this category is defined as follows:
“This industry comprises establishments primarily engaged in (1) growing trees for reforestation and/or (2) gathering forest products, such as gums, barks, balsam needles, rhizomes, fibers, Spanish moss, ginseng, and truffles”.
Thus, NAICS Code 1132 includes more than just seeds and plant material production and could not be used to obtain statistics about this. (NAICS Code 111421 - nursery and tree production - comprises establishments primarily engaged in (1) growing nursery products, nursery stock, shrubbery, bulbs, fruit stock, sod, and so forth, under cover or in open fields and/or (2) growing short rotation woody trees with a growth and harvest cycle of 10 years or less for pulp or tree stock. The latter is mostly used to capture Christmas tree production). In addition, it would not be possible to use statistics arranged using NAICS to obtain information about seed production in agriculture. Under agriculture, the definitions of each industry sector specifically include the production of seed materials along with the production of the consumed product (e.g. seed potato production is included in NAICS Code 111211 - potato farming). FAO databases FAO maintains various databases of agricultural and forestry statistics (called FAOSTAT). The data contained therein is collected from governments using annual questionnaires. The forestry databases do not contain any information about forest tree seed production or the production of other plant material. However, FAOSTAT does have several databases of agricultural production, one of which includes seed production. Agricultural products in these databases are arranged according to FAO’s “Definition and Classification of Commodities”
(for further details, see: http://www.fao.org/ES/faodef/FAODEFE.HTM). This classification system defines 193 primary crops (and groups of primary crops). The definition of seed used by FAO is as follows:
“Data include the amounts of the commodity set aside for sowing or planting (or generally for reproduction purposes, e.g., sugar cane planted, potatoes for seed, eggs for hatching, etc.) during the year. Account is taken of double or successive sowing or planting whenever it occurs. The data of seed include also, when it is the case, the quantities necessary for sowing or planting the area relating to that part of crop products to be harvested green or used for fodderstuff (e.g., green peas, green beans, maize for forage, rye grass, legumes for forage, cabbage for fodder, etc.), or in another form (e.g. dry pulses used for green pulses production). Data for seed element are stored in metric tons (MT)”.
Information about agricultural seed production is given in the “Agricultural crops: primary crops” database and is available for the following crops:
• Roots and tubers: potatoes; sweet potatoes; cassava; yautia (cocoyam); taro (coco yam); yams; and roots and tubers nes.
• Tree nuts: nuts nes. • Vegetables: cabbages; onions and shallots, green; onions, dry; garlic; carrots; okra;
green corn (maize); vegetables fresh nes; and watermelons. • Sugar crops: sugar cane.
Statistics on agricultural seed production for the year 2002 are given in Table 5 below (tree nuts are excluded from this table because only one country reported this and it was a very small amount). The statistics show total agricultural seed production in 2002 of 204 million tonnes. However, it must be noted that these statistics appear to be only partial for many countries and many of them are FAO estimates. Furthermore, these statistics do not include seed production for horticultural use (although the amounts are only likely to be small). They also do not include any information about the total value of seed production.
Table 5 FAOSTAT statistics on agricultural seed production in 2002 (in MT)
Country All primary crops Cereals Oilcrops Roots and
tubers Vegetables Pulses Sugar cane
Afghanistan 202,712 185,435 F 1,057 F 14,000 F 2,220 F Albania 62,391 24,932 71 33,000 4,388 Algeria 267,608 194,146 F 2 70,620 F 2,840 F Angola 34,303 17,568 F 985 F 9,000 F 6,750 F Antigua and Barbuda 3 3 F Argentina 861,957 617,330 F 139,684 77,583 F 27,360 F Armenia 182,780 50,610 132,000 170 Australia 962,675 701,940 F 4,232 F 125,000 F 131,503 F Austria 181,986 121,800 426 F 55,000 F 4,760 Azerbaijan, Republic of 305,128 174,008 720 F 130,400 Bahamas 11 7 F 4 F Bangladesh 891,818 629,357 F 4,600 F 248,988 F 8,873 F Barbados 46 26 F 20 F Belarus 2,751,700 718,500 F 4,200 F 2,000,000 F 29,000 F Belgium-Luxembourg 139,351 63,860 F 577 F 73,000 F 1,914 F Belize 1,071 811 F 260 F Benin 554,143 18,971 F 5,834 F 525,113 F 4,225 F Bhutan 6,642 3,472 F 10 F 3,100 F 60 F Bolivia 247,324 37,657 9,773 197,033 2,861 F Bosnia and Herzegovina 64,806 48,932 F 23 F 15,000 F 851 F Botswana 3,977 3,092 F 47 F 838 F Brazil 1,346,507 768,795 F 125,918 F 275,407 F 7,545 F 168,842 F Brunei Darussalam 20 20 F Bulgaria 316,207 229,748 5,599 78,000 F 2,860 Burkina Faso 72,777 57,105 F 1,319 F 1,753 F 12,600 F Burundi 36,197 6,410 F 287 10,000 F 19,500 F Cambodia 165,728 150,938 624 F 1,280 F 12,886 Cameroon 152,615 27,230 F 9,885 F 69,600 F 12,150 F 33,750 F Canada 2,162,557 1,610,660 F 35,823 F 305,000 F 14,360 F 196,714 F Cape Verde 3,410 0 210 F 3,200 F Central African Republic 55,135 7,030 F 3,135 F 40,195 1,650 F 3,125 F Chad 63,392 34,625 F 14,028 F 5,000 F 9,739 F Chile 180,264 90,755 F 65 84,000 F 5,444 F China, Mainland 13,438,613 9,597,175 617,238 F 3,000,000 F 224,200 F China, Taiwan Prov of 19,831 16,260 F 1,311 F 1,854 F 406 F Colombia 271,518 92,672 1,092 170,000 F 7,754 Comoros 2,692 1,862 F 20 F 810 F Congo, Dem Republic of 166,176 85,274 14,638 24,217 F 11,044 31,003 F Congo, Republic of 2,125 206 F 862 F 507 550 F Costa Rica 38,125 4,109 1 F 3,149 F 866 F 30,000 F Côte d'Ivoire 770,569 91,146 F 4,843 F 673,800 F 780 F Croatia 195,128 96,626 526 96,960 1,016 F Cuba 25,916 9,513 F 338 13,258 F 2,807 F Cyprus 28,708 13,200 F 35 F 15,300 F 173 F Czech Republic 503,295 352,330 1,543 140,000 F 9,422 Denmark 399,377 294,520 F 1,707 96,000 7,150 F Dominica 3,126 3 F 3,109 F 14 F Dominican Republic 22,833 17,577 F 40 2,920 F 2,296 F Ecuador 182,269 55,136 1,886 84,432 F 37,702 F 3,113 Egypt 2,105,309 277,869 F 6,610 F 238,087 32,743 F 1,550,000 F El Salvador 172,883 5,011 F 320 F 750 F 3,827 F 162,975 F Eritrea 21,068 11,818 276 4,250 F 4,724 Estonia 158,631 82,531 75,000 F 1,100 F Ethiopia 413,497 255,128 F 4,574 F 76,450 F 77,345 F Fiji Islands 683 586 F 7 F 10 F 80 F Finland 362,654 293,554 67,900 F 1,200 F
Country All primary
crops Cereals Oilcrops Roots and tubers Vegetables Pulses Sugar cane
France 1,702,299 1,289,079 7,568 F 340,000 65,652 F French Guiana 496 496 F French Polynesia 100 100 F Gabon 5,657 530 F 368 F 4,750 F 9 F Gambia 7,086 4,665 F 1,901 F 520 F Gaza Strip (Palestine) 70 70 F Georgia 119,812 35,712 F 4,100 F 80,000 F Germany 1,862,955 1,153,939 2,044 663,000 F 43,972 Ghana 56,293 40,294 F 9,549 F 2,250 F 4,200 F Greece 366,855 240,550 7,688 F 115,000 3,617 F Grenada 8 6 F 0 F 2 F Guatemala 33,934 21,478 F 175 F 5,000 F 60 F 7,221 F Guinea 49,151 31,332 F 3,569 F 3,000 F 3,150 F 8,100 F Guinea-Bissau 7,233 6,622 F 389 F 222 F Guyana 12,099 12,052 F 26 21 Haiti 19,699 14,820 F 347 F 860 F 3,672 F Honduras 143,936 7,387 F 18 F 2,486 F 5,045 F 129,000 F Hungary 531,200 423,772 8,308 72,000 F 27,120 Iceland 800 800 F India 33,861,872 12,368,000 F 264,571 F 2,100,000 F 715,299 F 18,414,002 F Indonesia 646,752 549,000 F 14,752 F 55,000 F 28,000 F Iran, Islamic Rep of 1,276,876 995,800 F 3,866 F 175,000 F 102,210 F Iraq 355,470 280,844 F 558 F 72,380 F 1,688 F Ireland 63,055 41,526 F 19 F 21,000 F 510 F Israel 21,145 13,093 F 666 F 6,000 F 1,386 Italy 1,074,286 848,350 4,486 190,000 F 12,000 F 19,450 Jamaica 891 28 F 650 F 213 F Japan 348,233 97,251 1,431 245,501 F 4,050 Jordan 15,157 11,319 44 F 3,502 F 292 Kazakhstan 2,075,494 1,631,208 F 7,871 F 330,000 F 101,785 F 4,630 F Kenya 194,580 69,730 F 850 F 96,000 F 28,000 F Korea, Dem People's Rep 172,236 95,038 F 4,670 F 44,528 F 28,000 F Korea, Republic of 96,336 56,930 1,051 37,000 F 1,355 Kuwait 1,311 126 F 1,185 Kyrgyzstan 221,001 19,817 1,184 F 200,000 F Laos 150,863 145,500 F 403 F 4,400 F 560 F Latvia 293,608 97,906 92 194,568 F 1,042 Lebanon 20,266 7,695 F 51 F 11,900 620 F Lesotho 6,315 5,351 F 964 F Liberia 15,613 7,500 F 188 F 275 F 7,650 F Libyan Arab Jamahiriya 82,428 51,586 F 360 30,000 F 482 Lithuania 685,502 218,500 F 2,702 F 450,000 F 6,200 F 8,100 F TFYR Macedonia 70,646 41,792 F 39 F 26,000 F 2,815 F Madagascar 230,019 103,572 F 1,236 F 74,550 F 6,193 F 44,468 F Malawi 153,047 41,300 5,235 F 69,424 F 37,088 F Malaysia 23,507 20,139 F 38 3,330 F Maldives 4 0 F 4 F Mali 142,578 128,214 F 14,337 F 27 F Malta 1,953 404 1,498 F 51 F Mauritania 8,086 3,073 F 53 F 160 F 4,800 F Mauritius 1,629 1 3 F 1,625 F Mexico 688,178 546,230 F 3,800 F 51,600 F 86,548 F Moldova, Republic of 245,761 112,562 699 130,000 F 2,500 F Mongolia 46,221 36,159 10,000 F 62 F Morocco 593,466 476,814 994 97,784 F 17,874 F Mozambique 79,925 49,251 F 7,274 F 6,200 F 17,200 F Myanmar 974,639 691,610 F 27,719 F 17,591 F 111,052 F 126,667 F
Country All primary
crops Cereals Oilcrops Roots and tubers Vegetables Pulses Sugar cane
Namibia 6,451 5,765 F 11 F 675 F Nepal 452,572 173,000 833 F 149,000 F 10,785 F 118,954 F Netherlands 457,475 56,500 400,000 F 975 F New Caledonia 125 3 F 120 F 2 F New Zealand 79,849 22,232 12 F 51,605 F 6,000 Nicaragua 25,354 15,490 F 335 F 1,075 F 8,454 F Niger 256,965 132,259 F 3,042 F 164 F 121,500 F Nigeria 11,953,991 513,302 F 78,699 F 11,164,250 F 182,800 F 14,940 F Norway 100,510 61,240 20 F 39,250 F Oman 129 129 F Pakistan 6,298,992 1,298,300 25,737 F 105,200 65,595 4,804,160 F Panama 19,384 8,275 F 2 F 2,800 F 307 F 8,000 F Papua New Guinea 662 104 F 22 F 104 F 432 F Paraguay 57,378 38,935 F 13,547 F 168 F 4,728 F Peru 444,583 92,566 F 510 317,035 F 25,000 F 9,472 F Philippines 1,369,995 336,365 18,202 F 38,727 F 1,701 975,000 F Poland 4,146,297 2,069,000 16,590 F 2,050,000 F 10,707 F Portugal 197,178 75,000 F 361 120,043 F 1,774 F Réunion 442 100 F 12 F 210 F 120 F Romania 1,544,253 707,526 F 5,067 830,000 F 1,660 Russian Federation 20,946,447 12,154,800 F 118,797 F 8,500,000 F 172,850 F Rwanda 120,021 8,031 522 F 99,978 F 11,490 F Saint Kitts and Nevis 8 0 F 8 F Saint Lucia 1 1 F Saint Vincent/Grenadines 42 12 F 3 27 F Samoa 1 1 F Sao Tome and Principe 2,530 30 F 2,500 F Saudi Arabia 95,260 55,040 F 40,040 F 180 F Senegal 69,309 38,556 F 27,614 F 400 F 2,739 F Serbia and Montenegro 474,436 266,178 1,476 F 203,406 F 3,376 Sierra Leone 24,352 20,632 F 454 F 3,266 F Slovakia 191,306 129,944 827 F 58,680 F 1,855 F Slovenia 29,189 14,759 F 0 F 14,400 F 30 Solomon Islands 291 117 F 174 F Somalia 21,450 15,908 F 582 F 4,960 F South Africa 216,921 136,936 F 5,047 67,200 F 7,738 Spain 1,304,063 1,071,302 F 1,801 F 180,000 F 50,960 F Sri Lanka 108,645 82,871 F 212 8,100 F 16,950 F 512 F Sudan 170,031 149,727 11,612 F 2,100 F 6,592 Suriname 8,007 8,001 F 6 F Swaziland 4,456 2,248 F 190 F 1,800 F 218 F Sweden 317,679 233,000 155 78,000 F 6,524 Switzerland 62,838 31,100 20 F 31,000 718 Syrian Arab Republic 452,506 399,236 2,696 F 28,921 F 21,653 F Tajikistan 63,070 38,750 F 1,920 F 22,000 F 400 F Tanzania, United Rep of 212,639 86,038 F 3,876 F 64,000 F 25,725 F 33,000 F Thailand 778,490 746,580 F 4,080 F 6,930 F 20,900 F Timor-Leste 1,468 1,215 F 74 F 179 F Togo 78,510 19,677 F 2,020 F 53,948 F 2,865 F Tonga 4 4 F Trinidad and Tobago 205 155 F 50 F Tunisia 142,653 110,600 F 100 F 25,000 F 6,953 F Turkey 3,011,148 2,516,596 F 15,072 F 320,000 F 159,480 F Turkmenistan 106,200 98,000 F 7,200 F 1,000 F Uganda 157,952 45,950 F 7,060 F 58,400 F 46,542 F Ukraine 7,598,805 2,475,700 F 15,105 F 5,000,000 F 108,000 F United Kingdom 926,498 479,000 2,498 F 399,000 F 46,000
Country All primary
crops Cereals Oilcrops Roots and tubers Vegetables Pulses Sugar cane
United States of America 7,061,927 3,480,943 487,914 1,275,400 55,000 1,762,670 Uruguay 67,560 55,567 F 1,073 10,430 490 F Uzbekistan 317,534 243,470 12,564 F 60,000 F 1,500 F Vanuatu 30,594 65 F 79 F 30,450 F Venezuela, Boliv Rep of 64,671 25,484 F 5,844 F 32,102 F 1,241 F Viet Nam 49,784,269 1,042,165 F 361 F 47,375,314 F 20,549 F 1,345,880 F Wallis and Futuna Is 16 16 F Yemen 30,844 25,751 F 3,893 F 1,200 F Zambia 31,214 20,573 F 5,981 F 2,100 F 2,560 F Zimbabwe 48,602 42,468 F 6,134 TOTAL 203,988,146 73,375,165 2,355,820 94,733,303 221,619 3,669,209 29,633,030
Source: FAO, 2004 (available at: http://apps.fao.org/default.htm). Note: F = FAO estimate. Seed trade statistics There are also a number of different classifications systems used around the World to record trade in goods and services. However, because of the cross-border nature of international trade, greater efforts have been made to develop and adopt international standards. The most common classification systems used to record international trade statistics are as follows:
• Standard International Trade Classification, Third Revision (SITC Rev. 3);
• Harmonized Commodity Description and Coding System 1996 (HS 1996); and
• Harmonized Commodity Description and Coding System 2002 (HS 2002). The majority of countries have now adopted one of these international classification systems in preference to their national system. The most commonly used classification system at the moment is probably HS 1996 (which replaced SITC Rev. 3), although it is anticipated that more countries will start to use HS 2002 over time. Harmonized Commodity Description and Coding System 1996 The Harmonized System (HS 1996) was developed under the auspices of the Customs Cooperation Council. It is based on a fundamental principle that goods are classified by what they are and not according to their stage of fabrication, use, country of origin or any other such criteria. The Harmonized System is logically structured by economic activity or component material. For example, animals and animal products are found in one section; machinery and mechanical appliances (which are grouped by function) are found in another. HS 1996 is divided into 21 Sections, which, in general, group goods produced in the same sector of the economy. For example, Section IV, "Prepared Foodstuffs; Beverages, Spirits and Vinegar; Tobacco and Manufactured Tobacco Substitutes" (i.e. agricultural products) and Section VI, "Products of the Chemical or Allied Industries" etc. (i.e. chemical products, etc.). Each Section contains one or more Chapters (with 97 Chapters in total). The Chapters of Sections I to XV (except Section XII) are grouped by biological genus (e.g. Section I, Chapters 1-5 Live Animals, Animal products, fish, Dairy products etc.) or by the component
material from which articles are wholly or mainly made (e.g. Section VIII contains Chapter 41 - Raw Hides and Skins; and Chapter 42 - Articles of Leather, etc.). In Sections I to XV (except Section XII), the groups of products formed according to their basic material are structured or divided in two ways:
Horizontal - For the groups of products formed according to their basic material, there is no apparent hierarchical order (e.g. Chapter 39 - "Plastics and Articles Thereof"; Chapter 44 - "Wood and Articles of Wood); i.e. there is no discernable reason that plastic should precede wood. Vertical - For those chapters in which goods are grouped by raw material, there is a vertical structure in which articles are often classified according to their degree of processing. For example, Chapter 44 contains items such as rough wood, wood roughly squared and some wooden finished products such as wooden tableware.
Articles may also be classified according to their use or function. This classification (i.e. by function), mainly occurs in Section XII and Sections XVI - XXI. The basic hierarchical structure of HS 1996 is organised as follows: Sections: groups of Chapters (identified by capitalised roman numerals) Chapters: 2-digit code Headings: 4-digit code Sub-headings: 6-digit code Tariff Items: 8-digit code Statistical Annotations: 10-digit code In the presentation of statistics, HS codes are also sometimes written in groups of two digits separated by a period “.”. HS 1996 has a 6-digit “root” that is common to all countries. This has also been expanded to a common 8-digit “root” for a few products. In a few places, similar products are also grouped together at an odd numbered digit level (e.g. all seeds of forage plants start with the 5-digit code “12092”). Statistics on trade in forest seeds and other forest plant material would not appear along with other forest products in HS 1996, but would be found in Chapters 12 and 6 respectively. Although such materials are not explicitly described in HS 1996, they would possibly occur in several places (shown in bold and underlined in Table 6). For statistics on forest seeds, the most common species used in forest tree planting would most likely be recorded under Sub-heading 120999 (seeds, fruit and spores for sowing, not elsewhere specified). With the exception of fruit seeds, this sub-heading should only include tree seeds, because all other types of seeds used in agriculture and horticulture are included elsewhere in HS 1996. Some tree seeds may also be recorded under Sub-heading 121190 (but species under this sub-heading are not likely to be common forest species - e.g. Neem). For statistics on other forest plant material, unrooted cuttings (e.g. poplars and willow) should occur as part of Sub-heading 060210 (unrooted cuttings and slips) and as part of the Tariff
Item 06029090 (plants, live (including their roots), nes). Fruit and nut trees should be under Sub-heading 060220 (trees, shrubs and bushes, grafted or not, of kinds which bear edible fruit or nuts). Again, some forest plant material may also be recorded under Sub-heading 121190. Table 6 The position and classification of seeds and other plant material in HS 1996
under Section II (vegetable products)
Chapter Heading Sub-heading
Tariff Item HS 1996 label
06 LIVE TREES AND OTHER PLANTS; BULBS, ROOTS AND THE LIKE; CUT FLOWERS AND ORNAMENTAL FOLIAGE
0602 Other live plants (including their roots), cuttings and slips; mushroom spawn 060210 Unrooted cuttings and slips 060220 Trees, shrubs and bushes, grafted or not, of kinds which bear edible fruit or nuts 060230 Rhododendrons and azaleas, grafted or not 060240 Roses, grafted or not 060290 Other 06029010 Mushroom spawn 06029090 Plants, live (including their roots), nes
12 OIL SEEDS AND OLEAGINOUS FRUITS; MISCELLANEOUS GRAINS, SEEDS AND FRUIT; INDUSTRIAL OR MEDICINAL PLANTS; STRAW AND FODDER
1209 Seeds, fruit and spores, of a kind used for sowing 120910 Sugar beet seed 120919 Other
Beet seeds (5-digit “group”)
120921 Lucerne (alfalfa) seed 120922 Clover (Trifolium spp.) seed 120923 Fescue seed 120924 Kentucky blue grass (Poa pratensis L.) seed 120925 Rye grass (Lolium multiflorum Lam., Lolium perenne L.) seed 120926 Timothy grass seed 120929 Seeds of forage plants, for sowing, nes
Seeds of forage plants
(5-digit “group”)
120930 Seeds of herbaceous plants cultivated principally for their flowers 120991 Seeds, vegetable, for sowing, nes 120999 Seeds, fruit and spores for sowing, nes
Other seeds (5-digit “group”)
1211 Plants and parts of plants (including seeds and fruits), of a kind used primarily in perfumery, in pharmacy or for insecticidal, fungicidal or similar purposes, fresh or dried, whether or not cut, crushed or powdered
121110 Liquorice roots 121120 Ginseng roots 121190 Other
Source: RAMON - Eurostat's Classifications Server, 2003 (available at: http://europa.eu.int/comm/eurostat/ramon). For comparison with agriculture, there is the same problem as noted earlier, in that seeds that are used for consumption and for planting are not divided along these lines in HS 1996 at the 6-digit level. Some countries may make this distinction at the 8-digit or 10-digit level (see below), but this is optional and different countries may use different coding systems. Thus, it would probably be very difficult and time-consuming to collect and collate all of this information from international trade statistics. The only component of total seed production that is classified at the 6-digit level in HS 1996 is seeds that are not used for consumption (Heading 1209 - Seeds, fruit and spores, of a kind used for sowing). FAO databases FAOSTAT contains two databases that may be used to obtain seed statistics. The first is the “Trade flow valid data: all agricultural products”. This database comprises import and export statistics expressed in terms of quantity and value and reported by origin and destination countries. All quantities are expressed in terms of metric tonnes (MT) and values in terms of 1000 USD.
These data are generated from the “Trade Flow Source” data (see below) through a conversion process that converts from the original nomenclature of the reporter country to the FAOSTAT data standards. Furthermore, data has to be validated because sometimes the original data contains errors and it has to be reconciled when discrepancies appear between reporter countries and trading partners. In the absence of reliable sources or when information for the latest year is not available, figures for quantities and values are estimated from the statistics of trading partners. In a few instances, when information is available in terms of quantities only, corresponding values are estimated, using unit values based on data from trading partners. This database only includes statistics on international trade in “seeds, fruits and spores for planting”, which presumably corresponds to HS 1996 Heading 1209 - Seeds, fruit and spores, of a kind used for sowing. Table 7 presents this information for the year 2002. The table shows total trade of this product category of 740 thousand MT, with a total value of trade of around 2.35 billion USD. Forest tree seeds would be included as part of this, but the amount might be only a small proportion of the total as trade in seeds used for grass and other forage plants is probably quite high.
Table 7 FAOSTAT statistics on exports of “seeds, fruits and spores for planting” in 2002
Country Quantity
(in MT) Value
(in ‘000 USD) Unit value (USD/MT) Country Quantity
(in MT) Value
(in ‘000 USD) Unit value (USD/MT)
Albania 99 88 889 Kyrgyzstan 522 837 1,603 Argentina 2,860 4,912 1,717 Latvia 11 1,186 107,818 Armenia 0 0 0 Lithuania 429 825 1,923 Australia 17,734 40,798 2,301 Luxembourg 696 969 1,392 Austria 808 3,949 4,887 Madagascar 1 12 12,000 Azerbaijan, Republic of 1 7 7,000 Malaysia 224 529 2,362 Barbados 0 5 0 Malta 2 118 59,000 Belarus 524 536 1,023 Mauritius 5 11 2,200 Belgium 11,520 51,148 4,440 Mexico 1,284 10,312 8,031 Benin 4 229 57,250 Moldova, Republic of 478 3,250 6,799 Brazil 6,820 24,718 3,624 Mongolia 0 0 0 Cameroon 0 0 0 Morocco 495 2,997 6,055 Canada 52,610 60,788 1,155 Namibia 203 132 650 China, Hong Kong SAR 28 150 5,357 Netherlands 102,090 480,284 4,705 China, Mainland 6,731 29,155 4,331 New Caledonia 0 25 0 China, Taiwan Prov of 957 14,366 15,011 New Zealand 14,600 22,932 1,571 Colombia 2 27 13,500 Nicaragua 27 28 1,037 Costa Rica 237 8,398 35,435 Norway 29 504 17,379 Côte d'Ivoire 0 0 0 Pakistan 1,949 1,541 791 Croatia 184 504 2,739 Panama 4 4 1,000 Cuba 1 595 595,000 Peru 95 4,097 43,126 Cyprus 4 34 8,500 Philippines 615 1,291 2,099 Czech Republic 6,010 9,405 1,565 Poland 1,780 4,582 2,574 Denmark 97,320 145,124 1,491 Portugal 452 2,619 5,794 Ecuador 192 145 755 Qatar 0 0 0 Egypt 15,404 9,455 614 Romania 351 265 755 El Salvador 2 13 6,500 Russian Federation 163 608 3,730 Estonia 198 124 626 Saudi Arabia 54 119 2,204 Ethiopia 18 2 111 Singapore 179 920 5,140 Fiji Islands 2 6 3,000 Slovakia 825 918 1,113 Finland 68 479 7,044 Slovenia 1,007 3,021 3,000 France 43,389 201,264 4,639 South Africa 8,443 13,183 1,561 French Polynesia 10 12 1,200 Spain 7,431 20,485 2,757 Georgia 21 410 19,524 Sri Lanka 13 940 72,308 Germany 40,306 210,527 5,223 Sudan 1 0 0 Greece 378 1,352 3,577 Swaziland 68 27 397 Guatemala 227 8,168 35,982 Sweden 1,600 24,073 15,046 Guyana 0 0 0 Switzerland 217 1,813 8,355 Honduras 21 288 13,714 Tanzania, United Rep of 160 291 1,819 Hungary 5,651 8,184 1,448 Thailand 4,110 19,718 4,798 Iceland 5 85 17,000 Trinidad and Tobago 2 63 31,500 India 10,659 20,762 1,948 Tunisia 271 87 321 Indonesia 802 1,377 1,717 Turkey 8,346 6,755 809 Iran, Islamic Rep of 3,720 2,687 722 Uganda 12 52 4,333 Ireland 354 494 1,395 Ukraine 8,922 14,405 1,615 Israel 15,490 53,075 3,426 United Kingdom 6,995 60,677 8,674 Italy 20,914 88,909 4,251 United States of America 197,316 537,306 2,723 Japan 1,676 82,795 49,400 Uruguay 2,424 1,885 778 Jordan 2 313 156,500 Yemen 4 2 500 Kenya 145 1,212 8,359 Zambia 28 28 1,000 Korea, Republic of 526 17,367 33,017 Zimbabwe 888 2,388 2,689
The second FAOSTAT database containing statistics on international trade in seeds and other plant material is the “Trade flow source data: all agricultural products”. The purpose of this database is to allow users to have access to the raw trade flow statistics that FAO receives each year on tapes and diskettes. This data comes from national correspondents and from the COMTRADE database, which is compiled each year by the United Nations Statistics Division from the data that they receive from national customs authorities. Some of the raw data is altered before it is included in the database (e.g. countries are given numeric codes to comply with the FAOSTAT data standards). However, most of the data is left in its original format. Most importantly, the statistics are not converted to common measurement units (amounts and values), although information about the measurements used in the statistics is also given in the database in some cases. To examine the viability of using this database to collect information about trade in seeds, data for Canada was extracted and examined. Canada was chosen because a complete listing of Canada’s international trade classification system is available on-line at the STATCAN website (http://www.statcan.ca/english/tradedata/cec/index.htm). This database presents all of the HS 1996 codes used by Canada to the 8-digit HS 1996 code level (i.e. Tariff Item). The process used to extract this data was as follows. First, all of the tariff items containing the word “seed” were extracted from the STATCAN database. This resulted in 102 tariff items containing the word “seed”. Non-agricultural products were removed from this list (e.g. seed planters) and the codes for other plant material (from HS 1996 Chapter 6) were added to the list. This gave a total list of 94 tariff items. Agricultural and horticultural seeds used for planting and/or planting stock are covered by 73 tariff items (although some of these may include more than just seeds). Forest tree seeds are covered by two tariff items and forest plant material is covered by four tariff items (see Table 8). These codes were then used to extract the trade quantities and values (imports and exports) for Canada in the year 2002 from the FAOSTAT database. The data had to be extracted product by product at the HS 1996 6-digit level, which took a considerable amount of time.
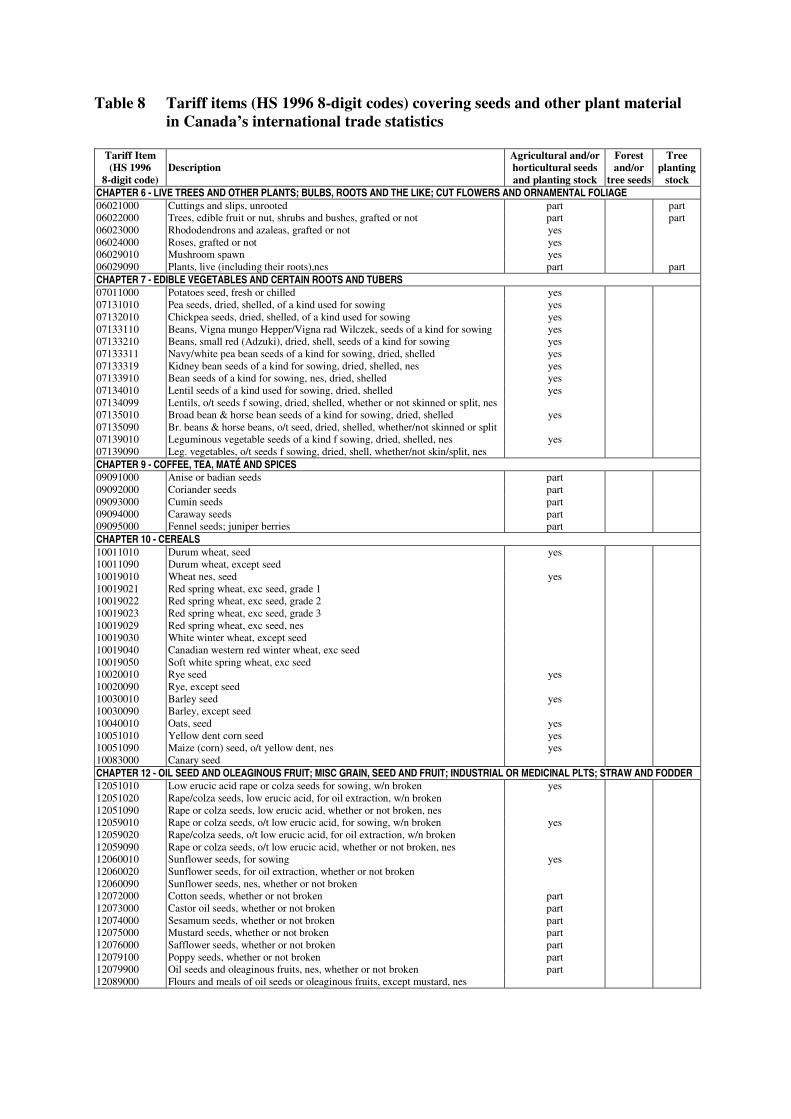
Table 8 Tariff items (HS 1996 8-digit codes) covering seeds and other plant material in Canada’s international trade statistics
Tariff Item (HS 1996
8-digit code) Description
Agricultural and/or horticultural seeds and planting stock
Forest and/or
tree seeds
Tree planting
stock CHAPTER 6 - LIVE TREES AND OTHER PLANTS; BULBS, ROOTS AND THE LIKE; CUT FLOWERS AND ORNAMENTAL FOLIAGE 06021000 Cuttings and slips, unrooted part part 06022000 Trees, edible fruit or nut, shrubs and bushes, grafted or not part part 06023000 Rhododendrons and azaleas, grafted or not yes 06024000 Roses, grafted or not yes 06029010 Mushroom spawn yes 06029090 Plants, live (including their roots),nes part part CHAPTER 7 - EDIBLE VEGETABLES AND CERTAIN ROOTS AND TUBERS 07011000 Potatoes seed, fresh or chilled yes 07131010 Pea seeds, dried, shelled, of a kind used for sowing yes 07132010 Chickpea seeds, dried, shelled, of a kind used for sowing yes 07133110 Beans, Vigna mungo Hepper/Vigna rad Wilczek, seeds of a kind for sowing yes 07133210 Beans, small red (Adzuki), dried, shell, seeds of a kind for sowing yes 07133311 Navy/white pea bean seeds of a kind for sowing, dried, shelled yes 07133319 Kidney bean seeds of a kind for sowing, dried, shelled, nes yes 07133910 Bean seeds of a kind for sowing, nes, dried, shelled yes 07134010 Lentil seeds of a kind used for sowing, dried, shelled yes 07134099 Lentils, o/t seeds f sowing, dried, shelled, whether or not skinned or split, nes 07135010 Broad bean & horse bean seeds of a kind for sowing, dried, shelled yes 07135090 Br. beans & horse beans, o/t seed, dried, shelled, whether/not skinned or split 07139010 Leguminous vegetable seeds of a kind f sowing, dried, shelled, nes yes 07139090 Leg. vegetables, o/t seeds f sowing, dried, shell, whether/not skin/split, nes CHAPTER 9 - COFFEE, TEA, MATÉ AND SPICES 09091000 Anise or badian seeds part 09092000 Coriander seeds part 09093000 Cumin seeds part 09094000 Caraway seeds part 09095000 Fennel seeds; juniper berries part CHAPTER 10 - CEREALS 10011010 Durum wheat, seed yes 10011090 Durum wheat, except seed 10019010 Wheat nes, seed yes 10019021 Red spring wheat, exc seed, grade 1 10019022 Red spring wheat, exc seed, grade 2 10019023 Red spring wheat, exc seed, grade 3 10019029 Red spring wheat, exc seed, nes 10019030 White winter wheat, except seed 10019040 Canadian western red winter wheat, exc seed 10019050 Soft white spring wheat, exc seed 10020010 Rye seed yes 10020090 Rye, except seed 10030010 Barley seed yes 10030090 Barley, except seed 10040010 Oats, seed yes 10051010 Yellow dent corn seed yes 10051090 Maize (corn) seed, o/t yellow dent, nes yes 10083000 Canary seed CHAPTER 12 - OIL SEED AND OLEAGINOUS FRUIT; MISC GRAIN, SEED AND FRUIT; INDUSTRIAL OR MEDICINAL PLTS; STRAW AND FODDER 12051010 Low erucic acid rape or colza seeds for sowing, w/n broken yes 12051020 Rape/colza seeds, low erucic acid, for oil extraction, w/n broken 12051090 Rape or colza seeds, low erucic acid, whether or not broken, nes 12059010 Rape or colza seeds, o/t low erucic acid, for sowing, w/n broken yes 12059020 Rape/colza seeds, o/t low erucic acid, for oil extraction, w/n broken 12059090 Rape or colza seeds, o/t low erucic acid, whether or not broken, nes 12060010 Sunflower seeds, for sowing yes 12060020 Sunflower seeds, for oil extraction, whether or not broken 12060090 Sunflower seeds, nes, whether or not broken 12072000 Cotton seeds, whether or not broken part 12073000 Castor oil seeds, whether or not broken part 12074000 Sesamum seeds, whether or not broken part 12075000 Mustard seeds, whether or not broken part 12076000 Safflower seeds, whether or not broken part 12079100 Poppy seeds, whether or not broken part 12079900 Oil seeds and oleaginous fruits, nes, whether or not broken part 12089000 Flours and meals of oil seeds or oleaginous fruits, except mustard, nes
Tariff Item (HS 1996
8-digit code) Description
Agricultural and/or horticultural seeds and planting stock
Forest and/or
tree seeds
Tree planting
stock 12091000 Seeds, sugar beet, for sowing yes 12092110 Seeds, lucerne (alfalfa), for sowing, certified yes 12092190 Seeds, lucerne (alfalfa), for sowing, o/t certified yes 12092211 Seeds, Red clover, double cut, for sowing yes 12092219 Seeds, Red clover, nes, for sowing yes 12092220 Seeds, Sweet clover, for sowing yes 12092230 Seeds, Alsike clover, for sowing yes 12092240 Seeds, white clover, for sowing yes 12092290 Seeds, clover nes, for sowing yes 12092311 Seeds, creeping red fescue, for sowing, certified yes 12092319 Seeds, creeping red fescue, for sowing, o/t certified yes 12092320 Seeds, tall fescue, for sowing yes 12092330 Seeds, meadow fescue, for sowing yes 12092390 Seeds, fescue nes, for sowing yes 12092400 Seeds, Kentucky blue grass, for sowing yes 12092510 Seeds, rye grass, annual, for sowing yes 12092520 Seeds, rye grass, perennial, for sowing yes 12092610 Seeds, Timothy grass, for sowing, certified yes 12092690 Seeds, Timothy grass, for sowing, other than certified yes 12092911 Seeds, Brome grass, meadow, for sowing yes 12092912 Seeds, Brome grass, smooth, for sowing yes 12092919 Seeds, Brome grass, nes, for sowing yes 12092921 Seeds, Wheatgrass, crested, for sowing yes 12092929 Seeds, Wheatgrass, nes, for sowing yes 12092930 Seeds, bent grass , for sowing yes 12092940 Seeds, Bird's-foot trefoil, for sowing yes 12092950 Seeds, Orchard grass, for sowing yes 12092991 Seeds, Wild rye, for sowing yes 12092999 Seeds of forage plants, for sowing, nes yes 12093000 Seeds, flower, for sowing yes 12099100 Seeds, vegetable, nes for sowing yes 12099900 Seeds, fruit and spores for sowing, nes part part 12119000 Plants &pts of plants(incl seed & fruit) used in pharm, perf, insect etc, nes part part part 12121000 Locust beans, including seeds, fresh, chilled, frozen or dried, w/n ground part TOTAL NUMBER OF TARIFF ITEMS REFERRING TO SEED AND/OR PLANT MATERIAL 73 2 4
Source: STATCAN (available at: http://www.statcan.ca/english/tradedata/cec/index.htm). The results obtained from this exercise are given in Table 9. The main problem with this particular dataset is that it does not give the measurement units used in the case of Canada. It is likely that the value data would be recorded in national currency (CND), but this could be in single units, thousands or millions. Quantity data is likely to be recorded in metric measurement units, but the same problem of scale applies. Examination of the unit price data showed that the same units may not be used for import and export statistics in some cases (e.g. see the figures shown in bold in Table 9) and comparisons between similar products suggest that different units may be used for different products.
Table 9 FAOSTAT statistics on Canada’s international trade in seeds and other plant material in 2002 (raw data)
Quantity Value Unit price Tariff Item Description imports exports imports exports imports exports both
07011000 Potatoes seed, fresh or chilled 1,001,600 13,422,500 3,409,035 50,179,612 3.40 3.74 3.72 07131010 Pea seeds, dried, shelled, of a kind used for sowing 356,300 1,445,415,984 2,465 6,896,515 0.01 0.00 0.00 07132010 Chickpea seeds, dried, shelled, used for sowing 0 195,211,500 0 1,335,948 n.a. 0.01 0.01 07133110 Beans,Vigna mungo Hepper/Vigna rad Wilczek sowing 132,289,789 149,515,304 1,282,067 1,496,386 0.01 0.01 0.01 07133210 Beans, small red (Adzuki), dried, shell, for sowing 0 329,131,708 0 3,631,299 n.a. 0.01 0.01 07133311 Navy/white pea bean seeds for sowing, dried, shelled 1,486,880,724 11,491,257 0.02 0.01 0.01 07133319 Kidney bean seeds for sowing, dried, shelled, nes
It is possible to compare the raw data and validated data for HS 1996 Heading 1209 - Seeds, fruit and spores, of a kind used for sowing, because this product category appears in both databases (see Table 10). The total quantities in the two datasets are very different and are not proportional to one another, suggesting that the raw data contains a number of different measurement units and figures at different scales. The figures for total value from the two datasets are also different, but are proportionately similar to each other. This could be because the raw value data has been converted from CND to USD in the validated database, but then the former should be larger than the latter. Thus, it remains difficult to interpret the value statistics presented in the raw data. The last line in Table 10 shows an estimate of the total quantity and value of trade in forest seeds with Canada in 2002. This estimate was produced by dividing the quantities and values under code 12099900 by the total quantities under 1209 in the raw data and applying this fraction to the validated data. Such an approximation would only work if the same measurement units have been used for all of the raw data under HS 1996 Heading 1209. As it is not known if this is the case, this estimate should be treated with a great deal of caution. Table 10 Comparison of the raw and validated statistics on Canada’s international
trade in “seeds, fruits and spores for planting” in 2002 (from FAOSTAT)
Quantity Value Unit price HS 1996 code Description imports exports imports exports imports exports both
1209 Seeds, fr & spores, used for sowing (raw data) 1,850,031,418 5,260,974,056 110,631,993 95,373,835 0.06 0.02 0.03 1209 Seeds, fr & spores, used for sowing (FAO validated) 36,996 105,220 141,022,000 121,576,000 3,812 1,155 1,846 12099900 Seeds, fr & spores for sowing, nes (FAO estimate) 2,683 322 7,145,206 1,046,201 2,664 3,254 2,727
Source: FAO, 2004 (available at: http://apps.fao.org/default.htm). Note: measurement units for the raw data are undefined; for the other data, quantities are in MT, values are in USD and unit prices are in USD per MT. Other sources of data An internet search was also employed to see if statistics on the production and trade of forest seeds and other plant material could be obtained form other sources. This did not yield many results, but what was obtained is presented in Tables 11 to 16 below. Tables 11 and 12 present some statistics on seed imports and exports in the Republic of Korea. These were obtained from the US Department of Agriculture, Foreign Agricultural Service (FAS, see: http://www.fas.usda.gov for further details). These two tables show the total quantity and value of forest tree seed imports and exports for the year 2001-2002. They also show trade in other types of seeds for comparison. The complete report contains information about the production of most types of seeds in the Republic of Korea except, unfortunately, forest seeds. Tables 13 and 14 present statistics on the value of forest tree seed imports and exports for the United States of America. These were also obtained from the FAS website. This data is available for a number of years and is disaggregated by trading partner countries. It is also possible to query the database at the 10-digit level, so it would be possible to obtain statistics on trade of other types of seeds, but this would require a lot of knowledge about the details of the coding system used in the United States of America and could take a lot of time.
Table 11 Republic of Korea planting seed imports 2001-2002 (July-June)
Source: Korean Customs Service, in: Republic of Korea planting seeds annual 2002, USDA FAS GAIN Report #KS2054. Table 12 Republic of Korea planting seed exports 2001-2002 (July-June)
To World To USA Commodity Volume (in kg)
Value (in ‘000 USD)
Volume (in kg)
Value (in ‘000 USD)
Herbaceous Plants 785 9 0 0 Vegetable Seed 476,228 17,430 9,254 1,081 Seeds of other forest tree 12,316 140 130 12 Lawn Seed 60 1 60 1 Other 68,266 547 250 1 TOTAL 557,655 18,127 9,694 1,095
Source: Korean Customs Service, in: Republic of Korea planting seeds annual 2002, USDA FAS GAIN Report #KS2054. Table 13 United States of America value of exports of tree and shrub seeds (HS 1996
Source: Department of Commerce, U.S. Census Bureau, Foreign Trade Statistics. Note: (*) denotes a country that is a summarisation of its component countries.
Table 14 United States of America value of imports of tree and shrub seeds (HS 1996 10-digit code 1209992000) by country 1997-2001
Source: Department of Commerce, U.S. Census Bureau, Foreign Trade Statistics. Note: (*) denotes a country that is a summarisation of its component countries.
Table 15 Estimates of the commercial markets for seeds and planting material
market (million USD) USA 5,700 Greece 140 China 3,000 Egypt 140 Japan 2,500 Belgium 130 CIS 2,000 Chile 120 France 1,370 Nigeria 120 Brazil 1,200 Kenya 100 Germany 1,000 New Zealand 90 Argentina 930 Slovakia 90 Italy 650 Switzerland 80 India 600 Finland 80 United Kingdom 570 Paraguay 70 Canada 550 Ireland 60 Poland 400 Portugal 60 Mexico 350 Bangladesh 60 Spain 300 Colombia 40 Netherlands 300 Bolivia 35 Australia 280 Peru 30 Hungary 200 Zimbabwe 30 Denmark 200 Slovenia 30 Sweden 200 Saudi Arabia 18 Austria 170 Zambia 15 Turkey 170 Ecuador 12 Morocco 160 Malawi 10 South Africa 150 Dominican Rep. 7 Czech Republic 150 TOTAL 24,387
Source: International Seed Federation (www.worldseed.org). Note: the total represents the sum of the commercial seed markets of the listed countries. The total commercial world seed market is assessed at approximately USD 30 billion. Table 16 Estimated values of seed exports from some countries
Country Agricultural Seeds (in million USD)
Horticultural Seeds (in million USD)
Total (in million USD)
USA 550 249 799 Netherlands 420 200 620 France 373 125 498 Denmark 150 40 190 Germany 150 35 185 Chile 84 60 144 Canada 104 18 122 Belgium 111 n.a. n.a. Italy 70 41 111 Japan 5 100 105 Brazil n.a. n.a. 80 Argentina 68 1 69 Hungary n.a. n.a. 65 Australia 30 13 43 Austria 40 n.a. n.a. New-Zealand 28 8 36 Sweden n.a. n.a. 35 Spain 23 10 33 China 8 22 30 Thailand 6 18 24 Turkey n.a. n.a. 22
Mexico n.a. 20 n.a. India 4 16 20 Czech Rep. 18 0 18 South Africa 10 7 17 Korea n.a. n.a. 16 Israel 1 14 15 Russian Fed. 11 2 13 Taiwan n.a. 8 8 Guatemala 0 8 8 Kenya n.a. n.a. 5 Pakistan 1 4 5 Uruguay 4.5 0 4.5 Bolivia 3 0 3 Colombia 3 0 3 Costa Rica 0 3 3 Ethiopia 2 0 2 Peru 0 1.5 1.5 Finland 1 0 1 TOTAL 2,278.5 1,023.5 3,354
Source: International Seed Federation (www.worldseed.org). Note: these figures reflect seed movements only and do not take licenses into consideration. Tables 15 and 16 reproduce statistics published by the International Seed Federation (ISF) at: www.worldseed.org. These show a total commercial world seed market of about USD 30 billion. Their website does not specify how this is defined or where these statistics have come from but, presumably, they have been collected from ISF members. Because this is only the “commercial” market, these figures are likely to be a large underestimate of the total value of World seed production. For example, dividing their value figure by the total amount of production recorded in FAOSTAT (which is itself probably an underestimate) produces a unit value of production of only USD 150 per MT, which is very low compared with the unit values shown in the trade statistics presented in Table 7. Similarly, their figure for the value of total seed exports from the Republic of Korea is less than the figure given for planting seeds alone in Table 12.
Summary and conclusions Table 17 below presents a summary of the information that is readily available from national and international statistics about the production and trade in agricultural and forest seeds and other plant material. Table 17 Summary of information available about the production and trade of
agricultural seeds and forest seeds and other plant material and
Production International trade Type of seed and plant material Classification Quantity Value Classification Quantity Value Forest seeds Not separately classified in
any of the main classification systems.
n.a. n.a. HS 1996 Sub-heading 120999.
may be available
may be available
Other forest plant material
Not separately classified in any of the main classification systems.
n.a. n.a. Included as part of a number of HS 1996 sub-headings. May be defined by countries as a collection of HS-codes at a higher digit-level.
n.a. n.a.
Agricultural seeds of a type that is consumed and planted
In all classification systems, this is included in total production (i.e. consumed and planted). However, FAO collects this data using an annual questionnaire.
Available in FAOSTAT
n.a. This is included in total production at the 6-digit level in HS 1996 (sub-headings). May be defined by countries as a collection of HS-codes at a higher digit-level.
n.a. n.a.
Agricultural seeds used for planting only
Classified under several codes in CPC 1.1 only. Not separately classified in any of the other main classification systems. Not defined, recorded or classified in FAOSTAT.
The total for HS 1996 Heading 1209 is available in FAOSTAT
The total for HS 1996 Heading 1209 is available in FAOSTAT
For production statistics, the table shows that forest seeds and other pant material are not sufficiently well defined in most classification systems to allow such statistics to be easily obtained. In the rest of the agricultural sector, the main classification problem is the lack of separation between seed production and production for consumption in the case of seeds that are consumed (e.g. grains, pulses, etc.). However, statistics on the production of most types of agricultural seeds are readily available in FAOSTAT (although the coverage of this database may be only partial and it includes a lot of estimates). Ironically, the one component of agricultural seed production that does not appear in FAOSTAT is seeds that are only used for planting. A further point worth noting is that production statistics are nearly always measured in units of weight (e.g. kg or MT). In the case of seeds, there are huge differences between different types of seeds in terms of their individual size and weight. Thus, even if production statistics were available, they would have to be treated very carefully in any analysis. Statistics on the total value of seed production are not readily available anywhere. National income accounts do contain statistics on the value of output by different sectors of the economy, but these are always organised according to one of the systems used to classify economic activities. These classification systems are not very detailed and none of them identifies seed production separately. Indeed, in many cases, the value of output from the whole of the forestry sector is the only figure available (if at all).
The value of seed output could be estimated by multiplying quantities of production and unit values from trade statistics, but this would have to be done very carefully due to differences in size and weight (see above). In addition, there is also the problem that trade prices are often not representative of domestic market prices due to differences in product quality. For trade statistics, the situation is somewhat better. Most international trade statistics are compiled according to one of a few internationally agreed classification systems. These classification systems are very detailed and individual items within them are very carefully defined. Information about the quantity and value of seed production could be obtained from these statistics, but this would require examination of the statistics in great detail. Forest tree seeds are a major component of one of the sub-headings in HS 1996 (HS 1996 Code 120999). Statistics compiled at this level of HS 1996 (the 6-digit level) are internationally comparable, so it might be possible to obtain quantity and value statistics quite easily from the COMTRADE database compiled by the United Nations Statistical Office. However, it may take a lot of time to “clean” the data to convert these statistics into common measurement units. This sub-heading also contains a few other types of seed. It would be necessary to obtain more details about the coding systems used in every country (i.e. the definitions used for higher digit levels) to separate the forest tree seeds from these other types of seed. At this more detailed level, the coding systems used by different countries may vary, so this would take a lot of time and effort. It is likely that these other types of seed will only account for a small proportion of the total, so it would probably not be worthwhile trying to do this. Other types of forest plant material occurs under a number of HS 1996 sub-headings. It only occurs under a few sub-heading but, in each case, forest plant material would account for only a (probably small) proportion of the total under the sub-heading. Thus, calculating the total for the sub-headings would be relatively easy, but probably give an estimate of the quantity and value of trade that would be far too high. For comparison with the rest of the agricultural sector, it would be extremely difficult to calculate total seed trade quantities and values. Again, the main problem is the inclusion of seed production in total production for seeds that are consumed. To calculate total seed trade, it would be necessary to obtain detailed HS 1996 codes for every country, identify which items should be included in the total, “clean” the data and add all of the figures together. An attempt to do this for Canada demonstrated that this would be very time consuming. For countries that do not keep trade statistics at more detailed levels of HS 1996 (which could be many), it would not be possible to do this at all. In conclusion, despite the lack of statistics in this area, it seems likely that the size of the market for forest seeds is relatively small in comparison to agriculture and could amount to about one percent (or less) of the total. In order to obtain statistics about the production and trade of forest seeds and other plant material, it seems likely that a special survey would be required. If desired, this should not be too difficult, as this is one area where governments have maintained a strong interest in the forestry sector through regulation, licensing and inspections. Such a survey should make use of the existing definitions used in the 1996 HS international trade classification system and special attention should be given to recording quantities by amount and/or weight of seeds.