International Workshop on New Generation Port Cities and Global Supply Chains The University of Hong Kong, 12-14 December 2005 New Port-Hinterland Relationships: Experiences from North America Jean-Paul Rodrigue, Hofstra University, New York Email: [email protected]Paper available at: http://people.hofstra.edu/faculty/Jean- paul_Rodrigue
Transcript
International Workshop on New Generation Port Cities and Global Supply ChainsThe University of Hong Kong, 12-14 December 2005
New Port-Hinterland Relationships: Experiences from North America
Jean-Paul Rodrigue, Hofstra University, New York
Email: [email protected] available at:http://people.hofstra.edu/faculty/Jean-paul_Rodrigue
Integration Forces Shaping Hinterlands
Geographical Integration Functional Integration
Spatial fragmentation of production and consumption. Exploitation of comparative advantages.
Logistics & SCM. Integration between maritime and inland transport systems.
SM
D
Origin / Destination Relationships
D S M
1 2 3
1 2 3
S M D
S M D
Supply / Demand Relationships
Information Flows
Physical Flows
Supplying Manufacturing Distribution
Global Production Networks
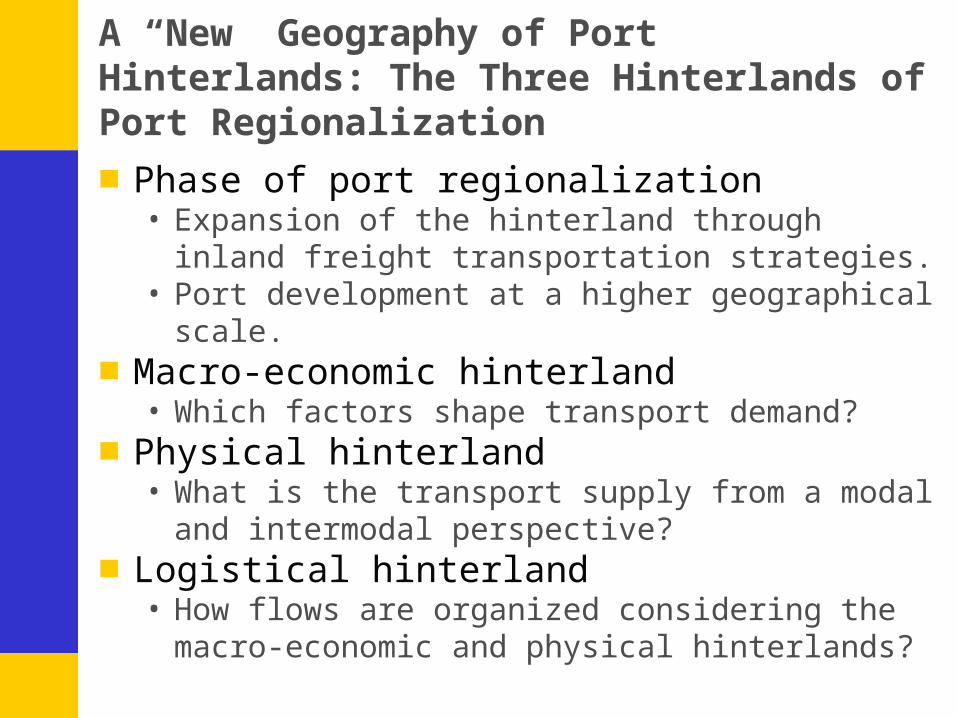
A “New” Geography of Port Hinterlands: The Three Hinterlands of Port Regionalization
■ Phase of port regionalization• Expansion of the hinterland through inland freight transportation
strategies.• Port development at a higher geographical scale.
■ Macro-economic hinterland• Which factors shape transport demand?
■ Physical hinterland• What is the transport supply from a modal and intermodal
perspective?■ Logistical hinterland
• How flows are organized considering the macro-economic and physical hinterlands?
Elements Logistical sites (production and consumption) as part of GPNs
Transport links and terminals
Mode, Timing, punctuality and frequency of services
Challenge International division of production and consumption
Additional capacity (modal and intermodal)
Supply chain management
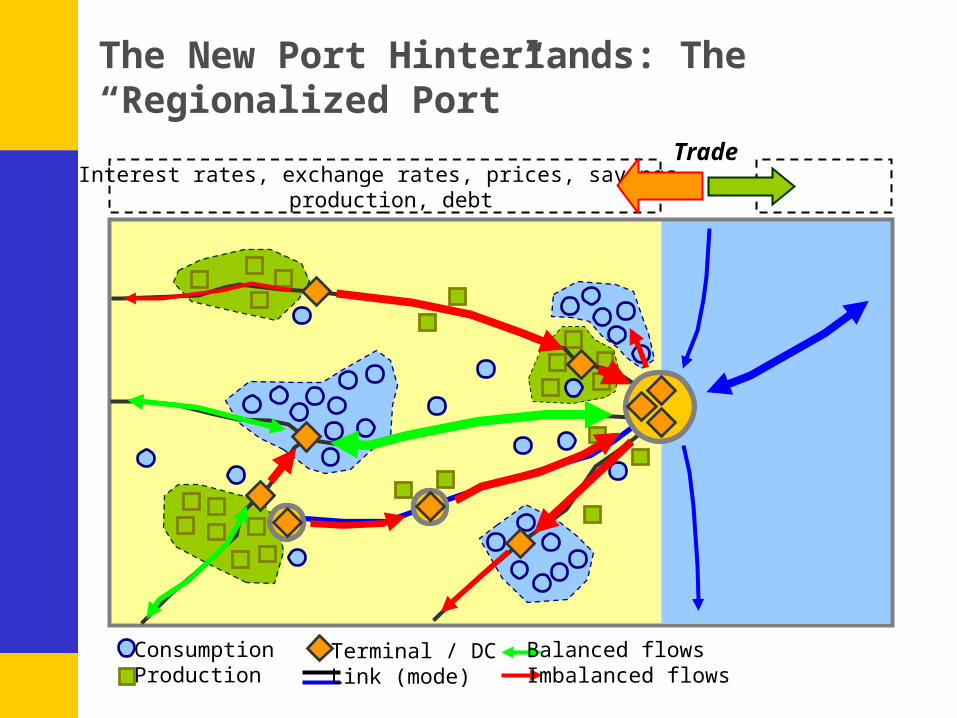
The New Port Hinterlands
■ Macro-economic port regionalization in North America• Tremendous growth in transport demand.• Shifting comparative advantages; less production but more
consumption.• De-industrialization, relocation and re-industrialization:
• The automotive industry is collapsing (GM, Ford, Delphi, etc).• Platform companies; emerging organizational/logistical structure.• Artificially induced demand; financial leverage; asset inflation and
debt.
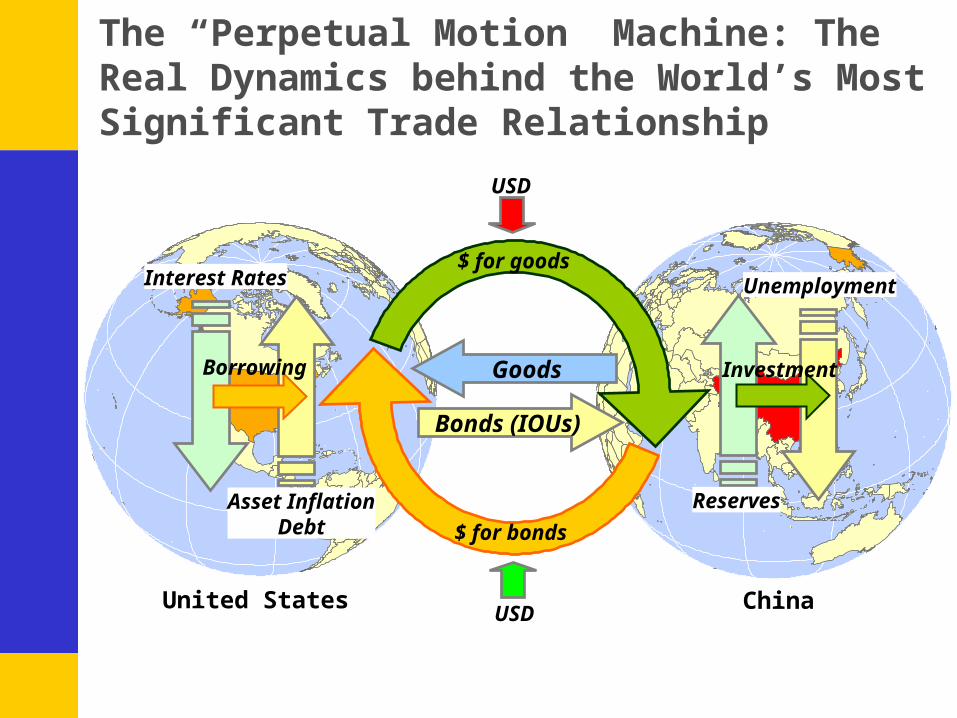
The “Perpetual Motion” Machine: The Real Dynamics behind the World’s Most Significant Trade Relationship
Goods
Bonds (IOUs)
Asset InflationDebt
Reserves
Interest Rates Unemployment$ for goods
$ for bonds
United States ChinaUSD
USD
Borrowing Investment
World’s 10 Largest Exporters and Importers, 2004
0 200 400 600 800 1000 1200 1400 1600
Germany
United States
China
Japan
France
Netherlands
Italy
United Kingdom
Canada
Belgium Imports
Exports
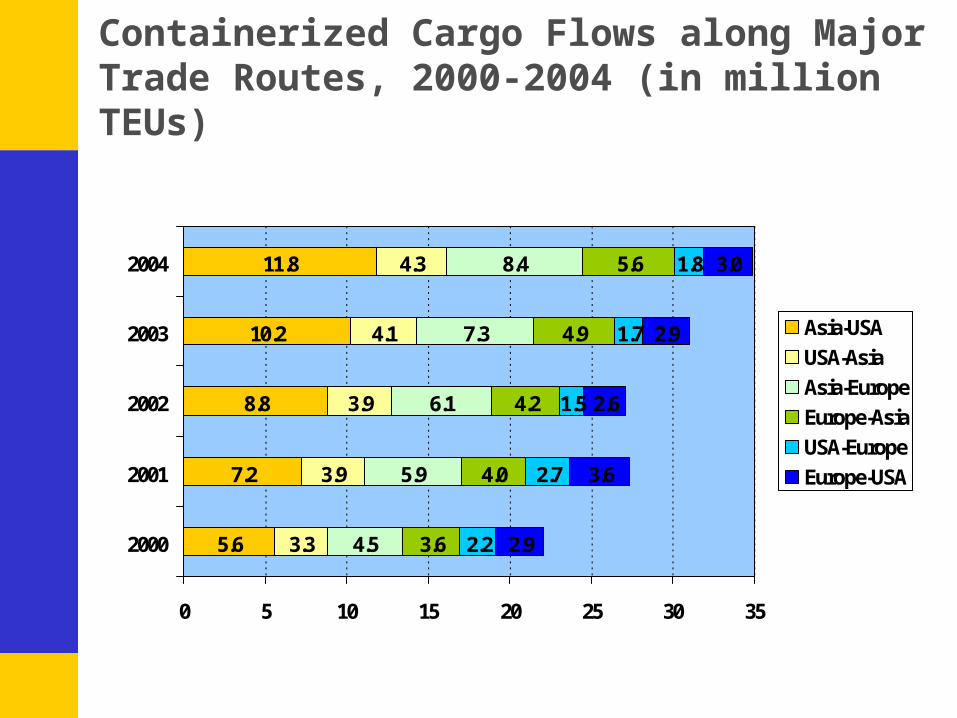
Containerized Cargo Flows along Major Trade Routes, 2000-2004 (in million TEUs)
5.6
7.2
8.8
10.2
11.8
3.3
3.9
3.9
4.1
4.3
4.5
5.9
6.1
7.3
8.4
3.6
4.0
4.2
4.9
5.6
2.2
2.7
1.5
1.7
1.8
2.9
3.6
2.6
2.9
3.0
0 5 10 15 20 25 30 35
2000
2001
2002
2003
2004
Asia-USA
USA-Asia
Asia-Europe
Europe-Asia
USA-Europe
Europe-USA
The Physical Hinterland
■ Physical port regionalization in North America• Capacity demands from long distance trade.• Port ranges; lateral corridors of port competition / cooperation.• Gateways; logistical platforms.• Inland freight corridors.
Traffic at the 50 Largest Container Ports, 2003
DubaiJeddah
Tacoma
Colombo
Salalah
Oakland
San Juan
Melbourne
Long Beach Charleston
Nhava Sheva
Los Angeles Hampton RoadsNew York/New Jersey
Kobe
Osaka
Tokyo
BusanNagoya
Dalian
Ningbo
Manila
Xiamen
Tianjin
Keelung
Quingdao
ShanghaiShenzhen
Kaohsiung
Hong Kong
Guangzhou
Singapore
Port Kalang
Laem Chabang
Tanjung Perak
Tanjung Priok
Tanjung Pelepas
Less than 2 million TEU
2 to 4 million TEU
4 to 7 million TEU
7 to 10 million TEU
More than 10 million TEU
Genoa
Piraeus
LeHavreAntwerp
Hamburg
Valencia
Barcelona
Algeciras
Rotterdam
Felixstowe
Gioia Tauro
Pacific Asia Europe
Traffic at Major North American Container Ports, 2003
El Paso
Chicago
Kansas CIty
Minneapolis
Salt Lake City
Tampa
Ponce
Miami
Tacoma
Mobile
Fraser
BostonAlbany
Tampico
Toronto
Seattle
Oakland
Manatee
Hueneme
Houston
HalifaxEverett
Mazatlan
Ensenada
Veracruz
ProgresoAltamira
Savannah
San Juan
Portland
Montreal
Gulfport
Freeport
Vancouver
San Diego
Canaveral
Baltimore
Manzanillo
Wilmington
St. John's
Saint John
Palm Beach
Long Beach
Fernandina
Charleston
Salina Cruz
New Orleans
Los Angeles
Richmond(VA)
Portland(ME)
Philadelphia
Lake Charles
Jacksonville
San Francisco
Hampton Roads
Puerto Morelos
Wilmington(NC)
Lazaro Cardenas
Port Everglades
New York/New Jersey
TEU (2003)
Less than 100,000
100,000 to 300,000
300,000 to 1 million
1 million to 2 million
More than 2 million
Cargo Handled by the Top 5 US Container Ports, 1984-2004 (in TEUs)
0
5
10
15
20
25
30
35
40
Mill
ions
42%
44%
46%
48%
50%
52%
54%
56%
58%
New York/New Jersey
Charleston
Oakland
Los Angeles
Long Beach
Total
Top 5 share
DeconcentrationRegionalization
Major Modal US Gateways, 2003
Newark
Chicago
Atlanta
Cleveland
New Orleans
Dallas-Fort Worth
Boston Logan AirportJFK International Airport
Seattle-Tacoma International
Miami International Airport,
Los Angeles International Airport
Philadelphia International AirportSan Francisco International Airpor
Port of Miami
Port of Tacoma
Port of Seattle
Port of Houston
Port of Oakland
Port of Beaumont
Port of Portland
Port of New York
Port of Savannah
Port of Baltimore
Port of CharlestonPort of Long Beach
Port of New Orleans
Port of Morgan City
Port of Los Angeles
Port of Philadelphia
Port of Jacksonville
Port of Norfolk Harbor
Port of Corpus ChristiPort of Port Everglades
Port of Huron
Port of Blaine
Port of Laredo
Port of Hidalgo
Port of El Paso
Port of Pembina
Port of Detroit
Port of Nogales
Port of Sweetgrass
Port of Calexico-East
Port of Alexandria Bay
Port of Otay Mesa Station
Port of Brownsville-Cameron
Port of Champlain-Rouses Pt.
Port of Buffalo-Niagara Falls
Land Gateways
$54 billion
Exports
Imports
Port Gateways
$69 billion
Exports
Imports
Air Gateways
$51 billion
Exports
Imports
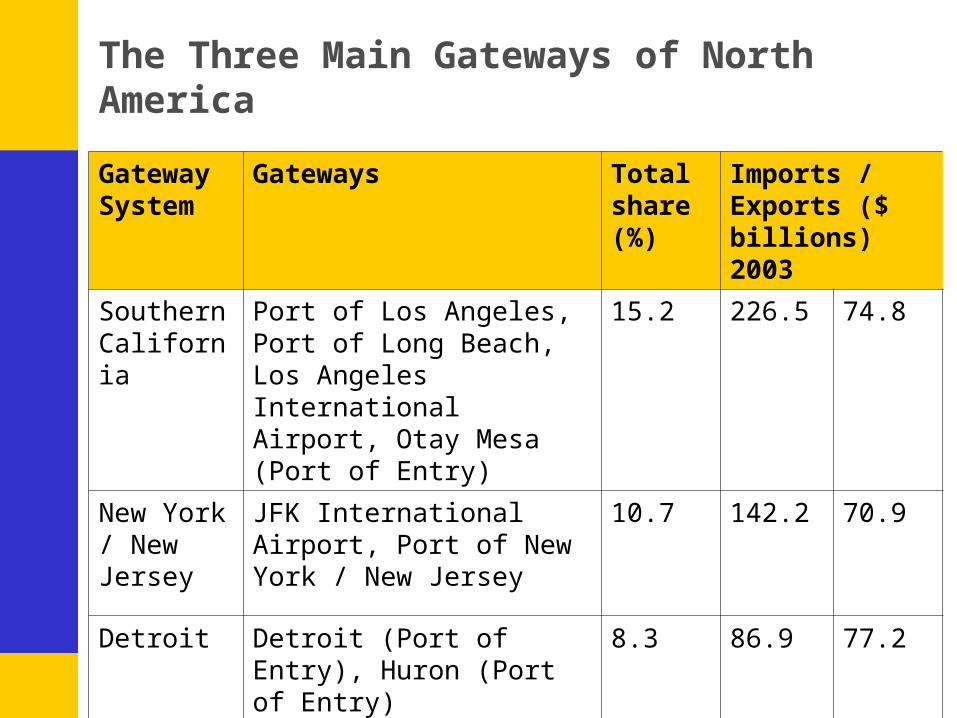
The Three Main Gateways of North America
Gateway System
Gateways Total share (%)
Imports / Exports ($ billions) 2003
Southern California
Port of Los Angeles, Port of Long Beach, Los Angeles International Airport, Otay Mesa (Port of Entry)
15.2 226.5 74.8
New York / New Jersey
JFK International Airport, Port of New York / New Jersey
10.7 142.2 70.9
Detroit Detroit (Port of Entry), Huron (Port of Entry)
8.3 86.9 77.2
Trucking Corridors and Major Metropolitan Freight Centers (more than 3,000 trucks per day)
Miami
Tampa
Boston
Dallas
Denver
Halifax
Atlanta
Detroit
Toronto
Chicago
Houston
Phoenix
Seattle
Calgary
Montreal
New York
Portland
Baltimore
Charlotte
Cleveland
St. Louis
San Diego
Vancouver
Pittsburgh
Cincinnati
New Orleans
Kansas City
Minneapolis
Los Angeles
Philadelphia
San Francisco
Major Road Traffic Bottlenecks
Number of North American Ports by Channel Depth (feet)
0 10 20 30 40 50 60
Above 76
71 - 75
66 - 75
61 - 65
56 - 60
51 - 55
46 - 50
41 - 45
36 - 40
31 - 35
26 - 30
LargeMediumSmall
The Logistical Hinterland
■ Logistical port regionalization in North America• Empty containers repositioning; coping with imbalances.• Modal shift; coping with congestion and costs.• Corridor flows; coping with the existing spatial structure along the
Boston – Washington corridor.
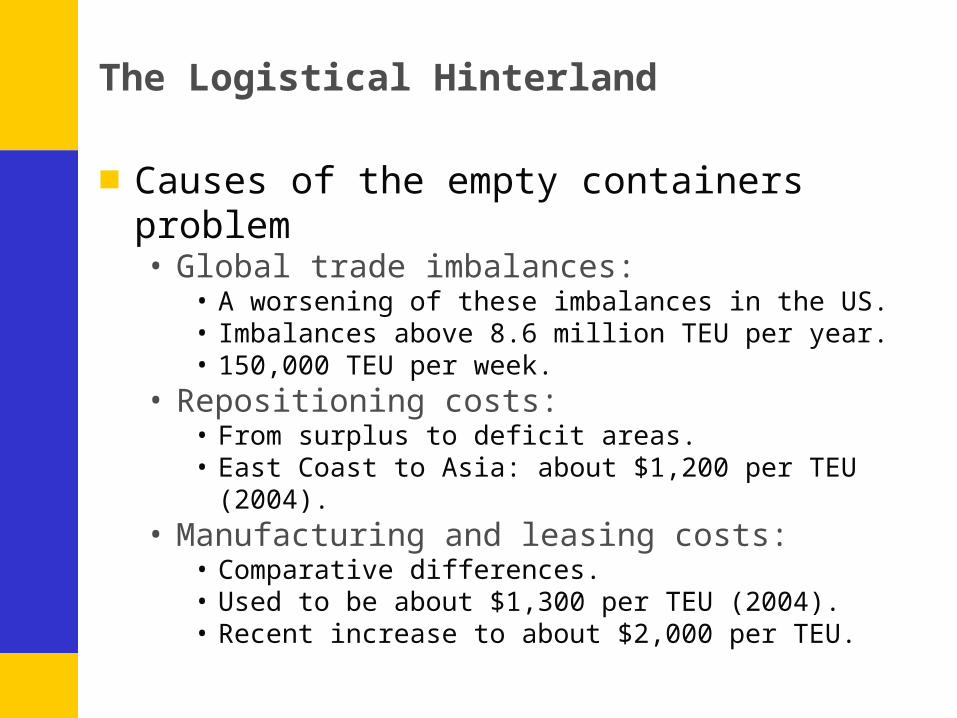
The Logistical Hinterland
■ Causes of the empty containers problem• Global trade imbalances:
• A worsening of these imbalances in the US.• Imbalances above 8.6 million TEU per year.• 150,000 TEU per week.
• Repositioning costs:• From surplus to deficit areas.• East Coast to Asia: about $1,200 per TEU (2004).
• Manufacturing and leasing costs:• Comparative differences.• Used to be about $1,300 per TEU (2004).• Recent increase to about $2,000 per TEU.
Container Repositioning Scales
Repositioning Distance (TEU – KM)
Repositioning Costs
LocalRegional
Internatio
nal
Container manufacturing cost
Reshuffling Storage depots
High imbalance
Low imbalance
Gateways as reverse logistics centers
Containers Handled by the Port of New York, 2001-2004
0
500,000
1,000,000
1,500,000
2,000,000
2,500,000
3,000,000
3,500,000
4,000,000
4,500,000
5,000,000
2001 2002 2003 2004
Empty TEUs
Loaded TEUs
The Logistical Hinterland
■ Inertia in modal shift• Does not occur as fast as expected.• Transport economics hint at a gradual process.• Reasons for inertia:
• Accumulated investments / stakes in modes and terminals.• Management preferences.• Proven reliability.
■ North American hinterlands and modal shift• Particularly takes place at the fringe.• A port competition through regional modal cooperation.
MaturityShiftInertia
Principles of Modal Shift
Modal Share (A
/B)
Time
Comparative AdvantagesReal Modal Share
Expected Modal Share
Underperformance
Over performance
Costs of Shipping a 40 foot Container to New York: Towards a $100 per Barrel Logistics?
$0
$1,000
$2,000
$3,000
$4,000
$5,000
$6,000
$7,000
$8,000
Barrel at $30 Barrel at $60 Barrel at $100
From Hong Kong
From Mexico
Some Short Sea Shipping Systems in North America
East Coast Port Inland Distribution Network (New York, Boston, Albany).
Columbia Coastal; Several East Coast ports linked, new Philadelphia – Baltimore container barge service.
Great Lakes Detroit-Windsor Truck Ferry. Rochester-Toronto Fast Ferry.
Gulf Coast Teco Ocean Shipping; bulk commodities.
Osprey Lines; container-on-barge services in Texas, Mississippi River service (Baton Rouge to New Orleans).
West Coast Totem Ocean Trailer Express (Ro/Ro), Horizon Lines and Lynden Transport (Alaska and Washington).
The Boston / Washington Port Hinterland
Virginia Inland Port
Camden
Albany
ReadingHanover
WorcesterFramingham
Springfield
East Hartford
Boston
Albany
Camden
Davisville
Wilmington BridgeportNew York / New Jersey
§
PIDN Barge Ports
Active
Study
PIDN Rail Hub
Active
Study
Rail Service Status
Active
Study
Barge Service Status
Active
Study
Rail / Road Terminal
Interstate0 60 120 180 24030
Kilometers
Conclusion
■ What’s next for North American hinterlands?• Anticipated growth of freight flows:
• Both in tons and tons-km.• Additional demands on the capacity of modes and terminals to handle
them.• Unlikely to take place.
• Imbalanced freight flows:• Disequilibrium in the division of labor, trade, production and consumption.• Short/medium term: additional pressures to manage the disequilibrium
(e.g. empties).• Long term: rebalancing the flows and the hinterlands.
• Regionalization of hinterlands:• Ports adapting to the freight flows reality.• Attempt at re-balancing by offering a wider hinterland range.