Interpretation of Transmissivity Estimates from Single-Well, Pumping Aquifer Tests 1 2 3 4 5 6 7 8 9 10 11 12 13 14 15 16 17 By Keith J. Halford 1 , Willis D. Weight 2 , and Robert P. Schreiber 3 Abstract Interpretation of single-well tests with the Cooper-Jacob method remains more reasonable than most alternatives. Drawdowns from 628 simulated single-well tests were interpreted with the Cooper-Jacob straight-line method. Error and bias as a function of vertical anisotropy, partial penetration, specific yield, and interpretive technique were investigated for transmissivities that ranged from 10 to 10,000 m²/d. Cooper-Jacob transmissivity estimates in confined aquifers were affected minimally by partial penetration, vertical anisotropy, or analyst. Cooper-Jacob transmissivity estimates of simulated unconfined aquifers averaged twice known values. One percent of these estimates were more than 10 times known values. Transmissivity estimates were not improved by interpreting results with an unconfined solution. An empirical corrector reduced the bias and magnitude of error in Cooper-Jacob transmissivity estimates for unconfined aquifers. The empirical corrector is available as a Visual Basic for Applications function in a single-well analysis spreadsheet. 1 USGS, 333 W Nye Ln, Room 203, Carson City, NV 89706; e-mail:[email protected]; Tel:775-887-7613 2 Montana Tech of The University of Montana, 1300 West Park St., Butte, MT 59701; e-mail:[email protected]; Tel:406-496-4329 3 CDM, One Cambridge Place, 50 Hampshire Street, Cambridge, MA 02139; e-mail:[email protected]; Tel:617-452-6251 1
Transcript
Interpretation of Transmissivity Estimates from Single-Well, Pumping Aquifer Tests
1
2
3
4
5
6
7
8
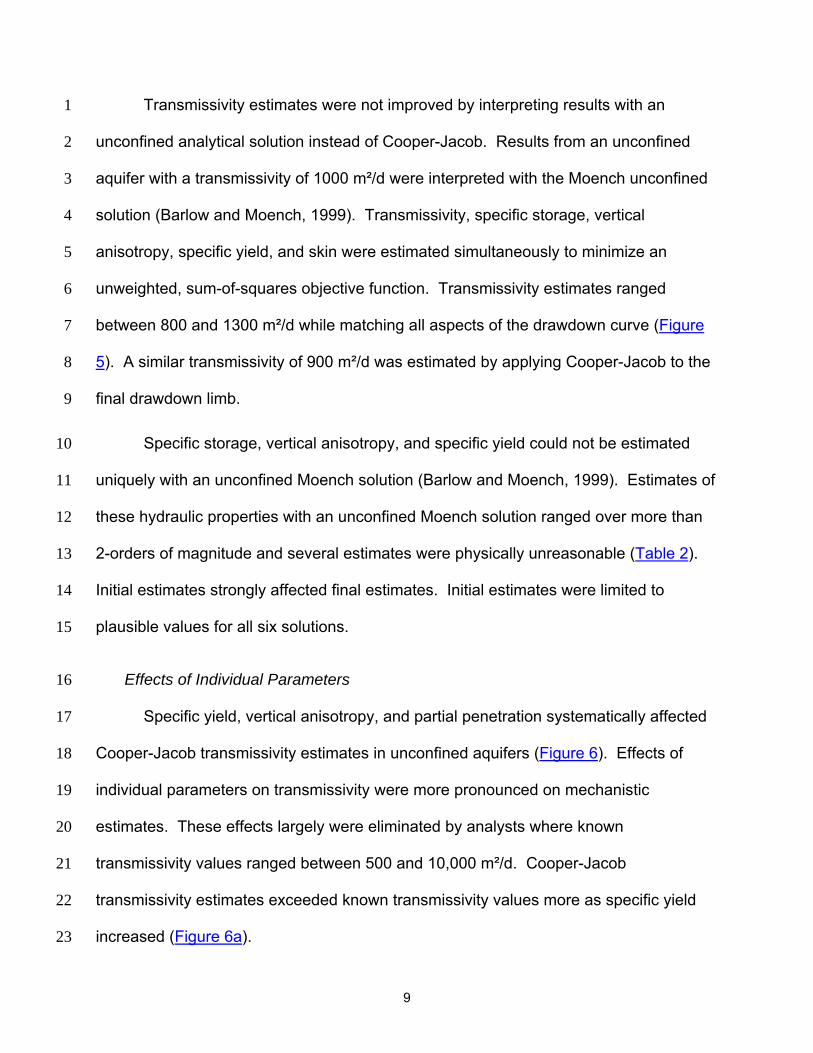
9
10
11
12
13
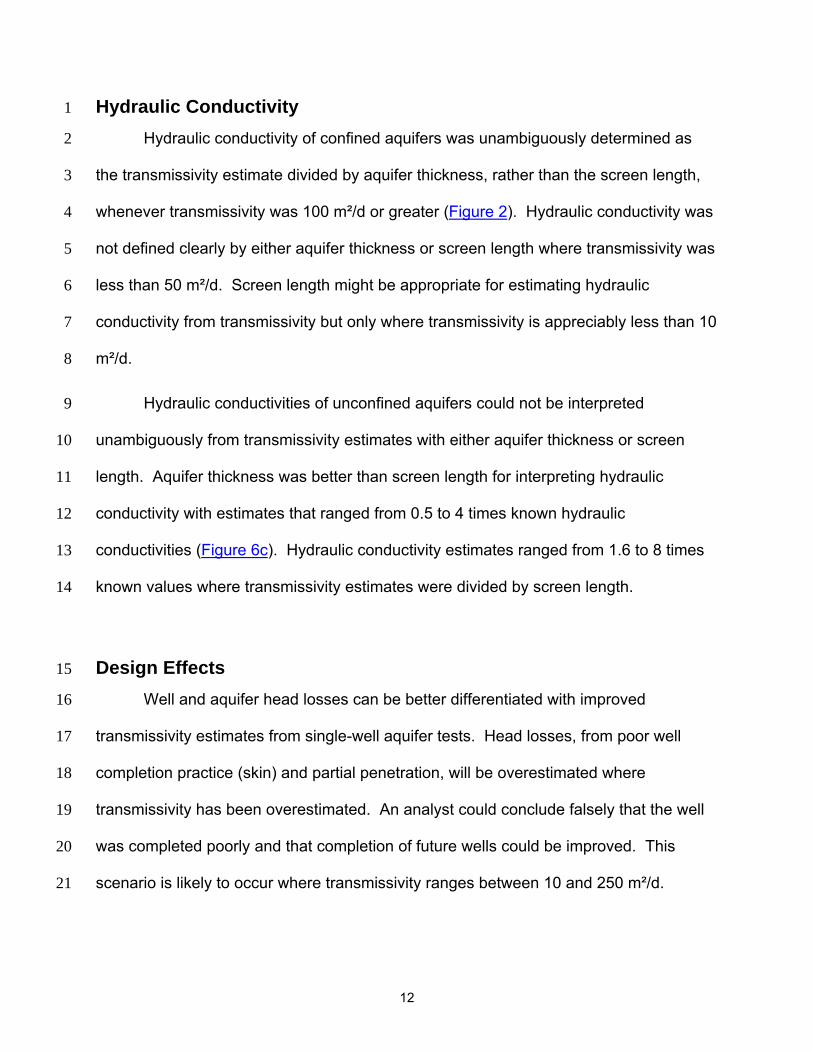
14
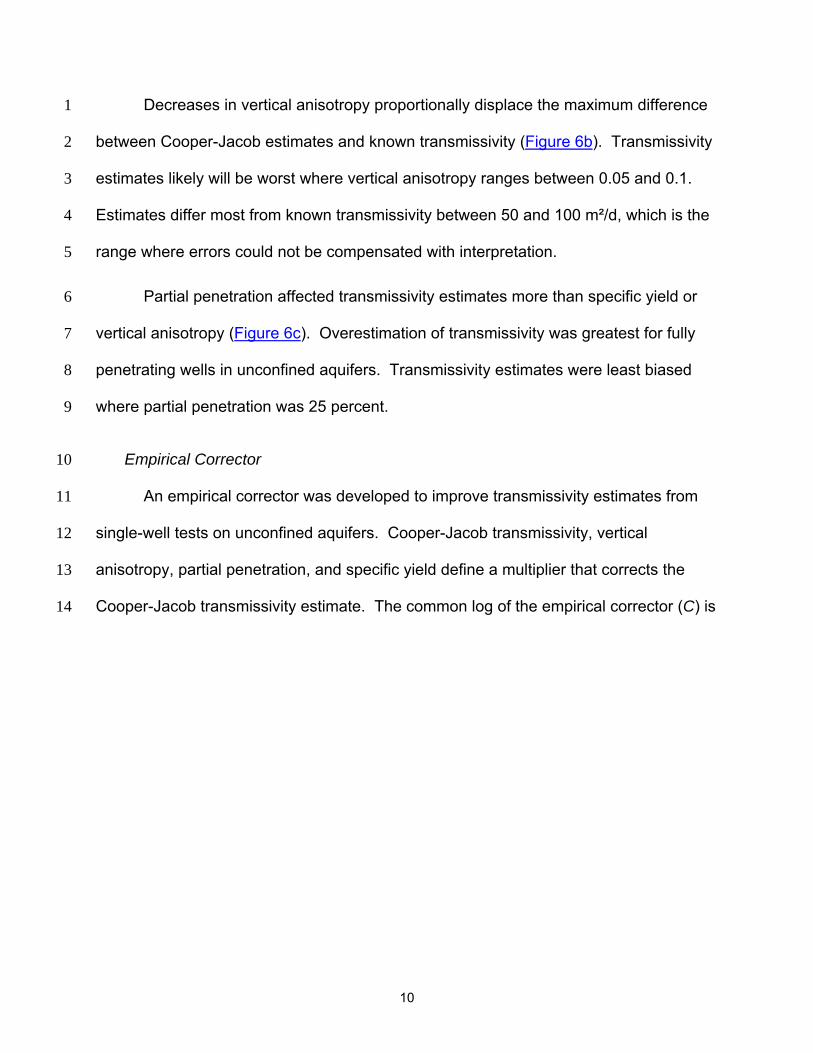
15
16
17
By Keith J. Halford1, Willis D. Weight2, and Robert P. Schreiber3
Abstract Interpretation of single-well tests with the Cooper-Jacob method remains more
reasonable than most alternatives. Drawdowns from 628 simulated single-well tests
were interpreted with the Cooper-Jacob straight-line method. Error and bias as a
function of vertical anisotropy, partial penetration, specific yield, and interpretive
technique were investigated for transmissivities that ranged from 10 to 10,000 m²/d.
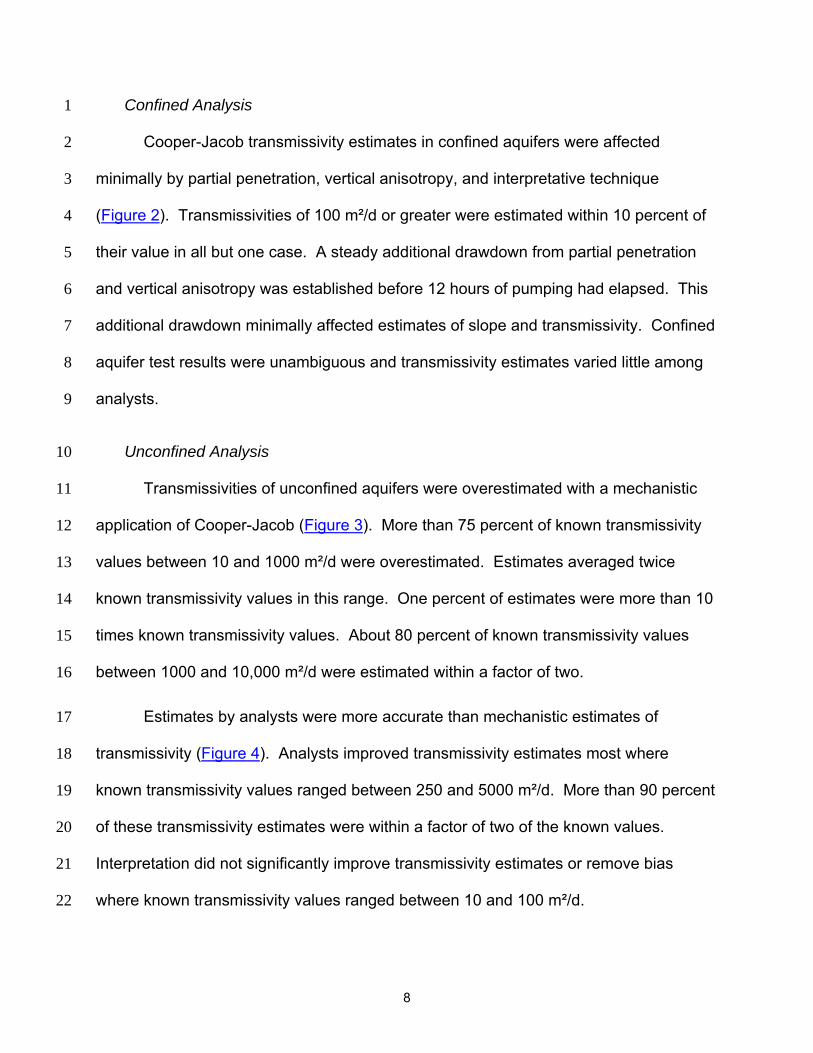
Cooper-Jacob transmissivity estimates in confined aquifers were affected minimally by
partial penetration, vertical anisotropy, or analyst. Cooper-Jacob transmissivity
estimates of simulated unconfined aquifers averaged twice known values. One percent
of these estimates were more than 10 times known values. Transmissivity estimates
were not improved by interpreting results with an unconfined solution. An empirical
corrector reduced the bias and magnitude of error in Cooper-Jacob transmissivity
estimates for unconfined aquifers. The empirical corrector is available as a Visual Basic
for Applications function in a single-well analysis spreadsheet.
1 USGS, 333 W Nye Ln, Room 203, Carson City, NV 89706; e-mail:[email protected]; Tel:775-887-7613 2 Montana Tech of The University of Montana, 1300 West Park St., Butte, MT 59701; e-mail:[email protected]; Tel:406-496-4329 3 CDM, One Cambridge Place, 50 Hampshire Street, Cambridge, MA 02139; e-mail:[email protected]; Tel:617-452-6251
1
Introduction 1
2
3
4
5
6
7
8
9
10
11
12
13
14
15
16
17
18
19
20
Single-well aquifer tests provide data in many situations in which aquifer
pumping-test data from multiple wells would be a luxury for the ground-water analyst.
The primary factor limiting the performance of multi-well aquifer tests is cost, particularly
in areas with large depth to water (Belcher et al, 2001). Limiting analysis to existing
wells predominately occurs in the arid West, but can occur in many areas. For
example, irrigation wells are installed far apart to minimize interference. This separation
causes adjacent wells to be poor observation wells.
The ground-water analyst faces many problems and challenges where hydraulic
testing is limited to an isolated well. These problems include well-known and
quantifiable effects such as borehole head loss during pumping, as well as much more
difficult-to-quantify factors such as lateral and vertical anisotropy. Many effects could
only be quantified with reasonable accuracy using multiple observation wells or flow
logs (Hanson and Nishikawa, 1996). An analyst can still derive significant useful
information from single-well tests.
Single-well aquifer tests frequently are analyzed with the Cooper-Jacob (1946)
method because of its simplicity. Transmissivity is estimated by fitting a straight line to
drawdowns on an arithmetic axis versus time on a logarithmic axis in a semilog plot.
Drawdowns in confined and unconfined aquifers have been analyzed with the Cooper-
Jacob method regardless of differences between field conditions and theory.
2
1
2
3
4
5
6
7
8
9
10
11
12
13
14
15
Single-well tests from partially penetrating wells in unconfined aquifers depart
greatly from the Theis (1935) model. The Cooper-Jacob method is a simplification of
the Theis solution so the production well should fully penetrate a confined,
homogeneous, and isotropic aquifer. Unconfined aquifer tests are affected by vertical
anisotropy and specific yield in addition to transmissivity and storage coefficient. These
additional parameters control vertical gradients that are created by partial penetration
and drainage from the water table. Likewise, leakage from adjacent confining beds also
could affect the Cooper-Jacob method. Transmissivity likely will be overestimated
where leakage occurs.
Transmissivity estimates from single-well tests in unconfined aquifers also are
affected by discharge rate, test duration, and interpretive technique. The transition from
the release of water from storage owing to the compressibility of the medium and fluid to
drainage of pores is less likely to be observed during a test of relatively small discharge
or short duration. Interpretation is hampered because a final drawdown limb, which has
a slope predicted by the Cooper-Jacob method, is absent.
3
Purpose and Scope 1
2
3
4
5
6
7
8
9
10
11
12
13
14
15
16
17
18
19
20
21
22
This article documents how interpreting single-well, pumping aquifer tests with
the Cooper-Jacob method affects transmissivity estimates. Drawdowns in 800 single-
well tests were simulated with radial, MODFLOW models that were defined with
transmissivities between 10 and 10,000 m²/d. Drawdowns from 628 of these simulated
tests would maintain water levels above pump intakes and were interpreted with the
Cooper-Jacob, straight-line method. Transmissivity error and bias as a function of
vertical anisotropy, partial penetration, specific yield, and interpretive technique were
investigated. Transmissivity estimates were improved with informed interpretation or
with an empirical, corrector algorithm.
Approach Effects of unmet assumptions on the reliability of Cooper-Jacob transmissivity
estimates were investigated by interpreting 628 simulated drawdowns. The
transmissivity of each aquifer was estimated with a Cooper-Jacob analysis of simulated
drawdowns. Effects of unmet assumptions were quantified by comparing Cooper-Jacob
transmissivity estimates to specified values, herein referred to as known transmissivity.
Hydraulic properties were limited to plausible ranges. Transmissivities ranged
from 10 to 10,000 m²/d. Transmissivities of less than 10 m²/d were excluded because
slug tests are more practical than pumping tests. A single specific storage of 5 x 10⁻⁶ m-
1 was assigned to all aquifers because transmissivity estimates were insensitive to
specific storage. Specific yields ranged from 0.05 to 0.3. Vertical anisotropies ranged
between 0.02 and 0.2 and were assumed to represent a sedimentary system.
4
Pumping wells that penetrated between 10 and 100 percent of aquifers were
analyzed. All partially penetrating wells were open at the top of the aquifer or water
table (
1
2
Figure 1). Wellbore storage and skin effects of the pumping wells were simulated
which decreased maximum potential pumping rates. Simulation results were
considered physically impossible and rejected where simulated water levels in the
pumping well were less than 3 m above the bottom of the well. Wells in unconfined
aquifers were simulated to penetrate 25 or more percent of the saturated thickness so
water levels would remain above the pump intakes.
3
4
5
6
7
8
9
10
11
12
13
All single-well tests were simulated over 2-day periods to balance testing
effectiveness and operational constraints. Transmissivity estimates from tests of longer
duration are less ambiguous because drainage from the water table will be observed
and drawdowns will follow a late-time response. Actual single-well tests typically range
between 1 and 3 days in duration because of operational constraints.
5
Simulated Aquifer Tests 1
2
3
4
5
6
All single-well aquifer tests were simulated with two-dimensional MODFLOW
models (McDonald and Harbaugh, 1988; Harbaugh and McDonald, 1996). The
production well in each model was simulated as a high conductivity zone where water
was removed from the uppermost cell and flow was apportioned within MODFLOW. All
models extended 100,000 m from the production well along a row that was discretized
into 99 columns (Figure 1). Pumping wells were simulated in column 1 and aquifer
material was simulated with columns 2 through 99. Column 2 was 0.02 m wide and the
remaining columns were 1.15 times the width of the previous column. The 100-m thick
aquifers were uniformly subdivided into 100 rows. All models had no flow lateral
boundaries, initial heads of 0 m, and a single stress period of 50 time steps. The first
time step was 0.1 second in duration. Each successive time step was 1.3 times greater
than the previous one.
7
8
9
10
11
12
13
14
15
16
17
18
19
20
21
22
Hydraulic properties were modified consistently to simulate axisymmetric, radial
flow. Simulated pumpage was withdrawn from column 1 so that distance from the left
edge of column 1 to a column node would be equivalent to the radial distance from the
pumping well. Hydraulic conductivity and storage of the ith column were multiplied by
2πri to simulate radial flow where ri is the distance from the outer edge of the first
column to the center of the ith column. Axisymmetric, radial flow has been solved with
MODFLOW by using many layers and a single row (Reilly and Harbaugh, 1993; Clemo,
2002). A single MODFLOW layer is more convenient because input is defined easily,
all conductances are computed within the BCF package, and output is checked quickly.
6
Pumping rates were simulated near the maximum rate that could be pumped
practically from an aquifer of a given transmissivity. Pumping rates were greater in
more transmissive aquifers (
1
2
Table 1). Realistic wellbore-storage effects were simulated
by increasing well diameters as pumping rates increased. A storage coefficient of 1
was assigned in row 1 of column 1 to simulate wellbore storage. Conductances
between columns 1 and 2 were reduced tenfold to simulate skin where a well was
present.
3
4
5
6
7
8
9
10
11
12
13
14
15
16
Interpretation Cooper-Jacob transmissivity was estimated for each single-well test by a
mechanistic approach and separately by six analysts, including the three authors and
three volunteers. Transmissivity was estimated automatically with the mechanistic
approach. A semilog slope was defined by the drawdowns at 0.5 and 2 d after pumping
started. A minimum time of 0.5 d was selected as a compromise between avoiding the
early-time complications due to wellbore storage, partial penetration, and water-table
effects and assumed measurement sensitivity for actual aquifer tests. Experience
guided analysts’ best fit of semilog slopes. All simulated drawdowns and analyses can
be retrieved from http://nevada.usgs.gov/tech/groundwater_05.htm. 17
Clemo, T., 2002. MODFLOW-2000 for cylindrical geometry with internal flow observations and improved
water table simulation. Technical Report BSU CGISS 02-01, Boise State University, Boise, Idaho.
Cooper, H.H., and C.E. Jacob. 1946. A generalized graphical method for evaluating formation constants
and summarizing well field history. American Geophysical Union Transactions 27: 526–534.
Halford, K.J., and E.L. Kuniansky. 2002. Documentation of spreadsheets for the analysis of aquifer
pumping and slug test data. USGS Open-File Report 02-197.
Hanson, R. T., and Tracy Nishikawa. 1996. Combined use of flowmeter and time-drawdown data to
estimate hydraulic conductivities in layered aquifer systems. Ground Water 34, no. 1: 84-94.
Harbaugh, A.W., and M.G. McDonald. 1996. Programmer's documentation for MODFLOW-96, an update
to the U.S. Geological Survey modular finite-difference ground-water flow model: USGS Open-File
Report 96-486.
McDonald, M.G., and A.W. Harbaugh. 1988. A modular three-dimensional finite-difference ground-water
flow model. USGS Techniques of Water-Resources Investigations, book 6, A1.
Reilly, T.E., and A. W. Harbaugh. 1993. Computer Note: Simulation of cylindrical flow to a well using the
U.S. Geological Survey modular finite-difference ground-water flow model. Ground Water 31, no. 3:
489-494.
15
1
2
3
4
Theis, C.V. 1935. The relation between the lowering of the piezometric surface and the rate and duration
of discharge of a well using ground water storage. Transaction of American Geophysical Union 16:
519–524.
16
Tables 1
2 3 4 5
6
Table 1.—Well diameters and discharges assigned to simulated aquifers. .................................. 18 Table 2.—Six unconfined Moench solutions for a simulated single-well test in an aquifer with a
transmissivity of 1000 m²/d, specific yield of 0.1, vertical anisotropy of 0.2, and a partial penetration of 50 percent. ..................................................................................................... 18
17
1 2
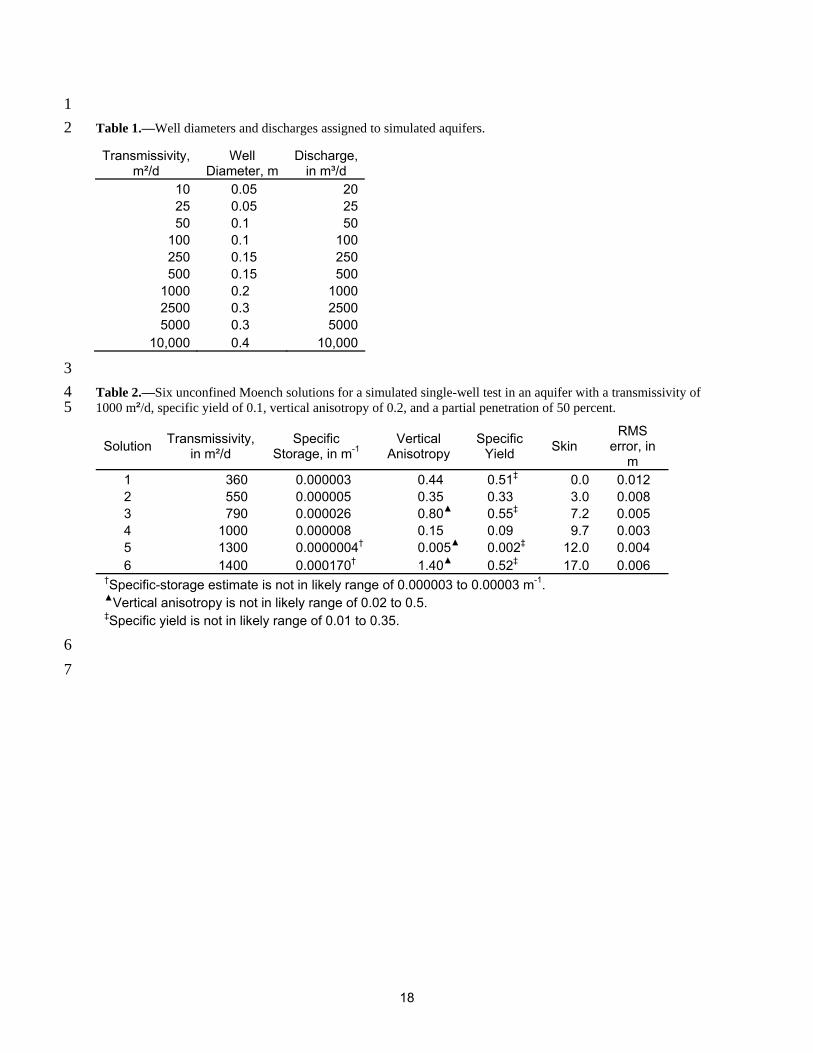
Table 1.—Well diameters and discharges assigned to simulated aquifers.
Transmissivity, m²/d
Well Diameter, m
Discharge, in m³/d
10 0.05 2025 0.05 2550 0.1 50
100 0.1 100250 0.15 250500 0.15 500
1000 0.2 10002500 0.3 25005000 0.3 5000
10,000 0.4 10,000
3 4 5
Table 2.—Six unconfined Moench solutions for a simulated single-well test in an aquifer with a transmissivity of 1000 m²/d, specific yield of 0.1, vertical anisotropy of 0.2, and a partial penetration of 50 percent.
†Specific-storage estimate is not in likely range of 0.000003 to 0.00003 m-1. ▲Vertical anisotropy is not in likely range of 0.02 to 0.5. ‡Specific yield is not in likely range of 0.01 to 0.35.
6 7
18
FIGURES 1
2 3 4 5 6 7 8 9
10 11 12 13 14 15 16 17 18 19 20
Figure 1.—Definition sketch of hypothetical well and aquifer system with grid for numerical solution.................................................................................................................................. 20
Figure 2.—Cooper-Jacob estimates of transmissivity in confined aquifers for all combinations of partial penetration and vertical anisotropy with slope defined by drawdowns at 12 and 48 hours...................................................................................................................................... 20
Figure 3. —Cooper-Jacob estimates of transmissivity for all combinations of storage coefficient, partial penetration, and vertical anisotropy with slope defined by drawdowns at 12 and 48 hours...................................................................................................................................... 21
Figure 4. —Cooper-Jacob estimates of transmissivity for all combinations of storage coefficient, partial penetration, and vertical anisotropy with slope defined by analyst........................... 22
Figure 5.—Example fits of unconfined Moench and Cooper-Jacob solutions to MODFLOW solution for an aquifer with a transmissivity of 1000 m²/d, specific yield of 0.1, vertical anisotropy of 0.2, and a partial penetration of 50 percent. ................................................... 23
Figure 6. —Selected Cooper-Jacob estimates of transmissivity with specific yields between 0.05 and 0.3, partial penetrations of 25 to 100 percent, and vertical anisotropies of 0.02 to 0.2 with slope defined by drawdowns at 12 and 48 hours. ......................................................... 23
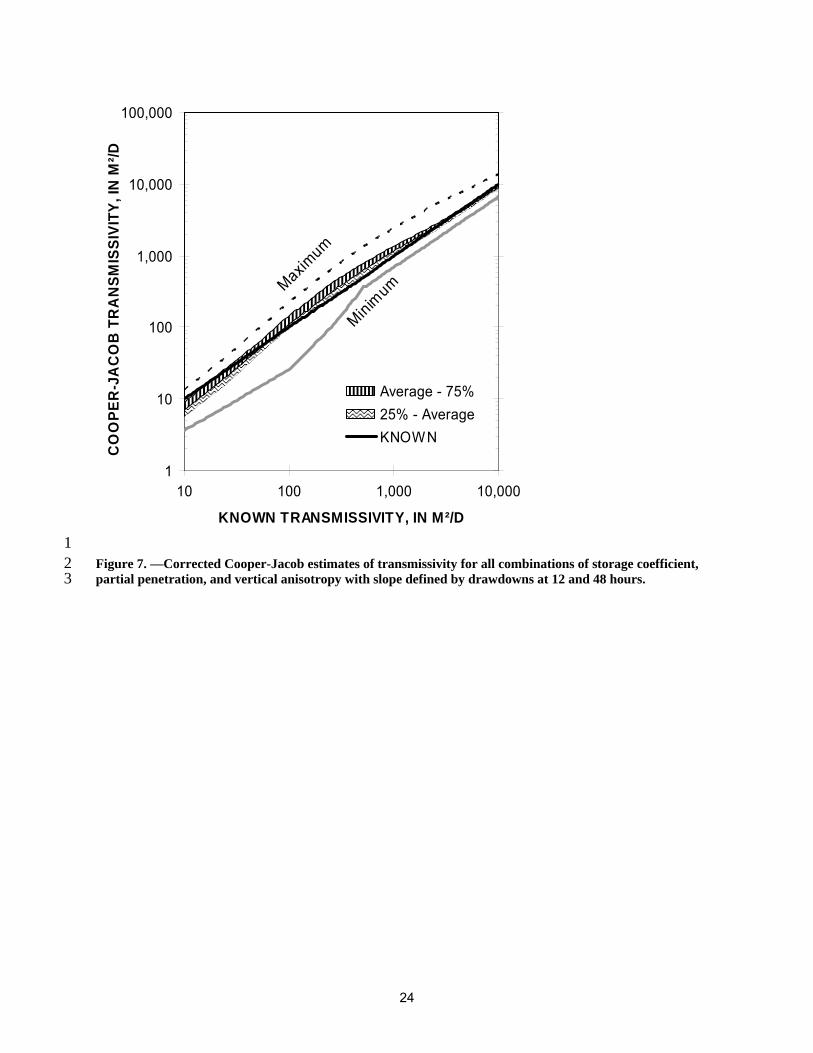
Figure 7. —Corrected Cooper-Jacob estimates of transmissivity for all combinations of storage coefficient, partial penetration, and vertical anisotropy with slope defined by drawdowns at 12 and 48 hours..................................................................................................................... 24
19
1
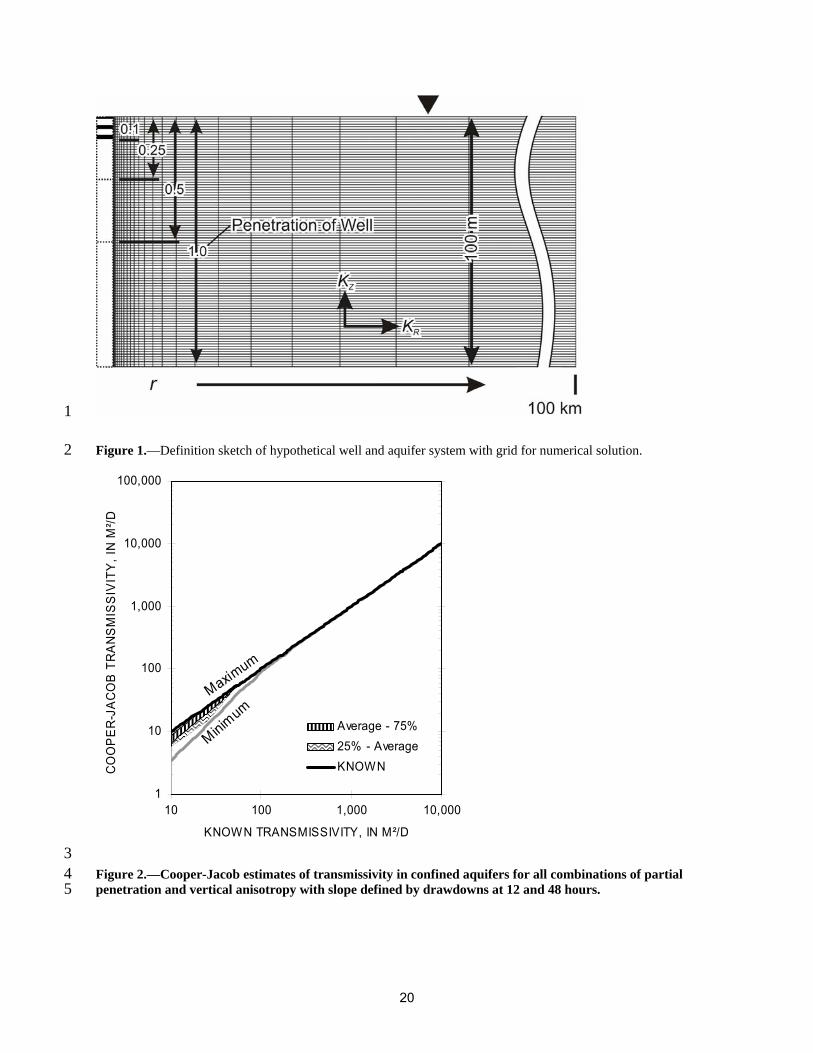
2 Figure 1.—Definition sketch of hypothetical well and aquifer system with grid for numerical solution.
Maximum
Minimum
1
10
100
1,000
10,000
100,000
10 100 1,000 10,000
KNOWN TRANSMISSIVITY, IN M²/D
CO
OP
ER
-JA
CO
B T
RA
NS
MIS
SIV
ITY
, IN
M²/D
Average - 75%25% - AverageKNOWN
3 4 5
Figure 2.—Cooper-Jacob estimates of transmissivity in confined aquifers for all combinations of partial penetration and vertical anisotropy with slope defined by drawdowns at 12 and 48 hours.
20
Maximum
Minimum
1
10
100
1,000
10,000
100,000
10 100 1,000 10,000
KNOWN TRANSMISSIVITY, IN M²/D
CO
OP
ER-J
ACO
B T
RAN
SMIS
SIVI
TY, I
N M
²/D
Average - 75%25% - AverageKNOWN
1 2 3
Figure 3. —Cooper-Jacob estimates of transmissivity for all combinations of storage coefficient, partial penetration, and vertical anisotropy with slope defined by drawdowns at 12 and 48 hours.
21
Maximum
Minimum
1
10
100
1,000
10,000
100,000
10 100 1,000 10,000
KNOWN TRANSMISSIVITY, IN M²/D
CO
OP
ER-J
ACO
B T
RAN
SMIS
SIVI
TY, I
N M
²/D
Average - 75%25% - AverageKNOWN
1 2 3
Figure 4. —Cooper-Jacob estimates of transmissivity for all combinations of storage coefficient, partial penetration, and vertical anisotropy with slope defined by analyst.
22
4.8
5.0
5.2
5.4
0.001 0.01 0.1 1 10
TIM E, IN DAYS
DR
AW
DO
WN
, IN
MET
ERS
Numerical, T = 1000 m²/d
Unconfined Moench, T = 1100 m²/d
Cooper-Jacob, T = 900 m²/d
1 2 3 4
Figure 5.—Example fits of unconfined Moench and Cooper-Jacob solutions to MODFLOW solution for an aquifer with a transmissivity of 1000 m²/d, specific yield of 0.1, vertical anisotropy of 0.2, and a partial penetration of 50 percent.
5 6 7 8
Figure 6. —Selected Cooper-Jacob estimates of transmissivity with specific yields between 0.05 and 0.3, partial penetrations of 25 to 100 percent, and vertical anisotropies of 0.02 to 0.2 with slope defined by drawdowns at 12 and 48 hours.
23
Maximum
Minimum
1
10
100
1,000
10,000
100,000
10 100 1,000 10,000
KNOWN TRANSMISSIVITY, IN M²/D
CO
OPE
R-J
AC
OB
TR
AN
SMIS
SIVI
TY, I
N M
²/D
Average - 75%25% - AverageKNOWN
1 2 3
Figure 7. —Corrected Cooper-Jacob estimates of transmissivity for all combinations of storage coefficient, partial penetration, and vertical anisotropy with slope defined by drawdowns at 12 and 48 hours.