Copyright 2012 by Pepin Associates, Inc. Published by the Society for the Advancement of Material and Process Engineering with permission. MANUFACTURABILITY and TRANSMISSIVITY of RADOMES FORMED with ALIGNED DISCONTINUOUS COMPOSITE REINFORCEMENT TAPE Elizabeth Thompson Pepin Associates, Inc. P.O. Box 397 Greenville, ME 04441 ABSTRACT Radomes come in a range of complex curved shapes and sizes, which may be difficult to form with standard continuous materials. Pepin Associates, Inc. has developed an aligned, discontinuous composite reinforcement material that stretches to form complex shapes without wrinkles or crimping. This material reduces time and labor costs associated with standard forming methods by eliminating the need to cut, dart, or otherwise manipulate the lay-up. The Pepin material can be manufactured with a wide range of fibers, including glass and quartz, which are the fibers of choice for radome applications. The work described in this paper examined the effects of fiber discontinuity in the Pepin material on the electrical properties of composites used to manufacture radomes. Comparative electrical testing was performed on both continuous and aligned discontinuous quartz/epoxy composite flat plates. Based on this testing, a demonstration radome was designed and fabricated. 1. INTRODUCTION The most important design components of radomes are signal transmissivity and the ability to endure aerodynamically imposed stress and, in some cases, high aerokinetic heating loads during flight. To withstand these loads, complex conical shapes are employed to minimize the stresses of aerodynamic flow and environmental strike factors. As signal seeking air vehicles are advanced, radomes are exposed to more extreme load stresses and degradation of RF transmission signals. In order to accommodate such changes, materials that efficiently form a hemispherical shape are desirable. Pepin Associates, Inc. has developed an aligned, discontinuous composite reinforcement fabric that stretches to form complex shapes without wrinkles or crimping. The Pepin material can be manufactured with a wide range of fibers, including glass and quartz, which are the fibers of choice for radome applications. Due to the architecture of the Pepin material, it is not known what effect the discontinuity will have on RF signal transmission. Flat laminates were created and tested for electrical property performance. The work described in this paper examines the effects of fiber discontinuity in the Pepin material on the electrical properties of composites used to manufacture radomes and is intended to reach radome designers and fabricators.
Transcript
Copyright 2012 by Pepin Associates, Inc. Published by the Society for the
Advancement of Material and Process Engineering with permission.
MANUFACTURABILITY and TRANSMISSIVITY of RADOMES
FORMED with ALIGNED DISCONTINUOUS COMPOSITE
REINFORCEMENT TAPE
Elizabeth Thompson
Pepin Associates, Inc.
P.O. Box 397
Greenville, ME 04441
ABSTRACT
Radomes come in a range of complex curved shapes and sizes, which may be difficult to form
with standard continuous materials. Pepin Associates, Inc. has developed an aligned,
discontinuous composite reinforcement material that stretches to form complex shapes without
wrinkles or crimping. This material reduces time and labor costs associated with standard
forming methods by eliminating the need to cut, dart, or otherwise manipulate the lay-up. The
Pepin material can be manufactured with a wide range of fibers, including glass and quartz,
which are the fibers of choice for radome applications. The work described in this paper
examined the effects of fiber discontinuity in the Pepin material on the electrical properties of
composites used to manufacture radomes. Comparative electrical testing was performed on
both continuous and aligned discontinuous quartz/epoxy composite flat plates. Based on this
testing, a demonstration radome was designed and fabricated.
1. INTRODUCTION
The most important design components of radomes are signal transmissivity and the ability to
endure aerodynamically imposed stress and, in some cases, high aerokinetic heating loads
during flight. To withstand these loads, complex conical shapes are employed to minimize the
stresses of aerodynamic flow and environmental strike factors. As signal seeking air vehicles
are advanced, radomes are exposed to more extreme load stresses and degradation of RF
transmission signals. In order to accommodate such changes, materials that efficiently form a
hemispherical shape are desirable. Pepin Associates, Inc. has developed an aligned,
discontinuous composite reinforcement fabric that stretches to form complex shapes without
wrinkles or crimping. The Pepin material can be manufactured with a wide range of fibers,
including glass and quartz, which are the fibers of choice for radome applications.
Due to the architecture of the Pepin material, it is not known what effect the discontinuity will
have on RF signal transmission. Flat laminates were created and tested for electrical property
performance. The work described in this paper examines the effects of fiber discontinuity in
the Pepin material on the electrical properties of composites used to manufacture radomes and
is intended to reach radome designers and fabricators.
1.1 Related Work
As mentioned above, Pepin Associates, Inc. has developed a formable textile fabric,
DiscoTex®, to allow fabrication of complex shaped advanced composite structures. The
technology is now diversifying into an aligned, discontinuous, uni-directional tape format.
This material is referred to as DiscoTape™ throughout the paper. PAI discontinuous materials
can be made from various fibers; glass, quartz, carbon, ceramic, etc., making development of
efficient designs more attainable.
1.1.1 DiscoTape™ Development
Pepin Associates, Inc. developed an aligned discontinuous prepreg tape (DiscoTape™) from
continuous prepreg that will stretch easily to form complex shapes. DiscoTape™ is created by
feeding a unidirectional tape through a die press. The continuous tape feeds through the die
and roller and is cut into discrete lengths. Depending on the formability desired, the die can be
quickly and easily changed to accommodate new patterns or cut lengths.
For the purposes of this work, we chose a brick-like pattern with 2.54 mm crosscuts
perpendicular to the fiber direction. The distance between cuts along the fibers is
approximately 5.08 cm. The die and the prepreg process diagram appear in Figure 1. below.
Figure 1. DiscoTape™ Machine and Process Diagram
1.2 Background on the Requirements
Due to their shape, radomes can be fairly difficult to make in production, suggesting that PAI
aligned discontinuous materials may offer a solution. Radomes come in many different shapes
and sizes, many of which are difficult to form with continuous composite reinforcement
materials. It was not known what effect, if any, the discontinuity of the material would have
on the transmissivity of a radar signal. No information could be found on discontinuous
materials being used in the formation of radar and/or sonar protective structures. In order to
learn how the discontinuity would affect the signal, PAI conducted electrical property testing
with Radant Technologies.
Generally, PAI would use a woven fabric for dome shapes, but due to the simple nature of the
transmissivity question, it was decided that testing the newly developed DiscoTape™ would
yield the desired information.
2. EXPERIMENTATION
Based on research into common radome manufacturing materials, glass/epoxy prepreg was
chosen for this work. To understand whether the discontinuous nature of the DiscoTape™ has
an effect on transmissivity, a series of radio frequency tests were designed to compare PAI’s
discontinuous panels to continuous control panels.
As a first step, flat panels were characterized for core properties. From those results one could
predict if the discontinuous material would behave differently from their continuous
counterparts. Panel testing was conducted by Radant Technologies. Radant Technologies
designs, evaluates and tests laminate radomes (electrically and structurally) for X-band to
millimeter wave frequencies, routinely fabricating, testing, and evaluating flat panels as part of
the process. All the laminates it uses are a mixture of a thermo-set resin (epoxy or cyanate
ester) and fabric woven from either E-glass fiber or quartz fiber. The permittivity of these
laminates is modeled by a mixture of resin and fiber that depends on their volume fractions,
component permittivity, and shape.
2.1 Materials
Two types of aligned discontinuous glass/epoxy prepregs were tested against continuous
control panels: S glass (Resin Content 35.5 ± 2.5 % Carbon black) and E glass (Resin Content
36 ± 1 %).
For each material above, 38.1 cm x 38.1 cm laminates were fabricated by PAI to allow testing
at incidence angles up to 60° (which covers most practical microwave band applications).
Panels included two 0.838 cm thick panels for X Band (~10 GHz) and two 0.198 cm thick
panels for Q-Band (~ 45 GHz).
2.2 Measurement Approach
There are several approaches typically employed to measure radome performance. While the
details of the mechanical positioning system can be very different for each approach, a basic
test system includes a control computer, transmit signal source, source positioner, radome
positioner, position control equipment, test antenna, RF signal multiplexer and the receiver.
Described below are typical parameters measured to characterize the performance of a
radome.
2.3 Test Definitions
Brief descriptions of the electrical performance tests are described in the following sections.
2.3.1 Transmission Efficiency (TE)
Transmission Efficiency is the percentage of microwave energy that passes through a radome,
typically measured over various angular regions (which usually represent the area of the
radome actually used by the radar system). It is measured by comparing power levels received
by a test antenna in two different conditions. A reference measurement is made with the
radome off, then again after installation of the radome over the radar antenna. The resulting
data is plotted over the surface of the radome. While ideally transparent, all radomes will have
losses as the RF signal passes through it due to a combination of reflections, diffraction,
absorption, refraction and depolarization. [Darling]
2.3.2 Insertion Phase Delay (IPD)
This is a measure of how much additional phase delay is accumulated by a plane wave passing
through the test panel relative to the same wave traveling in free space. Phase distortion
directly leads to BD/BS and Pattern distortion. IPD is measured simultaneously with TE.
2.3.3 Reflectivity (RF)
Reflectivity is the change in the magnitude of the reflection coefficient at the port of the radar
antenna which is caused by the presence of the radome. This is measured using a reflectometer
with a remote head. The reflection coefficient is measured before and after the radome is
installed with the antenna pointing out into a reflection-less environment (such as an anechoic
chamber or an outdoor range). Ideally, this measurement is independent of pointing direction
of the radar antenna. [Darling]
2.3.4 Depolarization & Scattering of Signal
This employs the same basic setup as TE and IPD but is done independently. For the tests
above, we transmit at one polarization and receive at the same polarization (this is called co-
pol). For depolarization testing, we transmit at one polarization and we receive in the
orthogonal polarization. Ideally, we should receive very little energy in this cross-pol channel.
This test quantifies how much energy is depolarized (scattered into the cross-pol channel) as
the wave passes through the test panel. We want to know if the discontinuity of the fibers is
causing scattering and de-polarization of the signal. This will depend on the frequency of the
signal and the fiber architecture.
2.3.5 Dielectric Constant (DC) and Loss Tangent (LT)
These tests will measure the relative dielectric constant and loss tangent of the panel material.
Data is obtained during TE and IPD testing. Testing the material at microwave frequencies
can be used in comparison with other candidate radome materials.
2.4 Test Panel Fabrication
Eight test panels (38.1 cm x 38.1 cm) were fabricated by PAI to allow testing at incidence
angles up to 60 degrees (which covers most practical microwave band applications). Panels of
different thicknesses that are tuned to different frequency bands were also fabricated. These
included: 4 panels of approximately 0.838 cm thickness for X Band (~10 GHz) and 4 panels of
approximately 0.198 cm thickness for Q Band (~ 45 GHz). Half of the panels were control
(continuous) panels and half were discontinuous.
2.5 Procedure
Radant Technologies conducted the Radio Frequency (RF) testing at their facility in Stow,
Massachusetts. The test matrix is shown below followed by brief test details.
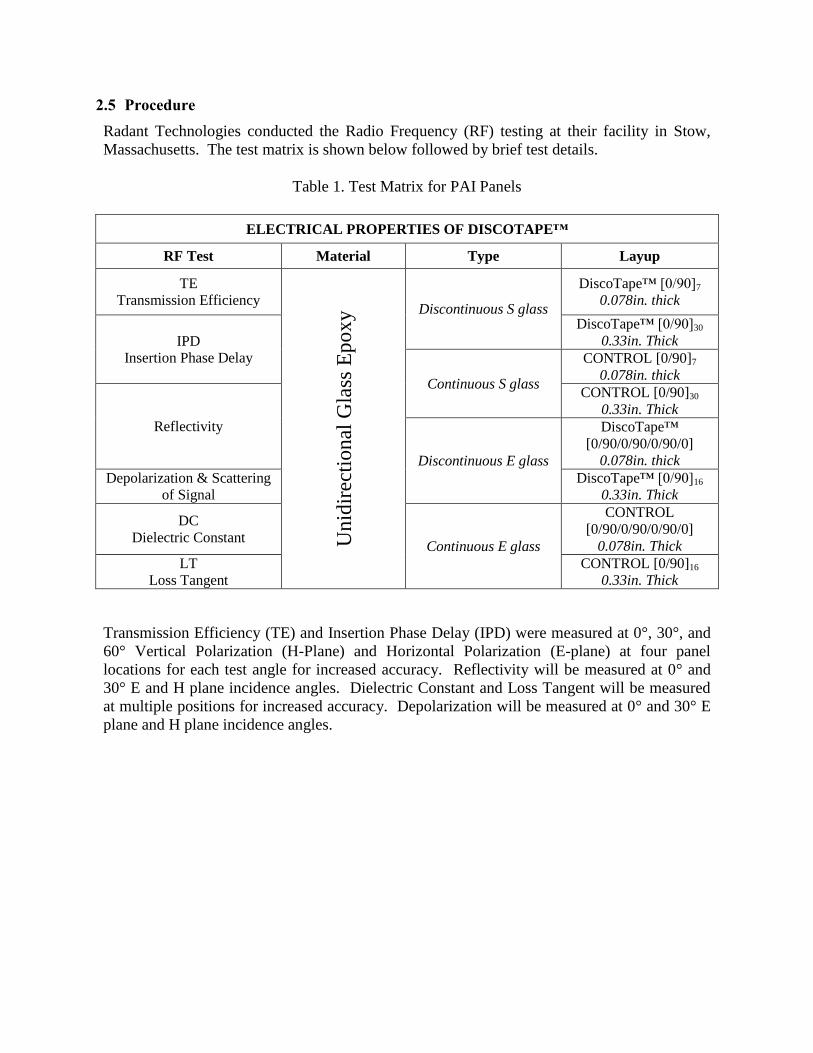
Table 1. Test Matrix for PAI Panels
ELECTRICAL PROPERTIES OF DISCOTAPE™
RF Test Material Type Layup
TE
Transmission Efficiency
Un
idir
ecti
on
al G
lass
Ep
ox
y Discontinuous S glass
DiscoTape™ [0/90]7
0.078in. thick
IPD
Insertion Phase Delay
DiscoTape™ [0/90]30
0.33in. Thick
Continuous S glass
CONTROL [0/90]7
0.078in. thick
Reflectivity
CONTROL [0/90]30
0.33in. Thick
Discontinuous E glass
DiscoTape™
[0/90/0/90/0/90/0]
0.078in. thick
Depolarization & Scattering
of Signal
DiscoTape™ [0/90]16
0.33in. Thick
DC
Dielectric Constant Continuous E glass
CONTROL
[0/90/0/90/0/90/0]
0.078in. Thick
LT
Loss Tangent
CONTROL [0/90]16
0.33in. Thick
Transmission Efficiency (TE) and Insertion Phase Delay (IPD) were measured at 0°, 30°, and
60° Vertical Polarization (H-Plane) and Horizontal Polarization (E-plane) at four panel
locations for each test angle for increased accuracy. Reflectivity will be measured at 0° and
30° E and H plane incidence angles. Dielectric Constant and Loss Tangent will be measured
at multiple positions for increased accuracy. Depolarization will be measured at 0° and 30° E
plane and H plane incidence angles.
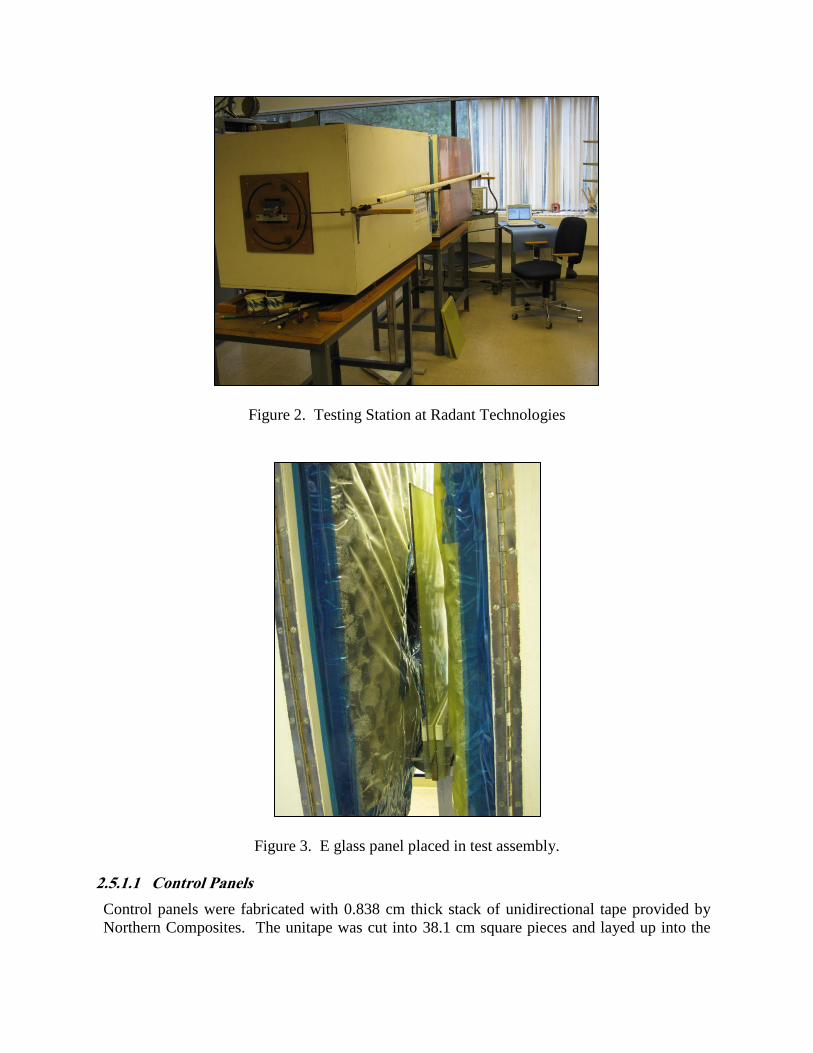
Figure 2. Testing Station at Radant Technologies
Figure 3. E glass panel placed in test assembly.
2.5.1.1 Control Panels
Control panels were fabricated with 0.838 cm thick stack of unidirectional tape provided by
Northern Composites. The unitape was cut into 38.1 cm square pieces and layed up into the
desired thicknesses. These included: 2 panels of approximately 0.838 cm thickness for X
Band (~10 GHz) and 2 panels of approximately 0.198 cm thickness for Q Band (~ 45 GHz).
2.5.1.2 DiscoTape Panels
The DiscoTape plies were processed with the flex die to create small cuts perpendicular to the
fiber direction at about 3.3 cm increments for the S glass and 5.08 cm increments for the E
glass.
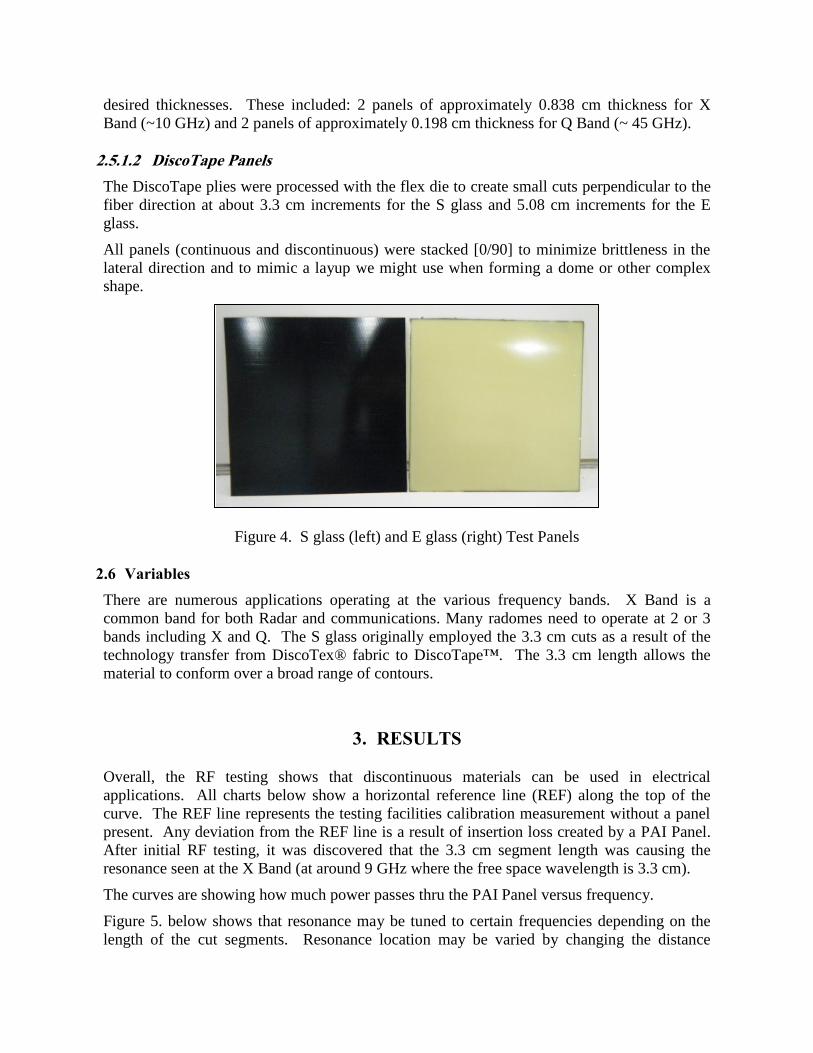
All panels (continuous and discontinuous) were stacked [0/90] to minimize brittleness in the
lateral direction and to mimic a layup we might use when forming a dome or other complex
shape.
Figure 4. S glass (left) and E glass (right) Test Panels
2.6 Variables
There are numerous applications operating at the various frequency bands. X Band is a
common band for both Radar and communications. Many radomes need to operate at 2 or 3
bands including X and Q. The S glass originally employed the 3.3 cm cuts as a result of the
technology transfer from DiscoTex® fabric to DiscoTape™. The 3.3 cm length allows the
material to conform over a broad range of contours.
3. RESULTS
Overall, the RF testing shows that discontinuous materials can be used in electrical
applications. All charts below show a horizontal reference line (REF) along the top of the
curve. The REF line represents the testing facilities calibration measurement without a panel
present. Any deviation from the REF line is a result of insertion loss created by a PAI Panel.
After initial RF testing, it was discovered that the 3.3 cm segment length was causing the
resonance seen at the X Band (at around 9 GHz where the free space wavelength is 3.3 cm).
The curves are showing how much power passes thru the PAI Panel versus frequency.
Figure 5. below shows that resonance may be tuned to certain frequencies depending on the
length of the cut segments. Resonance location may be varied by changing the distance
between cut increments on the tape. A 3.3 cm cut increment produces a resonance at
approximately 9 GHz that is evident by the increased insertion loss. Changing the cut
increment to 5.08 cm moves the resonance to approximately 6 GHz so that the Control and
Disco panels are electrically identical at X Band, as well as frequencies away from this
resonance. In doing so, one would have to assess if the material still possessed the properties
required for forming the desired shape. Tighter radius layups will require the increments to be
shortened, while larger, gentle curves may do well with longer increments.
Figure 5. Comparison of S glass and E glass results at 3.08 cm and 5.08 cm cut increments,
respectively.
3.1 S glass RF Testing
Initial data showed that the PAI Panels performed well with the exception of the discontinuous
panels being prone to a higher level of signal loss at the X Band frequency. The discontinuity
occurred at 3.83 cm increments in these panels. At Q Band, the discontinuous panel
performed as well as the control panel with no detectable impact on RF performance.
-3
-2
-1
0
7 8 9 10 11 12 13
X-Band Averages
S-Glass CONTROL E-Glass CONTROL
S-Glass DiscoTape™ E-Glass DiscoTape™
GHz
dB
-0.18
-0.13
-0.08
-0.03
0.02
-2.5
-2
-1.5
-1
-0.5
0
0.5
7 8 9 10 11 12 13
Inse
rtio
n L
oss
(dB
)
S-Glass CONTROL @ X-Band
Z1A_0 (dB) Z2A_0 (dB) Z1B_0 (dB)
Z2B_0 (dB) Average REF (dB)
GHz
-0.18
-0.13
-0.08
-0.03
0.02
-3
-2.5
-2
-1.5
-1
-0.5
0
7 8 9 10 11 12 13
Inse
rtio
n L
oss
(dB
)
S-Glass DiscoTape™ @ X-Band
Z1A_0 (dB) Z2A_0 (dB) Z1B_0 (dB)
Z2B_0 (dB) Average REF (dB)
GHz
Figure 6. Comparison of S glass Electrical Performance at X Band Frequencies
Figure 7. Comparison of S glass Electrical Performance at Q Band Frequencies
After considering probable causes of X Band signal loss, it was hypothesized that the
discontinuity increment was causing resonance around 9GHz, where the free space wavelength
is the same as the cut increments; 3.3 cm. The testing facility (Radant Technologies)
suggested a simple solution: Change the cut increment, dependent on the application
frequency of interest, in order to move the resonance out of the band of interest. For example,
it is expected that changing the spacing to 5.08 cm would to shift the resonance to 5.9 GHz,
which would not interfere with the large majority of radome applications.
In addition to changing the cut increments, it was suggested that E glass is typically lower loss
than the S glass used. The S glass employed contained 2.5 % carbon black by weight, which
would also contribute to signal loss. PAI decided to conduct a second round of testing on
higher performing materials. E glass was chosen without carbon coloring and the cut spacing
was increased from 3.3 cm to 5.08 cm for the next tests.
Tables 1 and 2 express Dielectric Constant (Er) and Loss Tangent (tanδ) at both X and Q band
frequencies. The permittivity of a lossless material is equal to ErE0 where Er is the relative
dielectric constant; relative to free space (vacuum) and is unitless, and E0 is the permittivity of
free space (a fixed constant).
Tanδ is Tangent (δ) and is also unitless. A material is lossy if it has a non-zero Tanδ and its
permittivity (E) then becomes complex and can be expressed as:
[1]
where tanδ = E’’/E’ (i.e., the ratio between imaginary and real parts of the permittivity).
Dielectric Constant is 1.0 for vacuum. From an electrical perspective, materials with Er as
close to 1 as possible are ideal. However, materials close to 1 (low density foam for example)
may not be suitable for many structural or radome applications. Practical, low speed, low
temp, radome applications might employ materials with Er in the 3 - 4.5 range. High speed
missile radomes often use ceramic based materials with Er over 5.5. There is often a trade-off
between mechanical and electrical properties. Over designing for strength will generally
-0.14
-0.12
-0.1
-0.08
-0.06
-0.04
-0.02
0
0.02
-1.4
-1.2
-1
-0.8
-0.6
-0.4
-0.2
0
0.2
30 31 32 33 34 35 36 37 38 39 41 42 43 44 45
Inse
rtio
n L
oss
(dB
)
S-Glass CONTROL @ Q-Band
Z1A_0 (dB) Z2A_0 (dB) Z1B_0 (dB)
Z2B_0 (dB) Average REF (dB)
GHz
-0.16
-0.14
-0.12
-0.1
-0.08
-0.06
-0.04
-0.02
0
0.02
-1.6
-1.4
-1.2
-1
-0.8
-0.6
-0.4
-0.2
0
0.2
30 31 32 33 34 35 36 37 38 39 41 42 43 44 45
Inse
rtio
n L
oss
(dB
)
S-Glass DiscoTape™ @ Q-Band
Z1A_0 (dB) Z2A_0 (dB) Z1B_0 (dB)
Z2B_0 (dB) Average REF (dB)
GHz
degrade electrical performance, while optimizing electrical properties may compromise
strength. Pepin Associates discontinuous materials fall in the practical range mentioned
above.
Loss Tangent (tanδ) is expressed as a percentage, where 100 % (or 1.0) is perfectly lossless
and 0 % (or 0.0) is perfectly lossy. Tanδ should be as small as possible as this is what drives
intrinsic insertion loss of the material. Insertion loss, in this case, is the loss of signal power
resulting from the insertion of a device (PAI Panel) between the transmitter and receiver.
Figure 4. above shows a PAI E glass panel test set-up, illustrating how the signal is transmitted
through the panel.
Table 2. S Glass Permittivity Evaluation Summary at 0° Incidence
X Band (8 to 12 GHz)
Panel Thickness (mils) Plane Dielectric Constant Loss Tangent
Control 336 H 4.05 0.021
Control 336 E 4.05 0.020
DiscoTape™ 1 333 H 3.91 0.066
DiscoTape™ 1 333 E 3.92 0.059
Q Band (33 to 50 GHz)
Panel Thickness (mils) Plane Dielectric Constant Loss Tangent
Control 80.3 H 3.85 0.025
Control 80.3 E 3.84 0.026
DiscoTape™ 2 77.6 H 3.91 0.025
DiscoTape™ 2 77.6 E 3.91 0.026
Table 3. E Glass Permittivity Evaluation Summary at 0° Incidence
X Band (8 to 12 GHz)
Panel Thickness (mils) Dielectric Constant Loss Tangent
Control 327 4.444 0.0180
DiscoTape™ 327 4.435 0.0176
Q Band (33 to 50 GHz)
Panel Thickness (mils) Dielectric Constant Loss Tangent
Control 71 4.48 0.0223
DiscoTape™ 69.5 4.56 0.0206
3.2 E glass RF Testing
As expected, the E glass panels performed better than the S glass panels with carbon black.
The tests show lower loss than the S glass and resonance no longer appeared at the X Band
frequency. No difference was seen between the discontinuous and control panels at either X
or Q Band, confirming that the resonance was moved out of the way of the signal by
increasing the length of the cut increment to 5.08 cm.
Figure 8. Comparison of E glass Electrical Performance at X Band Frequencies
Figures 9 and 10. below show that the discontinuous E glass performs as well as the
continuous in the Q Band frequency.
Figure 9. Comparison of Continuous and Discontinuous E glass at Q Band Frequency
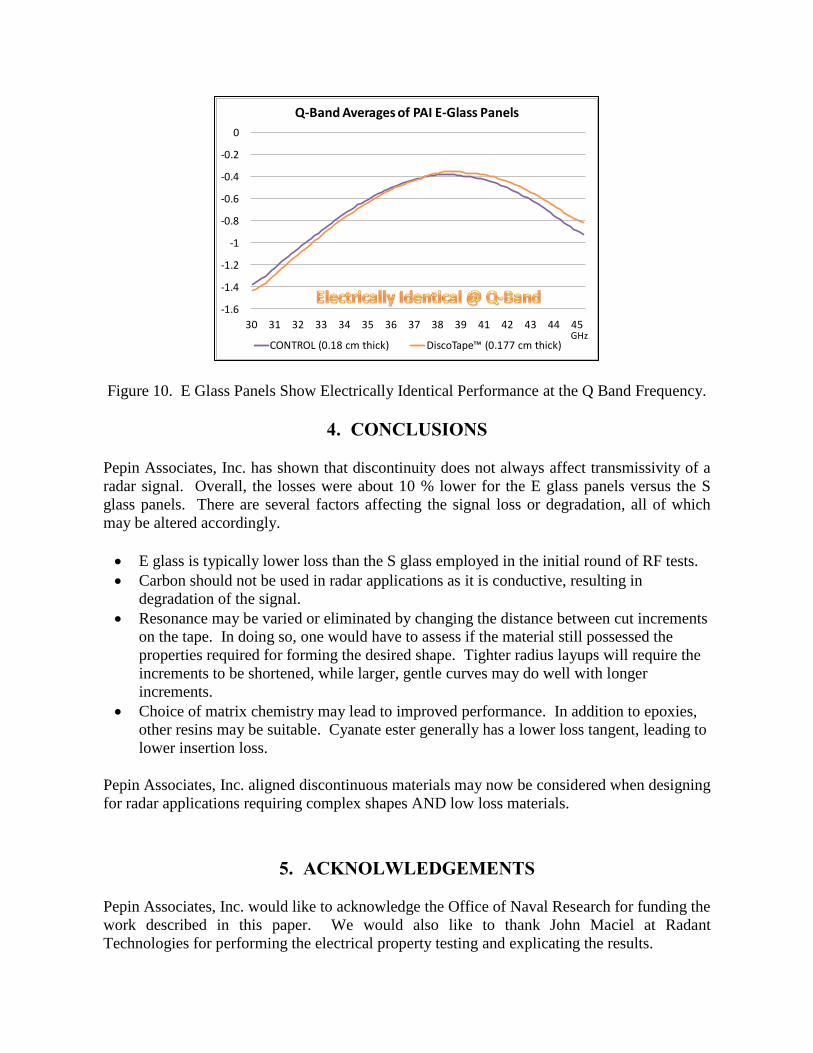
To better see the relationship of E glass panels at the Q Band frequency, the averages of the
curves were compared on the chart shown in Figure 10 below. Note that the two peaks of the
curves are not at the same frequency location due to the slight difference in thickness of the
two panels. This is normalized out when calculating Dielectric Constant and Loss Tangent.
-0.18
-0.13
-0.08
-0.03
0.02
-2.5
-2
-1.5
-1
-0.5
0
7 8 9 10 11 12 13
Inse
rtio
n L
oss
(dB
)E-Glass CONTROL @ X-Band
Z1A (dB) Z2A (dB) Z3A (dB) Z4A (dB) Z1B (dB)
Z2B (dB) Z3B (dB) Z4B (dB) Average REF (dB)
GHz
-0.18
-0.13
-0.08
-0.03
0.02
-3
-2.5
-2
-1.5
-1
-0.5
0
7 8 9 10 11 12 13
Inse
rtio
n L
oss
(dB
)
E-Glass DiscoTape™ @X-Band
Z1A (dB) Z2A (dB) Z3A (dB) Z4A (dB) Z1B (dB)
Z2B (dB) Z3B (dB) Z4B (dB) Average REF (dB)
GHz
-0.18
-0.13
-0.08
-0.03
0.02
-1.8
-1.6
-1.4
-1.2
-1
-0.8
-0.6
-0.4
-0.2
0
0.2
30 31 32 33 34 35 36 37 38 39 41 42 43 44 45
Inse
rtio
n L
oss
(dB
)
E-Glass CONTROL @ Q-Band Frequency
Z1A (dB) Z2A (dB) Z3A (dB) Z4A (dB) Z1B (dB)
Z2B (dB) Z3B (dB) Z4B (dB) Average REF (dB)
GHz
-0.18
-0.13
-0.08
-0.03
0.02
-1.8
-1.6
-1.4
-1.2
-1
-0.8
-0.6
-0.4
-0.2
0
0.2
30 31 32 33 34 35 36 37 38 39 41 42 43 44 45
Inse
rtio
n L
oss
(dB
)
E-Glass DiscoTape™ @ Q-Band Frequency
Z1A (dB) Z2A (dB) Z3A (dB) Z4A (dB) Z1B (dB)
Z2B (dB) Z3B (dB) Z4B (dB) Average REF (dB)
GHz
Figure 10. E Glass Panels Show Electrically Identical Performance at the Q Band Frequency.
4. CONCLUSIONS
Pepin Associates, Inc. has shown that discontinuity does not always affect transmissivity of a
radar signal. Overall, the losses were about 10 % lower for the E glass panels versus the S
glass panels. There are several factors affecting the signal loss or degradation, all of which
may be altered accordingly.
E glass is typically lower loss than the S glass employed in the initial round of RF tests.
Carbon should not be used in radar applications as it is conductive, resulting in
degradation of the signal.
Resonance may be varied or eliminated by changing the distance between cut increments
on the tape. In doing so, one would have to assess if the material still possessed the
properties required for forming the desired shape. Tighter radius layups will require the
increments to be shortened, while larger, gentle curves may do well with longer
increments.
Choice of matrix chemistry may lead to improved performance. In addition to epoxies,
other resins may be suitable. Cyanate ester generally has a lower loss tangent, leading to
lower insertion loss.
Pepin Associates, Inc. aligned discontinuous materials may now be considered when designing
for radar applications requiring complex shapes AND low loss materials.
5. ACKNOLWLEDGEMENTS
Pepin Associates, Inc. would like to acknowledge the Office of Naval Research for funding the
work described in this paper. We would also like to thank John Maciel at Radant
Technologies for performing the electrical property testing and explicating the results.
-1.6
-1.4
-1.2
-1
-0.8
-0.6
-0.4
-0.2
0
30 31 32 33 34 35 36 37 38 39 41 42 43 44 45
Q-Band Averages of PAI E-Glass Panels
CONTROL (0.18 cm thick) DiscoTape™ (0.177 cm thick)GHz
6. REFERENCES 6.1 Web Sites
Darling, Thomas B. "Military Radome Performance and Verification Testing,” www.mi-
technologies.com. September 15, 2008. MI Technologies, Suwanee, GA. Accessed January 10,