58
Intersection Control Evaluation (ICE) Alan El-Urfali and Mark Doctor
| Date post: | 12-May-2018 |
| Category: |
Documents |
| Upload: | truongdiep |
| View: | 223 times |
| Download: | 0 times |
Intersection Control Evaluation (ICE)
Alan El-Urfali and Mark Doctor
ICE in Florida?• Don’t worry … it will melt soon
What is ICE?
• Intersection Control Evaluation
• Purpose: To facilitate objective evaluations of intersection alternatives
• Intent: To promote “innovative” thinking and overcome reluctance to look at new options
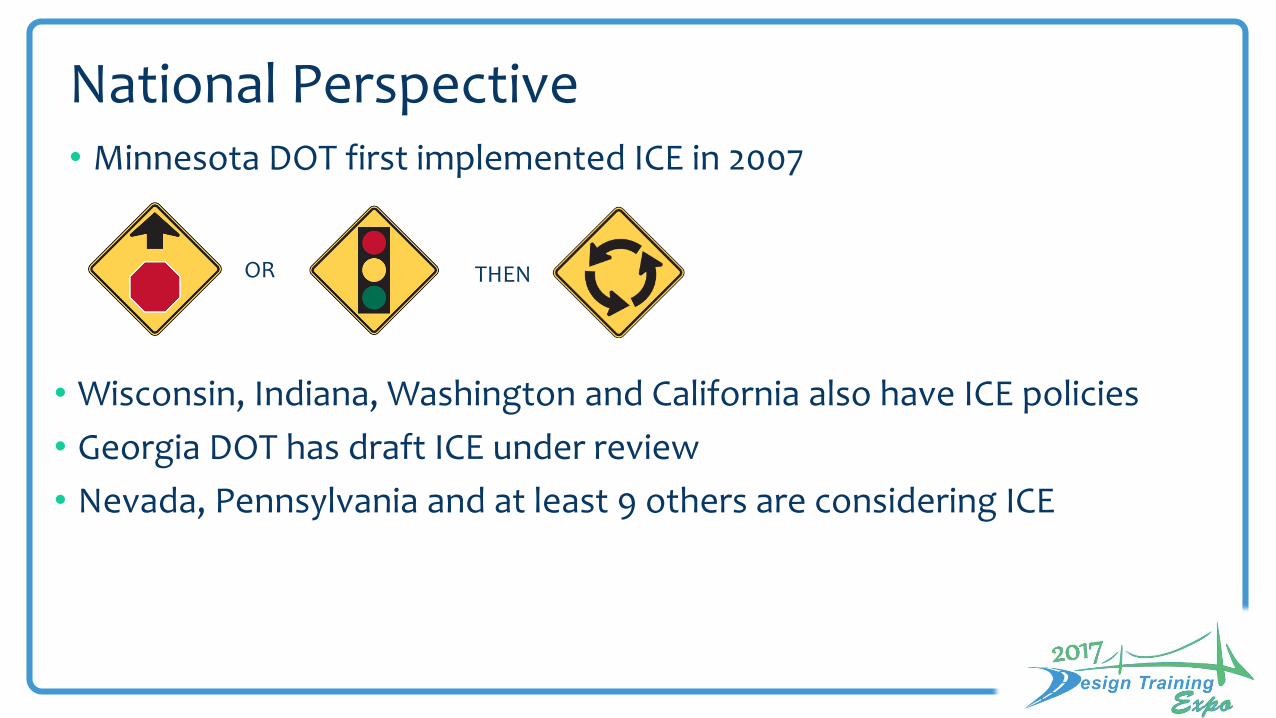
National Perspective• Minnesota DOT first implemented ICE in 2007
OR THEN
• Wisconsin, Indiana, Washington and California also have ICE policies
• Georgia DOT has draft ICE under review
• Nevada, Pennsylvania and at least 9 others are considering ICE
Current Perspectives
• Proliferation of “Innovative” Intersections
• Multimodal Emphasis
• Vision Zero / Systemic Safety / Safe Systems
• Performance-Based Practical Design• Considering the likely “value” of an improvement versus simply designing
to address traffic projections• Design Year vs. “Year to Failure”• Lifecycle cost considerations
Intersection Considerations
• STOP, Roundabout, Signal
• Single-lane or Multi-lane Roundabout
• Two-phase Signal or Multi-phase Signal• We now have a plethora of “2-phase” intersection choices (Superstreets,
Michigan-Lefts, Quadrant Intersections, Jug-handles, Continuous Flow Intersections, Bowtie Intersections
• Left-turn phasing: Protected Only or Protected-Permissive
• Dual or Triple Left Turn Lanes? / Dual Right Turn Lanes?
• Cycle Lengths: 240 sec or 300 sec?
• Pedestrians / Bicyclists / Transit Users
Intent of ICE• Adopting “performance based” policies such as for Intersection
Control Evaluation (ICE) creates a transparent and consistent approach for agencies to consider intersection alternatives based on metrics such as safety, operations, cost, and social, environmental and economic impacts. • … and document the decisions!!!
• ICE is intended to be a data driven, performance-based framework to optimize our investment and provide solutions that consider all users. • Encourage the evaluation of an array of options including innovative
intersection designs such as roundabouts, U-turn based intersections, continuous flow intersections, and diverging diamond interchanges—by comparing key performance metrics.
• Alternative Intersections
• ICE Process & Applicability
• ICE Tools
• Coordination Timeline
8
FDOT ICE Program Overview
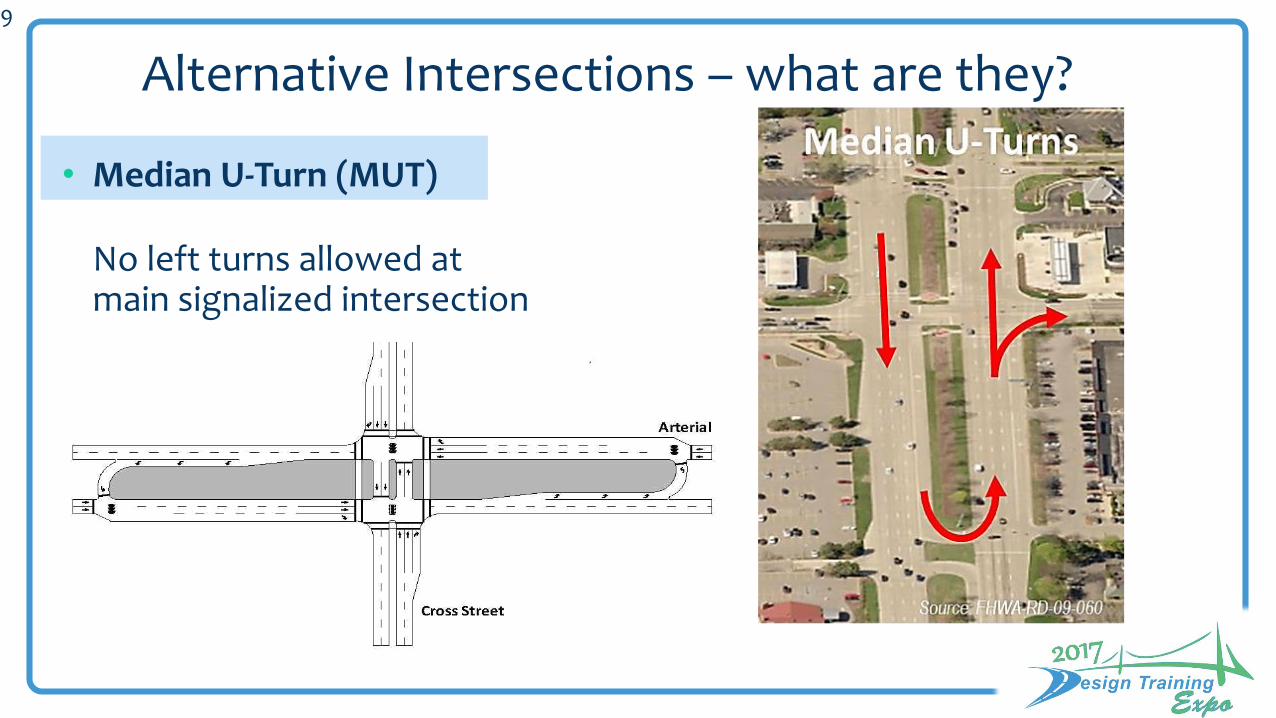
• Median U-Turn (MUT)
No left turns allowed at main signalized intersection
9
Alternative Intersections – what are they?
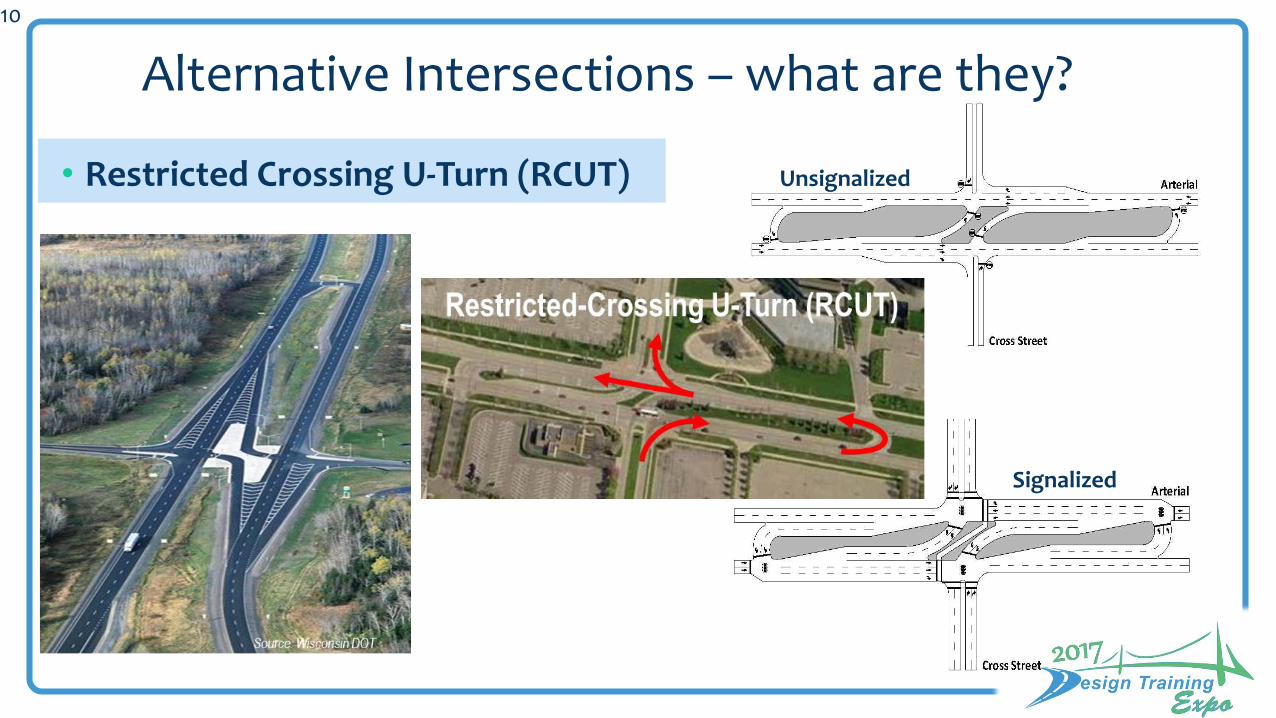
• Restricted Crossing U-Turn (RCUT)
10
Alternative Intersections – what are they?
Unsignalized
Signalized

• Restricted Crossing U-Turn (RCUT)
11
Alternative Intersections – what are they?
SR 4 Bypass at Symmes Rd Fairfield, OH
Signalized RCUT
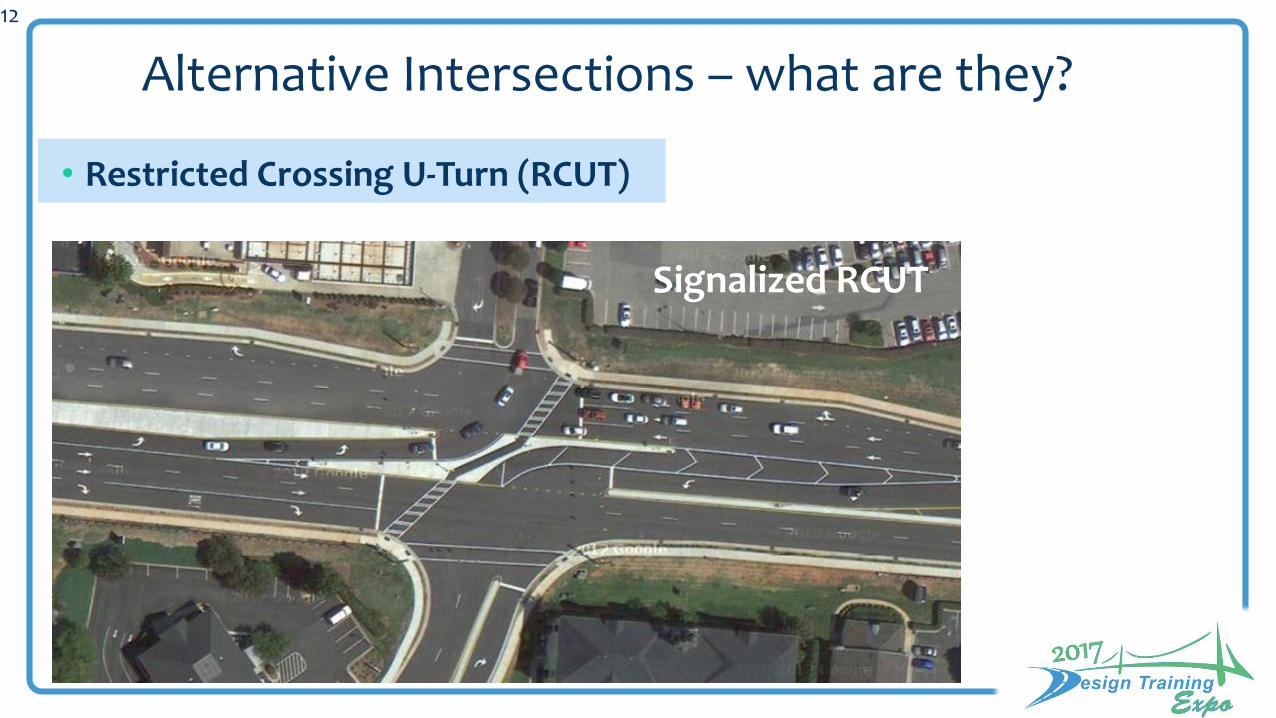
• Restricted Crossing U-Turn (RCUT)
12
Alternative Intersections – what are they?
Signalized RCUT

• Restricted Crossing U-Turn (RCUT)
13
Alternative Intersections – what are they?
First Super Street RCUT in Florida
Crosstown Pkwy at Floresta Blvd. in Port St. Lucie

• Jughandle
14
Alternative Intersections – what are they?
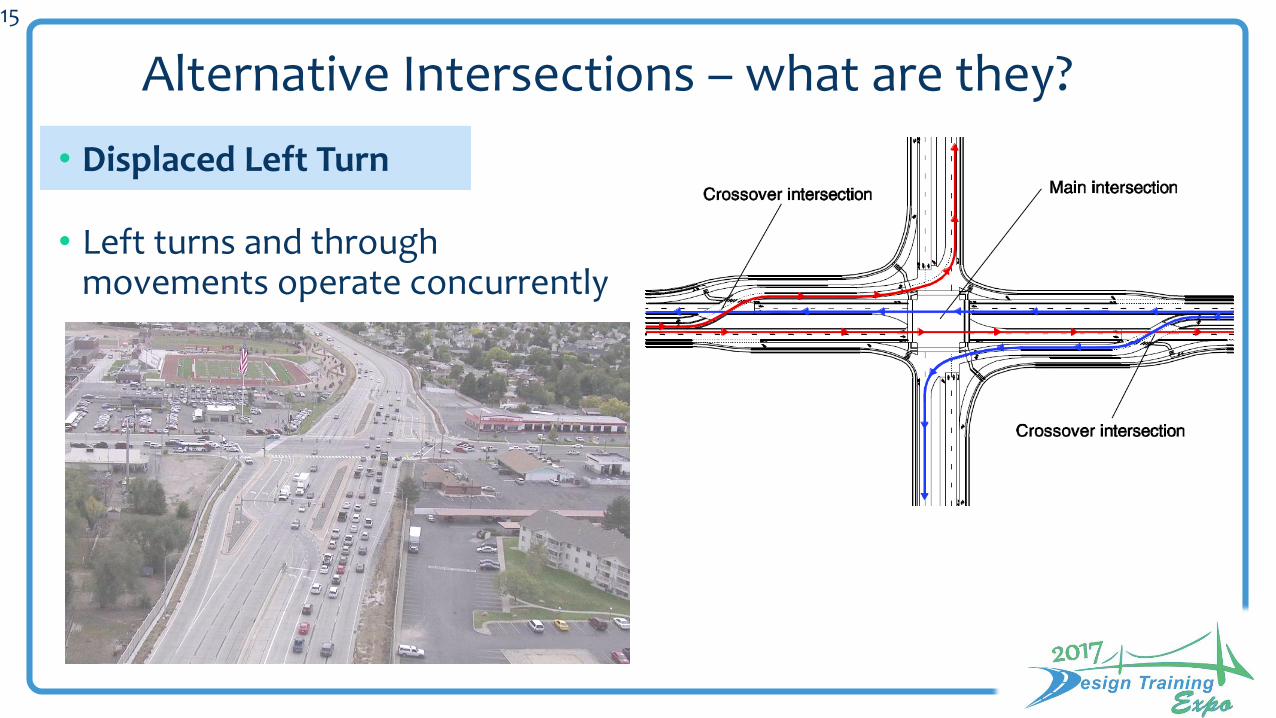
• Displaced Left Turn
• Left turns and through movements operate concurrently
15
Alternative Intersections – what are they?
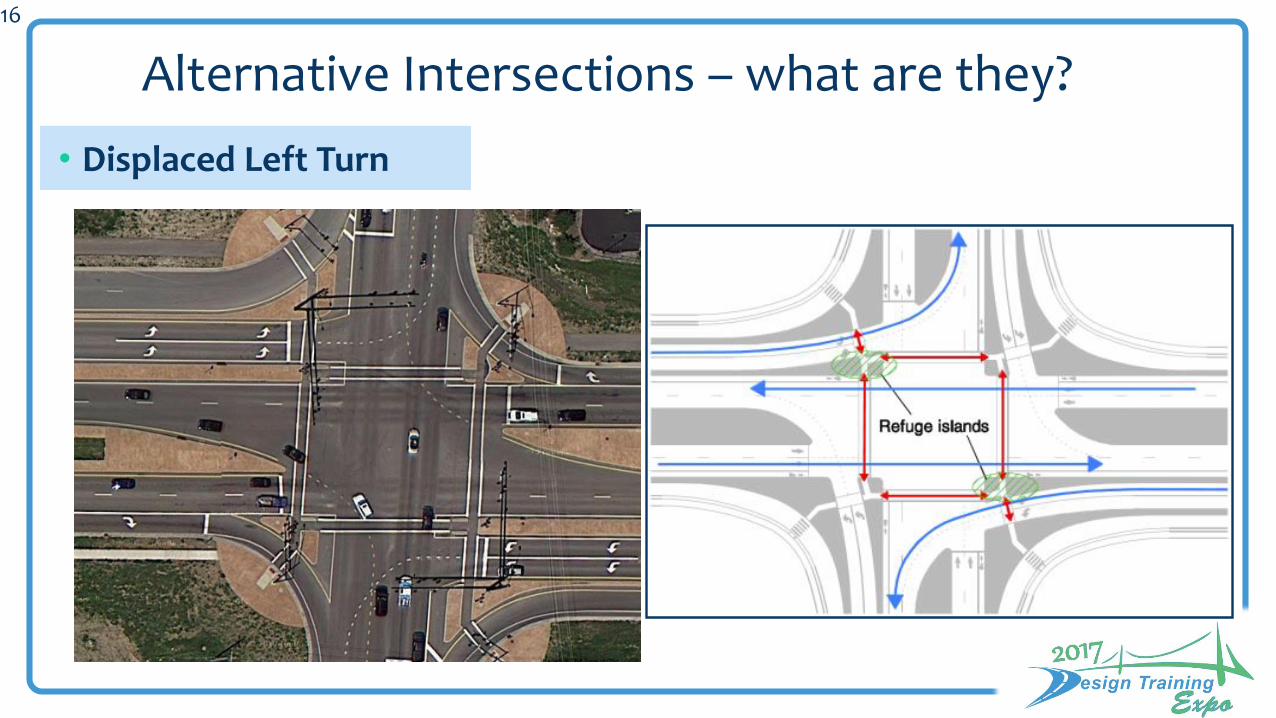
• Displaced Left Turn
16
Alternative Intersections – what are they?
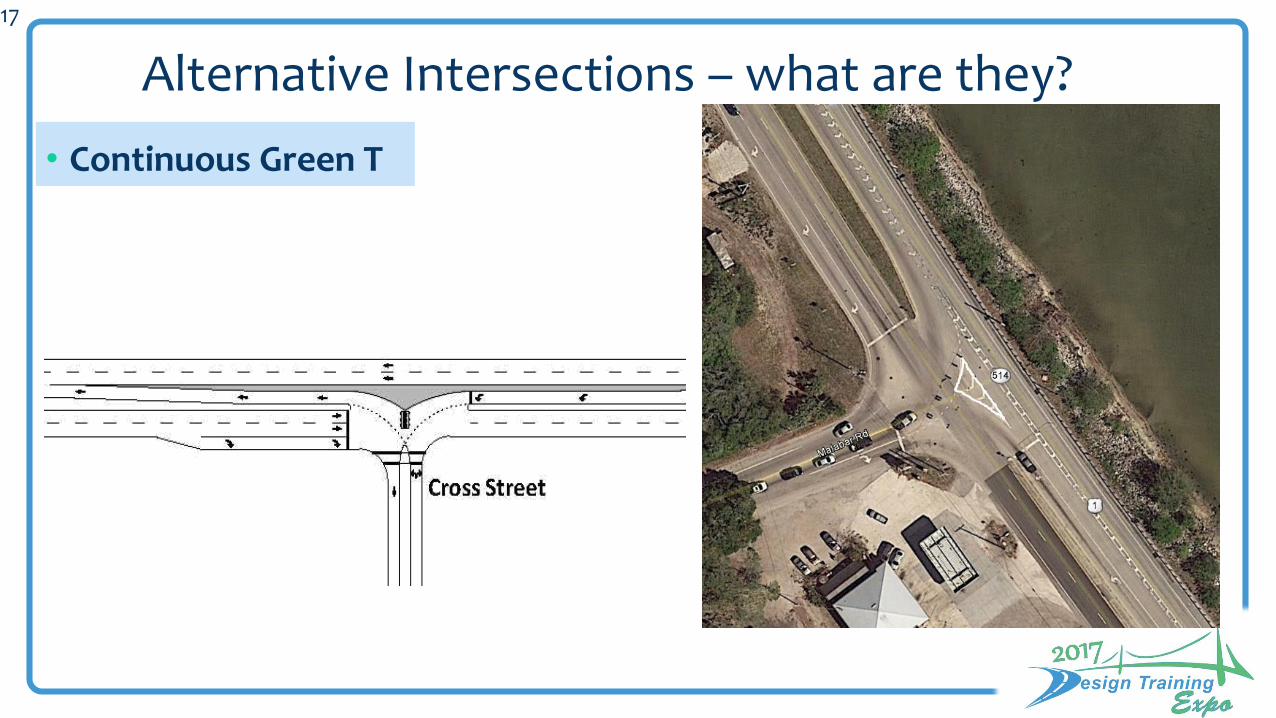
• Continuous Green T
17
Alternative Intersections – what are they?
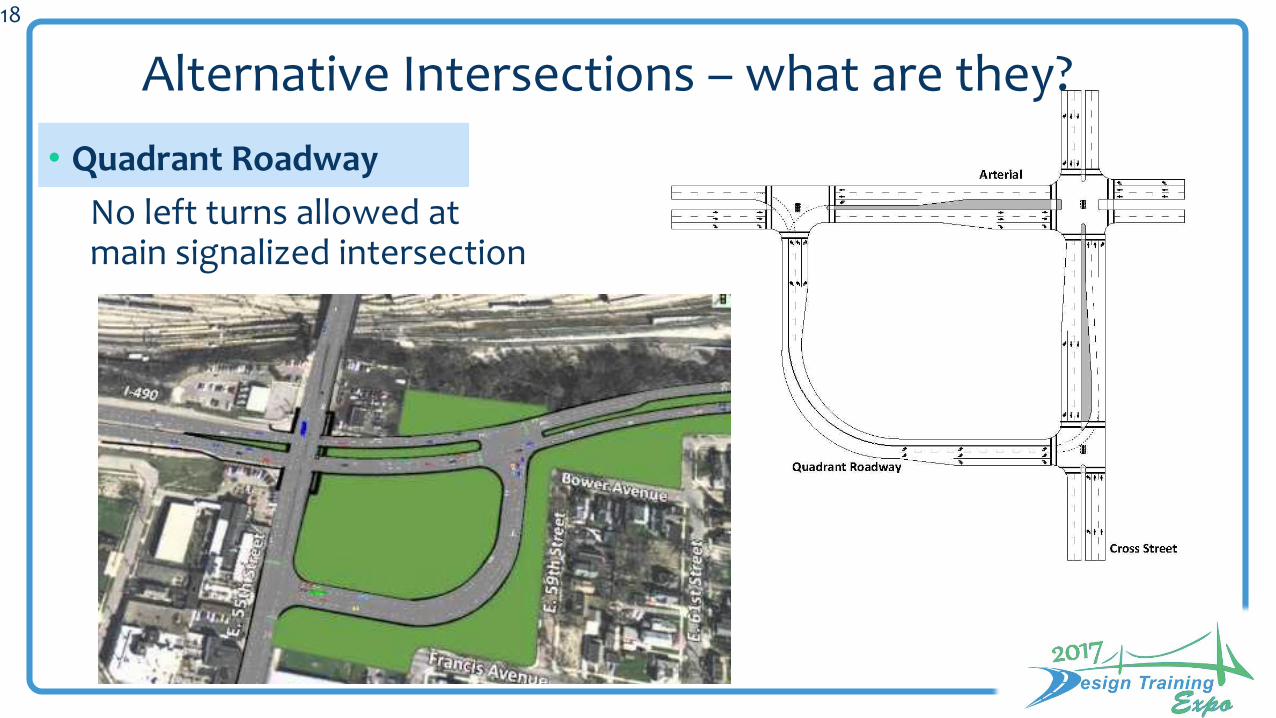
• Quadrant Roadway
No left turns allowed at main signalized intersection
18
Alternative Intersections – what are they?
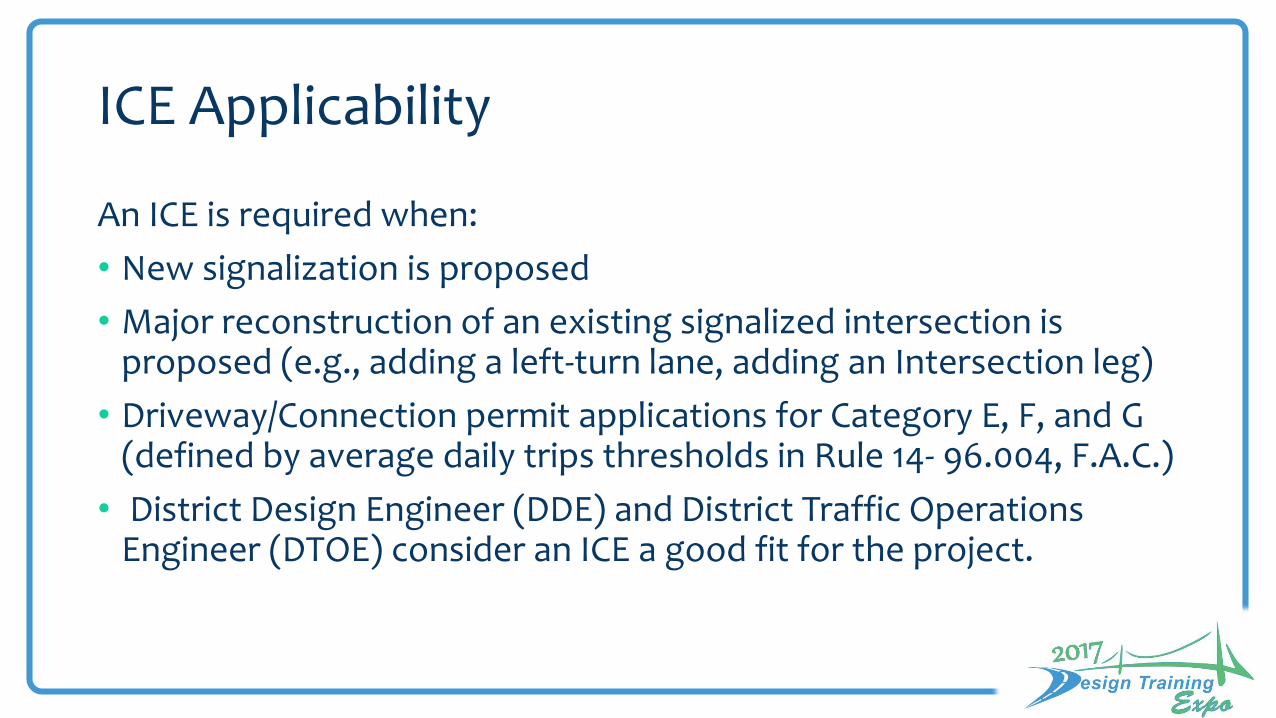
ICE Applicability
An ICE is required when:
• New signalization is proposed
• Major reconstruction of an existing signalized intersection is proposed (e.g., adding a left-turn lane, adding an Intersection leg)
• Driveway/Connection permit applications for Category E, F, and G (defined by average daily trips thresholds in Rule 14- 96.004, F.A.C.)
• District Design Engineer (DDE) and District Traffic Operations Engineer (DTOE) consider an ICE a good fit for the project.
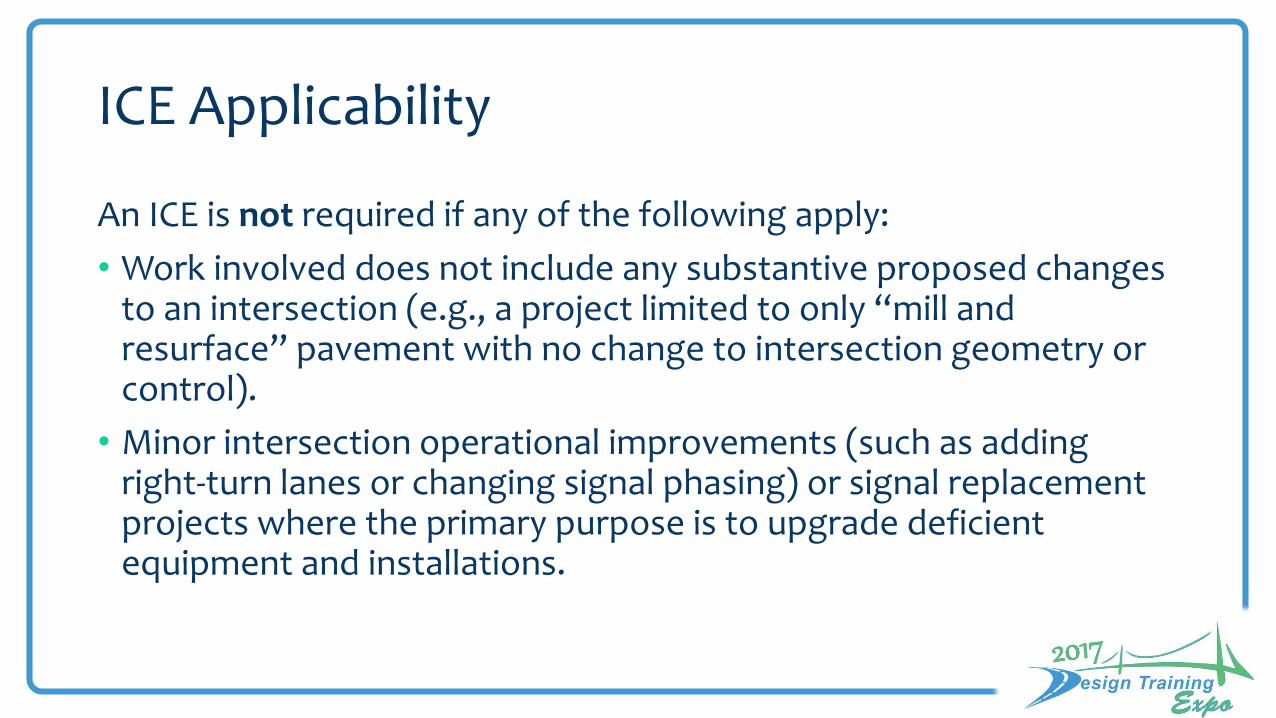
ICE Applicability
An ICE is not required if any of the following apply:
• Work involved does not include any substantive proposed changes to an intersection (e.g., a project limited to only “mill and resurface” pavement with no change to intersection geometry or control).
• Minor intersection operational improvements (such as adding right-turn lanes or changing signal phasing) or signal replacement projects where the primary purpose is to upgrade deficient equipment and installations.
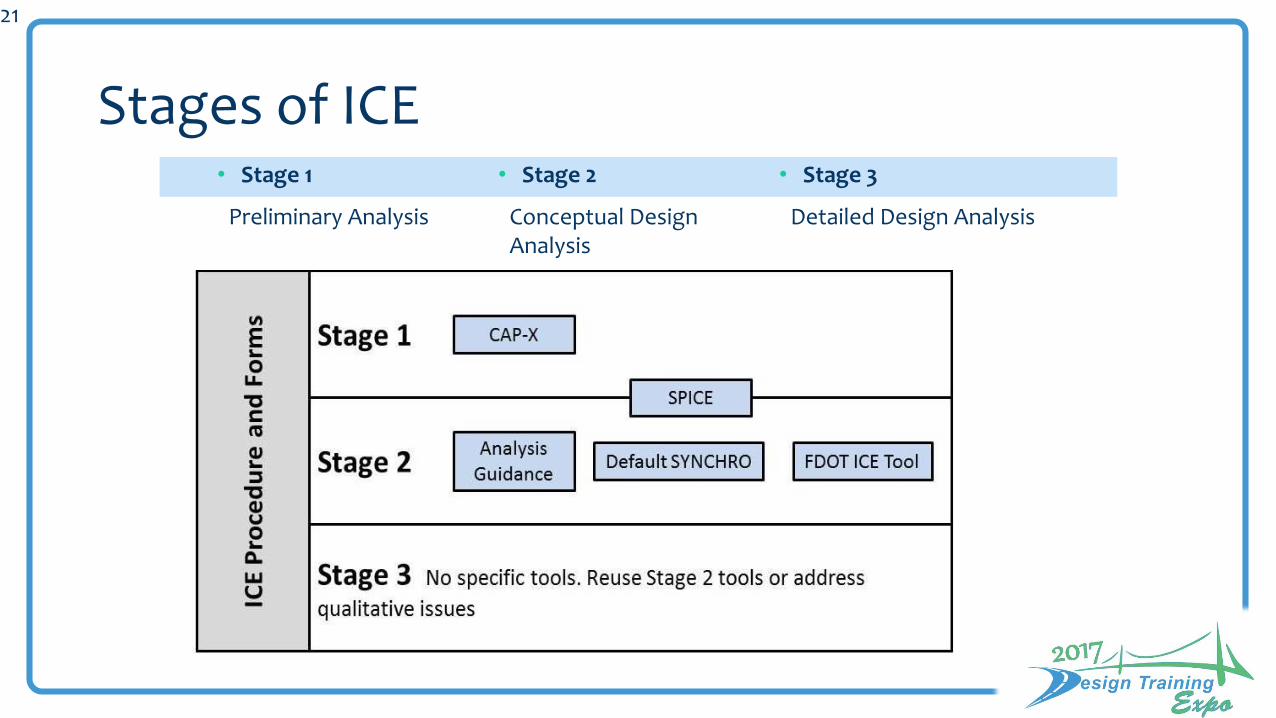
• Stage 1
Preliminary Analysis
• Stage 2
Conceptual Design Analysis
• Stage 3
Detailed Design Analysis
21
Stages of ICE

22
Who Completes the ICE Form?
• FDOT staff
• ConsultantsFDOT
PROJECTS
• Applicant
DRIVEWAY/ CONNECTION PERMITS ON STATE HWYS
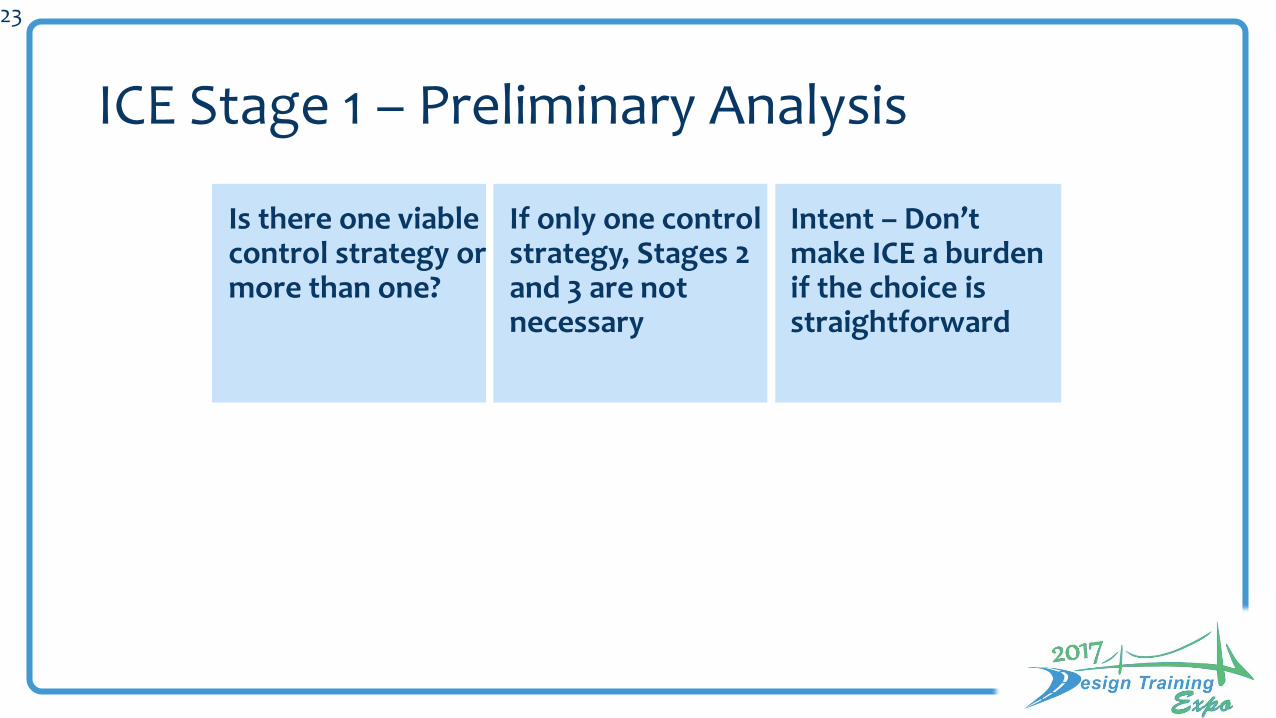
Is there one viable control strategy or more than one?
If only one control strategy, Stages 2 and 3 are not necessary
Intent – Don’t make ICE a burden if the choice is straightforward
23
ICE Stage 1 – Preliminary Analysis
24
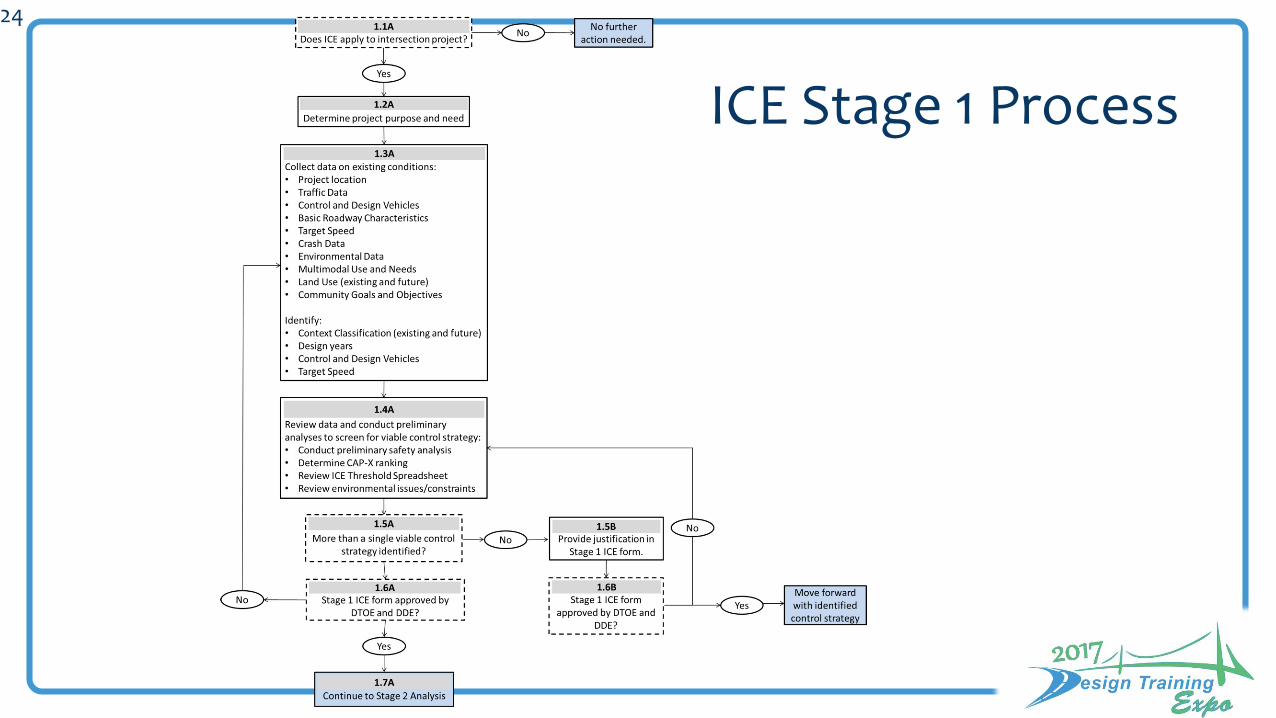
ICE Stage 1 Process
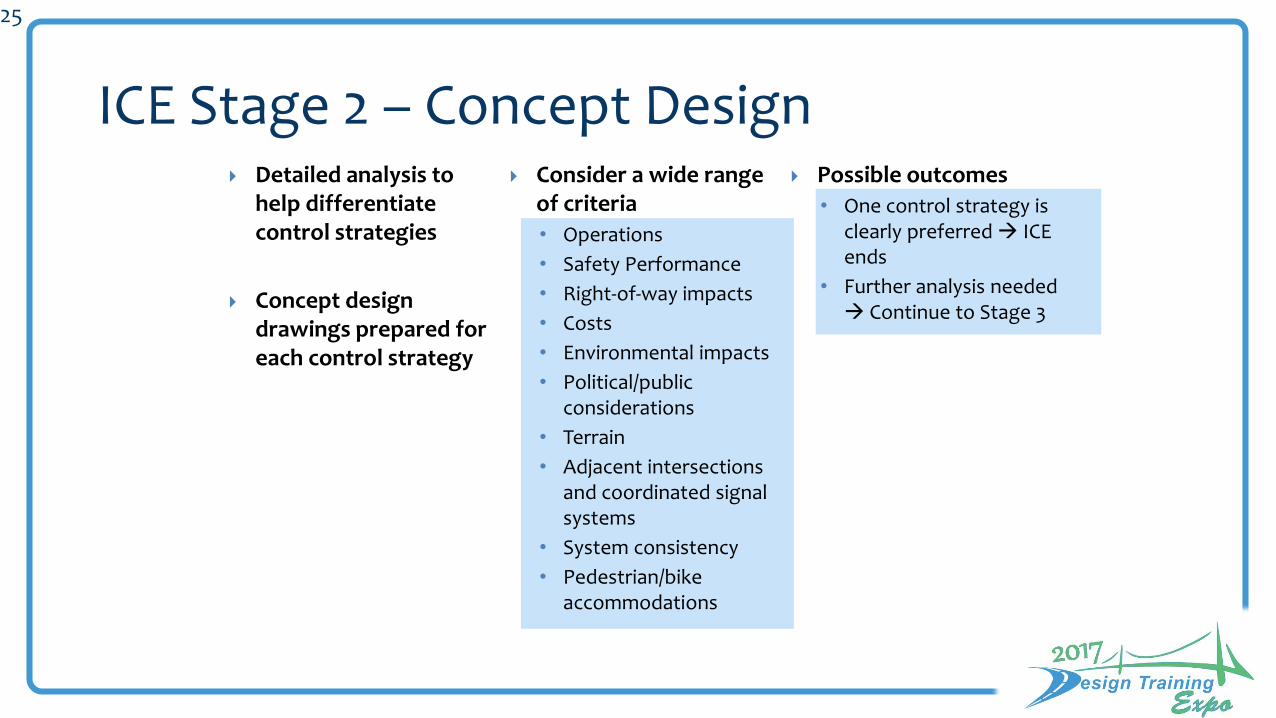
25
ICE Stage 2 – Concept Design Detailed analysis to
help differentiate control strategies
Concept design drawings prepared for each control strategy
Consider a wide range of criteria
• Operations
• Safety Performance
• Right-of-way impacts
• Costs
• Environmental impacts
• Political/public considerations
• Terrain
• Adjacent intersections and coordinated signal systems
• System consistency
• Pedestrian/bike accommodations
Possible outcomes
• One control strategy is clearly preferred ICE ends
• Further analysis needed Continue to Stage 3

26
ICE Stage 2 Process
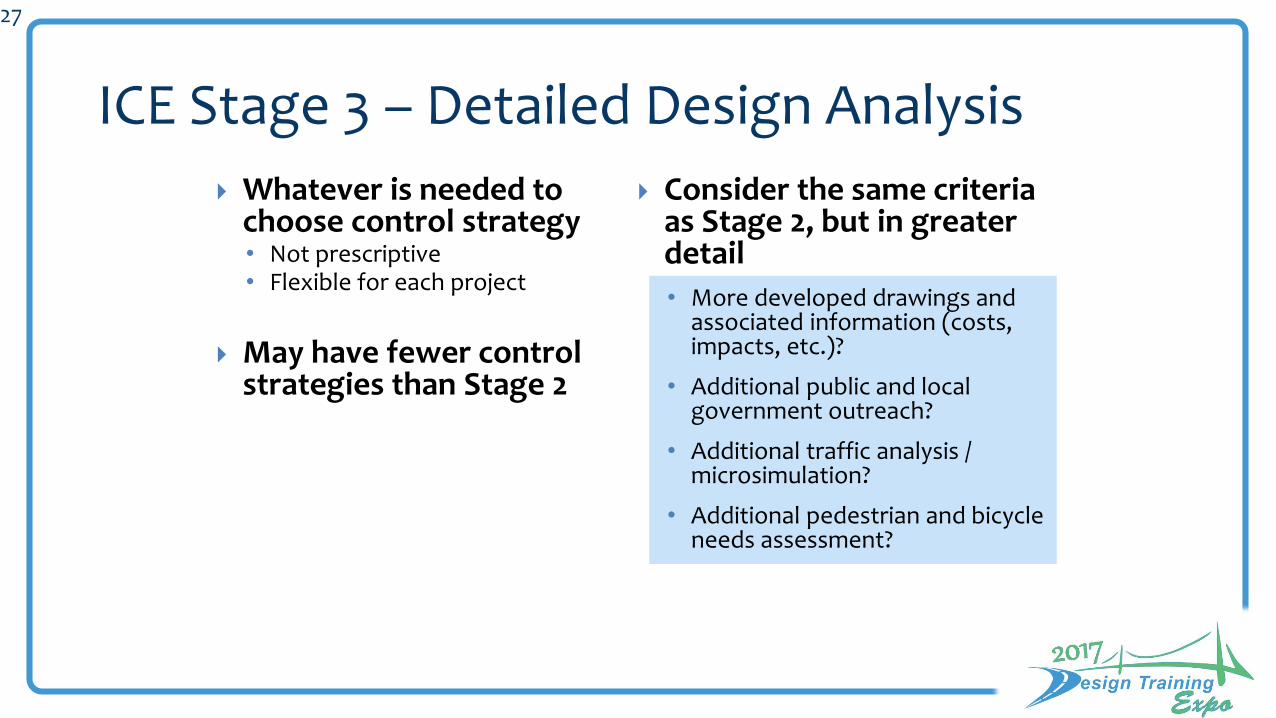
27
ICE Stage 3 – Detailed Design Analysis
Whatever is needed to choose control strategy• Not prescriptive• Flexible for each project
May have fewer control strategies than Stage 2
Consider the same criteria as Stage 2, but in greater detail
• More developed drawings and associated information (costs, impacts, etc.)?
• Additional public and local government outreach?
• Additional traffic analysis / microsimulation?
• Additional pedestrian and bicycle needs assessment?

28
ICE Stage 3 Process
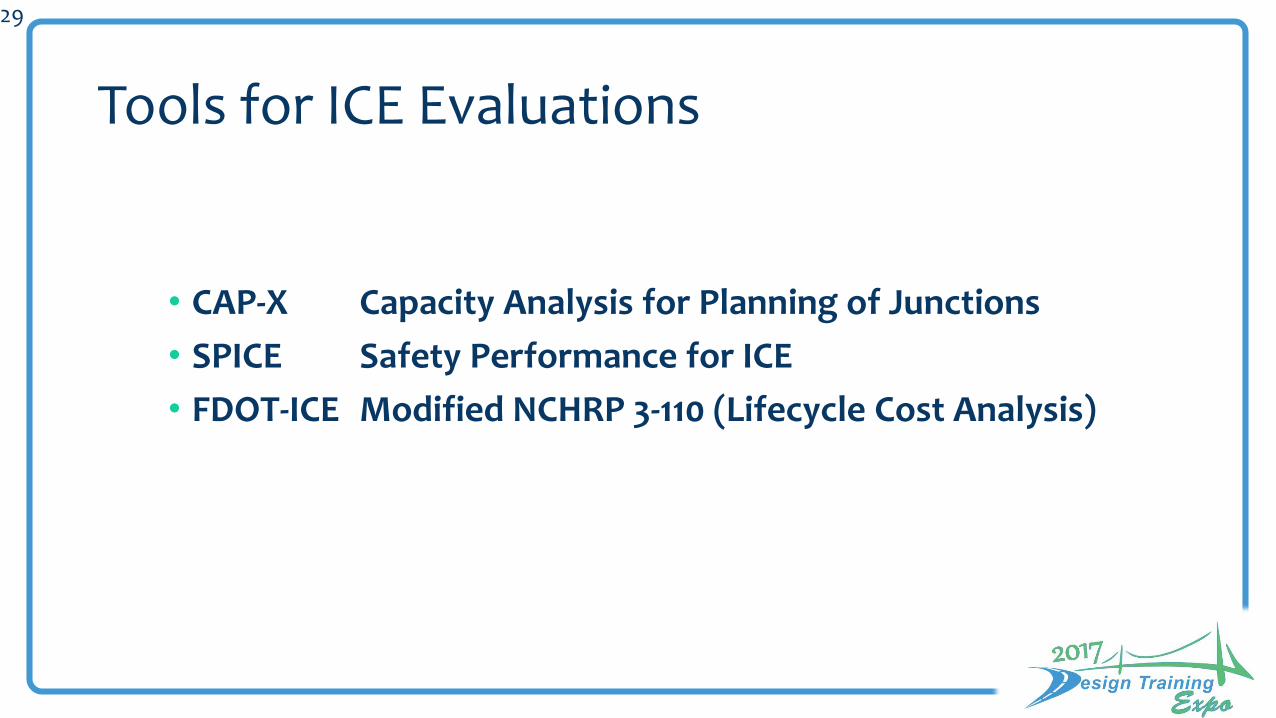
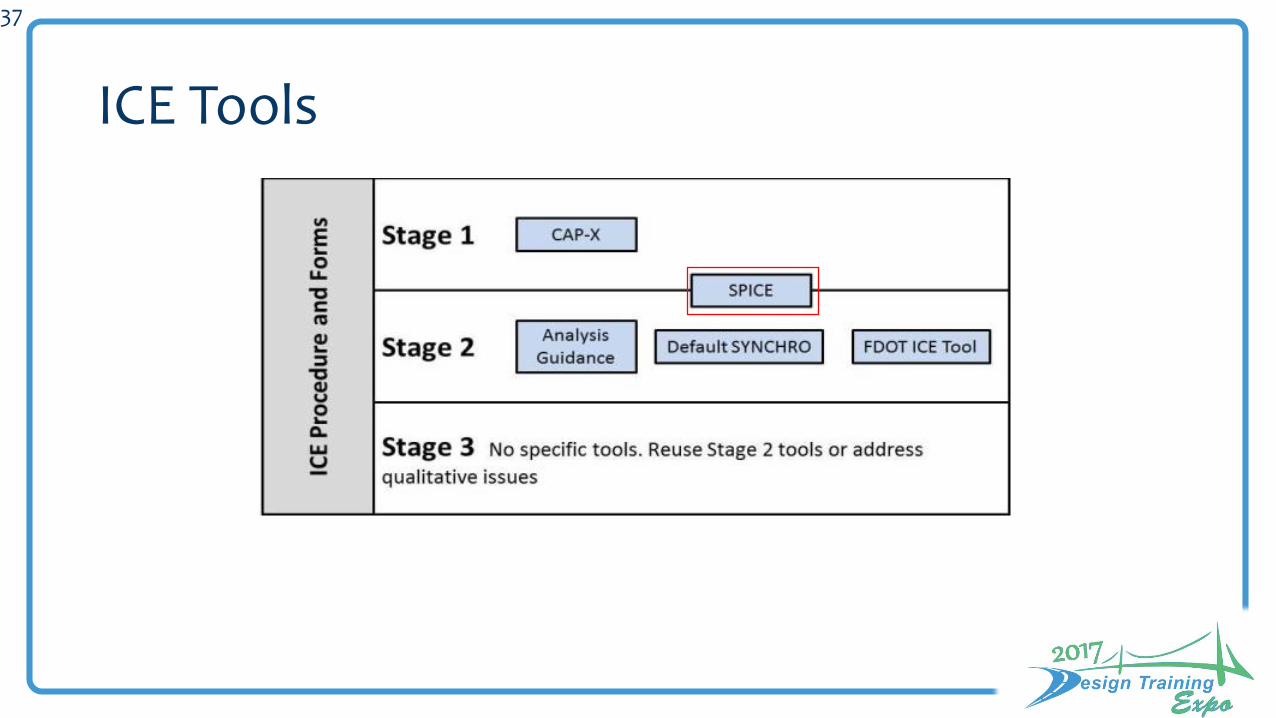
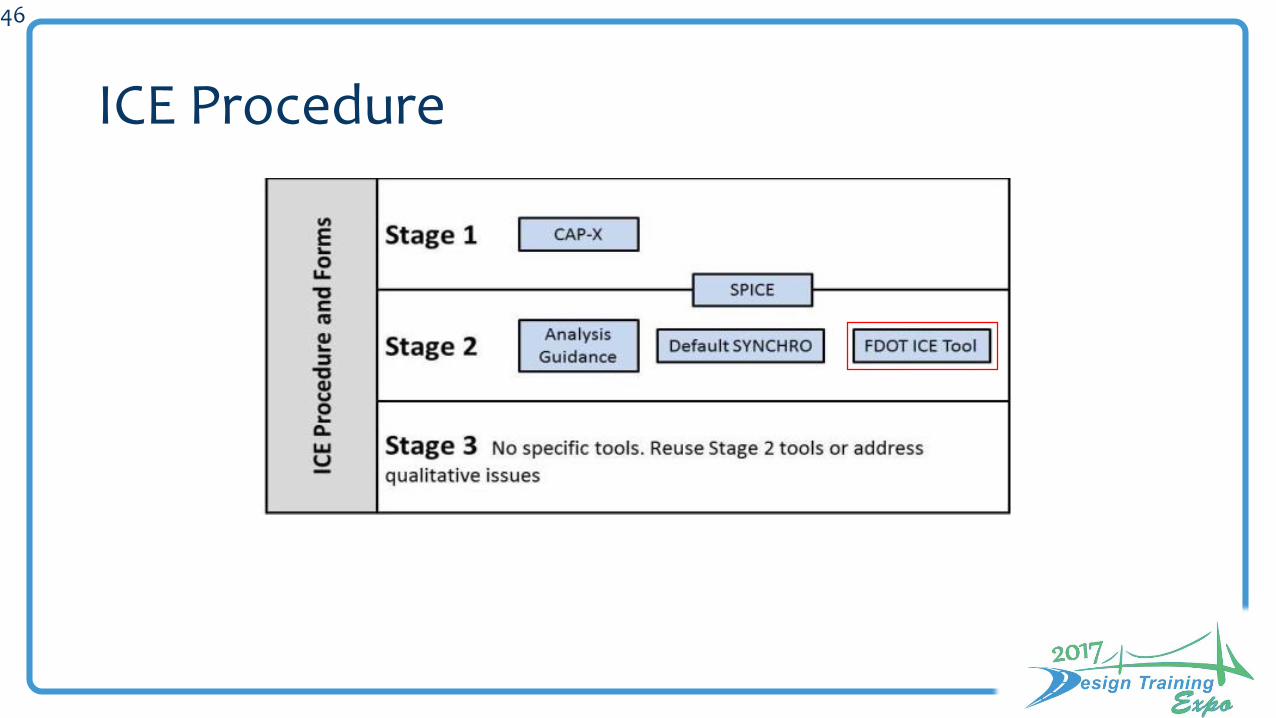
• CAP-X Capacity Analysis for Planning of Junctions
• SPICE Safety Performance for ICE
• FDOT-ICE Modified NCHRP 3-110 (Lifecycle Cost Analysis)
29
Tools for ICE Evaluations
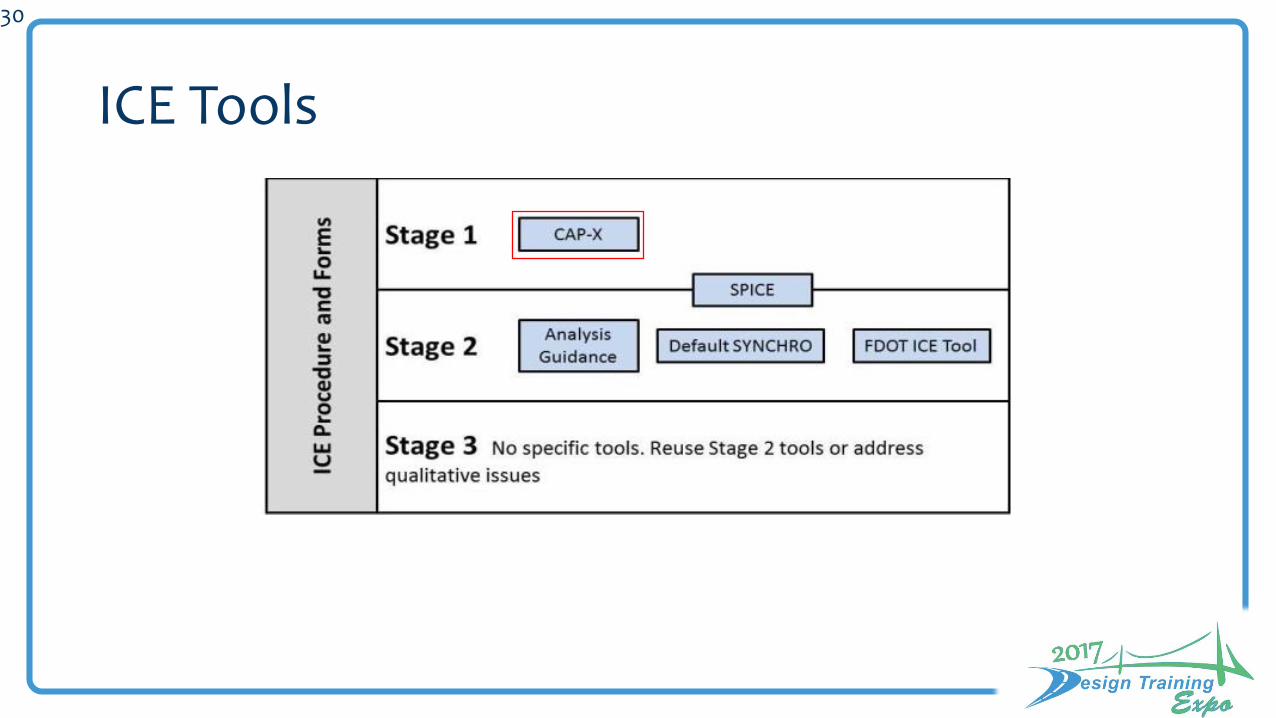
30
ICE Tools
31
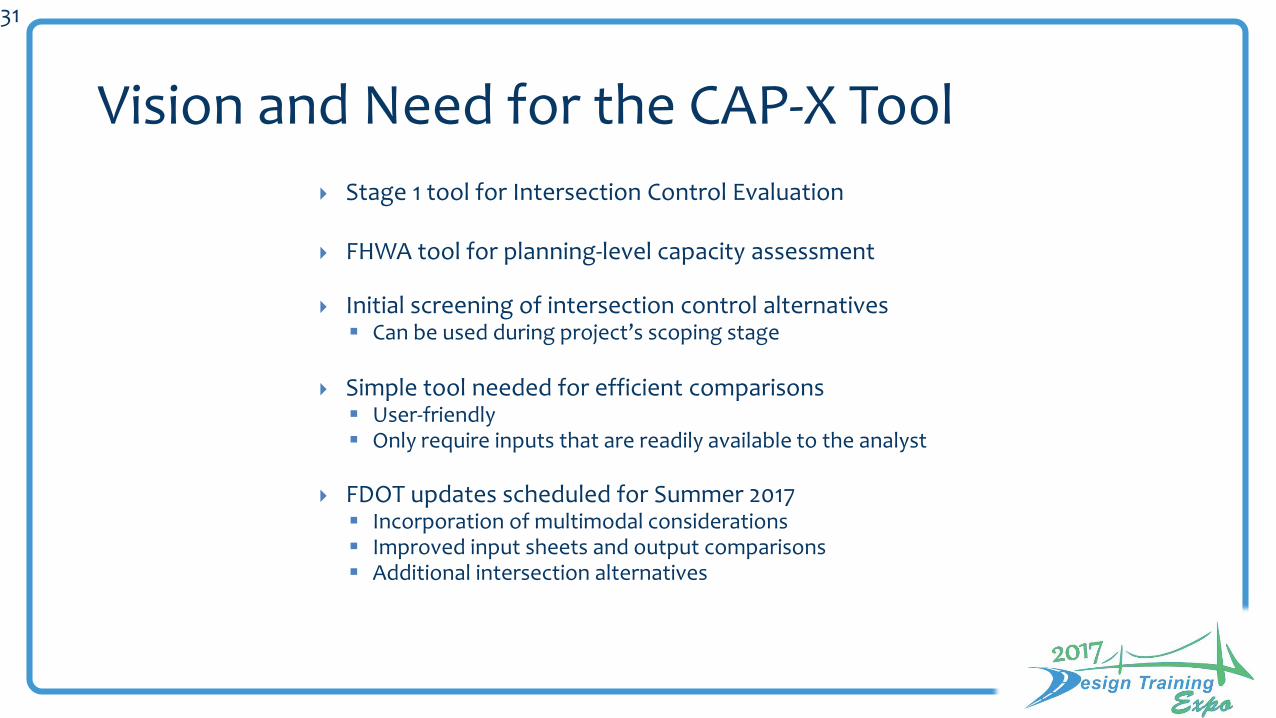
Vision and Need for the CAP-X Tool
Stage 1 tool for Intersection Control Evaluation
FHWA tool for planning-level capacity assessment
Initial screening of intersection control alternatives Can be used during project’s scoping stage
Simple tool needed for efficient comparisons User-friendly Only require inputs that are readily available to the analyst
FDOT updates scheduled for Summer 2017 Incorporation of multimodal considerations Improved input sheets and output comparisons Additional intersection alternatives
32
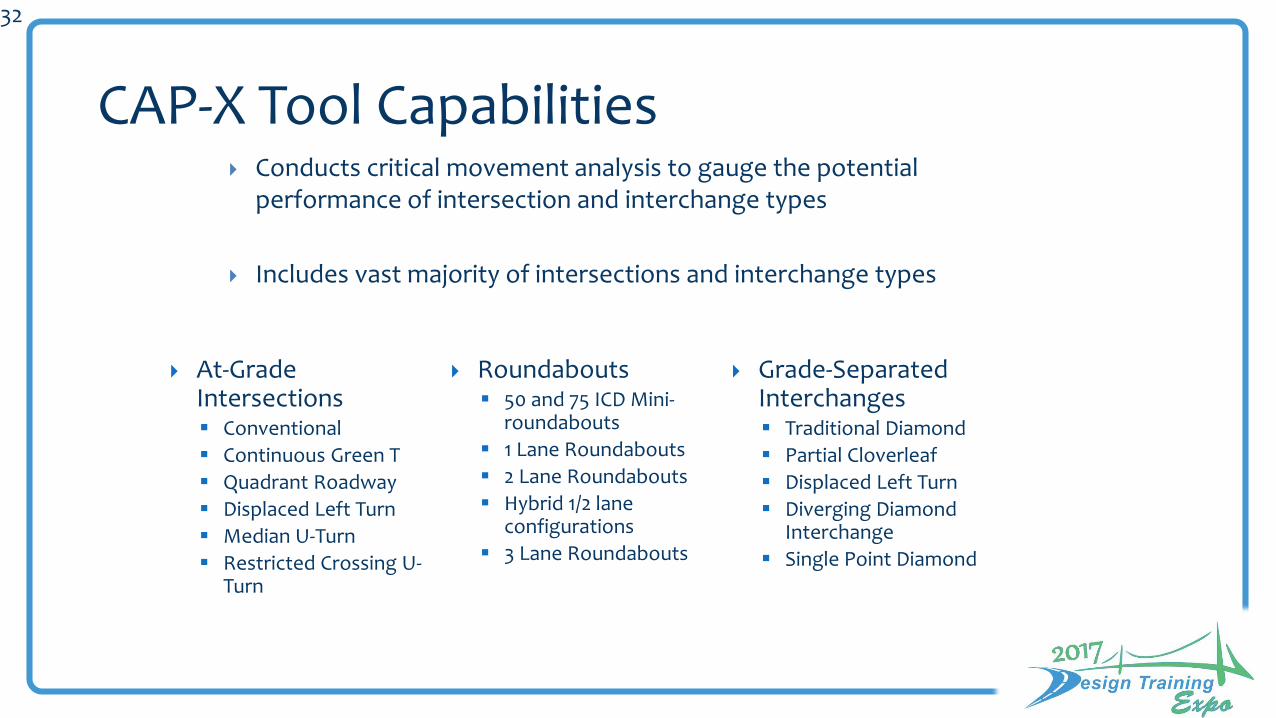
CAP-X Tool Capabilities
At-Grade Intersections Conventional
Continuous Green T
Quadrant Roadway
Displaced Left Turn
Median U-Turn
Restricted Crossing U-Turn
Roundabouts 50 and 75 ICD Mini-
roundabouts
1 Lane Roundabouts
2 Lane Roundabouts
Hybrid 1/2 lane configurations
3 Lane Roundabouts
Grade-Separated Interchanges Traditional Diamond
Partial Cloverleaf
Displaced Left Turn
Diverging Diamond Interchange
Single Point Diamond
Conducts critical movement analysis to gauge the potential performance of intersection and interchange types
Includes vast majority of intersections and interchange types

• Turning Movement Volumes
• Multimodal level of activity (FDOT addition)
• Additional planning level values
33
CAP-X Inputs
Northbound
Southbound 300
300
300
300
300
300
300
300
0
Westbound
Eastbound
0
ThruLeftU-Turn
Volume (Veh/hr)
300
300
300
300
0
0
Right
Adjustment
Factor 0.80
0.80Suggested
Truck to PCE Factor Suggested = 2.00 2.00
Critical Lane Volume
Threshold
2-phase signal
3-phase signal
4-phase signal
1800
1750
1700
Suggested = 1800
Suggested = 1750
Bicycles
0.85
0.95
0.95
U-Turn
0
Left Thru Right Heavy Vehicles Volume Growth
0.00%0.00%
Traffic Volume Demand
0.00%300
300Northbound
Southbound 0
0
300
300
300
300
Multimodal Activity
E-W / Crossing East-West Legs
Volume (Veh/hr) Percent (%)
300 300 300
300 300 300
TransitPedestrians
0.00%
0.85
Eastbound
Westbound 0 0.00%
0.00%
0.00%
0.00%
Equivalent Pasenger Car Volume
Low MediumLow
Suggested = 1700
MediumN-S / Crossing North-South Legs High Low

• Evaluation for each intersection alternative is presented using critical movement analysis
34
CAP-X Intersection Analysis
2 Phases
2 Phases
2 Phases
2 Phases
1650 CL
V
0.92 V/C 1800
MA
X
1765 CL
V
0.98 V/C 1800
MA
X
1
900
pepch
pepch
1650600
1
1 1 1
0 300 300 300
0p
ep
ch
300
pep
ch
pepch pepch pepch pepch
pep
ch
300
1
1765 300
300
pep
ch
pep
ch
300 1765
pep
ch
300 1
Note: This diagram does not reflect the actual lane configuration of the Intersection
1650
1 1 1
pep
ch
0
pepch pepch pepch pepch
300 300 300 0
Restricted Crossing U-Turn (N-S)Data Input and Configuration
pepch
9001
1
600pepch
pep
ch
Project Number: 10000
Location Tallahassee, FL
Date 2017 AM
VOLUME / CAPACITY
RATIO: 0.98
1765 CL
V
0.98 V/C 1800
MA
X
1650 CL
V
0.92 V/C 1800
MA
X
Restricted Crossing U-Turn (N-S)Design and Results
Project Name: Oak St at Gulf Ave Volume-to-Capacity Ratio
< 0.750 0.750 - 0.875 0.875 - 1.00 ≥ 1.00
Back to Results
35
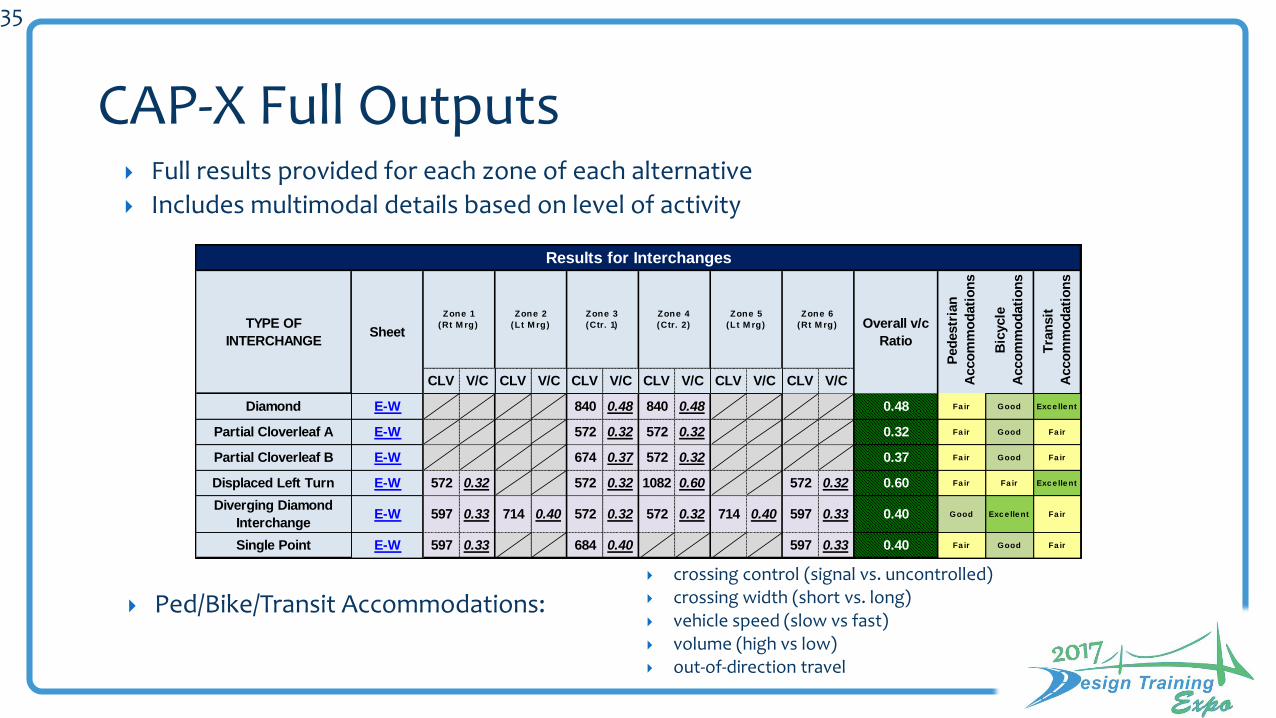
CAP-X Full Outputs
0.40
0.40597
0.32
0.33
0.32
0.60
0.32
0.48
572
0.40 597
0.32
572 0.32
1082
572 714
TYPE OF
INTERCHANGE
Diamond
Partial Cloverleaf A
Partial Cloverleaf B
Displaced Left Turn
Diverging Diamond
Interchange
Single Point 597
572
Sheet
E-W
E-W
E-W
E-W
E-W
Zone 1
(Rt M rg)
0.33
CLV V/C
674 5720.37
V/C CLV V/C CLV
572
0.40
0.32
Fa ir
0.32
0.33714
684
572
0.40
597
Fa irGood
Good Fa ir
Exc e lle nt
0.33
Fa ir Fa ir Exc e lle nt
Fa ir
0.32 0.60
Good
572
Fa ir0.37
Overall v/c
Ratio
V/C
Ped
estr
ian
Acco
mm
od
ati
on
s
Bic
ycle
Acco
mm
od
ati
on
s
Tra
nsit
Acco
mm
od
ati
on
s
Zone 2
(Lt M rg)
Zone 5
(Lt M rg)
Zone 6
(Rt M rg)
Zone 4
(Ctr. 2)
Zone 3
(Ctr. 1)
840 840 0.48
CLV V/C CLV V/CCLV
E-W
Results for Interchanges
Fa ir Good Exc e lle nt0.48
Fa ir Good Fa ir0.32
Ped/Bike/Transit Accommodations: crossing control (signal vs. uncontrolled) crossing width (short vs. long) vehicle speed (slow vs fast) volume (high vs low) out-of-direction travel
Full results provided for each zone of each alternative
Includes multimodal details based on level of activity
36
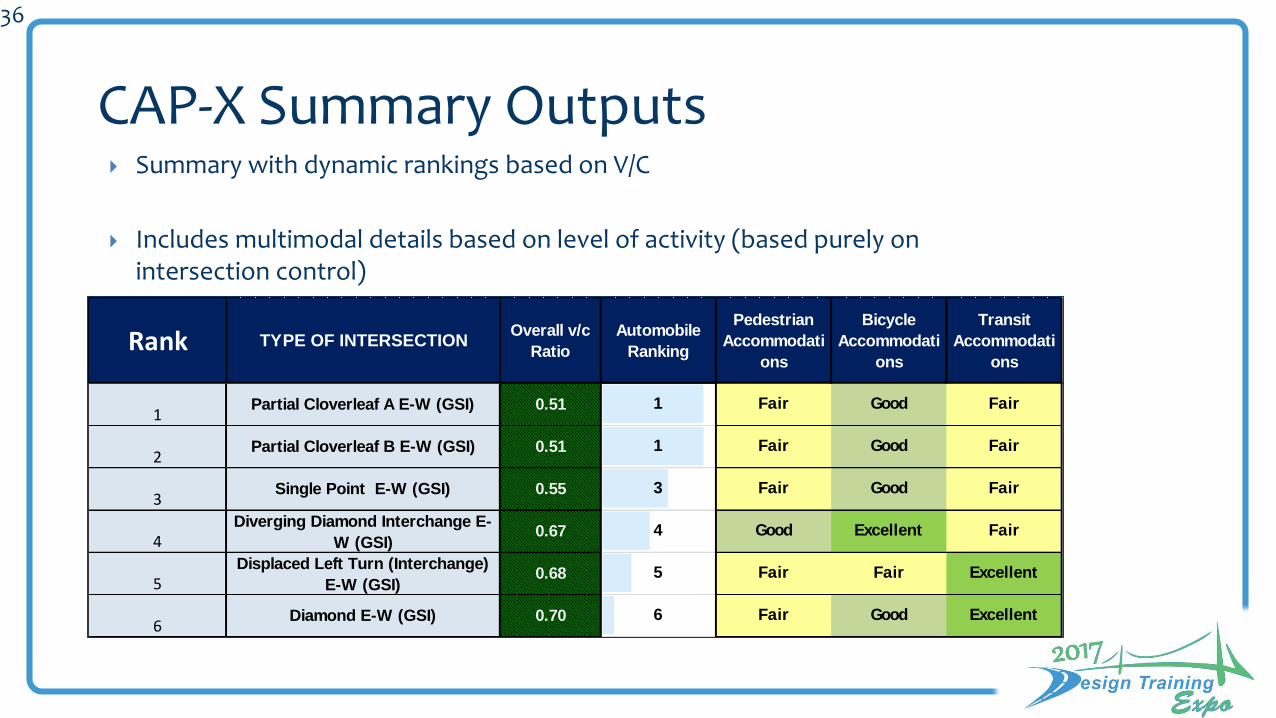
CAP-X Summary Outputs
Rank
2
3
1
4
5
6
Overall v/c
Ratio
Automobile
Ranking
Pedestrian
Accommodati
ons
Bicycle
Accommodati
ons
0.67 4 Good Excellent
0.51
0.51
0.55 3 Fair Good
TYPE OF INTERSECTION
Partial Cloverleaf A E-W (GSI)
Partial Cloverleaf B E-W (GSI)
Single Point E-W (GSI)
Diverging Diamond Interchange E-
W (GSI)
Transit
Accommodati
ons
1 Fair Good Fair
Fair1 Fair Good
Displaced Left Turn (Interchange)
E-W (GSI)0.68 5 Fair
Fair
Fair Excellent
Good ExcellentFairDiamond E-W (GSI) 0.70 6
Fair
Summary with dynamic rankings based on V/C
Includes multimodal details based on level of activity (based purely on intersection control)
37
ICE Tools

38
Vision and Need for the SPICE Tool
Safety comparisons of intersections becoming more common – ICE, increased use of HSM in general, etc.
FHWA recognizes everyone is struggling with them
Which CMF is right?
What should the CMF be applied to (existing, another alt, etc.)?
Simple tool needed for safety comparisons only
Same level of effort as CAP-X

39
SPICE Tool Capabilities
Performs predictive safety analysis of at-grade intersection forms/control types and ramp terminal intersections Implements the methodologies of the Highway Safety Manual (HSM)
Developed with goal to be user-friendly Only requires data inputs readily available to the analyst Option to conduct planning level analysis
Allows simultaneous evaluation of multiple forms and control types
Tool will work for vast majority of intersections
Development of FHWA tool ongoing
Preliminary FDOT version scheduled for Summer 2017

40
SPICE Tool

41
SPICE – Introduction
Introduction
The Safety Performance for Intersection Control Evaluation (SPICE) Tool was developed to provide an
easy-to-use tool that automates the predictive safety analysis of intersections. This tool will allow
analysts conducting Intersection Control Evaluations (ICE) to be equipped with necessary safety
information during the decision-making process, without having to research a myriad of crash
modification factors (CMFs) and Safety Performance Functions (SPFs) in multiple sources. The SPICE
tool will perform a comparative predictive safety analysis of different intersection control strategies.
The results – crash frequency and severity for each alternative – will then enable safety performance
of alternatives to be considered quantitatively like traffic operations, construction cost, maintenance
cost, or other factors.
Maintenance
Version: SPICE Tool 1.0 Required data entry field
Maintained By: TBD Optional data entry field
Contact Information: TBD Planning-Level Default Input
Disclaimer Data entry field not used
Disclaimers may be added, if needed.
Input Legend
The SPICE Tool performs safety analysis of at-grade intersection forms/control types and ramp terminal
intersections of diamond interchanges. This user-friendly tool requires only data inputs that are readily
available to the analyst. In addition, the SPICE tool has an option to conduct planning level analysis,
where the tool assumes default values for data inputs that are challenging to obtain in the early stages
of a project and/or have a very minor impact on the results. The SPICE tool assumes that certain
attributes of the intersection – AADT, facility type, and number of legs – are the same for all alternatives.
If they are not, users will be required to use the tool twice to get results. The tool will not allow
simultaneous evaluation of at-grade intersections and ramp terminal intersections. For projects where
analysis of both intersections and interchanges is needed, users are required use the tool twice to get
results.
Federal Highway Administration (FHWA)
Safety Performance for Intersection Control Evaluation Tool
Overview
Project Information: Provide general project information for reference purposes only.
Worksheets
Alternative Selection: Specify the number of alternatives being considered and the intersection control of each alternative.
Predictive Inputs: Provide inputs needed to compute and apply Part C CMFs.
Calibration: Input optional override values for SPF calibration factors from locally-developed or updated information.
Results: Summary of opening year and (if applicable) design year and total project life cycle crash frequency and crash severity.
Additional Worksheets: Additional worksheets to support the underlying Macros. Not to be updated by users unless updating future tool versions.
42
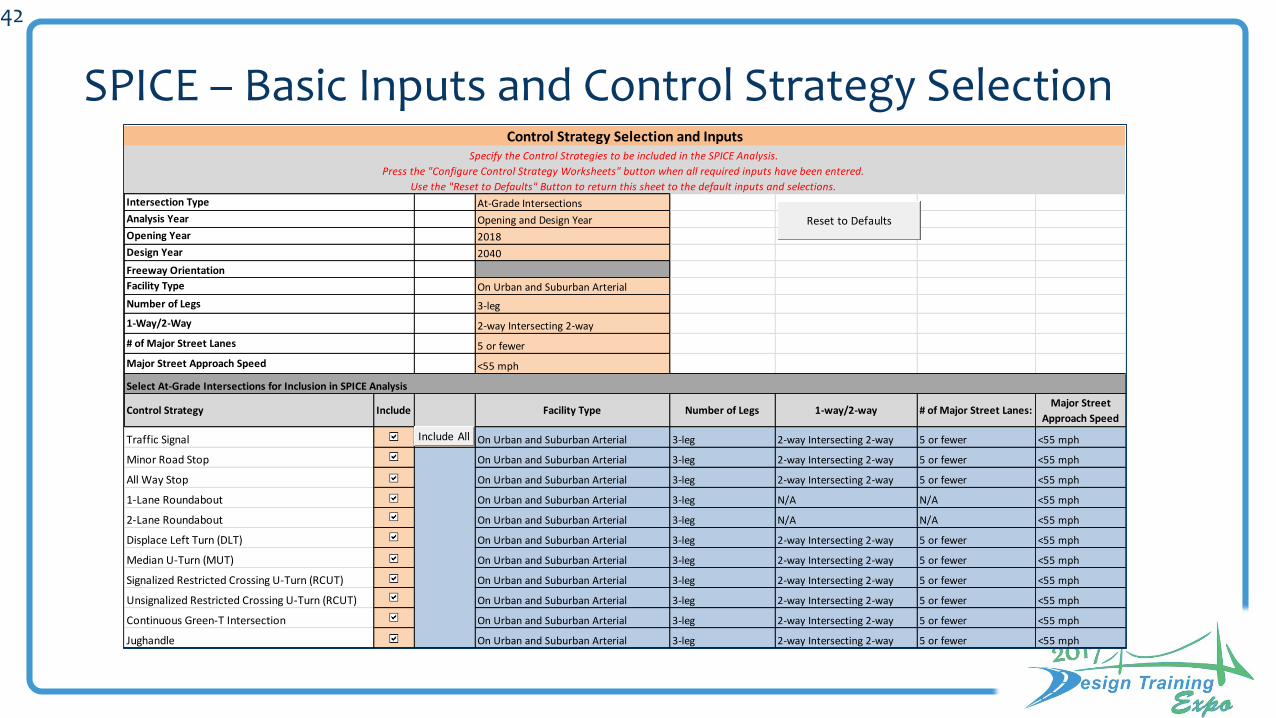
SPICE – Basic Inputs and Control Strategy Selection
At-Grade Intersections
Opening and Design Year
2018
2040
North-South
On Urban and Suburban Arterial
3-leg
2-way Intersecting 2-way
5 or fewer
<55 mph
Control Strategy Include Facility Type Number of Legs 1-way/2-way # of Major Street Lanes:Major Street
Approach Speed
Traffic Signal On Urban and Suburban Arterial 3-leg 2-way Intersecting 2-way 5 or fewer <55 mph
Minor Road Stop On Urban and Suburban Arterial 3-leg 2-way Intersecting 2-way 5 or fewer <55 mph
All Way Stop On Urban and Suburban Arterial 3-leg 2-way Intersecting 2-way 5 or fewer <55 mph
1-Lane Roundabout On Urban and Suburban Arterial 3-leg N/A N/A <55 mph
2-Lane Roundabout On Urban and Suburban Arterial 3-leg N/A N/A <55 mph
Displace Left Turn (DLT) On Urban and Suburban Arterial 3-leg 2-way Intersecting 2-way 5 or fewer <55 mph
Median U-Turn (MUT) On Urban and Suburban Arterial 3-leg 2-way Intersecting 2-way 5 or fewer <55 mph
Signalized Restricted Crossing U-Turn (RCUT) On Urban and Suburban Arterial 3-leg 2-way Intersecting 2-way 5 or fewer <55 mph
Unsignalized Restricted Crossing U-Turn (RCUT) On Urban and Suburban Arterial 3-leg 2-way Intersecting 2-way 5 or fewer <55 mph
Continuous Green-T Intersection On Urban and Suburban Arterial 3-leg 2-way Intersecting 2-way 5 or fewer <55 mph
Jughandle On Urban and Suburban Arterial 3-leg 2-way Intersecting 2-way 5 or fewer <55 mph
Specify the Control Strategies to be included in the SPICE Analysis.
Press the "Configure Control Strategy Worksheets" button when all required inputs have been entered.
Use the "Reset to Defaults" Button to return this sheet to the default inputs and selections.
Intersection Type
Analysis Year
Opening Year
Design Year
Freeway Orientation
Facility Type
Number of Legs
1-Way/2-Way
# of Major Street Lanes
Major Street Approach Speed
Select At-Grade Intersections for Inclusion in SPICE Analysis
Control Strategy Selection and Inputs
Include All
Reset to Defaults
43
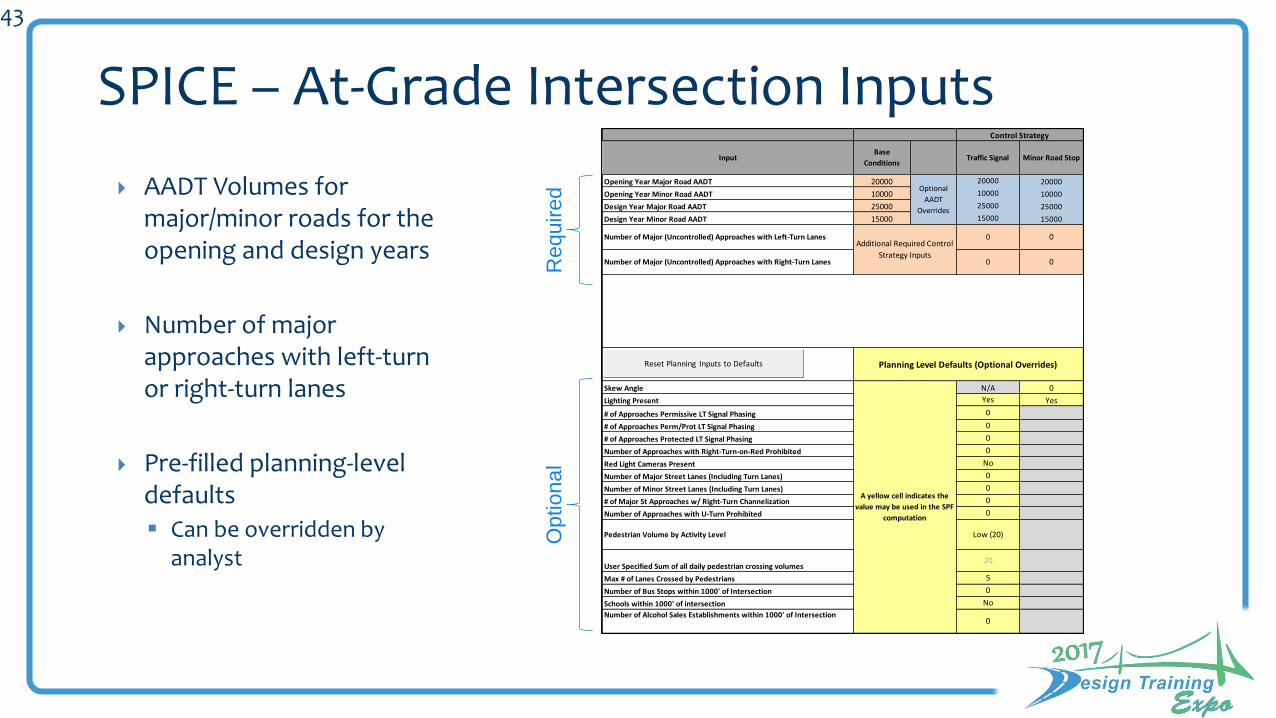
SPICE – At-Grade Intersection Inputs
AADT Volumes for major/minor roads for the opening and design years
Number of major approaches with left-turn or right-turn lanes
Pre-filled planning-level defaults
Can be overridden by analyst
Opening Year Major Road AADT 20000
Opening Year Minor Road AADT 10000
Design Year Major Road AADT 25000
Design Year Minor Road AADT 15000
Number of Major (Uncontrolled) Approaches with Left-Turn Lanes
Number of Major (Uncontrolled) Approaches with Right-Turn Lanes
Skew Angle
Lighting Present
# of Approaches Permissive LT Signal Phasing
# of Approaches Perm/Prot LT Signal Phasing
# of Approaches Protected LT Signal Phasing
Number of Approaches with Right-Turn-on-Red Prohibited
Red Light Cameras Present
Number of Major Street Lanes (Including Turn Lanes)
Number of Minor Street Lanes (Including Turn Lanes)
# of Major St Approaches w/ Right-Turn Channelization
Number of Approaches with U-Turn Prohibited
Pedestrian Volume by Activity Level
User Specified Sum of all daily pedestrian crossing volumes
Max # of Lanes Crossed by Pedestrians
Number of Bus Stops within 1000' of Intersection
Schools within 1000' of intersection
Number of Alcohol Sales Establishments within 1000' of Intersection
Control Strategy
Planning Level Defaults (Optional Overrides)
Additional Required Control
Strategy Inputs
0
No
N/A
0
0
No
0
0
0
0
N/A
0
N/A
0
20
5
N/A
N/A
N/A
InputBase
ConditionsMinor Road Stop
0
A yellow cell indicates the
value may be used in the SPF
computation
N/A
0
N/A
Yes
Optional
AADT
Overrides
20000
10000
25000
15000
Traffic Signal
20000
10000
25000
15000
0
0
0
0
0
Low (20)
No
0
Yes
N/A
Reset Planning Inputs to Defaults
Requir
ed
Optiona
l
44
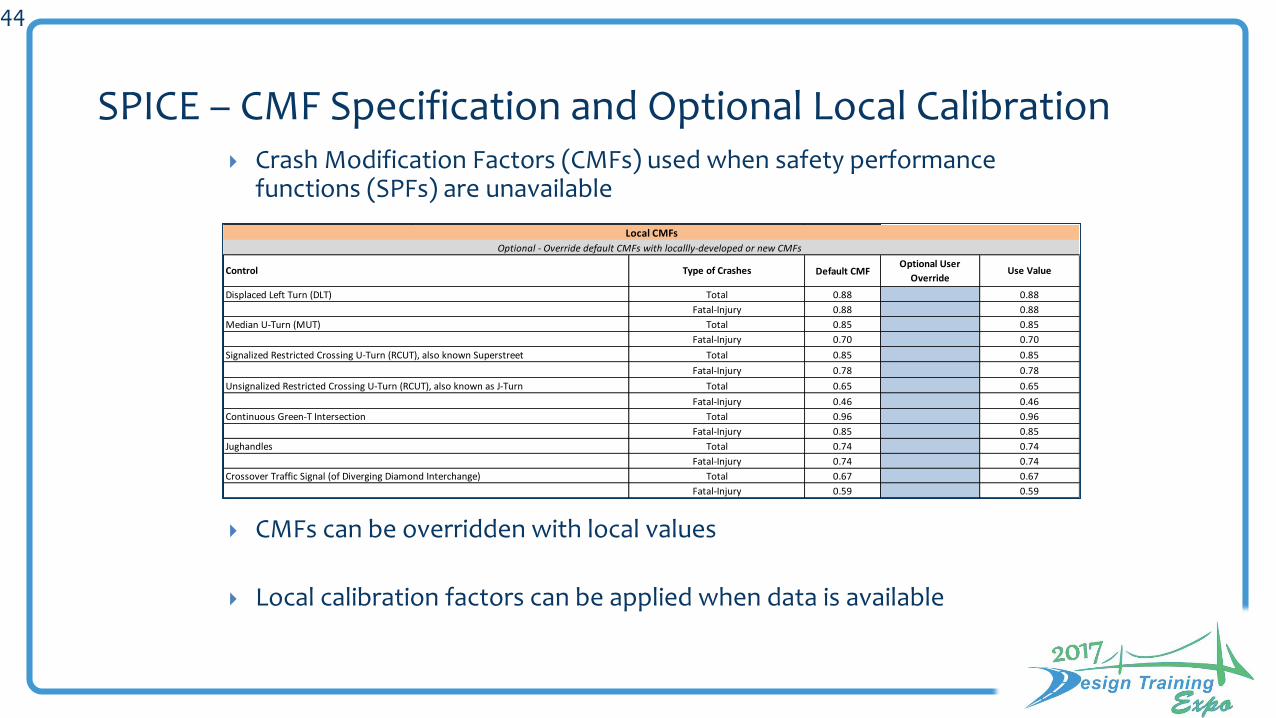
SPICE – CMF Specification and Optional Local Calibration Crash Modification Factors (CMFs) used when safety performance
functions (SPFs) are unavailable
CMFs can be overridden with local values
Local calibration factors can be applied when data is available
Default CMF
0.88
0.88
0.85
0.70
0.85
0.78
0.65
0.46
0.96
0.85
0.74
0.74
0.67
0.59
Optional - Override default CMFs with locallly-developed or new CMFs
Total
Total
Fatal-Injury
Total
Fatal-Injury
Fatal-Injury
Median U-Turn (MUT)
Signalized Restricted Crossing U-Turn (RCUT), also known Superstreet
Unsignalized Restricted Crossing U-Turn (RCUT), also known as J-Turn
Fatal-Injury
Continuous Green-T Intersection
Jughandles
Crossover Traffic Signal (of Diverging Diamond Interchange)
Total
Total
Total
Fatal-Injury
Fatal-Injury
Control
Displaced Left Turn (DLT)
Type of Crashes
Total
Fatal-Injury
Local CMFs
Use ValueOptional User
Override
0.74
0.74
0.67
0.88
0.88
0.85
0.70
0.85
0.59
0.85
0.78
0.65
0.46
0.96
45
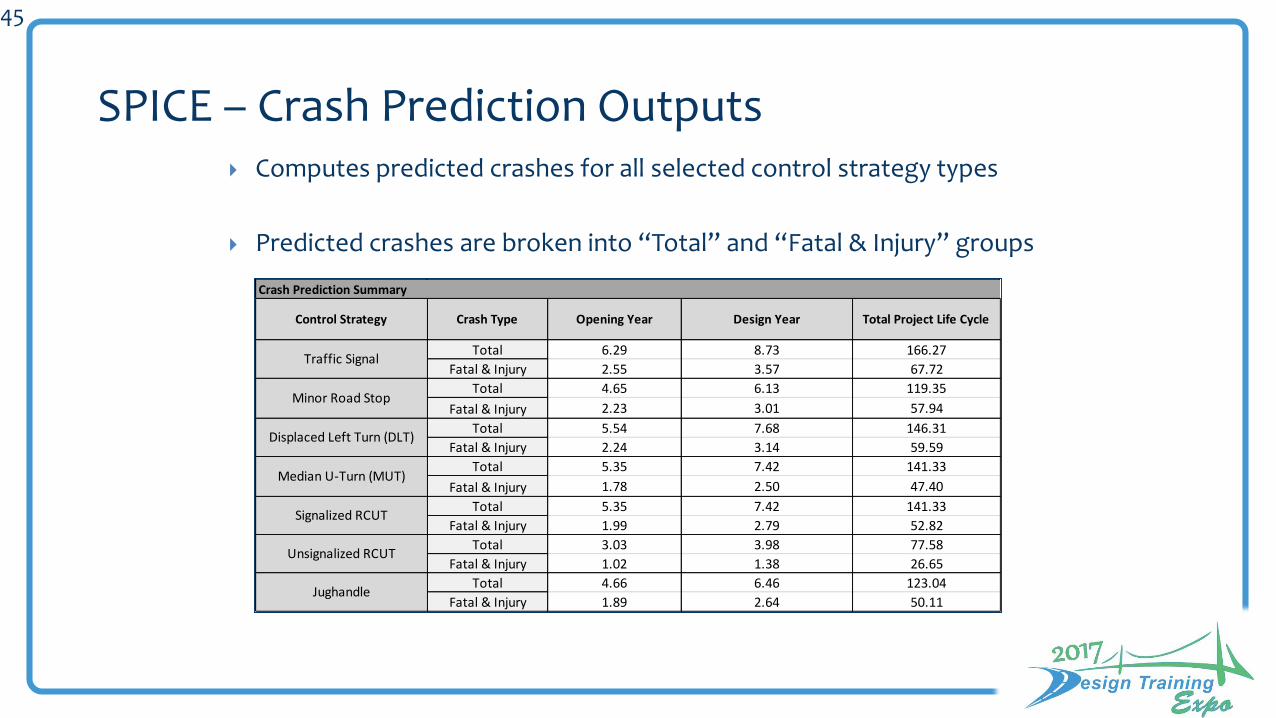
SPICE – Crash Prediction Outputs Computes predicted crashes for all selected control strategy types
Predicted crashes are broken into “Total” and “Fatal & Injury” groups
Control Strategy Crash Type Opening Year Design Year Total Project Life Cycle
Total 6.29 8.73 166.27
Fatal & Injury 2.55 3.57 67.72
Total 4.65 6.13 119.35
Fatal & Injury 2.23 3.01 57.94
Total 5.54 7.68 146.31
Fatal & Injury 2.24 3.14 59.59
Total 5.35 7.42 141.33
Fatal & Injury 1.78 2.50 47.40
Total 5.35 7.42 141.33
Fatal & Injury 1.99 2.79 52.82
Total 3.03 3.98 77.58
Fatal & Injury 1.02 1.38 26.65
Total 4.66 6.46 123.04
Fatal & Injury 1.89 2.64 50.11
Minor Road Stop
Crash Prediction Summary
Traffic Signal
Jughandle
Displaced Left Turn (DLT)
Median U-Turn (MUT)
Signalized RCUT
Unsignalized RCUT
46
ICE Procedure
47
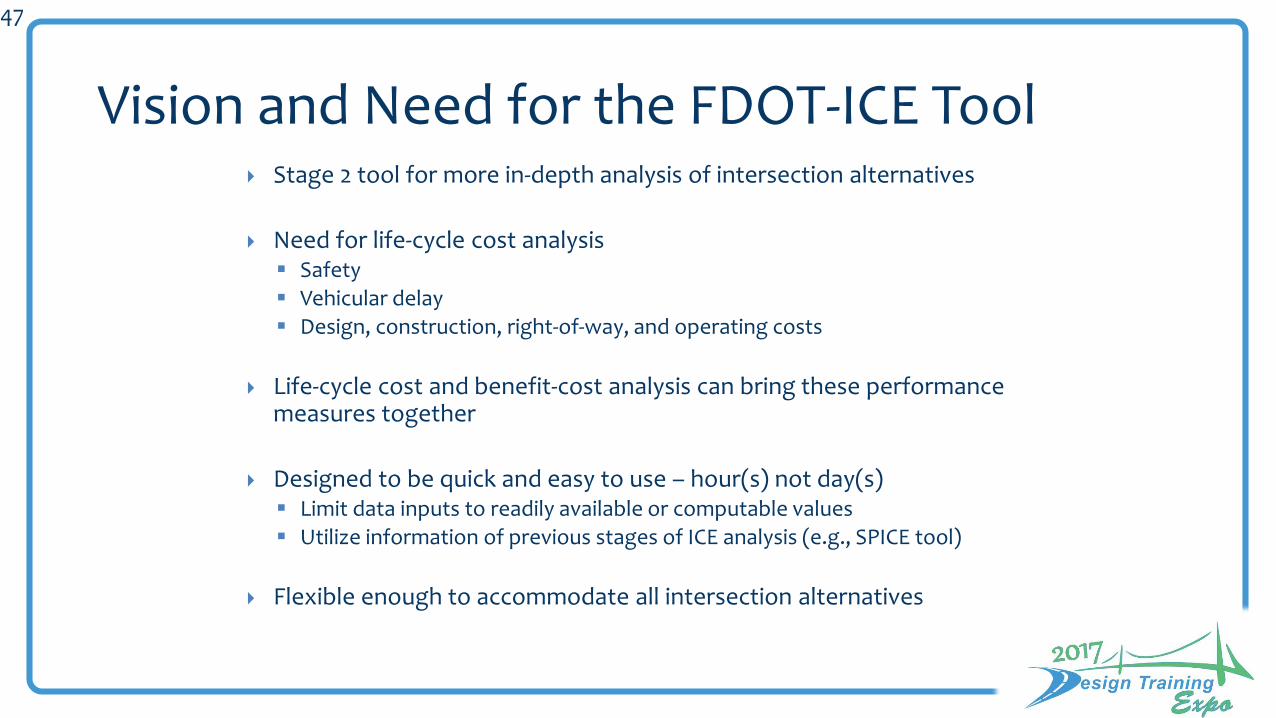
Vision and Need for the FDOT-ICE Tool Stage 2 tool for more in-depth analysis of intersection alternatives
Need for life-cycle cost analysis Safety
Vehicular delay
Design, construction, right-of-way, and operating costs
Life-cycle cost and benefit-cost analysis can bring these performance measures together
Designed to be quick and easy to use – hour(s) not day(s) Limit data inputs to readily available or computable values
Utilize information of previous stages of ICE analysis (e.g., SPICE tool)
Flexible enough to accommodate all intersection alternatives
48
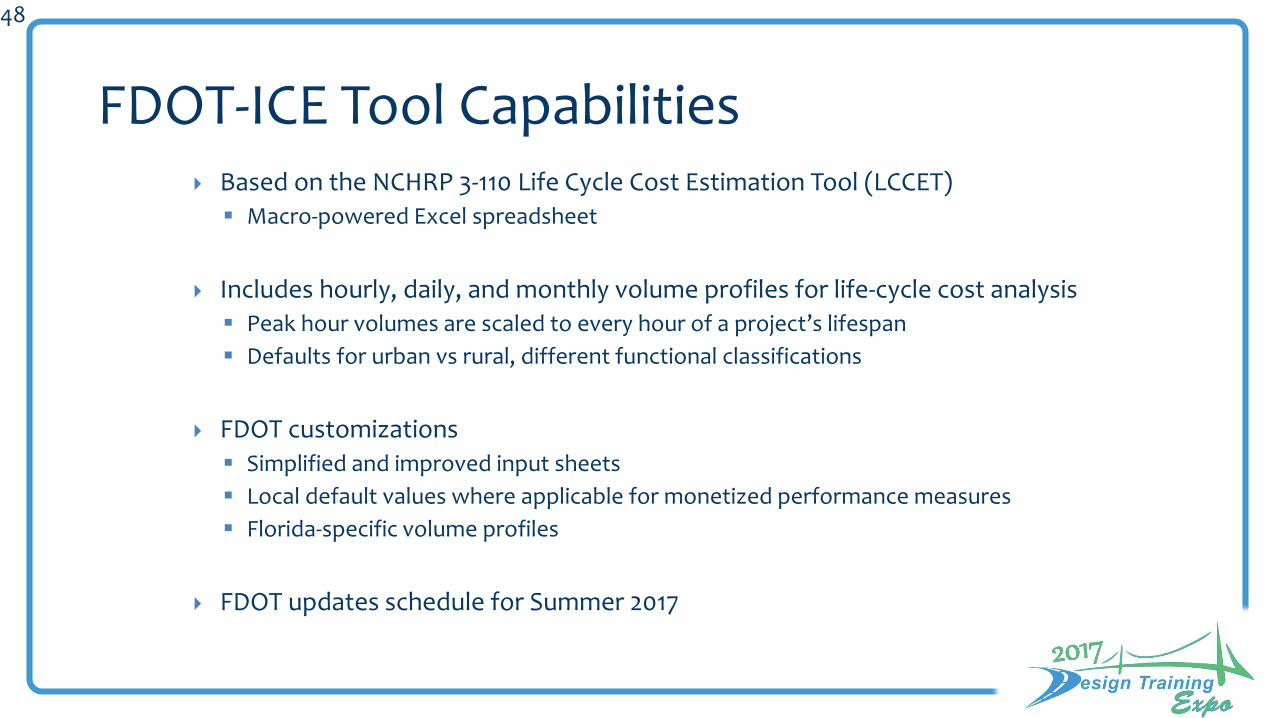
FDOT-ICE Tool Capabilities Based on the NCHRP 3-110 Life Cycle Cost Estimation Tool (LCCET)
Macro-powered Excel spreadsheet
Includes hourly, daily, and monthly volume profiles for life-cycle cost analysis
Peak hour volumes are scaled to every hour of a project’s lifespan
Defaults for urban vs rural, different functional classifications
FDOT customizations
Simplified and improved input sheets
Local default values where applicable for monetized performance measures
Florida-specific volume profiles
FDOT updates schedule for Summer 2017
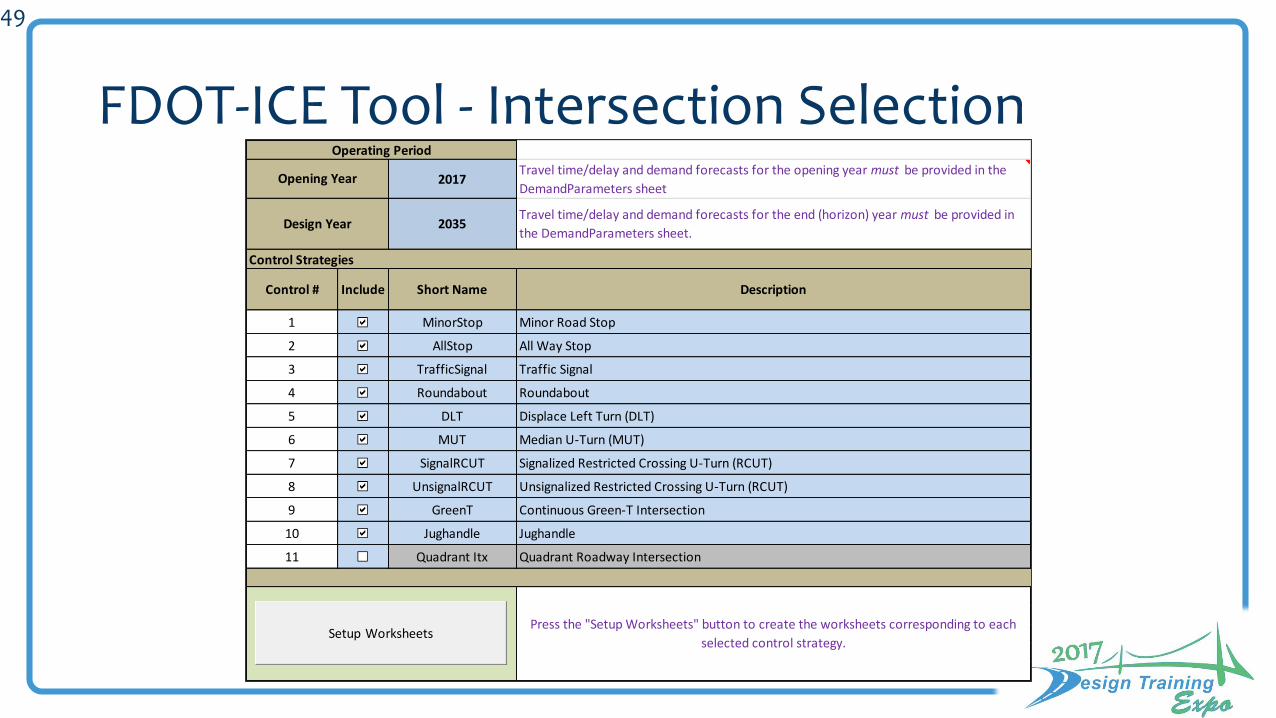
49
FDOT-ICE Tool - Intersection Selection2017
Travel time/delay and demand forecasts for the opening year must be provided in the
DemandParameters sheet
2035Travel time/delay and demand forecasts for the end (horizon) year must be provided in
the DemandParameters sheet.
Control Strategies
Control # Include Short Name Description
1 MinorStop Minor Road Stop
2 AllStop All Way Stop
3 TrafficSignal Traffic Signal
4 Roundabout Roundabout
5 DLT Displace Left Turn (DLT)
6 MUT Median U-Turn (MUT)
7 SignalRCUT Signalized Restricted Crossing U-Turn (RCUT)
8 UnsignalRCUT Unsignalized Restricted Crossing U-Turn (RCUT)
9 GreenT Continuous Green-T Intersection
10 Jughandle Jughandle
11 Quadrant Itx Quadrant Roadway Intersection
Press the "Setup Worksheets" button to create the worksheets corresponding to each
selected control strategy.
Operating Period
Opening Year
Design Year
Setup Worksheets
50
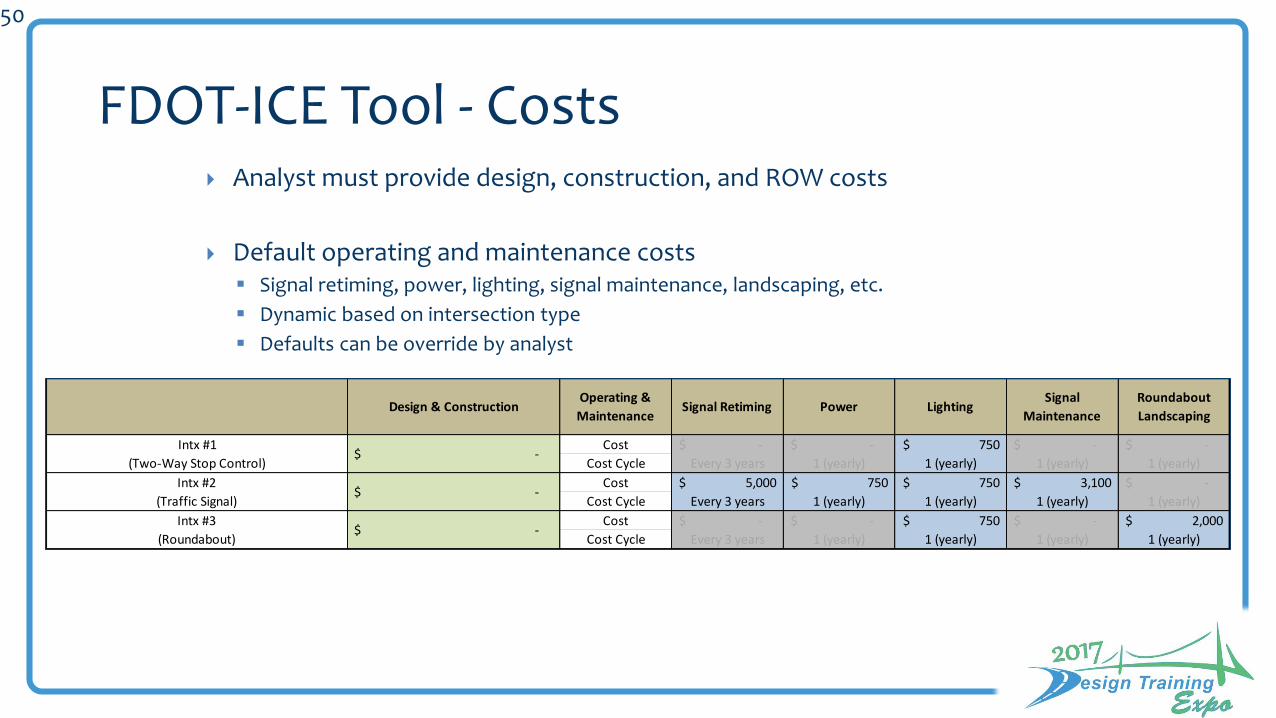
FDOT-ICE Tool - Costs
Cost -$ -$ 750$ -$ -$
Cost Cycle Every 3 years 1 (yearly) 1 (yearly) 1 (yearly) 1 (yearly)
Cost 5,000$ 750$ 750$ 3,100$ -$
Cost Cycle Every 3 years 1 (yearly) 1 (yearly) 1 (yearly) 1 (yearly)
Cost -$ -$ 750$ -$ 2,000$
Cost Cycle Every 3 years 1 (yearly) 1 (yearly) 1 (yearly) 1 (yearly)
-$
-$
-$
LightingSignal
Maintenance
Roundabout
Landscaping
Operating &
MaintenanceSignal Retiming PowerDesign & Construction
Intx #2
(Traffic Signal)
Intx #3
(Roundabout)
Intx #1
(Two-Way Stop Control)
Analyst must provide design, construction, and ROW costs
Default operating and maintenance costs Signal retiming, power, lighting, signal maintenance, landscaping, etc.
Dynamic based on intersection type
Defaults can be override by analyst
51
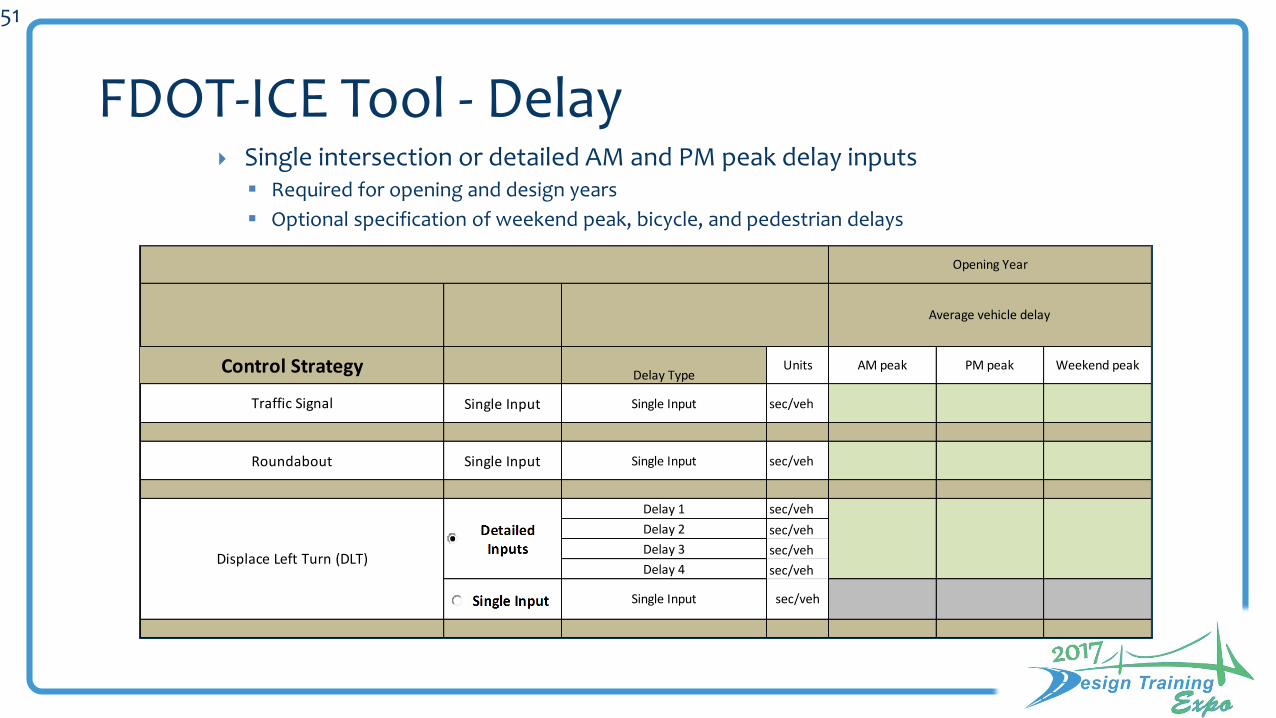
FDOT-ICE Tool - Delay
Single Input Single Input sec/veh
Roundabout Single Input Single Input sec/veh
Delay 1 sec/veh
Delay 2 sec/veh
Delay 3 sec/veh
Delay 4 sec/vehDisplace Left Turn (DLT)
Single Input
Delay TypeUnits AM peak PM peakControl Strategy
Average vehicle delay
Weekend peak
Opening Year
Traffic Signal
sec/veh
Single intersection or detailed AM and PM peak delay inputs Required for opening and design years
Optional specification of weekend peak, bicycle, and pedestrian delays
52
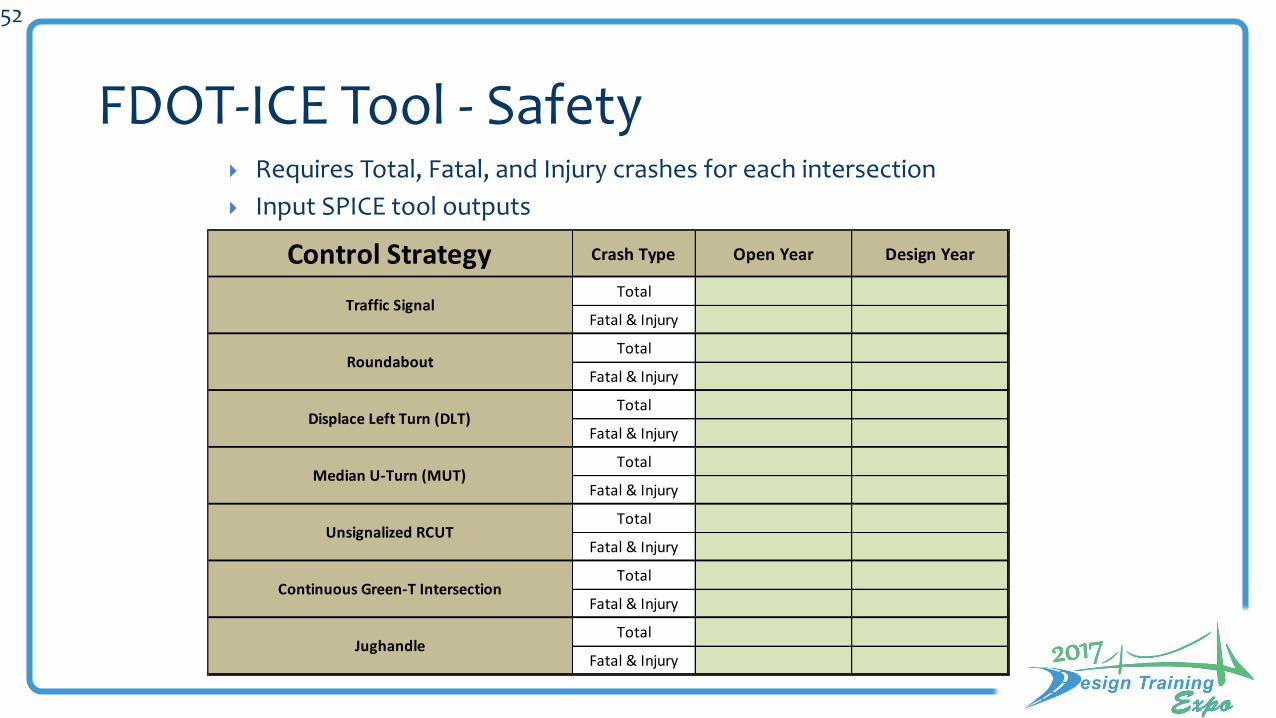
FDOT-ICE Tool - Safety
Total
Fatal & Injury
Total
Fatal & Injury
Total
Fatal & Injury
Total
Fatal & Injury
Total
Fatal & Injury
Total
Fatal & Injury
Total
Fatal & Injury
Unsignalized RCUT
Continuous Green-T Intersection
Jughandle
Roundabout
Displace Left Turn (DLT)
Median U-Turn (MUT)
Control Strategy Crash Type Open Year Design Year
Traffic Signal
Requires Total, Fatal, and Injury crashes for each intersection
Input SPICE tool outputs
53
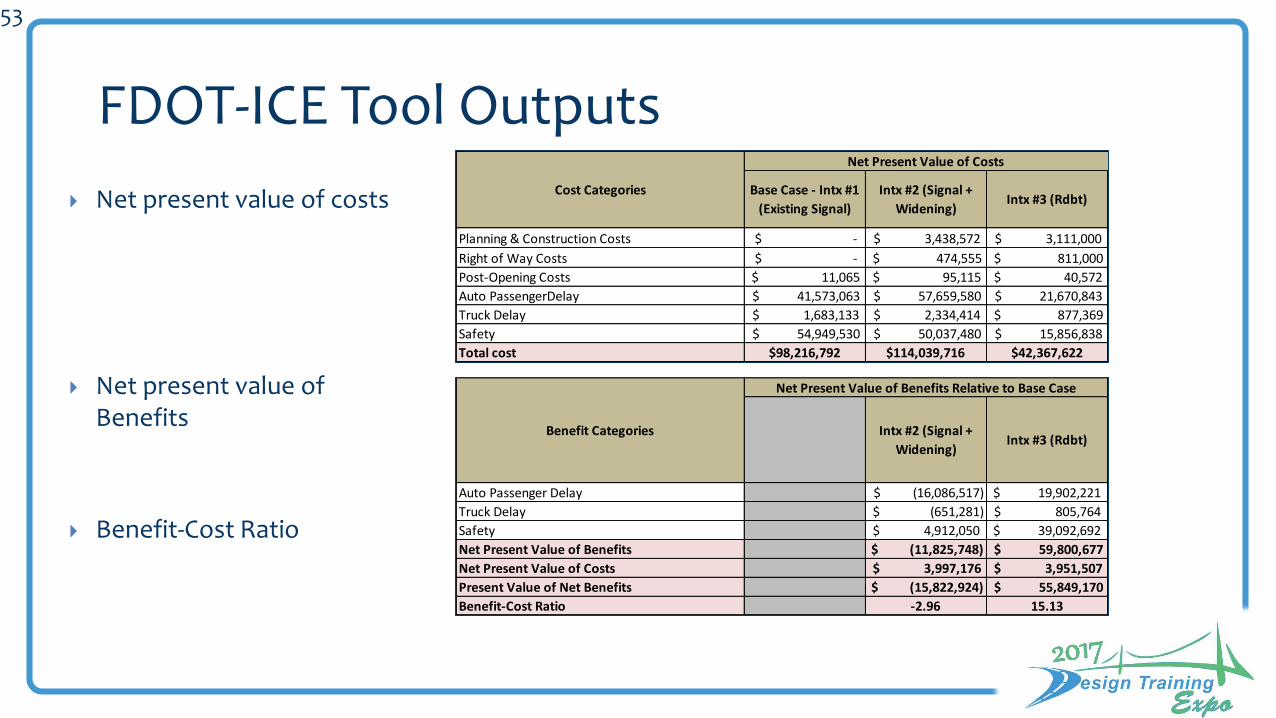
FDOT-ICE Tool Outputs
Net present value of costs
Net present value of Benefits
Benefit-Cost Ratio
Intx #2 (Signal +
Widening)Intx #3 (Rdbt)
Auto Passenger Delay (16,086,517)$ 19,902,221$
Truck Delay (651,281)$ 805,764$
Safety 4,912,050$ 39,092,692$
Net Present Value of Benefits $ (11,825,748) $ 59,800,677
Net Present Value of Costs $ 3,997,176 $ 3,951,507
Present Value of Net Benefits $ (15,822,924) $ 55,849,170
Benefit-Cost Ratio -2.96 15.13
Benefit Categories
Net Present Value of Benefits Relative to Base Case
Base Case - Intx #1
(Existing Signal)
Intx #2 (Signal +
Widening)Intx #3 (Rdbt)
Planning & Construction Costs $ - $ 3,438,572 $ 3,111,000
Right of Way Costs $ - $ 474,555 $ 811,000
Post-Opening Costs $ 11,065 $ 95,115 $ 40,572
Auto PassengerDelay $ 41,573,063 $ 57,659,580 $ 21,670,843
Truck Delay $ 1,683,133 $ 2,334,414 $ 877,369
Safety $ 54,949,530 $ 50,037,480 $ 15,856,838
Total cost $98,216,792 $114,039,716 $42,367,622
Net Present Value of Costs
Cost Categories
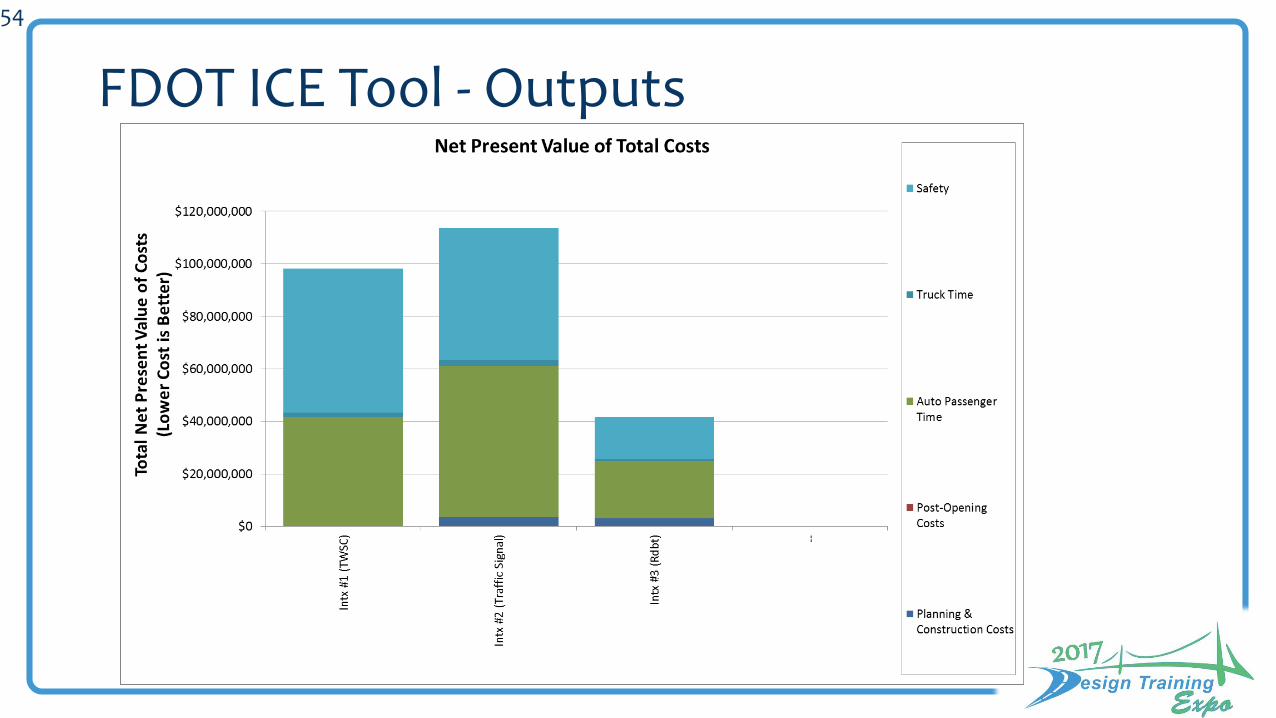
54
FDOT ICE Tool - Outputs
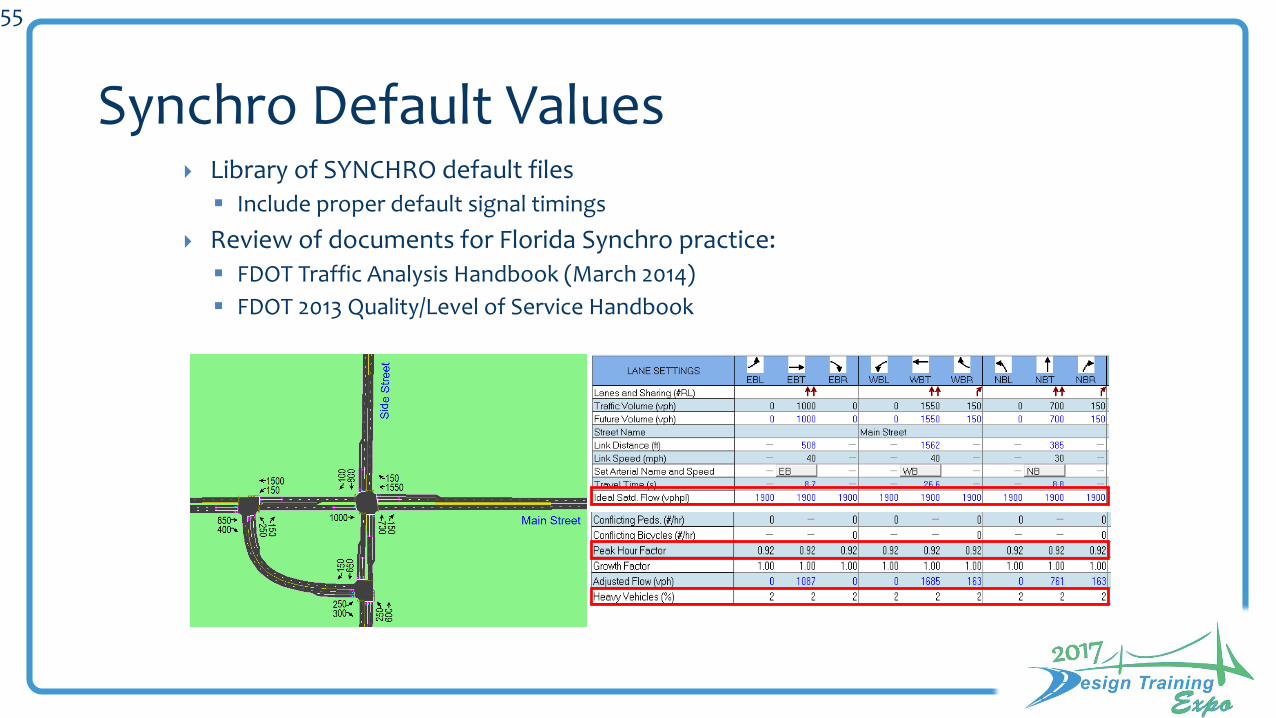
55
Synchro Default Values Library of SYNCHRO default files
Include proper default signal timings
Review of documents for Florida Synchro practice:
FDOT Traffic Analysis Handbook (March 2014)
FDOT 2013 Quality/Level of Service Handbook
56
Florida Specific Synchro Parameters
• Review of documents for Florida Synchro practice: FDOT Traffic Analysis Handbook (March 2014) FDOT 2013 Quality/Level of Service Handbook
Default PHF is 0.95 for urban areas and 0.92 for other areas
Base saturation flow rate is 1,950 passenger cars per hour per lane (pchpl)
Allowed to use lane utilization factor of 1.0 if intersection is near or at capacity
No directions on heavy vehicle proportion or critical gap time
57
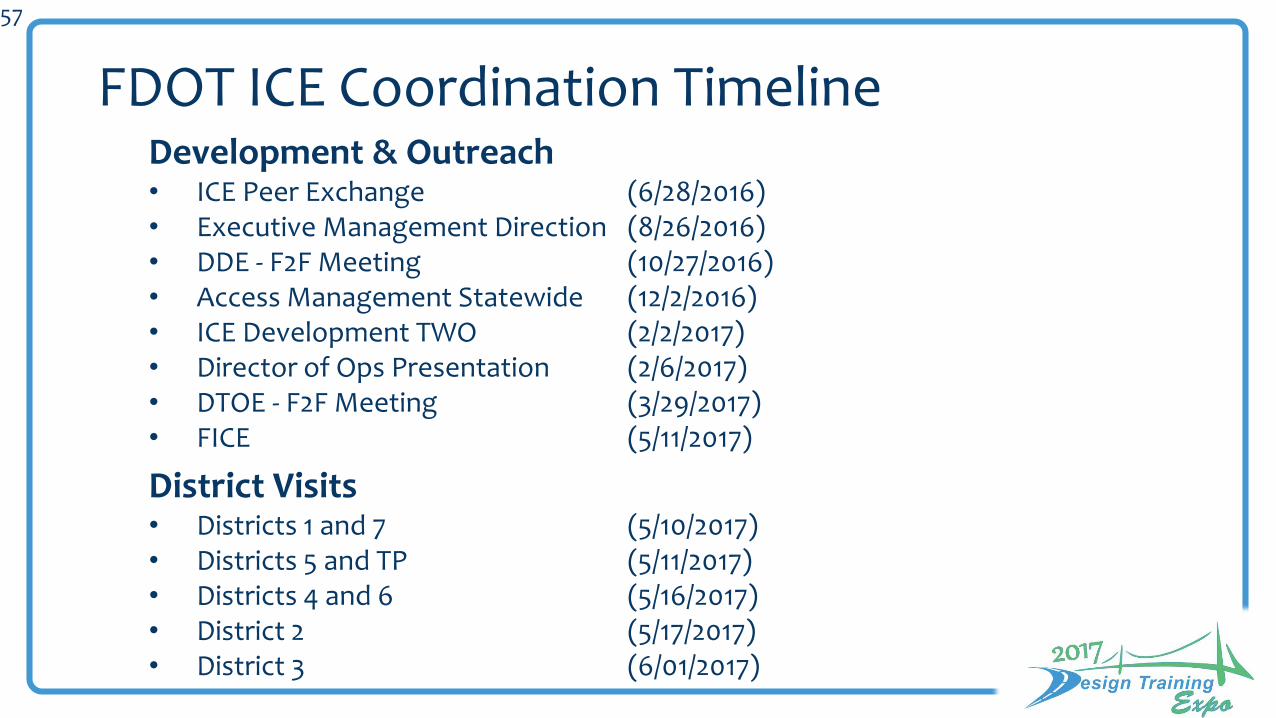
FDOT ICE Coordination TimelineDevelopment & Outreach• ICE Peer Exchange (6/28/2016)• Executive Management Direction (8/26/2016)• DDE - F2F Meeting (10/27/2016)• Access Management Statewide (12/2/2016)• ICE Development TWO (2/2/2017)• Director of Ops Presentation (2/6/2017)• DTOE - F2F Meeting (3/29/2017)• FICE (5/11/2017)
District Visits• Districts 1 and 7 (5/10/2017)• Districts 5 and TP (5/11/2017)• Districts 4 and 6 (5/16/2017)• District 2 (5/17/2017) • District 3 (6/01/2017)

Discussion & Questions
58


