arXiv:astro-ph/0505625v1 31 May 2005 Astronomy & Astrophysics manuscript no. 2370paper January 23, 2018 (DOI: will be inserted by hand later) Intra-night Optical Variability of Luminous Radio Quiet QSOs A. C. Gupta 1,2,3 , & U. C. Joshi 2 1 Harish-Chandra Research Institute, Chhatnag Road, Jhunsi, Allahabad - 211 019, India 2 Astronomy and Astrophysics Division, Physical Research Laboratory, Navrangpura, Ahmedabad - 380 009, India 3 Tata Institute of Fundamental Research, Homi Bhabha Road, Colaba, Mumbai - 400 005, India (present address) email: [email protected], [email protected]Received; Accepted Abstract. In the present paper we report the detection of intra-night variability in some of the radio-quiet quasi-stellar objects (RQQSOs) and one lobe dominated radio-loud quasi-stellar object (LDQ). To study intra-night variability, we carried out photometric monitoring of seven RQQSOs and one LDQ in Johnson V-passband using 1.2 meter optical/IR telescope at Gurushikhar, Mount Abu, India. Observations were made in nine nights during the first half of the year 2000; seven RQQSOs: 0748+291, 0945+438, 1017+280, 1029+329, 1101+319, 1225+317, 1252+020 and one LDQ: 1103-006 were observed. RQQSOs 0748+291, 1225+317 and LDQ 1103-006 have shown existence of intra-night variations. In the case of 1017+280 (RQQSO) there is indication of intra-night variation in one night where as the observations in another night do not show convincingly the existence of intra-night variability. RQQSOs 0945+438, 1029+329, 1101+319 and 1252+020 have not shown any intra-night variations. We compiled intra-night variability data for radio-loud and radio-quiet AGNs from the literature for statistical analysis. It is found that a good fraction of radio-quiet AGNs show intra-night variations with the maximum amplitude of variation being about 10%. On the other hand blazars show at times intra-night flux variability up to 100%. In case of radio-loud AGNs (excluding blazars), maximum amplitude of intra-night variation lies between the variability amplitude of radio-quiet AGNs and blazars i.e. the flux variation is close to 50%. The results indicate that the energy generation mechanism and the environment around the central engine in different classes of AGNs may be similar, if not identical. The standard model for radio-loud AGNs, where shocks are propagating down relativistic jet or models based on disturbances in accretion disks can also explain the micro-variability in RQQSOs. Key words. galaxies: active: optical: observations - radio-quiet quasi-stellar objects: general 1. Introduction There is a general consensus on the dichotomy of quasar population: radio-loud (R > 10) and radio-quiet (R < 10) (where R is the ratio of radio (6 cm) to the optical (440 nm) flux densities) (Kellerman et al. 1989). It is found that ∼ 10-15 % of the quasars are in the radio-loud category. There is an additional distinction between radio-loud and radio-quiet AGNs: radio-loud sources occur in elliptical galaxies and radio-quiet are found to reside in galaxies dominated by disk. Flux variability is a common property of AGNs. Blazars, in particular, show variation in the complete elec- tromagnetic spectrum on all time scales ranging from min- utes to years (e.g. Miller et al. 1989; Quinn et al. 1996; Heidt & Wagner 1996; Catanese et al. 1997; Lamer & Wagner 1998; Fan & Lin 1999; Kataoka et al. 1999; Peng et al. 2000; Petry et al. 2000; Ghosh et al. 2000; Pursimo et Send offprint requests to : A. C. Gupta al. 2000; Fan et al. 2002; Gupta et al. 2002, 2004; Gupta & Joshi 2005; Sagar et al. 2004; Villata et al. 2004 and references therein). Variability time scales can broadly be divided into three classes: (i) flux variability in few minutes to few hours is generally known as micro-variability or intra-night variability or intra-day variability; (ii) time scales ranging from days to weeks can be classified as short term vari- ability; (iii) and the time scale ranging from months to years can be called as long term variability. The first report of micro-variability in AGNs can be found in Mathews & Sandage (1963), who observed a 0.04 mag change in 15 minutes in 3C48. Subsequent to this there are several reports on the detection of rapid flux variations in optical region in AGNs (Mathews & Sandage 1963; Oke 1967; Racine 1970; Angione 1971; Bertaud et al. 1973; Miller 1980). However, these results were not taken seriously as such small amplitude variations might be due to instrumental errors. First convincing case for
Transcript
arX
iv:a
stro
-ph/
0505
625v
1 3
1 M
ay 2
005
Astronomy & Astrophysics manuscript no. 2370paper January 23, 2018(DOI: will be inserted by hand later)
Intra-night Optical Variability of Luminous Radio Quiet QSOs
A. C. Gupta1,2,3, & U. C. Joshi2
1 Harish-Chandra Research Institute, Chhatnag Road, Jhunsi, Allahabad - 211 019, India2 Astronomy and Astrophysics Division, Physical Research Laboratory, Navrangpura, Ahmedabad - 380 009,India3 Tata Institute of Fundamental Research, Homi Bhabha Road, Colaba, Mumbai - 400 005, India (present address)email: [email protected], [email protected]
Received; Accepted
Abstract.
In the present paper we report the detection of intra-night variability in some of the radio-quiet quasi-stellar objects(RQQSOs) and one lobe dominated radio-loud quasi-stellar object (LDQ). To study intra-night variability, wecarried out photometric monitoring of seven RQQSOs and one LDQ in Johnson V-passband using 1.2 meteroptical/IR telescope at Gurushikhar, Mount Abu, India. Observations were made in nine nights during the firsthalf of the year 2000; seven RQQSOs: 0748+291, 0945+438, 1017+280, 1029+329, 1101+319, 1225+317, 1252+020and one LDQ: 1103-006 were observed. RQQSOs 0748+291, 1225+317 and LDQ 1103-006 have shown existenceof intra-night variations. In the case of 1017+280 (RQQSO) there is indication of intra-night variation in onenight where as the observations in another night do not show convincingly the existence of intra-night variability.RQQSOs 0945+438, 1029+329, 1101+319 and 1252+020 have not shown any intra-night variations. We compiledintra-night variability data for radio-loud and radio-quiet AGNs from the literature for statistical analysis. Itis found that a good fraction of radio-quiet AGNs show intra-night variations with the maximum amplitude ofvariation being about 10%. On the other hand blazars show at times intra-night flux variability up to 100%. In caseof radio-loud AGNs (excluding blazars), maximum amplitude of intra-night variation lies between the variabilityamplitude of radio-quiet AGNs and blazars i.e. the flux variation is close to 50%. The results indicate that theenergy generation mechanism and the environment around the central engine in different classes of AGNs may besimilar, if not identical. The standard model for radio-loud AGNs, where shocks are propagating down relativisticjet or models based on disturbances in accretion disks can also explain the micro-variability in RQQSOs.
There is a general consensus on the dichotomy of quasarpopulation: radio-loud (R > 10) and radio-quiet (R < 10)(where R is the ratio of radio (6 cm) to the optical (440nm) flux densities) (Kellerman et al. 1989). It is found that∼ 10−15 % of the quasars are in the radio-loud category.There is an additional distinction between radio-loud andradio-quiet AGNs: radio-loud sources occur in ellipticalgalaxies and radio-quiet are found to reside in galaxiesdominated by disk.
Flux variability is a common property of AGNs.Blazars, in particular, show variation in the complete elec-tromagnetic spectrum on all time scales ranging from min-utes to years (e.g. Miller et al. 1989; Quinn et al. 1996;Heidt & Wagner 1996; Catanese et al. 1997; Lamer &Wagner 1998; Fan & Lin 1999; Kataoka et al. 1999; Penget al. 2000; Petry et al. 2000; Ghosh et al. 2000; Pursimo et
Send offprint requests to: A. C. Gupta
al. 2000; Fan et al. 2002; Gupta et al. 2002, 2004; Gupta& Joshi 2005; Sagar et al. 2004; Villata et al. 2004 andreferences therein).
Variability time scales can broadly be divided intothree classes: (i) flux variability in few minutes to fewhours is generally known as micro-variability or intra-nightvariability or intra-day variability; (ii) time scales rangingfrom days to weeks can be classified as short term vari-ability; (iii) and the time scale ranging from months toyears can be called as long term variability.
The first report of micro-variability in AGNs can befound in Mathews & Sandage (1963), who observed a 0.04mag change in 15 minutes in 3C48. Subsequent to thisthere are several reports on the detection of rapid fluxvariations in optical region in AGNs (Mathews & Sandage1963; Oke 1967; Racine 1970; Angione 1971; Bertaud etal. 1973; Miller 1980). However, these results were nottaken seriously as such small amplitude variations mightbe due to instrumental errors. First convincing case for
2 A. C. Gupta1,2,3, & U. C. Joshi2: Variability of RQQSOs
optical micro-variability is reported for BL Lacertae us-ing CCD detector by Miller et al. (1989). Since then ex-tensive observations using CCD have led to unambigu-ous confirmation of optical micro-variability for a largenumber of blazars (e.g. Miller et al. 1989; Carini et al.1990; Carini & Miller 1992; Heidt & Wagner 1996; Nobleet al. 1997; Ghosh et al. 2000; Romero et al. 2002; Sagaret al. 2004; Gupta & Joshi 2005 and references therein).All blazars which exhibit micro-variations are found tobe radio-loud sources and it is believed that relativisticjet dominate their emission (Bregmann 1992). Presently,it is accepted that not only the blazars but many otherradio-loud quasars exhibit intra-night variations (Jang &Miller 1995, 1997; Wagner & Witzel 1995; de Diego etal. 1998; Romero et al. 1999; Stalin et al. 2004, 2005 andreferences therein). However, detection of intra-night vari-ations in radio-quiet AGNs has been elusive and little isknown about their intra-night variability. In recent pastthere have been attempts by several groups around theglobe to find the intra-night variability in different sub-classes of radio-quiet AGNs (Jang & Miller 1995, 1997;Anupama & Chokshi 1998; de Diego et al. 1998; Romeroet al. 1999; Petrucci et al. 1999; Gopal-Krishna et al. 2000,2003; Stalin et al. 2004, 2005). In most of the cases, thereports on micro-variability are not overwhelmingly con-vincing, though in a few RQQSOs intra-night peak-to-peak variation of ∼ 1% is reported (Gopal-Krishna et al.2003; Stalin et al. 2004, 2005). The results reported byvarious groups have in fact created some confusion on theintra-night variability in radio-quiet AGNs.
One of the important motivation to study variabilityin AGNs is to know the physical scales of the emitting re-gions. As it is quite difficult to resolve the nuclei of AGNswith the present day technology, a reasonable way to in-vestigate the structure and physical conditions near thenucleus is to study micro-variations of flux and degree ofpolarization. It is believed that radio-quiet AGNs eitherdo not have relativistic jet (Antonucci et al. 1990) or har-bor very weak jet (Miller et al. 1993; Kellermann et al.1994) and hence the effect of jet is expected to be negligi-ble. The presence of micro-variability in radio-quiet AGNsis, therefore, attributed to the disturbances on the accre-tion disk (e.g. hot spots or flaring). For radio-loud AGNs,both the shocked jet and disturbances on accretion diskmay be responsible for micro-variability. Therefore com-parison of micro-variations between radio-quiet and radio-loud AGNs could constrain some of the existing models.Micro-variability may be observed as discrete events oras part of a longer duration variation. The importance ofmicro-variability resides in the fact that, if it is intrinsicto the source, it provides limits on the size of the emittingregions, providing a powerful tool to investigate both thephysical structure of the central regions of AGNs and theprocesses responsible for the production of the extremeluminosities observed for these objects. The detection ofmicro-variability on a time scale of hours in radio-quietAGNs is considered to be a powerful discriminator be-
tween accretion disk and relativistic jet models of thesesources.
In the present study a sample of seven bright RQQSOsand one bright LDQ have been considered for the studyof micro-variations. Observations were carried out duringthe period January−April, 2000 (nine observing nights)and the results are reported in this paper.
The paper is structured as follows: section 2 presentsthe details about target selection criterion, in section 3we report observation and data reduction techniques, insection 4 results of the present work and statistical anal-ysis of the previous work are presented and in section 5conclusions are given.
2. Target Selection Criterion
The radio quiet QSOs and LDQ for the present study wereselected from the lists of Veron-Cetty & Veron (2001).Detailed information of the seven RQQSOs and one LDQand their dates of observations are listed in Table 1.Hubble constant H0 = 50 km s−1 Mpc−1 and q0 = 0.5are assumed for determining MV .
Simultaneous observation of the target source and afew comparison stars and the sky background allow toremove variations which may be due to fluctuations ineither atmospheric transparency or extinction. Therefore,RQQSOs and LDQ were selected for observation in sucha way as to have at least two comparison stars in the fieldof view of the camera with brightness comparable to thetarget source.
Carini et al. (1991) investigated whether a conspicuousgalaxy component produce variations due to fluctuationsin atmospheric seeing or transparency which are not in-trinsic to the source. They showed that even for sourceswith significant underlying galaxy components, any spu-rious variations introduced by fluctuations in atmosphericseeing or transparency are typically smaller than the ob-servational uncertainties. To further reduce this effect, wehave selected sources which are optically bright (brighterthan MV < −24.4 mag) so that the fluctuations due tothe underlying galaxy are minimal. The modest opticalluminosities (MV > −24.4 mag) lie close to the criticalvalue below which the sources become like those of Seyfertgalaxies (Miller et al. 1990). At these lower levels of AGNto galactic light ratios, false indications of variability pro-duced by seeing variations that include different amountsof host galactic light within the photometric aperture, be-come very probable (Cellone et al. 2000).
In our sample all the sources are brighter than MV ≤
−24.4 (vide. Table 1) thus minimizing the seeing effects.The host galaxy is expected to contribute less than 10% tothe total flux of the luminous RQQSOs or the LDQ. Thehost galaxy is also expected to be encompassed within theaperture used for photometry.
A. C. Gupta1,2,3, & U. C. Joshi2: Variability of RQQSOs 3
Table 1. Complete log of V band observations of seven radio quiet QSOs and one lobe dominated quasars from 1.2meter Gurushikhar Telescope at Mount Abu, India
IAU Name∗ Other Name α2000.0 δ2000.0 z V MV Date of Data DurationObservations Points (hours)dd.mm.yyyy
CCD photometric monitoring of seven RQQSOs and oneLDQ were carried out in Johnson V-passband using athinned back illuminated Tektronix 1K × 1K CCD de-tector at f/13 Cassegrain focus of 1.2 meter GurushikharTelescope, Mount Abu, India. To improve signal to noiseratio (S/N), on CCD chip binning (2 × 2) was done whilereading out the array. One super pixel projected on the skycorresponds to 0.634 arcsec in both the dimensions. EntireCCD chip covers ∼ 5.4 × 5.4 arcmin2 of the sky. Read outnoise and gain of the CCD detector were 4 electrons and10 electrons/ADU respectively. Throughout the observingrun, typical average seeing (FWHM of stellar image) was∼ 1.5 arcsec ranging between 1.2 to 1.8 arcsec. Severalbias frames were taken intermittently in each observingnight and sky flats in V-passband were taken during thetwilight hours.
Image processing or initial processing (bias subtrac-tion, flat-fielding and cosmic rays removal), photomet-ric reduction or processing (getting instrumental magni-tudes of stars and target RQQSOs or LDQ in the im-age frames) were done at Physical Research Laboratory,Ahmedabad, India and at Harish-Chandra ResearchInstitute, Allahabad, India using IBM − 6000 RISC work-stations and Pentium III computers.
Table 2. Comparison star locations (relative to QSOs)
QSO Star 1 Star 2 Star 3∆r′′ PA0 ∆r′′ PA0 ∆r′′ PA0
Standard routines in the IRAF package were used forthe initial processing of the images. Median bias framesand flat-field images were constructed for each night whichwere used for bias and flat field correction. Instrumentalmagnitude of RQQSOs, LDQ and comparison stars inthe RQQSOs and LDQ fields were determined by usingDAOPHOT II software (Stetson 1987, 1992) and concen-tric aperture photometric technique. Aperture photome-try was done with several concentric aperture radii: 3.5,5.0, 7.0, 9.5 and 12.0 pixels. Though the data reduced withdifferent aperture radii are found to be in good agreement,aperture radius of 7 pixels gives the best S/N and there-fore the photometric magnitudes reported here are basedon that aperture radius. Stars in different frames of samesource were matched by using DAOMATCH routine inDAOPHOT II package. The differential magnitudes werecalculated for pairs of stars on the frame. Two comparisonstars (non variable during our observing run) were usedto generate the differential light curves of RQQSOs andLDQ. The positions of the comparison stars in RQQSOsand LDQ fields are listed in Table 2.
Simultaneous observations of the variable source anda few comparison stars and the sky background allow toremove variations which may be due to fluctuations in ei-ther the atmospheric transparency or the extinction. Onemay also find the gradual variation in differential mag-nitude as function of zenith distance if the colour of thetarget source and the comparison stars differ very much.The data reported here were obtained during the goodphotometric quality nights and also it was insured thatthe zenith angle for observations do not exceed 60◦. Thisreduces the colour dependence of differential magnitudeon zenith angle. Carini et al. (1992) examined the plotsof differential magnitude between comparison stars of dif-ferent colours versus airmass, and found that over a largerange of airmass, neither the overall photometric accuracywas affected significantly by the large colour difference inthe sets of comparison stars, nor did it introduce system-atic variations not intrinsic to the source. Also a closer
4 A. C. Gupta1,2,3, & U. C. Joshi2: Variability of RQQSOs
look at the data do not indicate any signature of colourdependence with zenith distance.
4. Results
4.1. Differential Light Curves (DLCs)
DLCs of seven RQQSOs and one LDQ which were ob-served during nine nights in the V passband are plottedin Figure 1−9. In the following, we discuss the criteriato test the existence of variability. We also mention herethat the individual bias corrected and flat fielded imagesof targets were examined carefully to see if there was anybackground variation after initial processing of the im-ages and image frames which showed gradual variation(say more than 2% end to end) in CCD response were re-jected. Lastly it is most important that the DLCs of anytarget should show good correlation so that there be nodoubt on the variability of the source.
4.2. Variability Detection Criterion
We have followed the method outlined by Howell et al.(1988) to detect objectively the presence or absence ofvariability at a particular confidence level (say 3σ orabove). In the present study, for analysis of each source,two comparison stars (s1 and s2) were used and DLCs weregenerated. We estimate rms error by fitting a straight lineto the DLC of comparison stars (comparison star - checkstar) (s1-s2) using the least square fit and estimate thedeviation of the data points from the fitted straight line.The mean value of the standard deviation has been usedas the measure of the observational error. The formal er-ror for each data point are substantially smaller than thestandard deviation (σ) of the comparison - check star dataand therefore is much more generous estimate of the trueobservational error than the formal errors (photon noise)detected by photometry software DAOPHOT II. In gen-eral the luminosity of the comparison stars is differentthan the target source. The value of the standard devia-tion estimated as above was scaled to the σ2
v−sby using
the equation (4) of Howell et al. (1988). The value of Γ2
was calculated using equation (13) in Howell et al. (1988)which is used to scale the σ2
s1−s2to get σ2
v−s. The scaled
value of σ2
v−s was then used to assess the confidence levelof variability.
4.3. Notes on different sources:
0748+294 (QJ 0751+2991)
This RQQSO, reported as the brightest new QSOin the first bright QSO survey (Gregg et al. 1996), wasmonitored on the night of February 14, 1999 in theoptical R band by Gopal-Krishna et al. (2000) to searchfor micro-variability. In the seven hours of continuousmonitoring of the source, they have reported spikes (ex-cursion of just one point) at two occasions and suggested
the possible existence of micro-variability in the source.Observations of this source in six nights with averagemonitoring (∼ 6.5 hours per night) in R passband isagain reported by Stalin et al. (2004) and they did notfind micro-variability in this source but spike of ∼ 2%brightness excursion was seen on one occasion. However,Stalin et al. (2004) monitored this source for more thanthree years (December 14, 1998 to December 25, 2001)and on the basis of the data they have reported theexistence of long term variation in the source.
16 17 18 19 20 21 22 23
0.7
0.6
0.51.2
1.1
1
0.6
0.5
0.4
Fig. 1. The V band light curve of 0748+294 on the nightof January 13, 2000.
We observed this source continuously for about eighthours (UT 15.669 to 23.336 hr) during the night ofJanuary 13, 2000; data sampling being about 5 pointsper hour and integration time for each frame being 500sec. DLCs were obtained with respect to two comparisonstars, both the comparison stars being brighter thanthe source. Both the DLCs (QSO - star1 and QSO -star2) for the source 0748+291 are plotted in Fig. 1which clearly indicate brightness variation of about 4%during the time UT 18.553 - 22.569 hr. As is clear fromFig. 1, the DLC for the comparison stars (star1 - star2)is quite steady whereas the DLCs for the source showappreciable variation during the period. To quantify thedegree of variation, we estimated the variance from theDLC for the comparison stars assuming that the starsremained steady during the observing run. A straightline was fitted to the data (∆ mag against UT) and thedeviations are estimated from the mean line. The rmsnoise (standard deviation) is estimated at 0.004 mag.This is scaled to the DLC of the (source - comparison)using the method stated above in section 4.2 and therms noise σ is estimated at 0.005 mag. During the periodUT 18.553 - 22.569 hr, rms variation of qso-comparisonsare respectively 0.014 and 0.013 for qso - s1 and qso -s2. Thus the variance for DLCs of qso is more than 6
A. C. Gupta1,2,3, & U. C. Joshi2: Variability of RQQSOs 5
σ. This indicates detection of genuine micro variationin the source. If we consider peak-to-peak variation (≈0.05 mag) in the DLC of qso - star1, the variation is ata level of 10 σ, which further support the existence ofmicro-variability in the source.
0945+438 (US 995)
Huang et al. (1990) studied the variability of thissource using the data taken from Palomar plates for theperiod 1978 to 1981 (∼ 3.5 year) and did not find anyvariability in the source. This source was also observedin near-infrared pass-bands (JHK
′
) during the periodFebruary 10, 1996 and December 27, 1997 by Enya etal. (2002) and they have reported the existence of longterm variation which they were interested in. Search formicro-variability in this source in optical bands was doneby different groups e.g. de Diego et al. (1998) in twonights, Stalin et al. (2004) in three nights, Stalin et al.(2005) in one night. de Diego et al. (1998) have reportedthe existence of micro-variability in the source but onother hand Stalin et al. (2004, 2005) did not find anyevidence of micro-variability. However, the existence oflong term variation in the source has been reported byStalin et al. (2004), the source has dimmed about 0.07mag during February 26, 2000 and January 23, 2001.
15 16 17 18 19 20
-0.1
-0.2
-0.3
-0.4
-0.5
-0.6
-0.2
-0.3
-0.4
Fig. 2. The V band light curve of 0945+438 on the nightof February 26, 2000.
We observed this source for more than 5 hours during(UT 15.125 - 20.458 hour) on the night of February 26,2000. Integration time for each frame was 300 seconds.The DLCs are shown in Fig. 2. There is a break inobservations during 18.9 - 20.2 hours UT due to someproblem in the control system of the telescope. DLCof comparison stars gives σ at 0.011 and scaled valueis 0.010. Standard variation of qso-comparisons arerespectively 0.011 and 0.018 for qso - s1 and qso - s2,
and hence the mean variance is less than 2 σ. The dataappear a bit noisy. Hence, the source has not shown anysignificant variation during the night.
1017+280 (Ton34)
Stalin et al. (2004) have monitored this source to lookfor the existence of micro-variability and their observa-tions in three nights in R-band did not show any clearevidence of micro-variability.
18 19 20 21 22 23 24
1.3
1.2
1.1
1.1
1
0.9
-0.1
-0.2
-0.3
Fig. 3. The V band light curve of 1017+280 on the nightof January 14, 2000.
15 16 17 18 19 20 21
1.3
1.2
1.1
0.9
0.8
0.7
-0.3
-0.4
-0.5
Fig. 4. The V band light curve of 1017+280 on the nightof February 27, 2000.
We observed this source on two nights, January 14and February 27, 2000, for continuous 6.5 and 6.0 hours
6 A. C. Gupta1,2,3, & U. C. Joshi2: Variability of RQQSOs
respectively. On January 14, 2000 integration time for eachimage frame was 400 seconds whereas it was 300 secondsfor the observing run on February 27, 2000. The DLCs areplotted in Fig. 3 and Fig. 4. During the night of January14, DLC of the comparisons is not stable during the periodUT 18.003 - 21.586 hr, but later on it is relatively stable.Hence, we consider only the data during the period of UT21.886 - 24.503 hr for further discussion. The standarddeviation of comparison stars is estimated at 0.006 mag,scaled value of σ for DLCs of the source is 0.008. Thestandard deviation for DLCs of qso - s1 and qso - s2 arerespectively 0.019 and 0.018. The mean variance for theDLCs of the source is more than 5 σ. This indicates thatthe source is showing variability during the specific periodof the night.
In the night of February 27, 2000, DLC of comparisonsis quite stable the σ value is estimated at ∼ 0.007, andscaled value for source DLC is 0.010. The standardvariations for DLCs of qso are 0.011 and 0.011. Hencethe variance is less than 2 σ. Therefore, no variation isdetected during the night.
1029+329 (CSO 50)
This source was observed earlier by other groups insix nights (Gopal-Krishna et al. 2003; Stalin et al. 2004,2005) and the existence of micro-variability has beenreported in two nights out of the six nights. However, nosignificant long term variation in the span of two yearsare reported.
16 17 18 19 20 21
0.4
0.3
0.2
0.5
0.4
0.3
0.2
0.1
0
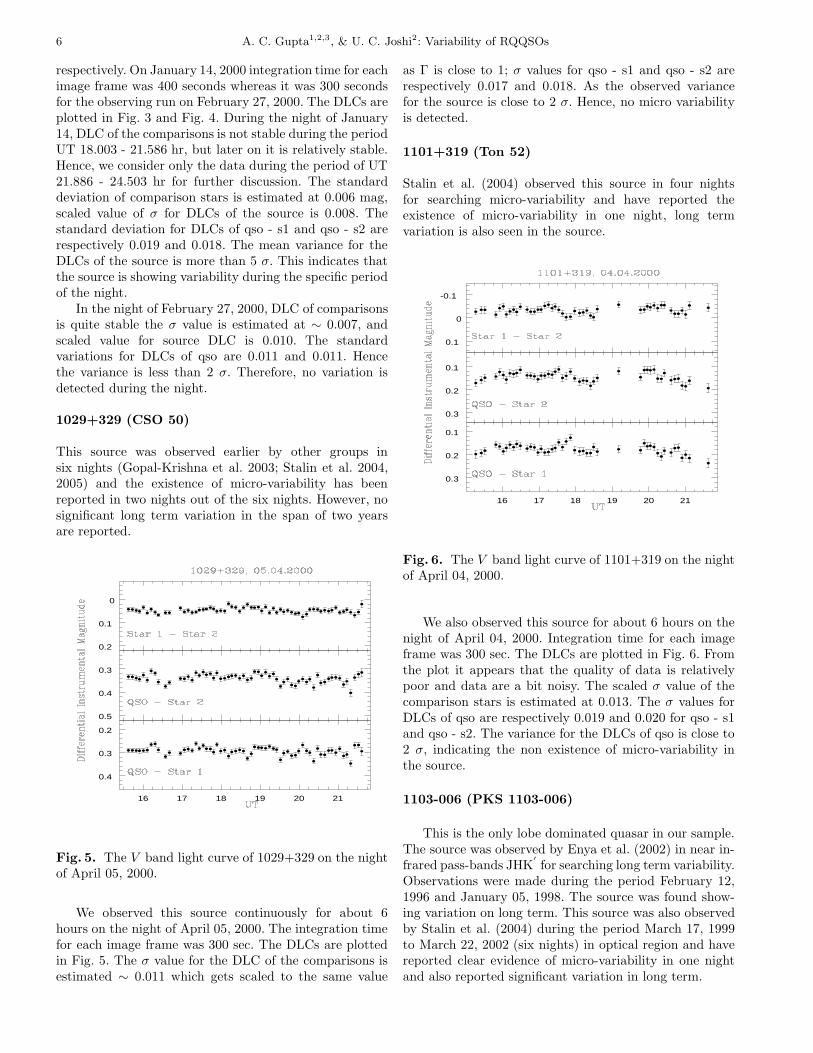
Fig. 5. The V band light curve of 1029+329 on the nightof April 05, 2000.
We observed this source continuously for about 6hours on the night of April 05, 2000. The integration timefor each image frame was 300 sec. The DLCs are plottedin Fig. 5. The σ value for the DLC of the comparisons isestimated ∼ 0.011 which gets scaled to the same value
as Γ is close to 1; σ values for qso - s1 and qso - s2 arerespectively 0.017 and 0.018. As the observed variancefor the source is close to 2 σ. Hence, no micro variabilityis detected.
1101+319 (Ton 52)
Stalin et al. (2004) observed this source in four nightsfor searching micro-variability and have reported theexistence of micro-variability in one night, long termvariation is also seen in the source.
16 17 18 19 20 21
0.3
0.2
0.1
0.3
0.2
0.1
0.1
0
-0.1
Fig. 6. The V band light curve of 1101+319 on the nightof April 04, 2000.
We also observed this source for about 6 hours on thenight of April 04, 2000. Integration time for each imageframe was 300 sec. The DLCs are plotted in Fig. 6. Fromthe plot it appears that the quality of data is relativelypoor and data are a bit noisy. The scaled σ value of thecomparison stars is estimated at 0.013. The σ values forDLCs of qso are respectively 0.019 and 0.020 for qso - s1and qso - s2. The variance for the DLCs of qso is close to2 σ, indicating the non existence of micro-variability inthe source.
1103-006 (PKS 1103-006)
This is the only lobe dominated quasar in our sample.The source was observed by Enya et al. (2002) in near in-frared pass-bands JHK
′
for searching long term variability.Observations were made during the period February 12,1996 and January 05, 1998. The source was found show-ing variation on long term. This source was also observedby Stalin et al. (2004) during the period March 17, 1999to March 22, 2002 (six nights) in optical region and havereported clear evidence of micro-variability in one nightand also reported significant variation in long term.
A. C. Gupta1,2,3, & U. C. Joshi2: Variability of RQQSOs 7
We observed this source for about 5.5 hours on thenight of April 06, 2000. Integration time for each imageframe was 300 sec. The DLCs are plotted in Figure 7.Scaled value of σ from the DLC of comparison stars is es-timated ∼ 0.015. From the DLCs of the source, the stan-dard deviations are 0.026 and 0.020 respectively for DLCsqso - s1 and qso - s2. Thus the variance for the source isabout 3 time the variance of the standards, indicating thepossible existence of intra-night variation.
16 17 18 19 20 21
0.9
0.8
0.7
1.9
1.8
1.7
1.1
1
0.9
Fig. 7. The V band light curve of 1103-006 on the nightof April 06, 2000.
1225+317 (b2 1225+317)
17 18 19 20 21 22 23
-0.2
-0.3
-0.4
1.5
1.4
1.3
1.8
1.7
1.6
Fig. 8. The V band light curve of 1225+317 on the nightof April 07, 2000.
There has been no systematic attempt earlier to studythis source for micro-variability. We monitored this sourcefor about six hours (UT 15.669 to 23.480 hr) during thenight of April 07, 2000. Integration time for each imageframe was 300 sec. DLCs are plotted in Fig. 8. The σ
value based on DLC of comparison stars is estimated at0.011 which scales to 0.008 for source DLCs. DLCs forthe source show standard deviation 0.016 and 0.012 forqso - s1 and qso - s2 respectively. The variance for theDLC of qso is thus close to 3 times the σ value, indicatingthe possible existence of micro variation. During theperiod UT 22.175 - 22.575 hr DLCs of qso - s1 and qso- s2 show brightness variation 0.081 mag and 0.094 magrespectively which is close to 10 σ level. Confirmation ofsuch events require further monitoring of the source withlarger S/N.
1252+020 (q 1252+020)
This source was observed for five nights during March 22,1999 to March 18, 2002 by Stalin et al. (2004). Source hasshown micro-variability in two nights and significant longterm variability is also reported.
This source was observed by us for about 3.5 hours inthe night of March 09, 2000. The DLCs are plotted in Fig.9. The standard deviation based on DLC of comparisonstars scaled to source DLC is estimated at 0.014. Standarddeviations for the DLCs of qso are respectively 0.014 and0.014 for qso-s1 and qso-s2, indicating the absence of microvariation in the source.
18 19 20 21
0.2
0.1
00.7
0.6
0.5
0.6
0.5
0.4
Fig. 9. The V band light curve of 1252+020 on the nightof March 09, 2000.
8 A. C. Gupta1,2,3, & U. C. Joshi2: Variability of RQQSOs
Table 3. Log of radio-quiet AGNs which were monitored by various researchers looking for intra-night variability inthe optical bands: column 1 - number of light curves (LCs) available; column 2, 3, 4 - number of LCs available for theduration indicated at the top of the respective columns. The numbers in the brackets indicate the number of eventswhen the source has been reported: non variable, possible variable, and variable respectively; column 5 - source of thedata (reference).
Ref. (1) Jang & Miller (1997); (2) Anupama & Chokshi (1998); (3) Romero et al. (1999); (4) Petrucci et al. (1999); (5)Gopal-Krishna et al. (2000); (6) Gopal-Krishna et al. (2003); (7) Stalin et al. (2004); (8) Stalin et al. (2005); (9) present study
4.4. Statistical Analysis of Intra-night OpticalVariability of Different Classes of AGNs
4.4.1. Radio-Quiet AGNs
During the last decade several groups have done extensivesearch for finding micro-variability in different subclassesof radio-quiet AGNs. The results based on the study madeby various researchers is described briefly in the following.
A sample of 19 radio-quiet AGNs was studied by Jang& Miller (1995, 1997) for searching micro-variability. Theypresented DLCs for RQQSOs Ton 951 and Ton 1057 whichshow up to ∼ 8% variation on time scale of an hour or so.However, both these sources are of the modest luminosity(MB > −24.3) and at these lower level of luminosity, falseindications of variability, due to varying seeing, cannotbe ruled out (Cellone et al. 2000). Jang & Miller (1995,1997) have reported 16% (3/19) sources showing micro-variability. Their statistical analysis show the existence ofvariability at confidence level of 99%.
de Diego et al. (1998) monitored a sample of 34 sources,equally distributed between radio-quiet and core domi-nated radio-loud QSOs. They observed pair of objectsfrom both the categories having reasonably matched red-shifts and luminosities. Based on the variability behavior,they claim that there is no difference in radio-loud andradio-quiet QSOs. However, their data is rather scanty aseach source was monitored only a few times per night andthere was no attempt to systematically monitor sourcescontinuously for a few hours (say for about three hoursor more). So, the data lacks the continuity of a lengthydata trains. We have not considered these results in thestatistical analysis in the present paper.
Rabbette et al. (1998) failed to detect intra-night vari-ability in a sample of 23 high-luminosity RQQSOs. Theirdetection threshold was ∼ 0.1 mag. Their data lacked the
Fig. 10. Histogram of observing runs on radio-quietAGNs. NV, PV and V denote the numbers of events thesources were detected: non variable, possible variable andvariable respectively.
continuity of a lengthy data trains and not used for sta-tistical analysis in the present paper.
Search for rapid optical variability in two broad-absorption line QSOs (BALQSOs) was conducted byAnupama & Chokshi (1998) and they have reported de-tection of significant variation in both the QSOs.
A. C. Gupta1,2,3, & U. C. Joshi2: Variability of RQQSOs 9
Romero et al. (1999) observed a sample of 23 south-ern AGNs in which eight were RQQSOs and rest werebelonging to the different subclasses of radio-loud AGNs.In their analysis, they used the scatter in the weighted av-erage of six comparison stars for estimating photometricerrors. None of their eight RQQSOs showed indicationsstrong enough to support the existence of of intra-nightvariability.
A micro-variability study of 22 Seyfert 1 galaxies(relatively weak, radio-quiet AGNs) have been done byPetrucci et al. (1999). Their error estimation methodis different from Romero et al. (1999). They took theweighted average of three or more comparison stars todefine a virtual standard star and used structure func-tion analysis to look for micro-variability in these sources.However, they did not find micro-variability in any sourcein their sample.
Gopal-Krishna et al. (2000) reported the results onmicro-variability in a sample of 16 RQQSOs. They found31% (5/16) to be probable or very probable micro-variable, 31% (5/16) RQQSOs showing spikes in theirDLCs and the rest 38% (6/16) sources being non variable.
Recently 49 intra-night variability light curves werepresented for 19 RQQSOs by Gopal-Krishna et al. (2003)and Stalin et al. (2004, 2005). They found peak-to-peakmicro-variation of ∼ 1% in 11 light curves of 8 RQQSOs.11 RQQSOs have not shown any intra-night variations.
To study the occurrence of micro-variability in radio-quite AGNs and their statistical behavior, we compiledthe data on variability of different subclasses of radio-quietAGNs from the literature, thus enlarging the data base.The statistics is expected to be more robust. The data arelisted in Table 3 and the statistics in the form of histogramis plotted in Fig. 10. We find nearly ∼ 10 % radio-quietAGNs show intra-night variations.
4.4.2. Radio-Loud AGNs (Non Blazars)
Study of micro-variability in optical wavebands of theradio-loud AGNs excluding blazars was carried out byseveral groups. First systematic search for optical micro-variations in radio-loud QSOs was carried out by Jang &Miller (1995, 1997). They monitored 11 radio-loud QSOsin 20 nights and found 10 sources showing variation in theflux at least in one night.
Romero et al. (1999) monitored a sample of 5 radio-loud QSOs in 7 nights. and found 3 radio-loud QSOs show-ing flux variation of ∼ 2.2 to 8% within a single night. Theother 2 radio-loud QSOs have not shown any significantvariations during the observing run of 4 nights.
Romero et al. (2002) have reported observations of 16EGRET radio-loud quasars (non blazars) in 33 nights dur-ing the period 1997 to 2000. Intra-night variations were re-ported for 12 nights in 7 radio-loud quasars. 9 radio-loudquasars have not shown any intra-night variations.
In a recent paper, Sagar et al. (2004) have reported ob-servations of 5 core dominated QSOs (CDQs) in 15 nights
Fig. 11. Histogram of observing runs on radio-loud AGNs(non blazars). NV, PV and V denote the numbers of eventsthe sources were detected: non variable, possible variableand variable respectively.
in R-band. They found one source showing variation in onenight and another source showed variation in all the threenights when observations were made. Rest three sourceshave not displayed any intra-night variations in the obser-vations of nine nights.
In another set of recent papers, Stalin et al. (2004,2005) have reported optical monitoring of 5 radio-loudAGNs in 40 nights and have reported intra-night varia-tions only in 11 nights and one source has shown a possibleintra-night variation on one night.
To investigate the general statistical behavior of micro-variability of radio-loud AGNs (excluding blazars), wecompiled the data on variability (based on various moni-toring program to study micro-variability) from literaturewhich is listed in Table 4. The data are plotted in theform of histogram in Fig. 11. We find that nearly ∼ 35-40% radio-loud AGNs (non-blazars) show intra-night varia-tions.
4.4.3. Radio-Loud AGNs (Blazars)
Study of optical micro-variability of radio-loud AGNs(blazars) was done by several groups. The pioneer workin blazars optical intra-night variability is by Miller etal. (1989), Carini (1990), Carini et al. (1990, 1991, 1992)and Carini & Miller (1992). First clear evidence of op-tical intra-night variability in BL Lacertae was reported
10 A. C. Gupta1,2,3, & U. C. Joshi2: Variability of RQQSOs
Table 4. Log of radio-loud AGNs (excluding blazars) which were monitored by various researchers looking for intra-night variability in the optical bands. Details on the columns are as given in Table 3.
No. of LCs Radio Loud AGNs Ref.(excluding Blazars)
(1) Jang & Miller (1995); (2) Jang & Miller (1997); (3) Romero et al. (1999); (4) Romero et al. (2002); (5) Sagar et al. (2004);(6) Stalin et al. (2004); (7) Stalin et al. (2005)
Table 5. Log of radio-loud AGNs (blazars) which were monitored by various researchers looking for intra-nightvariability in the optical bands. Details on the columns are as given in Table 3.
(1) Miller et al. (1989); (2) Carini et al. (1990); (3) Carini et al. (1991); (4) Carini et al. (1992); (5) Carini & Miller (1992); (6)Ghosh et al. (2001); (7) Romero et al. (2002); (8) Sagar et al. (2004); (9) Stalin et al. (2005)
by Miller et al. (1989). Carini et al. (1990) have observedblazar OQ 530 in 4 nights (April 1-4, 1988), the source hasshown micro-variability in all the four nights. Carini et al.(1991) observed the blazar AP Librae in nine nights duringMarch - May 1989. In three nights intra-night variabilitywere seen. Carini & Miller (1992) observed the blazar PKS2155-304 for continuous 4 nights (Sept. 25-28, 1988), andthe micro-variability is seen on all these four nights. Cariniet al. (1992) observed blazars OJ 287 and BL Lacertaefor eighteen and fourteen nights respectively during (Nov.1986 - March 1989). Out of 32 nights observations micro-variability is reported for 18 nights. Carini (1990), basedon the study of a sample of 20 blazars, reported that theprobability of seeing a significant micro-variability exceeds80% if a source is monitored continuously for more than8 hours.
Heidt & Wagner (1996) studied optical intra-nightvariability in a sample of 34 radio-selected BL Lac objectsfrom 1 Jy catalog. Observations were carried out duringJune 1990 to September 1993; each blazar was observed
in seven continuous nights, 3 times in each night withtime interval of 2 hours. In 28 out of 34 BL Lac objects(82%) intra-night variability was detected and 75% of thevariable BL Lacs changed significantly in time scale < 6hours. As this data lacks continuity of lengthy data trains,we have not considered these results in the statistical anal-ysis in the present paper.
About 140 intra-night light curves of a large sampleof blazars were generated in series of papers by Chinesegroup (ref. Bai et al. 1998, 1999; Dai et al. 2001; Xie etal. 1999, 2001, 2002, 2004; Fan et al. 2001, 2004; Qian& Tao 2004). Observations were made in more than twovisual pass-bands and in a particular night two or moreblazars were observed. All the blazars in the sample haveshown micro-variations in several nights. The data in thesepapers also lacks continuity of lengthy trains and hencenot considered for further discussion and the statisticalanalysis in the present paper.
Ghosh et al.(2001) have made observations on fiveblazars in seven nights during November 05, 1997 −
A. C. Gupta1,2,3, & U. C. Joshi2: Variability of RQQSOs 11
0
10
20
30
NV
PV
V
NV
PV
V
NV
PV
V
Fig. 12. Histogram of observing runs on radio-loudAGNs(blazars). NV, PV and V denote the numbers ofevents the sources were detected: non variable, possiblevariable and variable respectively.
December 29, 1998. Micro-variations were seen in fourblazars.
Romero et al.(2002) have reported observations of 4EGRET blazars in 24 nights during the period 1997 to2000. Intra-night variations were reported for 18 nights in3 blazars. One blazar was observed in 2 nights but has notshown any intra-night variations.
Sagar et al. (2004) and Stalin et al. (2005) have re-cently done an extensive search for intra-night optical vari-ability in blazars. They have observed nine BL Lac objectsin 35 nights. All the sources have shown intra-night vari-ations at least in one night observations. Out of 35 nightsobservations, intra-night variations are seen in 20 nights.
We compiled the data from the literature on micro-variability of blazars (based on monitoring of radio-loudAGNs (blazars)) to study the statistics. The data arelisted in Table 5 and presented in the form of histogramin Fig. 12. The data indicate that the events of occurrenceof micro-variation in blazars in time scale of less than 6hour are ∼ 60-65 %. If the blazar is observed for morethan 6 hour then the possibility of intra-night variabilitydetection is about 80-85 %.
5. Conclusions
The new observations of RQQSOs reported here indicateclear evidence of the existence of optical intra-night vari-ability in the luminous RQQSOs. The compiled data of
all classes of AGNs, divided in three subgroups, show thepresence of intra-night variability in all the subclasses ofAGNs.
The popular model to explain micro-variations isshock-in-jet model (e.g. Blandford & Konigl 1979; Scheuer& Readhead 1979; Marsher 1980; Hughes et al. 1985;Marsher 1992; Marscher & Gear 1985; Valtaoja et al. 1988;and Qian et al. 1991). An important signature of the rel-ativistic particle jets ejected by black holes is that theirlight is seen to fluctuate even on the time scale of less thanan hour. This model is rather well accepted to explainmicro-variability in radio-loud AGNs. The clear evidenceof micro-variations in RQQSOs reported in the paper canbe explained in all likelihood, relativistic particle jets areeven ejected by the central engine of RQQSOs. However,probably most jets are quenched at the incipient stage it-self, due to severe inverse-Compton losses inflicted by theintense photon field in the vicinity of the black hole. Thus,it appears to be no fundamental difference in the centralengines of radio-quiet and radio-loud AGNs.
Micro-variability reported here in the RQQSOs canalso be supported by an alternative standard model hav-ing numerous flares or hot spots on the accretion disksurrounding the central engine which can produce themicro-variations in quasars (e.g. Wiita et al. 1991, 1992;Chakrabarti & Wiita 1993; Mangalam & Wiita 1993).
From the compiled catalog of micro-variations studiesof radio-quiet and radio-loud AGNs, we find that both theclasses of AGNs have shown micro-variations. Frequencyof occurrence of micro-variations is least in radio-quietAGNs, highest in blazars and radio-loud AGNs (exclud-ing blazars) fall between these two extreme classes. Radio-quiet AGNs exhibit micro-variations with maximum am-plitude of about 10% or less whereas radio-loud AGNs(excluding blazars) show micro-variations with amplitudeof variation reaching to 50% of the normal flux level withthe frequency of occurrence being more than radio-quietAGNs. On the other hand blazars show the extreme micro-variations with maximum amplitude of variation reach-ing to ∼ 100% of the normal flux level. Genearlly ≈ 10% and 35-40 % radio-quiet AGNs and radio-loud AGNs(non-blazars) have shown intra-night variations respec-tively. Any blazar, if observed continuously for less than 6hours and more than 6 hours, the chances of seeing micro-variations are ≈ 60-65 % and 80-85 % respectively.
These results indicate that the energy generationmechanism and the environment around the central en-gine in different classes of AGNs may be similar, if notidentical. The standard models which explain the micro-variability in radio-loud AGNs viz. shock-in-jet modelsand accretion disk based models can also explain themicro-variability behavior of RQQSOs.
Acknowledgements. We thank the anonymous referee forhis/her constructive critical comments that helped to improvethis paper. We are thankful to Profs. J. H. Fan and J. S.Bagla for reading the manuscript and making useful sugges-tions. The research work at the Physical Research Laboratory
12 A. C. Gupta1,2,3, & U. C. Joshi2: Variability of RQQSOs
is funded by the Department of Space, Government of India.Department of Atomic Energy, Government of India supportedthe research work at the Harish-Chandra Research Instituteand at the Tata Institute of Fundamental Research. IRAF isdistributed by NOAO, USA.
References
Angione, R. J. 1971, AJ, 76, 25
Antonucci, R., Barvainis, R., & Alloin, D. 1990, ApJ, 353, 416Anupama, G. C. & Chokshi, A. 1998, ApJ, 494, L147Bai, J. M., Xie, G. Z., Li, K. H., et al. 1998, A&AS, 132, 83Bai, J. M., Xie, G. Z., Li, K. H., et al. 1999, A&AS, 136, 455Bertaud, C., Wlerick, G., Veron, P., et al. 1973, A&A, 24, 357
Blandford, R. D. & Konigl, A. 1979, ApJ, 232, 34Bregman, J. N., 1992, in Variability of Active Galactic Nuclei,
edited by H. R. Miller and P. J. Wiita (CambridgeUniversity Press, Cambridge), p1
Carini, M. T. 1990, PhD Thesis, Georgia State UniversityCarini, M. T., Miller, H. R. 1992, ApJ, 385, 146Carini, M. T., Miller, H. R., & Goodrich, B. D. 1990, AJ, 100,
347Carini, M. T., Miller, H. R., & Goodrich, B. D. 1992, AJ, 104,
15Carini, M. T., Miller, H. R., Noble, J. C. & Sadun, A. C. 1991,
AJ, 101, 1196
Catanese, M., Bradbury, S. M., Breslin, A. C., et al. 1997,ApJ, 487, L43
Cellone, S. A., Romero, G. E. & Combi, J. A. 2000, AJ, 119,1534
Chakrabati, S. K. & Wiita, P. J. 1993, ApJ, 411, 602Dai, B. Z., Xie, G. Z., Li, K. H., et al. 2001, AJ, 122, 2901de Diego, J. A., Dultzin-Hacyan, D., Ramirez, A. & Benitez,
E. 1998, ApJ, 500, 69Enya, K., Yoshii, Y., Kobayashi, Y., et al. 2002, ApJS, 141, 31
Fan, J. H. & Lin, R. G. 1999, ApJS, 121, 131Fan, J. H., Qian, B. C. & Tao, J. 2001, A&A, 369, 758Fan, J. H. et al. 2002, A&A, 381, 1Fan, J. H. Kurtanidze, O. M., Nikolashvili, M. G., et al. 2004,
ChA&A, 4, 133Ghosh, K. K., Ramsey, B. D., Sadun, A. C. &
Soundararajaperumal 2000, ApJS, 127, 11Ghosh, K. K., Kim, C., Ramsey, B. D. & Soundararajaperumal
2001, JKAS, 34, 9Gopal-Krishna, Gupta, A. C., Sagar, R., et al. 2000, MNRAS,
314, 815Gopal-Krishna, Stalin, C. S., Sagar, R. & Wiita, P. J. 2003,
ApJ, 586, L25Gregg, M. D., Becker, R. H., White, R. L., et al. 1996, AJ,
112, 407Gupta, A. C., Joshi, U. C., Fan, J. H. 2002, Ap&SS, 282, 655
Gupta, A. C. & Joshi, U. C. 2005, New Astronomy (submitted)Gupta, A. C., Banerjee, D. P. K., Ashok, N. M. & Joshi, U. C.
2004, A&A, 422, 505Jang, M. & Miller, H. R. 1995, ApJ, 452, 582Jang, M. & Miller, H. R. 1997, AJ, 114, 565
Heidt, J. & Wagner, S. J. 1996, A&A, 305, 42Howell, S. B., Warnock, A III & Mitchell, K. J. 1988, AJ, 95,
247Huang, K-L., Mitchell, K. J. & Usher, P. D. 1990, ApJ, 362,
Kataoka, J., Mattox, J. R., Quinn, J., et al. 1999, ApJ, 514,138
Kellermann, K. I., Sramek, R. A., Schmidt, M., et al. 1994,AJ, 108, 1163
Lamer, G. & Wagner, S. J. 1998, A&A, 331, L13Mangalam, A.V. & Wiita, P.J. 1993, ApJ, 406, 420Marscher, A. P. 1980, ApJ, 239, 296Marscher, A. P. 1992, in Physics of Active Galactic Nuclei,
edited by W. J. Duschl and S. J. Wagner (Heidelberg:Springer-Verlag), p510
Marscher, A.P. & Gear, W.K. 1985, ApJ, 298, 114Matthews, T. A. & Sandage, A. R. 1963, ApJ, 138, 30Miller, H. R. 1980, AJ, 85, 99Miller, H. R., Carini, M. T. & Goodrich, B. D. 1989, Nature,
337, 627Miller, P., Rawlings, S. & Saunders, R. 1993, MNRAS, 263,
425Miller, L., Peacock, J. A. & Mead, A. R. G. 1990, MNRAS,
244, 207Noble, J. C., Carini, M. T., Miller, H. R. & Goodrich, B. D.
1997, AJ, 113, 1995Oke, J. B. 1967, ApJ, 147, 901Peng, B., Kraus, A., Krichbaum, T. P., et al. 2000, A&A, 353,
937Petry, D., Bottcher, Connaughton, V., et al. 2000, ApJ, 536,
742Petrucci, P. O., Chelli, A., Henri, G., et al. 1999, A&A, 342,
687Pursimo, T., Takalo, L. O., Sillanpaa, A., et al. 2000, A&AS,
146, 141Qian, B, C. & Tao, J. 2004, PASP, 116, 161Qian, S. J., Quirrenbach, A., Witzel, A., et al. 1991, A&A,
241, 15Quinn, J., Akerlof, C. W., Biller, S., et al. 1996, ApJ, 456, L83Rabbette, M., McBreen, B., Smith, N. & Steel, S. 1998, A&AS,
129, 445Racine, R. 1970, ApJ, 159, L99Romero, G. E., Cellone, S. A. & Combi, J. A. 1999, A&AS,
135, 477Romero, G. E., Cellone, S. A., Combi, J. A. & Andruchow, I.
2002, A&A, 390, 431Sagar, R., Stalin, C. S., Gopal-Krishna & Wiita, P. J. 2004,
MNRAS, 348, 176Scheuer, P. A. G. & Readhead, A. C. S. 1979, Nature, 277, 182Stalin, C. S., Gopal-Krishna, Sagar, R. & Wiita, P. J. 2004,
MNRAS, 350, 175Stalin, C. S., Gupta, A. C., Gopal-Krishna, Wiita, P. J. &
Sagar, R. 2005, MNRAS, 356, 607Stetson, P. B. 1987, PASP, 99, 191Stetson, P. B. 1992, in C. J. Butler and I. Elliot (eds.), IAU
Col. 136 on Stellar Photometry − current techniques andfuture developments, p. 291
Veron-Cetty, M.-P., Veron, P. 2001, 374, 92Valtaoja, E., Haarala, S., Lehto, H., et al. 1988, A&A, 203, 1Villata, M., Raiteri, C. M., Kurtanidze, O. M., et al. 2004,
A&A, 421, 103Wagner, S. J. & Witzel, A. 1995, ARA&, 33, 163Wiita, P.J., Miller, H.R., Carini, M.T. & Rosen, A. 1991, in
Structure and Emission Properties of Accretion Disks, IAUColloquium No. 129, edited by J.P. Lasota et al. (EditionsFrontiers, Gif-sur-Yvette), p.557
Wiita, P.J., Miller H.R., Gupta, N., & Chakrabarti, S.K. 1992,in Variability of Blazars, edited by E. Valtaoja, and M.Valtonen (Cambridge University Press, Cambridge), p.311
A. C. Gupta1,2,3, & U. C. Joshi2: Variability of RQQSOs 13
Xie, G. Z., Li, K. H., Zhang, X., et al. 1999, ApJ, 522, 846Xie, G. Z., Li, K. H., Bai, J. M., et al. 2001, ApJ, 548, 200Xie, G. Z., Zhou, S. B., Dai, B. Z., et al. 2002, MNRAS, 329,
689Xie, G. Z., Zhou, S. B., Li, K. H., et al. 2004, MNRAS, 348,