Intracellular metabolite levels shape sulfur isotope fractionation during microbial sulfate respiration Boswell A. Wing a,1,2 and Itay Halevy b,1,2 a Department of Earth and Planetary Sciences and GEOTOP, McGill University, Montréal, QC, Canada H3A 0E8; and b Department of Earth and Planetary Sciences, Weizmann Institute of Science, Rehovot 76100, Israel This Feature Article is part of a series identified by the Editorial Board as reporting findings of exceptional significance. Edited by Mark H. Thiemens, University of California, San Diego, La Jolla, CA, and approved September 30, 2014 (received for review April 28, 2014) We present a quantitative model for sulfur isotope fractionation accompanying bacterial and archaeal dissimilatory sulfate respira- tion. By incorporating independently available biochemical data, the model can reproduce a large number of recent experimental fractionation measurements with only three free parameters: (i ) the sulfur isotope selectivity of sulfate uptake into the cytoplasm, (ii ) the ratio of reduced to oxidized electron carriers supporting the respiration pathway, and (iii ) the ratio of in vitro to in vivo levels of respiratory enzyme activity. Fractionation is influenced by all steps in the dissimilatory pathway, which means that environmental sul- fate and sulfide levels control sulfur isotope fractionation through the proximate influence of intracellular metabolites. Although sul- fur isotope fractionation is a phenotypic trait that appears to be strain specific, we show that it converges on near-thermodynamic behavior, even at micromolar sulfate levels, as long as intracellular sulfate reduction rates are low enough (<<1 fmol H 2 S·cell -1 ·d -1 ). dissimilatory sulfate reduction | sulfur isotope fractionation | flux–force relationship D issimilatory sulfate reduction is a respiratory process used by some bacteria and archaea to generate energy under anaer- obic conditions. Aqueous sulfate serves as the terminal electron acceptor in this process, leading to the oxidation of organic carbon compounds and sometimes hydrogen and to the production of aqueous sulfide (1). Dissimilatory sulfate respiration was one of the first microbial metabolisms to be isotopically characterized through culture experiments (2), with 32 S-bearing sulfate shown to be consumed preferentially to 34 S-bearing sulfate. Early experiments identified two critical features of this dissimilatory sulfur isotope fractionation: Its magnitude correlates inversely with the sulfate reduction rate of an individual cell but correlates directly with extracellular sulfate concentrations (3–5). Through careful regulation of the environmental controls on respiration, more recent experiments have precisely calibrated these relationships and suggest that their particular form may be strain specific (6–11). All experiments, however, show a non- linear response, where sulfur isotope fractionation increases rapidly with decreasing rate. At the low-rate limit, sulfur isotope fraction- ation appears to approach levels defined by thermodynamic equi- librium between aqueous sulfate and sulfide (8, 12), the initial reactant and final waste product in the respiratory processing chain. In parallel with experimental studies, theoretical work has built a broad foundation for understanding the net sulfur isotope fractionation expressed during sulfate respiration (13–17). These efforts initially dealt with sulfur flow through simplified meta- bolic networks (13) (Fig. 1A) and have expanded to incorporate, for example, electron supply to the reaction cycles of individual respiratory enzymes (17). The reversibility of an individual en- zymatic reaction is a central theoretical concept behind these approaches, as it carries the isotopic memory of downstream steps in the pathway (Fig. 1A). Net “back flux” of sulfur from product sulfide to reactant sulfate was an early experimental observation with pure cultures of sulfate-reducing bacteria (18), supported recently by a similar demonstration in a sulfate- reducing coculture (19). Here we describe a quantitative model for sulfur isotope fractionation during microbial sulfate dissimilation that explicitly links fractionation, reaction reversibility, and intracellular me- tabolite concentrations. Thermodynamic control over isotope fractionation at the low-rate limit is a natural consequence of this approach. It also leads to predictive relationships of fraction- ation with extracellular sulfate and sulfide concentrations, as well as with intracellular sulfate reduction rates. These relationships are observable characteristics of sulfate-respiring bacteria and archaea, both in the laboratory and in nature. They are the basis for interpreting fossil S-isotope fractionation patterns in the rock record in terms of ancient organisms and their environmental interactions (6, 11, 20). Both in concept and in application, then, sulfur isotope fractionation is a phenotypic trait. Its relation- ships with environmental metabolites and reduction rate can be thought of as a sulfur isotope phenotype. The approach we ad- vocate here enables past and present variations of the sulfur isotope phenotype to be linked to their physiological, enzymatic, and environmental controls. A Model for Dissimilatory Sulfur Isotope Fractionation During the steady-state transformation of a sulfur-bearing re- actant (r) to a sulfur-bearing product (p), the net fractionation of Significance Microbes can discriminate among metabolites that differ only in the stable isotopes of the same element. This stable isotope fractionation responds systematically to environmental variables like extracellular metabolite concentrations and to physiological ones like cell-specific metabolic rates. These observable charac- teristics define a stable isotope phenotype, as exemplified by the rich database of experimental sulfur isotope fractionations from sulfate-respiring bacteria and archaea. We developed a quantita- tive model for sulfur isotope fractionation during sulfate respira- tion that incorporates only experimentally accessible biochemical information. With this approach, stable isotope phenotypes can be decomposed into their physiological, enzymatic, and environ- mental parts, potentially illuminating the relative influences of these components in natural microbial populations today, as well as how they may have varied in the deep past. Author contributions: B.A.W. and I.H. designed research, performed research, contributed new reagents/analytic tools, analyzed data, and wrote the paper. The authors declare no conflict of interest. This article is a PNAS Direct Submission. See Commentary on page 18102. 1 B.A.W. and I.H. contributed equally to this work. 2 To whom correspondence may be addressed. Email: [email protected] or itay.halevy@ weizmann.ac.il. This article contains supporting information online at www.pnas.org/lookup/suppl/doi:10. 1073/pnas.1407502111/-/DCSupplemental. 18116–18125 | PNAS | December 23, 2014 | vol. 111 | no. 51 www.pnas.org/cgi/doi/10.1073/pnas.1407502111
Transcript
Intracellular metabolite levels shape sulfur isotopefractionation during microbial sulfate respirationBoswell A. Winga,1,2 and Itay Halevyb,1,2
aDepartment of Earth and Planetary Sciences and GEOTOP, McGill University, Montréal, QC, Canada H3A 0E8; and bDepartment of Earth and PlanetarySciences, Weizmann Institute of Science, Rehovot 76100, Israel
This Feature Article is part of a series identified by the Editorial Board as reporting findings of exceptional significance.
Edited by Mark H. Thiemens, University of California, San Diego, La Jolla, CA, and approved September 30, 2014 (received for review April 28, 2014)
We present a quantitative model for sulfur isotope fractionationaccompanying bacterial and archaeal dissimilatory sulfate respira-tion. By incorporating independently available biochemical data,the model can reproduce a large number of recent experimentalfractionation measurements with only three free parameters: (i)the sulfur isotope selectivity of sulfate uptake into the cytoplasm,(ii) the ratio of reduced to oxidized electron carriers supporting therespiration pathway, and (iii) the ratio of in vitro to in vivo levels ofrespiratory enzyme activity. Fractionation is influenced by all stepsin the dissimilatory pathway, which means that environmental sul-fate and sulfide levels control sulfur isotope fractionation throughthe proximate influence of intracellular metabolites. Although sul-fur isotope fractionation is a phenotypic trait that appears to bestrain specific, we show that it converges on near-thermodynamicbehavior, even at micromolar sulfate levels, as long as intracellularsulfate reduction rates are low enough (<<1 fmol H2S·cell
Dissimilatory sulfate reduction is a respiratory process used bysome bacteria and archaea to generate energy under anaer-
obic conditions. Aqueous sulfate serves as the terminal electronacceptor in this process, leading to the oxidation of organic carboncompounds and sometimes hydrogen and to the production ofaqueous sulfide (1). Dissimilatory sulfate respiration was one ofthe first microbial metabolisms to be isotopically characterizedthrough culture experiments (2), with 32S-bearing sulfate shownto be consumed preferentially to 34S-bearing sulfate. Earlyexperiments identified two critical features of this dissimilatorysulfur isotope fractionation: Its magnitude correlates inverselywith the sulfate reduction rate of an individual cell but correlatesdirectly with extracellular sulfate concentrations (3–5).Through careful regulation of the environmental controls on
respiration, more recent experiments have precisely calibratedthese relationships and suggest that their particular form maybe strain specific (6–11). All experiments, however, show a non-linear response, where sulfur isotope fractionation increases rapidlywith decreasing rate. At the low-rate limit, sulfur isotope fraction-ation appears to approach levels defined by thermodynamic equi-librium between aqueous sulfate and sulfide (8, 12), the initialreactant and final waste product in the respiratory processing chain.In parallel with experimental studies, theoretical work has
built a broad foundation for understanding the net sulfur isotopefractionation expressed during sulfate respiration (13–17). Theseefforts initially dealt with sulfur flow through simplified meta-bolic networks (13) (Fig. 1A) and have expanded to incorporate,for example, electron supply to the reaction cycles of individualrespiratory enzymes (17). The reversibility of an individual en-zymatic reaction is a central theoretical concept behind theseapproaches, as it carries the isotopic memory of downstreamsteps in the pathway (Fig. 1A). Net “back flux” of sulfur fromproduct sulfide to reactant sulfate was an early experimentalobservation with pure cultures of sulfate-reducing bacteria (18),
supported recently by a similar demonstration in a sulfate-reducing coculture (19).Here we describe a quantitative model for sulfur isotope
fractionation during microbial sulfate dissimilation that explicitlylinks fractionation, reaction reversibility, and intracellular me-tabolite concentrations. Thermodynamic control over isotopefractionation at the low-rate limit is a natural consequence of thisapproach. It also leads to predictive relationships of fraction-ation with extracellular sulfate and sulfide concentrations, as wellas with intracellular sulfate reduction rates. These relationshipsare observable characteristics of sulfate-respiring bacteria andarchaea, both in the laboratory and in nature. They are the basisfor interpreting fossil S-isotope fractionation patterns in the rockrecord in terms of ancient organisms and their environmentalinteractions (6, 11, 20). Both in concept and in application, then,sulfur isotope fractionation is a phenotypic trait. Its relation-ships with environmental metabolites and reduction rate can bethought of as a sulfur isotope phenotype. The approach we ad-vocate here enables past and present variations of the sulfurisotope phenotype to be linked to their physiological, enzymatic,and environmental controls.
A Model for Dissimilatory Sulfur Isotope FractionationDuring the steady-state transformation of a sulfur-bearing re-actant (r) to a sulfur-bearing product (p), the net fractionation of
Significance
Microbes can discriminate among metabolites that differ only inthe stable isotopes of the same element. This stable isotopefractionation responds systematically to environmental variableslike extracellular metabolite concentrations and to physiologicalones like cell-specific metabolic rates. These observable charac-teristics define a stable isotope phenotype, as exemplified by therich database of experimental sulfur isotope fractionations fromsulfate-respiring bacteria and archaea. We developed a quantita-tive model for sulfur isotope fractionation during sulfate respira-tion that incorporates only experimentally accessible biochemicalinformation. With this approach, stable isotope phenotypes canbe decomposed into their physiological, enzymatic, and environ-mental parts, potentially illuminating the relative influences ofthese components in natural microbial populations today, as wellas how they may have varied in the deep past.
Author contributions: B.A.W. and I.H. designed research, performed research, contributednew reagents/analytic tools, analyzed data, and wrote the paper.
The authors declare no conflict of interest.
This article is a PNAS Direct Submission.
See Commentary on page 18102.1B.A.W. and I.H. contributed equally to this work.2To whom correspondence may be addressed. Email: [email protected] or [email protected].
This article contains supporting information online at www.pnas.org/lookup/suppl/doi:10.1073/pnas.1407502111/-/DCSupplemental.
34S from 32S in the reactant relative to the product can beexpressed by
34αnet =�34αeqr;p −
34αkinr;p
�× fp;r + 34αkinr;p ; [1]
where 34αeqr;p is a fractionation factor characterizing the 34S–32Sratio in the reactant relative to that in the product at equilibrium,34αkinr;p is a kinetic fractionation factor that reflects the rate oftransformation of 34S-bearing reactant relative to 32S-bearing re-actant in the absence of any product, and fp;r is the ratio of therate of formation of reactant from product relative to the rate ofproduct formation from reactant (SI Materials and Methods).This ratio tracks the reversibility of the transformation and variesfrom 0 for an irreversible transformation to 1 for equilibriumbetween reactant and product (i.e., complete reversibility). Theflux–force relationship connects fp;r to the thermodynamic driv-ing force for a chemical transformation,
fp;r = eΔGr=RT ; [2]
where R is the gas constant, T is the temperature at which thechemical transformation is taking place, and ΔGr is the actualfree energy change associated with the transformation of interest(SI Materials and Methods) (19, 21, 22). This relationship meansthat the back flux ratio and, in turn, the sulfur isotope fraction-ation expressed during a chemical transformation are a functionof product and reactant concentrations through
ΔGr =ΔGor +RT ln
Qi½pi�miQj
�rj�nj!; [3]
where ΔGor is the free energy of the reaction at standard-state
conditions, mi is the stoichiometric coefficient for the ith prod-uct, and nj is the stoichiometric coefficient for the jth reactant.The line of reasoning encapsulated in Eqs. 1–3 applies equallywell to enzymatically catalyzed biochemical transformations (19,21–23), illustrating how the concentrations of all metabolic reac-tants and products ultimately control the net isotopic fractiona-tions that accompany networks of enzymatic reactions.
The kinetics of many reversible enzymatic reactions can berepresented with a Michaelis–Menten formalism. Here the netrate of reaction (J) can be decomposed into
J =V+ × κ ×�1− fp;r
�; [4]
where V+ is a constant term that reflects the maximal rate capacityof the reaction and κ is a term that incorporates fractional sub-strate and product saturation and, like fp;r , varies from 0 to 1 (SIMaterials and Methods) (23). From this decomposition, Eq. 1 canbe expressed as a function of the net rate of reaction (cf. ref. 24):
34αnet = 34αeqr;p −�34αeqr;p −
34αkinr;p
�×
JV+ × κ
: [5]
At the low-rate limit ðJ→ 0Þ, 34αnet will approach 34αeqr;p. When re-action rates are at maximal capacity ðJ =V+Þ, enzymes are satu-rated ðκ= 1Þ and αnet will be equal to 34αkinr;p (25). Importantly, if34αeqr;p is greater than
34αkinr;p , as appears to be the case for individualsteps in the dissimilatory sulfate pathway, then the magnitude of thenet isotopic fractionation expressed during an enzymatic transfor-mation will vary inversely with the rate of that transformation. Wenote the variation of net fractionation between equilibrium andkinetic end members (Eq. 5) is not exclusive to sulfur isotopes.For linear series of reversible enzymatic transformations at steady
state, the net isotopic fractionation at any upstream step is given bya recursive relationship that incorporates the net isotopic fractio-nations associated with all downstream enzymatic transformations(SI Materials and Methods). As a result, the expression for theoverall isotopic fractionation associated with a catabolic pathwaylike dissimilatory sulfate reduction will involve a product of the fp;rvalues for every step in the pathway. The fp;r value for each step canbe related to the net rate of reaction for that step through expres-sions like Eq. 4. At steady state, however, the net rates of all stepswill be equal to the rate of the overall catabolic transformation ðJÞ.Accordingly, the expression for the overall isotope effect will bea nonlinear, polynomial function of J, with the polynomial degreeequal to the number of steps in the metabolic pathway.The approach outlined here can, in principle, explain funda-
mental characteristics of dissimilatory sulfur isotope fractionation—the inverse nonlinear relationship with cell-specific sulfate reductionrate and the direct correlation with extracellular sulfate
SO42- SO4
2- APS SO32- H2S H2S
out
in out
in
A
SO42-
SO42-2H+
2H+
PPiATP
SO42- APS SO3
2-Sat
AMP
H2S
MKMKredredMKred MKMKoxoxMKox
H2S
H2S
e- e-
MKMKredredMKred MKMKoxoxMKox
cell envelopeenvironment
cytoplasm
cell membranecell membrane
B
dSiRdSiRdSiR
ETC
ETC
AprAprApr
Fig. 1. Two illustrations of the dissimilatory sulfate respiration network. (A) Sulfur-focused representation of S-isotope fractionation. Bidirectional arrowsrepresent reversible S transformations. In this framework the “back flux” on any one step is a phenomenological constraint. (B) Metabolite-focused represen-tation used here to quantify back flux. Arrows indicate net flux through the individual steps of the pathway, with the ratio of backward to forward flux controlledby the relative abundances of the reactants and products for each step as well as the kinetics of their associated enzymes. Sat is sulfate adenylyl transferase. Apris APS reductase. dSiR is dissimilatory sulfite reductase. MKred refers to the reduced form of menaquinone (menaquinol) and MKox refers to the oxidized form ofmenaquinone. ETC stands for “electron transfer complex.” The likely identities of these complexes in sulfate-reducing microbes are discussed in the text.
Wing and Halevy PNAS | December 23, 2014 | vol. 111 | no. 51 | 18117
concentrations —that have broad empirical support (2–11). Todo so, we next discuss the biochemistry of the sulfate respirationpathway, with a focus on general characteristics that are sharedamong most sulfate-reducing microbes. The discussion is notexhaustive but attempts to provide enough common details toenable us to take our approach from theory to practice.
Overview of Dissimilatory Sulfate RespirationDissimilatory sulfate reduction is a respiratory process based onoxidative phosphorylation; substrate-level phosphorylation doesnot appear to generate enough ATP for growth with hydrogenor lactate as an electron donor (26). Careful accounting of sul-fate accumulation within, and sulfate reduction by, dissimilatorysulfate-reducing bacteria demonstrates that the enzymatic reac-tions leading from sulfate to sulfide occur within the cytoplasm(27). Accordingly, the first step in dissimilatory sulfate reductionis the transport of the sulfate anion from the extracellular en-vironment into the cytoplasm. Microelectrode experiments re-veal that the sulfate permeases that facilitate this process aresecondary transporters that symport protons or sodium ions withsulfate rather than primary transporters that directly consumeATP (28–30). The stoichiometry of symport is roughly two pro-tons for every sulfate dianion (Fig. 1B and Table S1). Importantly,the overall transport step appears to be reversible (Fig. S1), al-though the degree of reversibility has not been quantified (30).Once in the cytoplasm, the ultimate reduction of the sulfate
anion to sulfide depends on the presence of ATP (31), indicatingthat the sulfate needs to be activated into a higher energy form toovercome the unfavorable energetics of a direct transformationto sulfite (32). In the dissimilatory reduction network, adenosine-5′-phosphosulfate (APS) is the free activated intermediate (33),produced along with pyrophosphate (PPi) from ATP and sulfatethrough the enzymatic activity of sulfate adenylyl transferase(Fig. 1B and Table S1) (34). This reaction is endergonic atstandard-state conditions (Table S1) but a cytoplasmic pyro-phosphatase “pulls” the reaction toward the products by ef-ficiently hydrolyzing pyrophosphate to phosphate (35).The enzyme APS reductase catalyzes the efficient reduction of
APS to AMP and sulfite, consuming two electrons in the process(35). Sulfate reducers can grow on an energy source of H2 andsulfate (36). However, APS reductase is located in the cytoplasmof sulfate-reducing bacteria (Fig. 1B) (37), whereas hydrogenasesthat catalyze H2 oxidation are located primarily within the cellenvelope (37, 38). This topography requires chemiosmotic en-ergy conservation, in which electrons are partitioned through thecell membrane (Fig. 1B) (37). A suite of quinone-interactingmembrane-bound oxidoreductase (Qmo) proteins makes up theelectron transfer complex that provides electrons to cytoplasmicAPS reductase in Desulfovibrio vulgaris (39, 40). The precisemechanism of APS reduction via Qmo is complicated and mayultimately involve electron bifurcation (41). However, mena-quinones (MKox) are the most abundant electron carriers insulfate-reducing microbes (37), in line with suggestions thatmembrane-bound menaquinols (MKred) are likely to be theproximal source of electrons to the electron transport complexthat, in turn, supplies APS reductase (Fig. 1B and Table S1) (41).Sulfite produced from APS reduction is the electron acceptor
for the final reductive step in the sulfate respiration pathway(Fig. 1B). Dissimilatory sulfite reductase catalyzes the reductionof sulfite to sulfide (42). Sulfate-reducing bacteria have beenshown to gain energy solely from sulfite and H2 (43). In light ofthe disparate topography of their dissimilatory sulfite reductaseand hydrogenase enzymes (37), this means that a membrane-bound electron transfer complex (identified as DsrMKJOP) (44)facilitates the exchange of reducing power. The reduction ofsulfite to sulfide likely proceeds through a pair of siroheme iron-bound intermediates (SO2−
2 , SO−), consuming two electronsduring each of the three proposed conversions catalyzed by
dissimilatory sulfite reductase (45). During this reductive trans-formation, the DsrC protein appears to play a critical role incycling electrons between the membrane-bound DsrMKJOPcomplex and cytoplasmic dissimilatory sulfite reductase (46, 47).Within the cell membrane, the oxidation of menaquinol tomenaquinone is thought to be the ultimate source of electrons tothe transport complex that mediates this process (Fig. 1B andTable S1) (41, 48).At intracellular pH values, the sulfide produced during sulfite
reduction will exist as H2S and HS−. To compensate for theenergetic cost of symporting protons across the cell membrane,however, sulfide efflux from the cytoplasm is likely to be as H2S(Fig. 1B) (30). In line with these energetic arguments, limitedbiophysical measurements indicate that microbial cell membranesare freely permeable to H2S (49), whereas membrane-crossingHS− ion channels have only a small probability of being open (50).
Model ImplementationAs outlined above, the backbone of the dissimilatory sulfate respi-ration pathway involves 13 substrates (Fig. 1). We assumed thateach of these substrates exists as a free metabolite rather thana bound metabolic complex. In addition, we assumed that sulfateand sulfide levels within the cell envelope were equal to their ex-ternal concentrations and that cytoplasmic sulfide concentrationswere equal to external ones through efficient H2S permeation (i.e.,[H2S]in = [H2S]out = [H2S]) (49) (Fig. 1). Accordingly, we end upwith 10 substrates linked by four separate biochemical trans-formations (Table S1), each of which is separately described byequations like [1]–[3]. With standard-state ΔG values for eachsubstrate (Table S1), kinetic parameters for the transformations inwhich they are involved (Table S2 and Dataset S1), and equilibriumand kinetic fractionation factors for the isotopologues of eachS-bearing substrate (Table S3), we solved these linked equationsunder the assumption of steady-state kinetics (Materials and Methodsand SI Materials and Methods). The relevant equilibrium fraction-ation factors are well constrained theoretically and experimentallybut the relevant kinetic fractionation factors are either inferred fromexperiments with crude cell extracts or treated as a free parameter(Materials and Methods). As such, the values we use for kineticfractionation factors should be viewed as “best guesses” to beverified by fractionation experiments with purified enzymes.We note that the standard-state free energy changes of reaction
ðΔGor Þ are positive for the final three steps in the sulfate reduction
pathway (Table S1). The activation of sulfate to APS, for example,is widely recognized as endergonic under standard-state con-ditions, but sulfite reduction is typically considered to be exergonicat standard state (35), in contrast to the results presented here.This is a direct consequence of referencing the standard state tothe MKred=MKox redox pair, which has a much higher redoxpotential than the H2/H
+ couple that is conventionally used (35).Like the majority of metabolically feasible biochemical reactions(51), sulfite reduction is apparently reversible in vivo and dependsstrongly on the physiological concentrations of metabolites (e.g.,½MKred�=½MKox�) to proceed in a net forward direction.Our solution revealed a handful of important influences
on the net S-isotope fractionation (expressed as 34«netð‰Þ=½34αnet − 1�× 1;000) between the external sulfate consumed andthe external sulfide produced, during dissimilatory sulfate res-piration (SI Materials and Methods). Two are environmental,½SO2−
4 �out and [H2S], and are fixed by the living conditions of aparticular sulfate-reducing population. The three others are in-trinsic to the respiratory pathway: (i) the ratio of reduced tooxidized menaquinone, ½MKred�=½MKox�; (ii) the kinetic frac-tionation factor associated with sulfate uptake, 34αkinuptake; and (iii)a scaling factor, uvivo−vitro, that reflects the concentration of ac-tive enzymes in whole cells in vivo relative to those in crude cellextracts from in vitro enzyme assay experiments (SI Materials andMethods). We calibrated these important parameters with a
18118 | www.pnas.org/cgi/doi/10.1073/pnas.1407502111 Wing and Halevy
combination of physiological reasoning and well-characterizedexperiments on S-isotope fractionation by sulfate-reducing microbes(Materials and Methods and SI Materials and Methods).An important result from the calibration exercise is that
uvivo−vitro appears to increase linearly with cell-specific sulfatereduction rate (csSRR) (Fig. S2). As uvivo−vitro scales with relativeenzyme levels (SI Materials and Methods), this prediction can beunderstood as a specific example of a long-observed physiolog-ical response: Overall intracellular protein levels correlate pos-itively with growth rate (52). Other early experiments showedthat, under balanced growth, individual protein numbers (53)increase with increasing growth rate as well. Although theseobservations have theoretical backing (54, 55), supportingproteomic comparisons between sulfate-reducing populationsmaintained at different specific growth rates have not beenperformed. We note, however, that there is a clear, coordinateddown-regulation of the genes within the sulfate reduction pathway(Fig. 1B) in stationary-phase cultures of D. vulgaris compared withexponentially growing cultures (56). Our results predict approx-imately fourfold differences in respiratory protein levels (Fig. S2),variations that are well within the range estimated for other meta-bolic pathways (57) and that could be monitored with targetedtranscriptomic or proteomic experiments.
Results and DiscussionEnvironmental Sulfate and Sulfide Levels Control S-Isotope FractionationThrough the Proximate Influence of Intracellular Metabolites.Microbialsulfate reduction can occur over a wide span of sulfate and sul-fide concentrations. It is sustained at sulfate concentrations fromhundreds of millimolar, as found in some hypersaline soda lakes(58), down to tens of micromolar, as shown by precise mea-surements of the sulfate affinity of actively growing sulfate reducers(59). Sulfide concentrations much higher than tens of millimolar,however, appear to inhibit microbial sulfate reduction (60). Thisupper limit may be set by sulfide toxicity or by pathway energetics.The lower limit set by physiological sulfide levels is poorly known,with different estimates spanning millimolar (50) to micromolar(61) concentrations. For a given csSRR and constant levels ofintracellular redox metabolites, these two environmental bound-ary conditions are the ultimate controls on sulfur isotope frac-tionation during dissimilatory sulfate reduction. They determineintracellular metabolite concentrations (SI Materials and Methodsand Eqs. S22–S25), which in turn dictate reversibility (Eq. 2) (19)and isotopic fractionations (Eq. 5) (62).Predictions of intracellular metabolite concentrations show a
handful of different responses to these environmental conditions(Fig. 2). First, internal sulfate concentrations are primarily con-trolled by external sulfate concentrations, relative to which theyare enriched by factors of ∼3–100 (Fig. 2A). Accumulation experi-ments show similar enrichments (30). Enrichments are more pro-nounced at lower external sulfate concentrations because relativelyhigh internal sulfate levels are required to make favorable theenergetics of sulfate activation to APS. Less pronounced intra-cellular sulfate enrichments at higher csSRR reflect the slowerkinetics of sulfate uptake relative to APS formation (Table S2).On the other hand, intracellular sulfite levels illustrate another
control regime. They depend exclusively on sulfide concen-trations, do not vary with respiration rate, and range from 0.1 mMto 1 mM for typical environmental sulfide concentrations (Fig. 2D).Maintenance of intracellular sulfite at essentially thermodynamiclevels results from the endergonic nature of sulfite reductionat standard state when menaquinone is the electron carrier.Comparison of the redox potentials of sulfite reduction andmenaquinol oxidation suggests that menaquinone must be al-most completely reduced to reach thermodynamic equilibrium(63). This condition is also inferred here (½MKred�=½MKox�≈ 100;SI Materials and Methods) to maintain physiological levels ofrespiratory metabolites. Intracellular sulfite concentrations have
not been reported for sulfate reducers, but cytoplasmic sulfite levelsof ∼0.15 mM have been measured in the phototrophic sulfur oxi-dizer Chlorobaculum tepidum (64). Although the analogy is imper-fect, this is a natural example where sulfite is an obligate metabolicintermediate in a bacterium that inhabits anoxic environments.More direct support for our predictions is provided by the reactionrate between isolated siroheme (the inferred catalytic center fordissimilatory sulfite reductase) and sulfite, which is maximized atsulfite concentrations around 0.1 mM (65, 66). Targeted metab-olomic studies are clearly needed to test these predictions.Modeled APS and PPi concentrations show more complex
behaviors. At low respiration rates, APS levels are relatively lowand PPi levels are relatively high, whereas at high rates theconverse is true (Fig. 2 B and C). The negative covariance ofAPS with PPi reflects the endergonic nature of sulfate activation,which requires that the concentration product of both metabolicproducts be kept low to sustain net forward reaction. Althoughthis concentration product has not been measured in sulfate-reducing microbes, in vitro rates of APS reduction by APS re-ductase are ∼80% of measured maximums at APS concen-trations of 1 μM (67) and estimates of cytosolic APS levels ingrowing D. vulgaris are 0.25–5 μM (67). These estimates agreewell with the APS concentrations predicted here for high csSRR(0.4–0.6 μM; Fig. 2B), which are required to support high ratesof sulfite production. The corresponding PPi concentrations fallto the physiological limit of 1 nM at low external sulfate levels(<10−5 M), indicated by the curved gray fields in Fig. 2D. Wenote that PPi is an important intermediary in the energy me-tabolism of sulfate-respiring microbes. Given the multitude ofreactions that are likely responsible for maintaining cellular PPiconcentrations, the low PPi levels calculated here are bestinterpreted as a consistency argument that is required for netsulfate reduction to occur. Inorganic pyrophosphatase is an ex-tremely efficient enzyme (68) and may sustain this conditionwithin the cell.
125
−5 −4 −3 −2 −1
25
−5 −4 −3 −2 −1
5
−5 −4 −3 −2 −1
1
−4
−3
−4−3−2−1
−5
−4
−3
−9
−8
−7
−5
−4
−3
−10
−8
−6
−4
−5
−4
−3
−5
−4
−3
−2
−5 −4 −3 −2 −1−5
−4
−3
0204060
[SO42−]out (M)
[H2S]
(M)
[SO
42−] in
(M)
[APS
] (M
)[P
Pi] (
M)
[SO
32−] (
M)
34ε(
‰)
csSRR (fmol H2S cell–1 d–1)A
−5
−2
−2
−2
−2
−2
B
C
D
E
Fig. 2. Predicted metabolite concentrations and isotopic fractionation ina model sulfate reducer. Shown are intracellular concentrations of sulfate(½SO2−
4 �in, row A), APS ([APS], row B), PPi ([PPi], row C), and sulfite (½SO2−3 �,
row D) and the net isotopic fractionation between the substrate sulfateand product sulfide (34«, row E) as functions of extracellular sulfate (½SO2−
4 �out,horizontal axis) and sulfide concentrations ([H2S], vertical axis). All concen-trations are shown on logarithmic scales. Intracellular metabolite levels arecalculated from Eqs. S22–S25, whereas isotopic fractionation is calculated byapplication of Eqs. 2 and 5. Regions where calculated PPi concentrations(and associated fractionations) are physiologically unlikely are shown as grayshaded fields (SI Materials and Methods) (rows C and E).
Wing and Halevy PNAS | December 23, 2014 | vol. 111 | no. 51 | 18119
Taken together, these different metabolic responses combineto produce relatively straightforward patterns of S-isotope frac-tionation. When net respiration is near zero, the magnitude ofnet S-isotope fractionation is large and responds primarily to sulfideconcentrations (Fig. 2E). At a csSRR of 1 fmol H2S·cell
−1·d−1,for example, accessible 34«net values increase with increasingsulfide concentrations, approaching the thermodynamic S-isotopefractionation between sulfate and sulfide (∼71‰ at 25 °C) atmillimolar levels of sulfide. With increasing sulfide concen-trations, the energy yield of the reduction of sulfate to sulfidedecreases to zero; thermodynamic equilibrium demands com-plete reversibility ðfp;r → 0Þ and equilibrium S-isotope fraction-ation among all of the metabolic intermediates.As respiration rate increases, external sulfate concentrations
become influential as well, with contours of equal 34«net follow-ing systematic paths of decreasing external sulfate and increasingsulfide concentrations at moderate csSRR (Fig. 2E). At a csSRRof 125 fmol H2S·cell
−1·d−1, accessible 34«net values are small, only
weakly sensitive to external sulfate, and insensitive to sulfide(Fig. 2E). Together the fractionation characteristics at moderateto high csSRR may explain why most batch experiments withsulfate reducers return isotopic data consistent with a single value of34«net, despite changing sulfate and sulfide levels throughout thecourse of the experiment. The insensitivity of 34«net to csSRR athigh rates arises from our prediction that enhanced production ofrespiratory enzymes will accompany enhanced csSRR (Fig. S2).Because of this, the ratio of csSRR to uvivo−vitro becomes constantat high csSRR, meaning that the concentrations of respiratorymetabolites (SI Materials and Methods and Eqs. S22–S25) and34«net stabilize as well.
S-Isotope Phenotypes Appear to Be Strain Specific. Recent cultureexperiments have isolated the effects of single control parame-ters (csSRR, external sulfate concentration) on fractionationof 33S–32S and 34S–32S (6–11, 14). The broad fractionation pat-terns in these experiments confirm inferences made from earlier
0
25
50
75
0.506
0.508
0.510
0.512
0.514
0.516
0
25
50
75
0.506
0.508
0.510
0.512
0.514
0.516
0.1 100
25
50
75
0 50 100 150 0 25 50 750.506
0.508
0.510
0.512
0.514
0.516
1
34ε
(‰)
33λ
34ε
(‰)
33λ
34ε
(‰)
[SO42−]out (mM) csSRR (fmol H2S day−1 cell−1)
33λ
34ε (‰)
Archaeoglobus fulgidus
[SO42–]out = 21 mM
[SO42–]out = 28 mM
0.010.1110
[SO42–]out (mM)
CBA
FED
IHG
1 00110.0
5>25
1
5
25
1
5
25
125
0.2
0.2
0.2
125
DMSS-1
Desulfovibrio vulgaris Hildenborough
Fig. 3. Model calibration to experimental data. (A) Net isotopic fractionation ð34«Þ by A. fulgidus grown at 80 °C at constant csSRR (6, 7) as a function ofextracellular sulfate concentrations ð½SO2−
4 �outÞ. Orange contours show the value of 34« for different values of csSRR in fmol H2S·cell−1·d−1. The black curve
shows 34« for the harmonic mean of the csSRR values that were reported for some of the experiments (black squares). The csSRR values were not reported forother experiments (white squares), resulting in the scatter around the black curve. (B) Predicted 34« as a function of csSRR for ½SO2−
4 �out between 10 μM and100 mM. Experiments for which ½SO2−
4 �out, csSRR, and 34« were all reported are also shown, color coded by ½SO2−4 �out. (C) Predicted fractionation exponent ð33λÞ
as a function of 34« for the same ½SO2−4 �out as in B. Experiments for which minor isotope data exist are also shown (14). (D) Predicted 34«-½SO2−
4 �out relationshipfor Desulfovibrio strain DMSS-1 grown at ∼20 °C, 21–14 mM ½SO2−
4 �out, and 2–7 mM sulfide (8–10). (E) Measured (white squares) and model (black curve) 34« vs.csSRR for the experiments in D. These experiments were run in batch culture, so we assumed the average ½SO2−
4 �out and external sulfide concentrations for theinterval over which 34« vs. csSRRs were determined (SI Materials and Methods). (F) 33λ vs. 34« for the experiments in D. Error bars are 1σ reported in theexperiments. (G–I) Same as D–F, but for D. vulgaris Hildenborough, grown at 25 °C and with precisely controlled ½SO2−
4 �out of 28 mM (11). Sulfide concen-trations for the model curves were assumed to be 0.1 mM.
18120 | www.pnas.org/cgi/doi/10.1073/pnas.1407502111 Wing and Halevy
work; 34«net decreases with increasing rate and increases withincreasing external sulfate (Fig. 3). However, measured strain-specific fractionations are difficult to compare directly becauseof limited overlap in the experimental conditions under whichthey were determined. An initial attempt to address this issuesuggested that common fractionation behaviors might not ac-company sulfate respiration by different strains (69), although, asshown here, the environmental diversity in this important ex-periment complicates strain-by-strain comparisons. Starting fromthe metabolic state defined by the model sulfate reducer illus-trated in Fig. 2, we constrained a uvivo−vitro–csSRR relationshipfor the two recent experiments that looked at the influence ofrate on fractionation by different bacterial strains of D. vulgaris(DvH, DMSS-1) and another one that examined how sulfate af-fected fractionation by the sulfate-reducing archaeon Archaeoglobusfulgidus (Fig. S2). Coupled with unique ½MKred�=½MKox� and34«kinuptake for each experiment, this exercise allowed us to extendthe strain-specific fractionations to other environmental con-ditions in a self-consistent fashion.Once environmental biases are accounted for, it is clear that
the two bacterial strains have different fractionations when res-piration rate is the control parameter and that their isotopicresponses to changing external sulfate concentrations differ also(Fig. 3 D and G). The fundamental distinction is that DvH ispredicted to maintain a higher respiration rate at a given sulfateconcentration, giving rise to expanded access to the 34«net–csSRRfield (Fig. 3G). The fivefold difference in the initial uvivo−vitrovalue required by DvH and DMSS-1 to sustain minimal respi-ration, as well as the more profligate production of respiratoryenzymes by DvH with increasing csSRR, underlies this physio-logical response (Fig. S2 and Table S4). The scaling factorbetween in vitro and in vivo reaction velocities incorporatescatalytic rate constants as well as enzyme levels (SI Materials andMethods). Specific activities for individual sulfate respirationenzymes vary nearly 100-fold (SI Materials and Methods), sug-gesting that the initial uvivo−vitro difference identified here mayhave its roots in structural differences between DvH andDMSS-1 respiratory enzymes. The clear tension between energyyield and protein cost may be behind the distinct responses ofuvivo−vitro to increases in csSRR (Fig. S2) (57); DMSS-1 is a re-cently isolated strain that may be more economical in producingproteins than the long-transferred, laboratory workhorse DvH.Comparative predictions for DvH and the archaeal sulfate
reducer, A. fulgidus (Fig. 3), reveal S-isotope phenotypes thatdiffer in a number of ways as well. The most obvious differenceis at the low-rate limit, where the higher optimal growth temper-atures of the archaeon lead to an equilibrium 34«net that is ∼20‰lower than that for DvH. In addition, the archaeal 34«net−½SO2−
4 �contours are more tightly spaced than those of DvH, repre-senting the lower sensitivity of fractionation to increasing csSRRin A. fulgidus. The domain-level physiological distinctions be-tween these two strains are reflected in the kinetic performanceof their respective respiratory enzymes (Table S2), as well as inthe uvivo−vitro values required to reproduce the 34«net–csSRR datafor DvH and the 34«net−½SO2−
4 � data for A. fulgidus (Fig. S2 andTable S4). It appears that A. fulgidus needs to produce >10-foldmore respiratory enzymes than DvH to cause the same increasein csSRR. Protein degradation rates are temperature sensitive,potentially accounting for the higher predicted production ratesin A. fulgidus. For a given external sulfate concentration, thisfeature leads to an unchanging archaeal 34«net and, by inference,a static respiratory metabollome, once csSRR surpasses ∼1 fmolH2S·cell
−1·d−1 (Fig. 3B). Our analysis supports the proposalthat the A. fulgidus experiments were run in a regime of SO2−
4control rather than rate control (7).Unlike the 34«net–csSRR and the 34«net−½SO2−
4 � relation-ships, phenotypic variability in 34λnet vs. 34«net is less pronouncedamong sulfate-reducing strains (Fig. 3 C, F, and I). This finding
is in marked contrast to the wide range of 33S–32S and 34S–32Sfractionations that are predicted by phenomenological modelsof multiple S-isotope fractionation during microbial sulfate re-duction (8, 14, 17). As explored below, this behavior has its rootsin the similar ½MKred�=½MKox� and 34«kinuptake values assigned to thesulfate reducers examined here.
Low Sulfate Concentrations Lead to Less Fractionation, but Not WhenCoupled to Low Respiration Rates. Early experiments showed thatmicrobial sulfate respiration in barite-saturated solutions pro-duced limited S-isotope fractionation (3). These observationsstrongly influenced later interpretations of the geologic recordof microbial S-isotope fractionation, where limited variability inwhole-rock δ34S values from ancient marine sediments waslinked to low levels of seawater sulfate at their time of deposition(70). Later experiments examined respiratory S-isotope frac-tionation over a wider range of sulfate levels and with a variety ofpopulations of microbial sulfate reducers (6). The general frac-tionation pattern appeared bimodal, with 34«net values near zerobelow ∼200 μM ½SO2−
4 �out but widely dispersed at higher con-centrations. Recent experiments on microbial sulfate reductionin low-sulfate euxinic lakes have expanded this relationshipand slightly blurred its apparent boundaries, with fraction-ation reported near the thermodynamic limit at ½SO2−
4 �out =1:1� 2 mM (12) and shown to still be sizable (∼20‰) atsulfate levels between ∼100 μM and 350 μM (71). In detail,however, the low sulfate–high sulfate duality is not always obvi-ous. A. fulgidus, for example, shows a positive log-linear re-lationship between 34«net and extracellular ½SO2−
4 � (7) (Fig. 3A).The model described here naturally explains these disparate
observations. Whereas fractionation always decreases continu-ously with decreasing extracellular sulfate levels in a broadly log-linear fashion, the net respiration rate controls the range of34«net values that are accessible at a given ½SO2−
4 �out. For example,simple estimates of barite saturation at room temperature pre-dict equal concentrations of Ba2+ and SO2−
4 near 50 μM (72). Atthese extracellular sulfate levels, limited S-isotope fractionationð34«net ≤ 5‰Þ is predicted for all strains when respiration ratesare greater than those typically seen in pure culture experiments(≥25 fmol H2S·cell
−1·d−1; Figs. 2E and 3 A, D, and G). Fora microbe respiring at 25 fmol H2S·cell
−1·d−1 in media withmodern seawater ½SO2−
4 �out (28 mM), however, strain-specificbehavior results in a wider range of possible fractionations (34«netup to ∼ 25‰; Fig. 3 A, D, and G). Consistent with fractionationexperiments conducted at near-seawater sulfate concentrations(8), 34«net can approach the thermodynamic limit between sulfateand sulfide when net respiration rates decrease to <<1 fmolH2S·cell
−1·d−1 (Fig. 3 B, E, and H). In this region, any strain-specific behavior is trumped by the almost perfect two-waymetabolic communication between the initial reactant and ulti-mate product of the sulfate respiration pathway.However, the most unexpected result of the new model is that
this near-thermodynamic reciprocity can be maintained down toextremely low concentrations of external sulfate (Fig. 3 A, D, andG). As anticipated by environmental incubations from sulfate-poor meromictic lakes (12), 34«net values of 60–70‰ can occurat sulfate concentrations down to tens of micromolar as long asthe right strains (e.g., DvH; Fig. 3G) maintain sluggish net res-piration. The major features of published 34«net−½SO2−
4 �outmeasurements can then be rationalized as follows. First, thewide variation in 34«net down to ∼200 μM extracellular ½SO2−
4 �most likely represents unique strain-by-strain responses to ex-ternal sulfate forcing [either in terms of well-known differencesin strain-specific sulfate affinities (59) or in terms of more specu-lative differences in the kinetic fractionation factor associatedwith sulfate uptake; Table S3]. Second, the limited variability in34«net below ∼200 μM extracellular ½SO2−
4 � is only superficial andprobably results from the experimental difficulty of sustaining
Wing and Halevy PNAS | December 23, 2014 | vol. 111 | no. 51 | 18121
viable cultures at respiration rates as low as those encountered innatural environments. Rate-controlled chemostat experiments ofdifferent strains of sulfate reducers at different sulfate concen-trations will go a long way toward validating these predictions.
No Single Metabolic Step Controls Fractionation. Metabolic inter-pretations of isotope fractionation during sulfate respiration aretypically framed in terms of a “rate-limiting” step in the meta-bolic reaction network (3, 13, 15, 17, 73), with notable exceptions(cf. ref. 62). The catalytic reduction of SO2−
3 to H2S is oftenconsidered to be the rate bottleneck for respiration (73), leadingto the suggestion that larger S fractionations could result if thisconstraint were released (15). Upstream steps have also beenproposed to fulfill the rate-limiting role. In early experiments, forexample, fractionation at low rates of respiratory reduction(34«net ∼ 25‰) was interpreted as the isotopic signature of theconversion of APS to SO2−
3 (3). In contrast, a similar claim forthis step was drawn from the convergence of 34«net on a value of∼15‰ for six different strains of sulfate reducers in batch cul-ture (74). Likewise the small respiratory fractionations observedat low sulfate levels have been proposed to result from ratelimitation by sulfate uptake and the assumption of minor in-trinsic fractionation during the uptake process (7, 13). Ourcalculations support the hypothesis (62) that a fractionationframework based on rate-limiting steps, although potentiallycorrect in theory, is often mistaken in practice. The holisticapproach described here acknowledges the relative isotopicinfluence of each step in the respiratory pathway and revealstheir combined controls on fractionation limits.There are three fractionation limits that bracket the 34«net
patterns associated with sulfate respiration. The first limit occurswhere csSRR approaches zero (Fig. 4A). Here each internalmetabolite is in thermodynamic equilibrium with all others in thereaction network, as ultimately dictated by environmental sulfateand sulfide concentrations. As a result, the fp;r values for eachstep are unity, resulting in an overall S-isotope fractionationdetermined by the product of the equilibrium fractionation fac-tors for each step. The other two limits occur at high respirationrates and at low sulfate levels. Importantly fp;r values for sulfate
activation and sulfite reduction are always near unity, even atthese limits, implying the 34«kin values for these steps exertminor influence on the isotope phenotype (Fig. S3). As csSRRincreases, the reduction of APS emerges early as the primarybottleneck for the respiratory processing chain over a wide rangeof metabolic states (Fig. 4A). As a result, fp;r for this stepapproaches zero whereas csSRR is still much less than themaximum achievable. The fractionation-free character of sulfateactivation to APS (Table S3) means that fractionation control isswitched to the sulfate uptake step at this point and, conse-quently, the drawn-out decay of 34«net toward a low constantvalue with increasing csSRR reflects the slow departure of sul-fate uptake from equilibrium (Fig. 4A).At variable extracellular sulfate levels, the distribution of
fractionation control depends on the initial metabolic state, withthe ratio of reduced to oxidized electron carriers and internalsulfide concentrations playing key roles. In all cases, as ex-ternal sulfate levels decrease, the reversibility of sulfate uptakedecreases (sulfate uptake departs from equilibrium; Fig. 4B).Consequently, 34«net slowly approaches a low constant value (Fig.4B). The metabolic state modulates this behavior. For example,at lower ½MKred�=½MKox� values or higher [H2S], reversibility inthe APS reduction step is relatively high (Fig. 4B) and sulfateuptake exerts the primary control on fractionation changes atlow sulfate levels. The magnitude of 34«net is still much largerthan that of 34«kinuptake, meaning that downstream steps continue toexert an isotopic influence at extremely low sulfate levels (<10 μM;Fig. 4B). At higher ½MKred�=½MKox� values or lower [H2S], thepath to low 34«net is different, with the reduction of APSapproaching irreversibility ðfp;r → 0Þ over a wide range of sul-fate concentrations (Fig. 4B). The overall fractionation is smallerin this case, reflecting both the low reversibility in the APS re-duction step and the decreasing reversibility of sulfate uptakewith decreasing sulfate levels (Fig. 4B). In both these cases,however, extremely low sulfate concentrations (<10−6 M) appearto be required before fp;r for sulfate uptake would approach zero.This appears to rule out the hypothesis of a simple mass transfercontrol on fractionation, where a low sulfate level confers asmall isotope effect (i.e., 34«net = 34«kinuptake) due to conservationof mass. As the control of fractionation is distributed amongdifferent enzymatic steps even at these limiting conditions, itseems likely that S-isotope fractionation is never a sole functionof a single respiratory enzyme.
Minor Isotope Fractionations Are Uniquely Sensitive to UpstreamSteps in the Sulfate Respiration Pathway. Although the positivecorrelation of 33λnet with 34«net has been experimentally validated,the causation behind it is still opaque. One defining limit of therelationship is clear. As the rate of sulfate respiration approacheszero, 33λnet and 34«net will be pegged to their thermodynamiccounterparts regardless of the responsible sulfate respirer (Fig. 3 C,F, and I). This characteristic suggests that comparative 33S–32S and34S–32S fractionations will be most biologically informative in thelow fractionation limit. The experimental variation of 33λnet seems toincrease as 34«net decreases, lending some support to this inference(Fig. 3 C, F, and I). Some of this variability may result from theintracellular ratio of reduced to oxidized electron carriers for thesulfate respiration pathway. Lower ½MKred�=½MKox� values producerelatively steady declines in 33λnet with 34«net, whereas higher ratiosintroduce cusps that separate fractionation regimes upstream anddownstream of APS reduction (Fig. 5). This redox control is alsoseen in the 34«net–csSRR behavior, where lower ½MKred�=½MKox�values give rise to a more gradual decrease in fractionation with ratewhereas higher ratios show a more abrupt change in slope (Fig. 4A).To reproduce the measured 33λnet–34«net patterns, we found
that an inverse isotope effect had to be associated with sulfateuptake. For DvH, for example, 34«kinuptake is −7‰, whereas it is−3‰ for DMSS-1 (Table S3). The isotope effects of transport
Fig. 4. Sensitivity of 34«–csSRR (A) and 34«−½SO2−4 � (B) relationships to a halv-
ing (solid curves) and a doubling (broken curves) of the default [MKred]/[MKox](= 100) and [H2S] (= 0.1 mM) values. Fractionation resulting from the defaultstate is shown by the black curves. Shaded envelopes in A and B show thereversibility of the steps in the sulfate reduction pathway resulting fromvariation of [MKred]/[MKox] and [H2S] for a range of ½SO2−
4 � and csSRRs. Valuesof fp,r range from 0.45 to 0.99 for SO2−
4 uptake, 0.98 to ∼1 for activation, ∼0 to0.98 for APS reduction, and 0.99 to ∼1 for SO2−
3 reduction.
18122 | www.pnas.org/cgi/doi/10.1073/pnas.1407502111 Wing and Halevy
across cell membranes have been only rarely studied, but the oneisotope effect that has been directly observed for active transport[∼14‰ for NH+
4 uptake in Escherichia coli (75)] has a similarabsolute magnitude but opposite sign. Although inverse kineticisotope effects are unusual, we note that early experimentsassigned a fractionation of −3‰ to 34«kinuptake (3).An inverse isotope effect is required for sulfate uptake
because 33λnet decreases as 34«net approaches zero. For theequilibrium fractionations and temperatures considered here,33λeq is always close to 0.515 (Table S3). Under the Swain–Schaad assumption, 33λkin is very similar to 0.515 as well (TableS3). As a result, when 34«kinuptake is positive, indicating a normalkinetic isotope effect, 34«net will always be positive and 33λnet willswing between 0.515 at both the high and low fractionationlimits, dipping slightly below 0.515 at intermediate fractionations(Fig. 5) because of the nonlinear interaction of fractionation andisotope mixing (14). On the other hand, when 34«kinuptake is negative,34«net will “cross over” from a positive value to a negative value;this happens slightly before the sign change for 33«net. Conse-quently, 33λnet will go through a singularity, approaching negativeinfinity from the right and positive infinity from the left (Fig. 5).The 33λnet–34«net relationship for microbial sulfate respiration,
then, appears to be a natural example of the abnormal frac-tionation behavior first identified in a theoretical investigation ofthe H-D-T system (76). (We stress that this behavior is not the“mass-independent” S-isotope fractionation documented in an-cient S-bearing minerals and in photolysis experiments with SO2.The 33λ values corresponding to these situations would requirevanishingly small values of 34«, and the anomalous fractionationwould remain analytically undetectable as a result.) This in-ference, however, depends on the validity of the Swain–Schaadrelationship, particularly for the S-isotope effect associated withsulfate uptake. Although it has been examined only in calcu-lations for H isotopes, this relationship appears computationallyrobust in the face of the complexity associated with enzyme ki-netics (77), but may break down for secondary isotope effects,especially when they become very small (78). It will take a well-designed molecular and isotopic experiment (cf. ref. 75) todetermine whether these theoretical results apply to S-isotopeeffects associated with sulfate uptake or activation.
Summary and Natural ExtensionsIn this contribution we predict the sulfur isotope phenotypes ofsulfate-respiring bacteria and archaea over a wide range of en-vironmental sulfate and sulfide levels and at respiration rates
that range from those typical of laboratory cultivation down tothe much lower rates associated with natural populations (79).One of our primary conclusions is that S-isotope fractionationreflects the intracellular concentrations of all metabolites involvedin the respiratory pathway. Targeted metabolomic analyses shouldbe able to assess this result. Because of this dependence onmetabolite levels, it appears that the activity of a single enzyme isunlikely to be the sole control over fractionation. Our approachcombines biochemical kinetics and thermodynamics and involvesonly parameters that can, in principle, be experimentally de-termined. As it stands, we have been able to reproduce recentS-isotope datasets (with more than 100 total measurements) fromthree separate strains of sulfate reducers (two bacteria and onearchaeon) by considering variations in three model parameters:(i) the ratio of reduced to oxidized membrane-bound menaqui-none; (ii) S-isotope fractionation during sulfate uptake; and (iii)a scaling factor, uvivo−vitro, that reflects the concentration of activeenzymes in whole cells relative to those in crude cell extracts.The calculated S-isotope phenotypes associated with these
strains confirm some of the broad fractionation patterns inferredfrom experimental work, while revealing that others mightbe artifactual. The positive covariation of 33S–32S and 34S–32S frac-tionations is a robust isotopic feature, largely because of the ther-modynamic anchor point provided at low respiration rates.Sulfate-uptake–induced fractionation and intracellular redoxstate create isotopic variability in this pattern when 34S–32Sfractionations are small. Our results also clarify the long-observeddecrease in fractionation with increasing respiration rate. Thegeneral grade is essentially preordained, given that equilibriumfractionations in the sulfate respiration pathway have largermagnitudes than their corresponding kinetic counterparts. In-dividual trajectories, however, are strain specific and reflectprimarily differences in the intracellular redox states and enzymelevels of sulfate-reducing microbes. Although our results showa monotonic increase in 34S–32S fractionations with increasingsulfate levels for a given respiration rate, we never calculateda threshold sulfate concentration above which fractionation wasexpressed and below which it was repressed. Near thermody-namic fractionations appear to be accessible at extremely lowsulfate levels (<10 μM), as long as the average respiration rate ofa sulfate-reducing population is low enough (79). This featuremay neatly unite two conflicting views of S cycling on theArchean earth: large intrasample variability in δ34S values(80, 81) in the face of low marine sulfate concentrations (6, 82).Although sulfate respiration is particularly well investigated
from an isotopic point of view, other microbial metabolic path-ways also exhibit the isotopic behaviors explicated here. Forexample, biosynthetic carbon isotope fractionation is often con-trasted as either an equilibrium or kinetic process (83). Thisdilemma is captured in a pair of long-standing observations;measured intermolecular C isotope fractionations in biosyntheticproducts have been shown to correlate with fractionations esti-mated from the calculated intramolecular distribution of C iso-topes at thermodynamic equilibrium (25, 84) while measuredintramolecular distributions of C isotopes in bacterial fatty acidshave been fully explained in terms of kinetic isotope effects (85).These observations may not be incompatible, as physiologicalstate can bridge the divide between equilibrium and kineticfractionations (Eq. 5). Also consistent with the general principlesencompassed in Eq. 5, catabolic pathways with single processingsteps exhibit more linear relationships between «net and rate[e.g., 34S–32S fractionation during dissimilatory S0 reduction(86)] whereas longer processing chains show distinctly nonlinearbehavior [e.g., 13C–12C fractionation during methanogenesis (87)].Nitrogen isotope fractionation during microbial denitrification,however, exhibits a range of behaviors that are not so easilyclassified. Recent work on respiratory nitrate reduction, for ex-ample, reveals a general pattern of increasing 15«net with increasing
0 25 50 750.508
0.510
0.512
0.514
0.51633λ
34ε (‰)
[MKred]/[MKox]
34εuptake –15 +5
50 200
–5
100
(‰)kin
Fig. 5. Sensitivity of the 33λ− 34« relationship to the ratio of reduced tooxidized menaquinone ([MKred]/[MKox], orange) and the kinetic isotopefractionation during sulfate uptake (34«kinuptake, blue).
Wing and Halevy PNAS | December 23, 2014 | vol. 111 | no. 51 | 18123
cell-specific nitrate reduction rate until a fractionation plateau isreached (88). Careful experiments on an intermediate step in thedenitrification pathway—nitrite reduction—show that rate controlby the electron acceptor follows a similar fractionation pattern,whereas rate control by the electron donor produces fractionationsthat decrease with increasing rate (24, 89). Although the conceptualunderpinning for these contrasting isotopic behaviors was sketchedout almost 30 y ago (90), the present contribution has the potentialto link them under a single quantitative framework. We hope thatour approach will enable stable isotope phenotypes like these, aswell as similar ones seen in assimilatory N and C metabolisms (91,92), to be decomposed into their physiological, enzymatic, and en-vironmental parts. This is a necessary first step toward under-standing the relative influences of these components in naturalmicrobial populations today and is critical for recognizing howthose influences may have varied in the deep past.
Materials and MethodsReaction Thermodynamics and Kinetics. We constrained the free energies ofreaction at standard-state intracellular conditions (pH 7.0; ionic strength = 0.25;Table S1), using an online biochemical calculator (http://equilibrator.weizmann.ac.il) (93) that is based on an internally consistent database (51) and accounts forspeciation at intracellular pH values. The redox potential for [MKred]/[MKox] wasfrom ref. 35. Standard-state free energy values for sulfate uptake have not beenpreviously determined and we constrained these from membrane energeticsand sulfate accumulation experiments with sulfate-reducing bacteria (SIMaterials and Methods and Fig. S1). Velocities for the individual reactionswere taken from experiments with purified enzymes, whole-cell extracts,and, in a few cases, cell suspensions (Table S2). Saturation constants weretaken from an online database (www.brenda-enzymes.info) (94) (Table S2).
Isotopic Fractionation Factors. Published thermodynamic calculations pro-vided equilibrium S-isotope fractionation factors for most individual steps(95), whereas kinetic fractionation factors for 34S–32S were taken fromexperiments with cell-free extracts where available (Table S3). Kinetic frac-tionation factors for 33S–32S were calculated from a fractionation exponentbased on the Swain–Schaad formalism (96), assuming that S–O bonds were
broken (Table S3). We assumed equilibrium fractionation among external,internal, and APS-bound sulfate is negligible. During APS production, S–Obonds are not broken, and no bonds with S are made. Kinetic S-isotopefractionation during this process would be characterized by a secondaryisotope effect, which we assumed was insignificant.
Additional Parameters. Intracellular concentrations of ATP, AMP, and totalMK have been measured in sulfate reducers (Table S4) and we maintainedthese at constant levels in our calculations. Over the range of csSRR in-vestigated here, we chose [MKred]/[MKox] such that intracellular metabolitelevels did not exceed 10 mM and were greater than the free physiologicallimit of 1 nM. Because of the endergonic nature of reactions in the sulfatereduction pathway at standard state (Table S1), the value of [MKred]/[MKox]that fulfills these requirements is ∼100 (SI Materials and Methods).
Note Added in Proof. Experiments with pure cultures of Desulfobacteriumautotrophicum show a positive correlation between per-cell contents of dSiRmRNA and csSRR (97). The slope of this correlation (≈fourfold change in dSiRmRNA for every unit increase in csSRR) compares well with the predictionsmade here (Fig. S2 and Table S4). We thank Alex Loy (University of Vienna)for bringing this to our attention.
ACKNOWLEDGMENTS. The farsighted experiments of G. Shearer and D. Kohl(Washington University) on catabolic N-isotope fractionation inspired thiswork. Discussions with R. Milo (Weizmann Institute of Science) provided focusat critical points in our development of the approach advocated here. Wethank W. Fischer (California Institute of Technology), D. Fike and W. Leavitt(Washington University), and A. Pellerin (McGill University) for valuable dis-cussions; D. Stahl and the Stahl research group (University of Washington) forturning on to stable isotopes; J. Singh (McGill University) for finding twoimportant typos; and two anonymous reviewers for their criticism that im-proved this manuscript in substance and in style. J. Ferry (Johns HopkinsUniversity) made early suggestions that equilibrium thermodynamics mightpartly account for microbial behavior. I.H. acknowledges funding froma European Research Council Starting grant and from Israel Science Foun-dation Grant 1133/12. B.A.W. acknowledges support from a National Sci-ence and Engineering Research Council of Canada Discovery grant and theFeinberg Foundation Visiting Faculty Program at the Weizmann Instituteof Science.
1. Rabus R, Hansen T, Widdel F (2013) Dissimilatory Sulfate- and Sulfur-Reducing Pro-karyotes, eds Rosenberg E, DeLong E, Lory S, Stackebrandt E, Thompson F (Springer,Berlin), pp 309–404.
2. Thode H, Kleerekoper H, McElcheran D (1951) Isotope fractionation in the bacterialreduction of sulphate. Research 4:581–582.
3. Harrison A, Thode H (1958) Mechanism of the bacterial reduction of sulphate fromisotope fractionation studies. Trans Faraday Soc 54:84–92.
4. Kaplan IR, Rittenberg SC (1964) Microbiological fractionation of sulphur isotopes.J Gen Microbiol 34(2):195–212.
5. Chambers LA, Trudinger PA, Smith JW, Burns MS (1975) Fractionation of sulfur iso-topes by continuous cultures of Desulfovibrio desulfuricans. Can J Microbiol 21(10):1602–1607.
6. Habicht KS, Gade M, Thamdrup B, Berg P, Canfield DE (2002) Calibration of sulfatelevels in the Archean ocean. Science 298(5602):2372–2374.
7. Habicht KS, Salling L, Thamdrup B, Canfield DE (2005) Effect of low sulfate concen-trations on lactate oxidation and isotope fractionation during sulfate reduction byArchaeoglobus fulgidus strain Z. Appl Environ Microbiol 71(7):3770–3777.
8. Sim MS, Bosak T, Ono S (2011) Large sulfur isotope fractionation does not requiredisproportionation. Science 333(6038):74–77.
9. Sim M, Ono S, Donovan K, Templer S, Bosak T (2011) Effect of electron donors on thefractionation of sulfur isotopes by a marine Desulfovibrio sp. Geochim CosmochimActa 75:4244–4259.
10. SimMS, Ono S, Bosak T (2012) Effects of iron and nitrogen limitation on sulfur isotopefractionation during microbial sulfate reduction. Appl Environ Microbiol 78(23):8368–8376.
11. Leavitt WD, Halevy I, Bradley AS, Johnston DT (2013) Influence of sulfate reductionrates on the Phanerozoic sulfur isotope record. Proc Natl Acad Sci USA 110(28):11244–11249.
12. Canfield DE, Farquhar J, Zerkle AL (2010) High isotope fractionations during sulfatereduction in a low-sulfate euxinic ocean analog. Geology 38:415–418.
13. Rees C (1973) Steady-state model for sulfur isotope fractionation in bacterial re-duction processes. Geochim Cosmochim Acta 37:1141–1162.
14. Farquhar J, et al. (2003) Multiple sulphur isotopic interpretations of biosyntheticpathways: Implications for biological signatures in the sulphur isotope record. Geo-biol 1(1):27–36.
15. Brunner B, Bernasconi SM (2005) A revised isotope fractionation model for dissimi-latory sulfate reduction in sulfate reducing bacteria. Geochim Cosmochim Acta 69:4759–4771.
16. Johnston D, et al. (2005) Multiple sulfur isotope fractionations in biological systems: Acase study with sulfate reducers and sulfur disproportionators. Am J Sci 305:645–660.
18. Trudinger P, Chambers L (1973) Reversibility of bacterial sulfate reduction and itsrelevance to isotope fractionation. Geochim Cosmochim Acta 37:1775–1778.
19. Holler T, et al. (2011) Carbon and sulfur back flux during anaerobic microbial oxi-dation of methane and coupled sulfate reduction. Proc Natl Acad Sci USA 108(52):E1484–E1490.
20. Shen Y, Buick R, Canfield DE (2001) Isotopic evidence for microbial sulphate reductionin the early Archaean era. Nature 410(6824):77–81.
21. Britton HG (1965) The Ussing relationship and chemical reactions: Possible applicationto enzymatic investigations. Nature 205:1323–1324.
22. Beard DA, Qian H (2007) Relationship between thermodynamic driving force andone-way fluxes in reversible processes. PLoS ONE 2(1):e144.
23. Noor E, Flamholz A, Liebermeister W, Bar-Even A, Milo R (2013) A note on the kineticsof enzyme action: A decomposition that highlights thermodynamic effects. FEBS Lett587(17):2772–2777.
24. Shearer G, Kohl D (2013) Nitrogen isotopic fractionation and 18O exchange in relationto the mechanism of denitrification of nitrite by Pseudomonas stutzeri. J Biol Chem41:D764–D772.
25. Galimov EM (1985) The Biological Fractionation of Isotopes (Academic, Orlando, FL).26. Peck HD, Jr (1960) Evidence for oxidative phosphorylation during the reduction of
sulfate with hydrogen by Desulfovibrio desulfuricans. J Biol Chem 235:2734–2738.27. Furusaka C (1961) Sulphate transport and metabolism by Desulphovibrio desulphur-
icans. Nature 192:427–429.28. Stahlmann J, Warthmann R, Cypionka H (1991) Na+-dependent accumulation of sul-
fate and thiosulfate in marine sulfate-reducing bacteria. Arch Microbiol 155:554–558.29. Warthmann R, Cypionka H (1990) Sulfate transport in Desulfobulbus propionicus and
Desulfococcus multivorans. Arch Microbiol 154(2):144–149.30. Cypionka H (1995) Solute Transport and Cell Energetics, ed Barton L (Springer, New
York), pp 151–184.31. Peck HD (1959) The ATP-dependent reduction of sulfate with hydrogen in extracts of
Desulfovibrio desulfuricans. Proc Natl Acad Sci USA 45(5):701–708.32. Thauer R, Stackebrandt E, Hamilton W (2007) Energy Metabolism and Phylogenetic
Diversity of Sulphate-Reducing Bacteria, eds Barton L, Hamilton W (Cambridge UnivPress, Cambridge, UK), pp 1–37.
33. Ishimoto M, Fujimoto D (1961) Biochemical studies on sulfate-reducing bacteria:10. Adenosine-5′-phosphosulfate reductase. J Biochem 50:299–304.
18124 | www.pnas.org/cgi/doi/10.1073/pnas.1407502111 Wing and Halevy
34. Akagi JM, Campbell LL (1962) Studies on thermophilic sulfate-reducing bacteria:3. Adenosine triphosphate-sulfurylase of Clostridium nigrificans and Desulfovibriodesulfuricans. J Bacteriol 84(6):1194–1201.
35. Thauer RK, Jungermann K, Decker K (1977) Energy conservation in chemotrophicanaerobic bacteria. Bacteriol Rev 41(1):100–180.
36. Badziong W, Thauer RK, Zeikus JG (1978) Isolation and characterization of Desulfo-vibrio growing on hydrogen plus sulfate as the sole energy source. Arch Microbiol116(1):41–49.
37. Badziong W, Thauer R (1980) Vectorial electron transport in Desulfovibrio vulgaris(Marburg) growing on hydrogen plus sulfate as sole energy source. Arch Microbiol125(1-2):167–174.
38. Bell GR, LeGall L, Peck HD (1974) Evidence for the periplasmic location of hydrogenasein Desulfovibrio gigas. J Bacteriol 120(2):994–997.
39. Ramos AR, Keller KL, Wall JD, Pereira IA (2012) The membrane QmoABC complexinteracts directly with the dissimilatory adenosine 5-phosphosulfate reductase insulfate reducing bacteria. Front Microbiol 3:137.
40. Krumholz LR, et al. (2013) Membrane protein complex of APS reductase and Qmois present in Desulfovibrio vulgaris and Desulfovibrio alaskensis. Microbiology159(Pt 10):2162–2168.
41. Pereira I, et al. (2011) A comparative genomic analysis of energy metabolism in sulfatereducing bacteria and archaea. Front Microbiol 2:69/1-69/22.
42. Kobayashi K, Seki Y, Ishimoto M (1974) Biochemical studies on sulfate-reducing bac-teria. 8. Sulfite reductase from Desulfovibrio vulgaris—mechanism of trithionate,thiosulfate, and sulfide formation and enzymatic properties. J Biochem 75(3):519–529.
43. Nethe-Jaenchen R, Thauer R (1984) Growth yields and saturation constant ofDesulfovibrio vulgaris in chemostat culture. Arch Microbiol 137:236–240.
44. Pereira PM, et al. (2008) Energy metabolism in Desulfovibrio vulgaris Hildenborough:Insights from transcriptome analysis. Antonie van Leeuwenhoek 93(4):347–362.
45. Parey K, Warkentin E, Kroneck PM, Ermler U (2010) Reaction cycle of the dissimilatorysulfite reductase from Archaeoglobus fulgidus. Biochemistry 49(41):8912–8921.
46. Oliveira TF, et al. (2008) The crystal structure of Desulfovibrio vulgaris dissimilatorysulfite reductase bound to DsrC provides novel insights into the mechanism of sulfaterespiration. J Biol Chem 283(49):34141–34149.
47. Venceslau SS, et al. (2013) Redox states of Desulfovibrio vulgaris DsrC, a key protein indissimilatory sulfite reduction. Biochem Biophys Res Commun 441(4):732–736.
48. Thauer R, Kunow J (1995) Sulfate-Reducing Archaea, ed Barton L (Springer, NewYork), pp 33–48.
49. Mathai JC, et al. (2009) No facilitator required for membrane transport of hydrogensulfide. Proc Natl Acad Sci USA 106(39):16633–16638.
50. Czyzewski BK, Wang DN (2012) Identification and characterization of a bacterialhydrosulphide ion channel. Nature 483(7390):494–497.
51. Noor E, et al. (2012) An integrated open framework for thermodynamics of reactionsthat combines accuracy and coverage. Bioinformatics 28(15):2037–2044.
52. Schaechter M, Maaloe O, Kjeldgaard NO (1958) Dependency on medium and tem-perature of cell size and chemical composition during balanced grown of Salmonellatyphimurium. J Gen Microbiol 19(3):592–606.
53. Pedersen S, Bloch PL, Reeh S, Neidhardt FC (1978) Patterns of protein synthesis inE. coli: A catalog of the amount of 140 individual proteins at different growth rates.Cell 14(1):179–190.
54. Koch AL (1988) Why can’t a cell grow infinitely fast? Can J Microbiol 34(4):421–426.55. Molenaar D, van Berlo R, de Ridder D, Teusink B (2009) Shifts in growth strategies
reflect tradeoffs in cellular economics. Mol Syst Biol 5:323.56. Zhang W, et al. (2006) Global transcriptomic analysis of Desulfovibrio vulgaris on
different electron donors. Antonie van Leeuwenhoek 89(2):221–237.57. Flamholz A, Noor E, Bar-Even A, Liebermeister W, Milo R (2013) Glycolytic strategy as
a tradeoff between energy yield and protein cost. Proc Natl Acad Sci USA 110(24):10039–10044.
58. Oren A (2002) Halophilic Microorganisms and their Environments (Kluwer, Dordecht,The Netherlands).
59. Tarpgaard I, Roy H, Jorgensen B (2011) Concurrent low- and high-affinity sulfatereduction kinetics in marine sediment. Geochim Cosmochim Acta 75:2997–3010.
60. Cooney MJ, Roschi E, Marison IW, Comninellis C, von Stockar U (1996) Physiologicstudies with the sulfate-reducing bacterium Desulfovibrio desulfuricans: Evaluationfor use in a biofuel cell. Enzyme Microb Technol 18(5):358–365.
61. Kessler D (2006) Enzymatic activation of sulfur for incorporation into biomolecules inprokaryotes. FEMS Microbiol Rev 30(6):825–840.
62. Eckert T, Brunner B, Edwards E, Wortmann U (2011) Microbially mediated re-oxida-tion of sulfide during dissimilatory sulfate reduction by Desulfobacter latus. GeochimCosmochim Acta 75:3469–3485.
63. Wagner GC, Kassner RJ, Kamen MD (1974) Redox potentials of certain vitamins K:Implications for a role in sulfite reduction by obligately anaerobic bacteria. Proc NatlAcad Sci USA 71(2):253–256.
64. Rodriguez J, Hiras J, Hanson TE (2011) Sulfite oxidation in Chlorobaculum tepidum.Front Microbiol 2:112/1–112/7.
65. Kang L, LeGall J, Kowal AT, Johnson MK (1987) Spectroscopic properties of sirohemeextracted from sulfite reductases. J Inorg Biochem 30(4):273–290.
66. Soriano A, Cowan J (1995) Sulfite reductase: Active-site residues are “noncatalytic”.Comparison of reaction energetics for enzyme-catalyzed and siroheme-catalyzedreduction of inorganic substrates. J Am Chem Soc 117:4724–4725.
67. Yagi T, Ogata M (1996) Catalytic properties of adenylylsulfate reductase fromDesulfovibrio vulgaris Miyazaki. Biochimie 78(10):838–846.
68. Bar-Even A, et al. (2011) The moderately efficient enzyme: Evolutionary and physi-cochemical trends shaping enzyme parameters. Biochemistry 50(21):4402–4410.
69. Detmers J, Brüchert V, Habicht KS, Kuever J (2001) Diversity of sulfur isotope frac-tionations by sulfate-reducing prokaryotes. Appl Environ Microbiol 67(2):888–894.
70. Cameron EM (1982) Sulfate and sulfate reduction in early Precambrian oceans. Nature296(5853):145–148.
71. Gomes M, Hurtgen M (2013) Sulfur isotope systematics of a euxinic, low-sulfate lake:Evaluating the importance of the reservoir effect in modern and ancient oceans.Geology 41:663–666.
72. Church T, Wolgemuth K (1972) Marine barite saturation. Earth Planet Sci Lett 15(1):35–44.73. Canfield D (2001) Stable Isotope Geochemistry, eds Valley JW, Cole DR (Mineral Soc
Am, Chantilly, VA), Vol 43, pp 607–636.74. Chambers L, Trudinger P, Smith J, Burns M (1976) Possible boundary condition in
bacterial sulfur isotope fractionation. Geochim Cosmochim Acta 40:1191–1194.75. Vo J, Inwood W, Hayes JM, Kustu S (2013) Mechanism for nitrogen isotope frac-
tionation during ammonium assimilation by Escherichia coli K12. Proc Natl Acad SciUSA 110(21):8696–8701.
76. Stern M, Vogel P (1971) Relative tritium-deuterium isotope effects in absence of largetunneling factors. J Am Chem Soc 93:4664–4675.
77. Kohen A, Jensen JH (2002) Boundary conditions for the Swain-Schaad relationship asa criterion for hydrogen tunneling. J Am Chem Soc 124(15):3858–3864.
78. Hirschi J, Singleton DA (2005) The normal range for secondary Swain-Schaad ex-ponents without tunneling or kinetic complexity. J Am Chem Soc 127(10):3294–3295.
79. Hoehler TM, Jørgensen BB (2013) Microbial life under extreme energy limitation. NatRev Microbiol 11(2):83–94.
80. Bontognali TRR, et al. (2012) Sulfur isotopes of organic matter preserved in 3.45-billion-year-old stromatolites reveal microbial metabolism. Proc Natl Acad Sci USA109(38):15146–15151.
81. Fischer WW, et al. (2014) SQUID-SIMS is a useful approach to uncover primary signalsin the Archean sulfur cycle. Proc Natl Acad Sci USA 111(15):5468–5473.
82. Jamieson J, Wing B, Farquhar J, Hannington M (2013) Neoarchaean seawater sul-phate concentrations from sulphur isotopes in massive sulphide ore. Nat Geosci 6:61–64.
83. Eiler J (2013) The isotopic anatomies of molecules and mineral. Annu Rev Earth PlanetSci 41:411–441.
84. Galimov EM (1975) Carbon Isotopes in Oil-Gas Geology (National Aeronautics andSpace Administration, Washington DC), Vol TTF-682.
85. Monson KD, Hayes JM (1982) Carbon isotopic fractionation in the biosynthesis ofbacterial fatty acids. Ozonolysis of unsaturated fatty acids as a means of determiningthe intramolecular distribution of carbon isotopes. Geochim Cosmochim Acta 46:139–149.
86. Surkov AV, Böttcher ME, Kuever J (2012) Sulphur isotope fractionation during thereduction of elemental sulphur and thiosulphate by Dethiosulfovibrio spp. IsotopesEnviron Health Stud 48(1):65–75.
87. Zyakun A (1996) Potential of 13C/12C variations in bacterial methane in assessing origin ofenvironmental methane. M 66: Hydrocarbon Migration And Its Near-Surface Expression,eds Schumacher D, Abrams M (American Association of Petroleum Geologists, Tulsa, OK),Vol 66, pp 341–352.
88. Kritee K, et al. (2012) Reduced isotope fractionation by denitrification under con-ditions relevant to the ocean. Geochim Cosmochim Acta 92:243–259.
89. Bryan BA, Shearer G, Skeeters JL, Kohl DH (1983) Variable expression of the nitrogenisotope effect associated with denitrification of nitrite. J Biol Chem 258(14):8613–8617.
90. Kohl DH, Shearer G (1978) Isotope Effects in Metabolic Studies, ed Frigerio A(Plenum Press, New York), pp 623–640.
91. Shearer G, Schneider JD, Kohl DH (1991) Separating the efflux and influx componentsof net nitrate uptake by Synechococcus R2 under steady-state conditions. J Gen Mi-crobiol 137:1179–1184.
92. Laws E, Popp B, Bidigare R, Kennicutt M, Macko S (1995) Dependence of phyto-plankton carbon isotopic composition on growth rate and [CO2](aq) - theoreticalconsiderations and experimental results. Geochim Cosmochim Acta 59:1131–1138.
93. Flamholz A, Noor E, Bar-Even A, Milo R (2012) eQuilibrator—the biochemical ther-modynamics calculator. Nucleic Acids Res 40(Database issue):D770–D775.
94. Schomburg I, et al. (2013) BRENDA in 2013: Integrated reactions, kinetic data, enzymefunction data, improved disease classification: New options and contents in BRENDA.Nucleic Acids Res 41(Database issue):D764–D772.
95. Otake T, Lasaga AC, Ohmoto H (2008) Ab initio calculations for equilibrium fractio-nations in multiple sulfur isotope systems. Chem Geol 249:357–376.
96. Swain CG, Stivers EC, Reuwer JF, Jr, Schaad LJ (1958) Use of hydrogen isotope effectsto identify the attacking nucleophile in the enolization of ketones catalyzed by aceticacid1-3. J Am Chem Soc 80:5885–5893.
97. Neretin LN, et al. (2003) Quantification of dissimilatory (bi)sulphite reductase geneexpression in Desulfobacterium autotrophicum using real-time RT-PCR. Environ Mi-crobiol 5(8):660–671.
Wing and Halevy PNAS | December 23, 2014 | vol. 111 | no. 51 | 18125

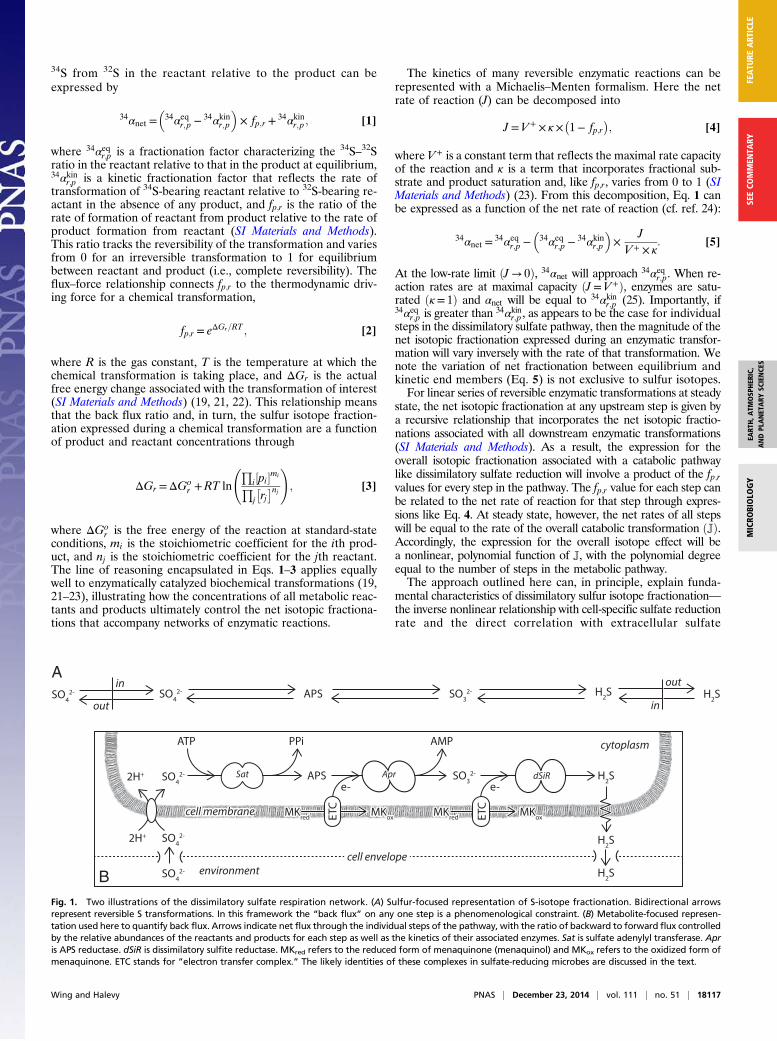

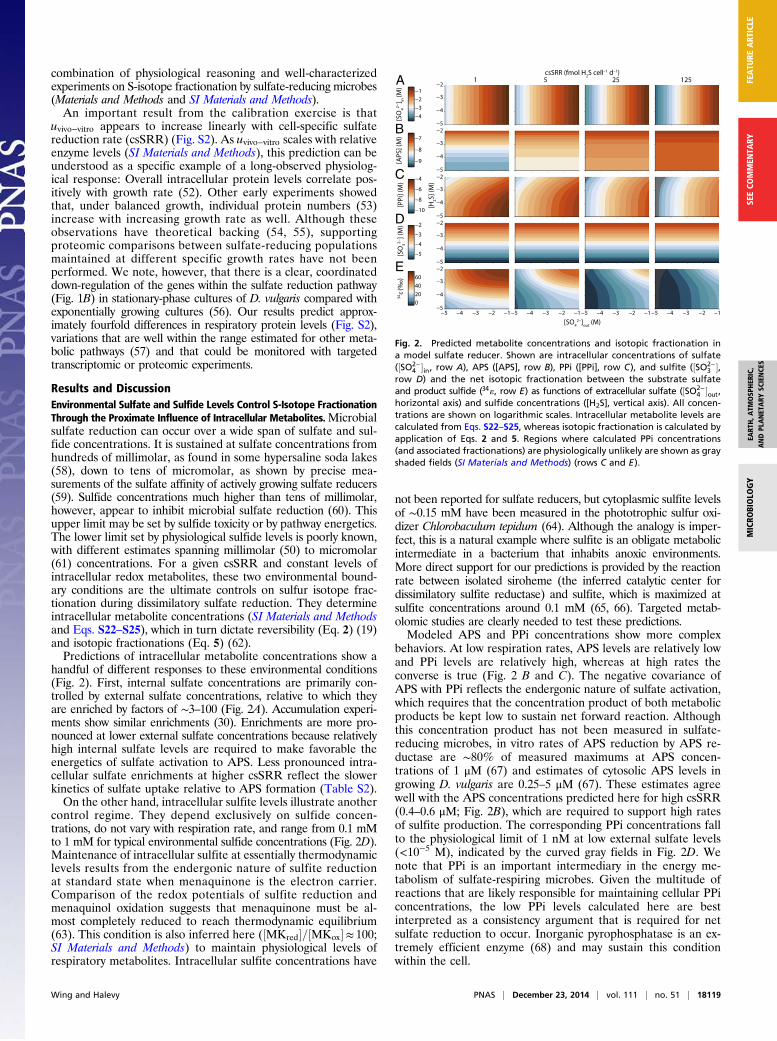


![Coordinate Regulation of Metabolite Glycosylation and · Coordinate Regulation of Metabolite Glycosylation and StressHormoneBiosynthesisbyTT8inArabidopsis1[OPEN] Amit Rai2,3, Shivshankar](https://static.documents.pub/doc/80x56/60342c778ae2d32d91662064/coordinate-regulation-of-metabolite-glycosylation-coordinate-regulation-of-metabolite.jpg)