RF Engineering Continuing Education & Training Introduction toCDMAPrepared by: SAFCO Technologies, Inc. 600 Atlantis Rd. Melbourne, FL 32904 USA Phone: (407) 952-8300 Fax: (407) 725-5062 www.safco.com Revision 3 Copyright 1997 by SAFCO Technologies, Inc. All rights reserved. No part of this book shall be reproduced, stored in a retrieval system, or transmitted by any means, electronic, mechanical, photocopying, recording, or otherwise, without written permission from SAFCO Technologies, Inc.
1.2 CDMA POWER SPECTRAL DENSITY & NOISE .....................................................................................................8
1.3 ADVANTAGES OF CDMA...................................................................................................................................10
1.3.1 Frequency Reuse .....................................................................................................................................10
1.3.2 Coherent Signal Combination .................................................................................................................10
1.3.3 User Privacy............................................................................................................................................11
1.4 COVERAGE AND CAPACITY LIMITATIONS ..........................................................................................................11
1.5 COMPARISON OF MULTIPLE ACCESS TECHNIQUES.............................................................................................11
2.1 IS-95 AND IS-95-A CDMA:..............................................................................................................................13
2.2 FORWARD AND R EVERSE LINKS.........................................................................................................................13
2.3 CORRELATION AND ORTHOGONALITY ...............................................................................................................13
2.5 CHIPS AND CHIP R ATE .......................................................................................................................................15
2.6 BIT R ATE ...........................................................................................................................................................15
2.8 PROCESSING GAIN .............................................................................................................................................15
2.9 EB/NT, BER, AND OTHER FIGURES OF MERIT .....................................................................................................16
2.10 SUMMARY OF CODES....................................................................................................................................16
2.10.1 PN Long Code .........................................................................................................................................16
2.10.2 PN Short Codes .......................................................................................................................................17
3.2.1 Forward Link (Downlink)........................................................................................................................203.2.1.1 Pilot......................................................................................................................................................................21
3.2.1.5 Power Control Sub-Channel.................................................................................................................................22
3.2.2 Reverse Link (Uplink)..............................................................................................................................223.2.2.1 Access Channel ....................................................................................................................................................23
4.1 TYPES OF SPREAD SPECTRUM MODULATION .....................................................................................................24
4.1.1 Frequency Hopping.................................................................................................................................24
4.1.2 Direct Sequence.......................................................................................................................................24
4.2 SPREAD SPECTRUM (CDMA) MODULATION EXAMPLE: E NCODING AND DECODING OF I NFORMATION ...........25
4.2.3 Multiple Signal Case ...............................................................................................................................27
5 THE CDMA ADVANTAGE - THE RAKE RECEIVER AND THE MULTIPATH ENVIRONMENT ... 29
5.1 A BRIEF REVIEW OF MULTIPATH AND ITS EFFECT ON A NALOG AND DIGITAL TRANSMISSIONS..........................29
5.2 THE RAKE R ECEIVER .......................................................................................................................................31
5.3 COMPARISON OF THE EFFECTS OF MULTIPATH ON FDMA, TDMA, AND CDMA..............................................35
5.3.3 CDMA......................................................................................................................................................37 5.3.4 Summary of Multipath Effects .................................................................................................................37
5.4 RAKE R ECEIVER EXAMPLE: IMPROVEMENT IN CALL QUALITY (EB/NT) ..........................................................37
6 DYNAMIC POWER CONTROL ..................................................................................................................... 38
6.1 THE “NEAR -FAR ” PROBLEM..............................................................................................................................39
6.2 R EVERSE LINK ...................................................................................................................................................39
6.3 FORWARD LINK .................................................................................................................................................40
7 CDMA IMPLEMENTATION AND DIGITAL RADIO LINK PROCESSES............................................. 41
7.1 FORWARD LINK .................................................................................................................................................41
7.1.3 Bit Interleaving........................................................................................................................................44
7.1.4 Encryption: Long Code Scrambling.......................................................................................................447.1.4.1 Paging Channel Encryption..................................................................................................................................45
7.1.5 Walsh Function Modulation ....................................................................................................................46 7.1.5.1 Power Control Signaling Subchannel Modulation ...............................................................................................46
7.1.5.2 Forward Link Base Station Transmit Power Control ...........................................................................................47
7.2 R EVERSE LINK ...................................................................................................................................................49
7.2.1 Variable Low Bit Rate Speech Coding ....................................................................................................50
7.2.2 Channel Coding.......................................................................................................................................517.2.3 Bit Interleaving........................................................................................................................................52
7.2.4 64-ary Orthogonal Walsh Symbol Modulation .......................................................................................52
7.2.5 Encryption: Long Code Spreading.........................................................................................................53
7.3 SYSTEM BLOCK DIAGRAM .................................................................................................................................55
8.1 THE GENERAL CASE ..........................................................................................................................................56
8.2 ADJUSTMENTS TO THE GENERAL CASE ..............................................................................................................57
8.2.1 Sectorization Gain ...................................................................................................................................57
8.2.3 Frequency Reuse Efficiency (I ADJ. ) ..........................................................................................................58
8.3 DEFINITION OF
POLE
POINT
...............................................................................................................................588.4 THE POLE POINT EQUATION...............................................................................................................................59
9.1.1 Introduction to T ADD , T DROP & T COMP .......................................................................................................60
9.2 TYPES OF HANDOFFS .........................................................................................................................................61
9.2.1.2 Reverse Link ........................................................................................................................................................62
9.2.1.3 Joint Power Control..............................................................................................................................................62
9.2.5 Hard Handoff ..........................................................................................................................................63
9.2.6 CDMA to Analog Handoff .......................................................................................................................63
9.4 HANDOFF PROCESS ............................................................................................................................................64
9.4.1 Example 1 ................................................................................................................................................64
9.4.2 Example 2 ................................................................................................................................................64
9.4.3 Example 3 ................................................................................................................................................66
10.1 I NITIAL SYSTEM ACCESS...............................................................................................................................67
10.2 CALL I NITIATION AND SETUP ........................................................................................................................67
11 BASIC SYSTEM ENGINEERING ISSUES .................................................................................................... 68
11.1 PROPAGATION MODELING OF THE WIDEBAND CDMA RF SIGNAL ...............................................................69
11.2 LINK BUDGET................................................................................................................................................70
11.3 NOMINAL CELL CONFIGURATIONS& NOMINAL CELL R ADII CALCULATIONS...............................................71
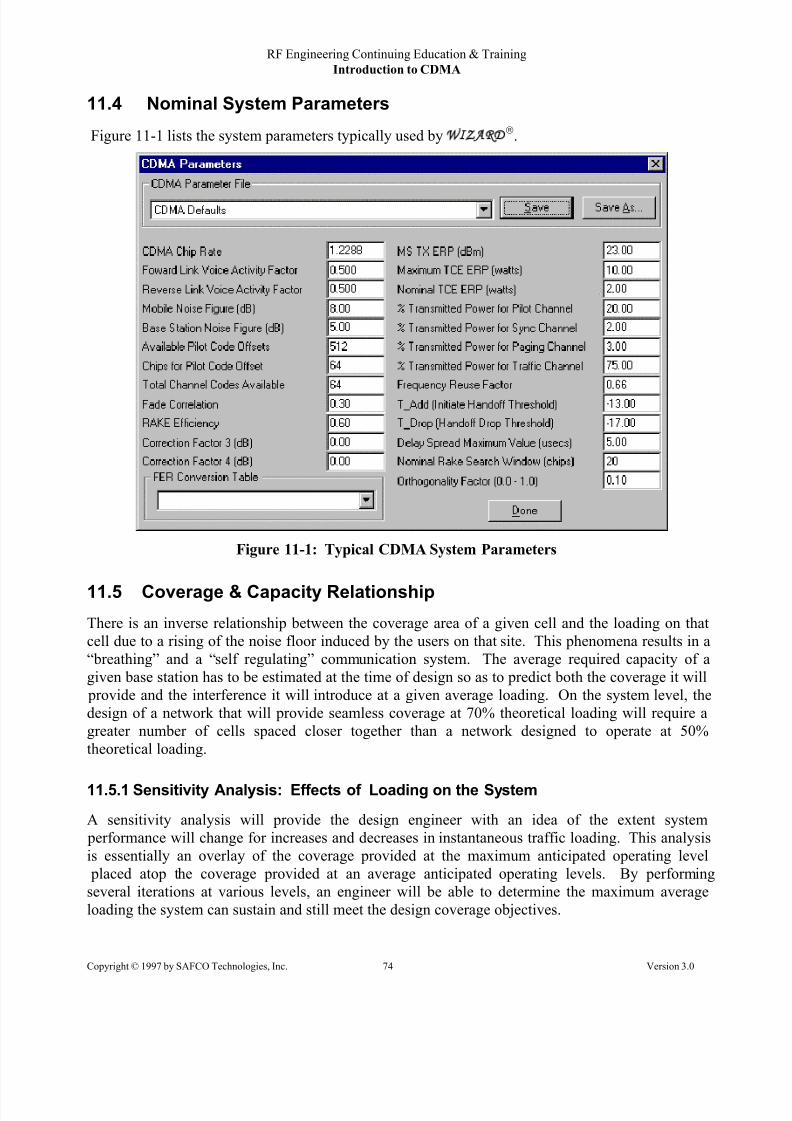
11.4 NOMINAL SYSTEM PARAMETERS ..................................................................................................................74
11.5 COVERAGE & CAPACITY R ELATIONSHIP.......................................................................................................74
11.5.1 Sensitivity Analysis: Effects of Loading on the System..........................................................................74
11.5.2 Sensitivity Analysis Example ...................................................................................................................75
11.7 PN I NTERFERENCE........................................................................................................................................77
11.8 NOMINAL ASSIGNMENT OF PN (RAKE) SEARCH WINDOW..........................................................................77
FIGURE 5-6: COHERENT COMBINATION OF THREE STRONGEST COMPONENTS OF A TYPICAL MULTIPLE TRANSMITTER
BAND-LIMITED CHANNEL IMPULSE R ESPONSE WITH DISCRETE MULTIPATH COMPONENTS...................................35
FIGURE 5-1: TIME DISPERSION........................................................................................................................................36
FIGURE 7-1: CDMA DIGITAL R ADIO FORWARD LINK PROCESS .....................................................................................42
FIGURE 7-2: FORWARD LINK SPEECH PROCESSING AT THE NETWORK SIDE.....................................................................43
FIGURE 7-3: CHANNEL CODING PROCESS .......................................................................................................................44
FIGURE 7-4: BIT I NTERLEAVING......................................................................................................................................44
FIGURE 7-5: FORWARD LINK SCRAMBLING FOR TRAFFIC AND PAGING CHANNELS ........................................................45
FIGURE 7-6: POWER CONTROL SIGNALING SUBCHANNEL...............................................................................................47
FIGURE 7-7: FORWARD LINK BASE STATION TRANSMIT POWER CONTROL ....................................................................48
FIGURE 7-8: FORWARD LINK QUADRATURE SPREADING AND CARRIER MODULATION...................................................49
FIGURE 7-1: CDMA R EVERSE LINK R ADIO PROCESS .....................................................................................................50FIGURE 7-2: SPEECH PROCESSING AT MOBILE SIDE ........................................................................................................51
FIGURE 7-3: R EVERSE LINK CHANNEL CODING PROCESS ...............................................................................................52
FIGURE 7-4: R EVERSE LINK BIT I NTERLEAVING .............................................................................................................52
FIGURE 7-5: R EVERSE LINK TRAFFIC CHANNEL SPREADING, POWER CONTROL GROUP GATING, AND E NCRYPTION.....54
FIGURE 7-6: R EVERSE LINK QUADRATURE SPREADING AND CARRIER MODULATION ....................................................55
FIGURE 7-1: CDMA FORWARD LINK (BASE TO MOBILE) PHYSICAL LAYER ..................................................................55
FIGURE 7-2: CDMA R EVERSE LINK (MOBILE TO BASE) PHYSICAL LAYER ....................................................................56
FIGURE 9-1: MOBILE U NIT TRANSITIONS INTO A REGION DEFINED BY TWO PILOT CHANNELS GREATER THAN T_ADD
LIST OF TABLESTABLE 4-1: SUMMARY OF FREQUENCY HOPPING QUALITIES ..........................................................................................24
TABLE 4-2: SUMMARY OF DIRECT SEQUENCE SPREAD SPECTRUM QUALITIES ...............................................................25
TABLE 5-1: CALL QUALITY DB TO LINEAR CONVERSION TABLE....................................................................................38
TABLE 6-1: FORWARD LINK TCE ATTENUATION LEVEL VS. VOICE CODING R ATE........................................................40
TABLE 6-2: BASE STATION NOMINAL CHANNEL POWER ALLOCATIONS.........................................................................40TABLE 7-1: BASE STATION TRANSMIT POWER VS. DATA R ATE ......................................................................................48
TABLE 7-2: I AND Q BITS AND CORRESPONDING PHASE MODULATION STATE ...............................................................49
TABLE 7-1: I AND Q BITS AND CORRESPONDING PHASE MODULATION STATE ...............................................................54
TABLE 9-1: PILOT SEARCH PARAMETERS........................................................................................................................61
TABLE 11-1: R ECEIVER SENSITIVITY FOR DIFFERENT CDMA CHANNEL TYPES..............................................................70
TABLE 11-2: SIMPLIFIED EXAMPLE OF IS-95 CDMA LINK BUDGET FOR I N-VEHICLE COVERAGE .................................71
TABLE 11-1: SUMMARY OF PARAMETERS USED TO CALCULATE NOMINAL CELL RADIUS, AND CALCULATED CELL RADIUS
FOR EACH AREA TYPE AND ANTENNA CONFIGURATION OF A TYPICAL SYSTEM AT 50% LOADING. ..........................73
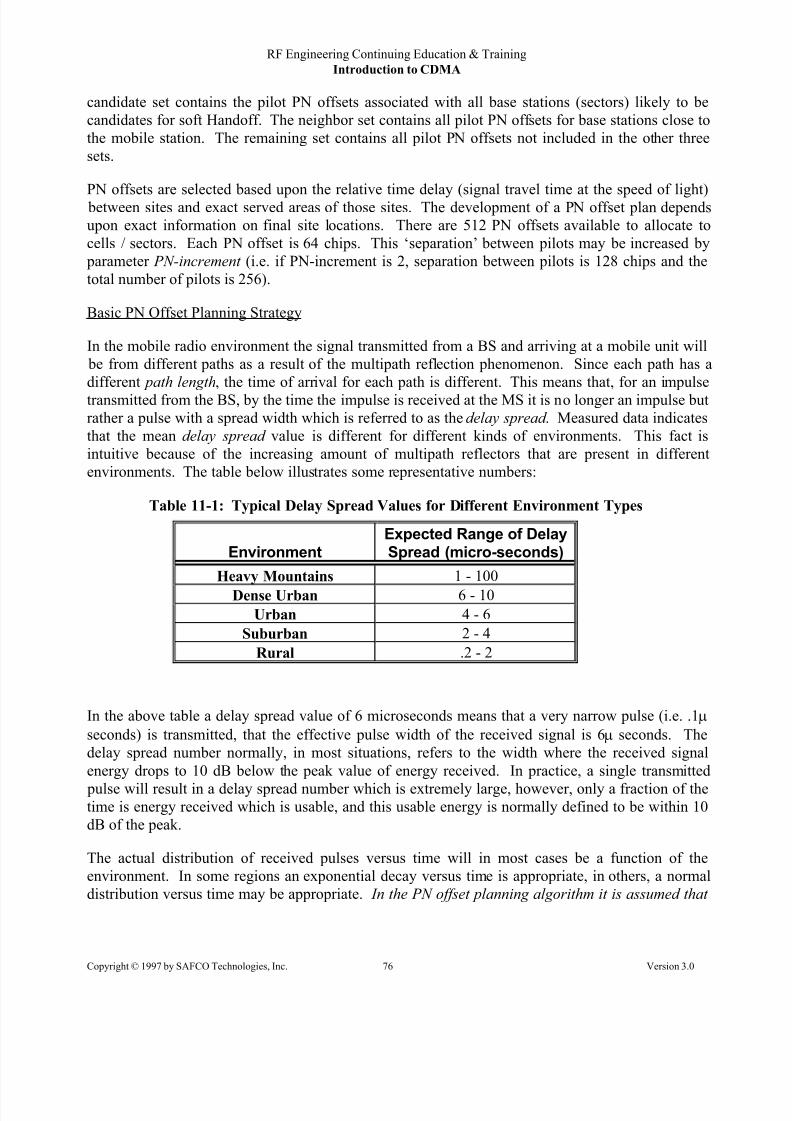
TABLE 11-1: TYPICAL DELAY SPREAD VALUES FOR DIFFERENT E NVIRONMENT TYPES.................................................76
LIST OF EQUATIONSEQUATION 2-1: DEFINITION OF CORRELATION................................................................................................................14
EQUATION 2-1: PROCESS GAIN......................................................................................................................................16
EQUATION 2-1: FRAME ERROR R ATE ..............................................................................................................................18
EQUATION 8-1: POLE POINT EQUATION ..........................................................................................................................59
EQUATION 11-1: CALCULATION OF NOMINAL CELL R ADII ..............................................................................................73
Cellular and Personal Communications Services (PCS) face an ever-increasing number of users
sharing a limited amount of spectrum. In order to accommodate this increasing demand for communication services, providers must increase system capacity without degrading the quality of
service to an unacceptable level. One approach for meeting increased subscriber demand is the use
of Code Division Multiple Access (CDMA). CDMA is a digital spread spectrum technology that
has been used for military and satellite communications for several decades. CDMA, as it applies
to the land mobile telephone environment, is new and is most easily defined or explained by
comparison with more familiar technologies and simple example. Section 1 addresses some basic
characteristics and parameters associated with and unique to CDMA.
1.1 CDMA Basics
CDMA is a Multiple Access Direct Sequence Spread Spectrum Modulation Technique. Thistype of modulation takes narrow band (10 kHz) user information (voice or data) and transmits it
over a very wide RF bandwidth (1.23 MHz). Many users occupy the same RF transmission band.
This is very different from standard AMPS cellular in which each user is assigned a unique narrow
band (10 or 30 kHz) channel. CDMA uses correlative codes to distinguish each individual user in
the system. Each CDMA channel or Traffic Channel Element (TCE) is defined by a unique
correlative code and an associated center frequency. When the signal is received, a correlator
recovers the desired signal and rejects the other signals and interference. This is possible because
all interference sources (including other CDMA users) are uncorrelated with the desired signal.
1.2 CDMA Power Spectral Density & Noise
In a narrow band communication system, the energy used to transmit information is confined to a
relatively small bandwidth – on the order of the information bandwidth. The underlying concept of
spread spectrum communication system is the spreading of the transmitted energy over a wide
bandwidth. The “effective” transmission bandwidth of a direct sequence spread spectrum system is
related to the rate of the final spreading sequence and the type of modulation used. Relatively wide
(i.e. large time duration) pulses in the time domain result in energy being transmitted over a narrow
frequency range. Much shorter pulses (used in CDMA PN spreading sequences) result in energy
being transmitted over a wide range of frequencies. This is illustrated in Figure 1-1.
Figure 1-1: Comparison of Information and Transmission Bandwidth
The thermal noise encountered in a narrow band communication system is typically considered to
be constant (for a given temperature) over frequency. This level of background noise power
contained in a given bandwidth is called the noise floor. In the case of narrow bandcommunications, concentrating the transmitting energy in a narrow frequency band provides a
received RF signal that is above the noise floor. Having the signal sufficiently above the noise floor
is critical to being able to detect and receive (demodulate) the narrow band signal. This is measured
as ratio of the desired signal energy per bit (E b) to total system noise (Nt). For spread spectrum
systems, the transmitted energy is spread over such a wide bandwidth that the received signal
density may be below the noise floor – yet it is still recoverable knowing the correct spreading
sequence (code). This is illustrated in Figure 1-2.
Narrow Band & Wide Band Signal/Noise
-140
-120
-100
-80
-60
-40
1 3 5 7 9 11 13 15 17 19 21 23 25 27 29
Distance
Pwr
(dBm)
RSL
Narrow BandNoise Floor
(1.23 MHz)
(30 kHz)
Wide BandNoise Floor
Figure 1-2: Noise in Narrow Band and Spread Spectrum Communication Systems
CDMA’s spread spectrum modulation technique distributes the user information over an RF
bandwidth that is much larger than the information bandwidth. The resulting power spectral density
(PSD) of the transmitted wide band signal resembles thermal noise making the signal very difficult
to detect. In addition, a unique address code is required to recover user information.
1.4 Coverage and Capacity Limitations
The capacity of a CDMA cell site is effectively limited by the amount of interference in the
environment. Interference is generated by several sources including:
• Users of the given cell sight interfering with each other,
• Users of adjacent cell sites interfering with users of the given cell site,
• Adjacent base stations interfering with users of the given cell site, as well as
• Thermal and spurious noise.
It will be shown that system interference is a function of the number of users and their transmit power. Dynamic power control is used to minimize forward and reverse link transmit power to
mitigate interference. The dynamic nature of interference due to system load must be carefully
considered during system design.
1.5 Comparison of Multiple Access Techniques
In addressing CDMA, it is useful to understand other commonly used multiple access techniques
such as FDMA and TDMA. CDMA can be considered a combination of these techniques as it
possesses elements of frequency and time diversity.
1.5.1 FDMA
Frequency Division Multiple Access (FDMA) is used in conventional analog cellular systems (e.g.
AMPS, NMT). The FDMA process assigns discrete frequencies (i.e. channels) to individual users.
It is considered multiple access in that a number of users can simultaneously use the system
providing there is sufficient spectrum to accommodate each user. Accordingly, the capacity of this
system is limited by the amount of available spectrum.
1.5.2 TDMA
Time Division Multiple Access (TDMA) is employed in digital communication systems. TDMA is
used in cellular systems such as Digital-AMPS and GSM. It is considered multiple access in that anumber of encoded messages can be transmitted over time on a common carrier frequency. TDMA
assigns discrete time slots on a common carrier frequency to each user. During the time slot
designated for a specific user, digital information is burst out using the entire allocated RF channel.
Information is recovered by the receiver which decodes information only in its designated time slot.
As the number of users increases, the transmission bit rate and associated bandwidth increases.
Hence, TDMA is also limited by the amount of available spectrum.
Note that TDMA may be coupled with FDMA to further increase system capacity. Each channel in
an FDMA system may be time-division multiplexed between several users.
1.5.3 Multiple access: division by code
In the CDMA scheme, the digital information from each user is allowed to access the systemsimultaneously (as each user requests) using the same frequency spectrum. Frequency division is
still used, but a large bandwidth is used for each carrier. A user “channel” in CDMA is defined by
a specific code and an associated carrier frequency. The user code is correlated against the receive
signal to recover only the information specific to that user. The capacity of a CDMA system is
governed by the amount of interference in the environment that the receiver can tolerate before it is
unable to recover the desired user information.
U s e r 3
U s e r 1
F r e q u e n c y
U s e r
4 U s e r 3
F r e q u e n c y
A l l o c a t e d B a n d w i d t h
FDMA
C o
d e
U s e r 2 U s
e r 1
U s e r 1
U s e r 2
TDMA
T i m e
C o
d e
U s e r 1
CDMA
U s e r 2
. . .
T i m e
C o
d e
U s e r 3
U s e r 4 U s e r 2
.
.
.
F r e q u e n c y
T i m e
Figure 1-1: Comparison of Multiple Access Techniques
There are several key words and tricky phrases that are used in discussing CDMA processing and
Spread Spectrum modulation. The following sections define some of the common terms that will
be used in the following sections.
2.1 IS-95 and IS-95-A CDMA:
CDMA as described in this document is based on an document known as IS (Interim Standard) -95.
IS-95 is the “Mobile Station - Base Station Compatibility Standard for Dual-Mode Wideband
Spread Spectrum Cellular.” IS-95 is also known as the CDMA “Air Interface” specification1.
CDMA air interface for PCS applications is described in Interim Standard 95-A (IS-95-A). The
basic CDMA process is the same in both standards. Note however that IS-95-A specifies a
maximum data rate of 14.4 kbps where as IS-95 specifies a maximum rate of 9.6 kbps.
Some standards that encompasses are:
IS-96-A Voice Encoder Spec
IS-97 Base Station Performance Spec
IS-98 Mobile Station Performance Spec
J - STD 8 Defines RF requirements at 1900 MHz
J - STD 18 Recommends minimum performance for 1900 MHz personal stations
2.2 Forward and Reverse Links
The definitions of the forward and reverse links are the same in CDMA as in other cellular systems.
The Forward link (also known as the Downlink) refers to transmissions from the base station(cell/sector) to the mobile user. The Reverse link (also known as the Uplink) refers to
transmission from the mobile user to the serving base station (cell/sector).
2.3 Correlation and Orthogonality
In discussing spread spectrum CDMA modulation, we often refer to the “correlation” properties of
different signals or sequences. In conceptual terms, two binary sequences that are being received
are correlated if their patterns of 1s and 0s are “alike” as they are received over time. If their
received bit patterns are different or “random” with respect to each other, the sequences or signals
are said to be uncorrelated. Correlation can be thought of as the “degree of similarity” of signals as
they are received over time.
1 Term cdmaOne has been adopted by CDG as a designator for CDMA technology based on IS-95 and accompanying
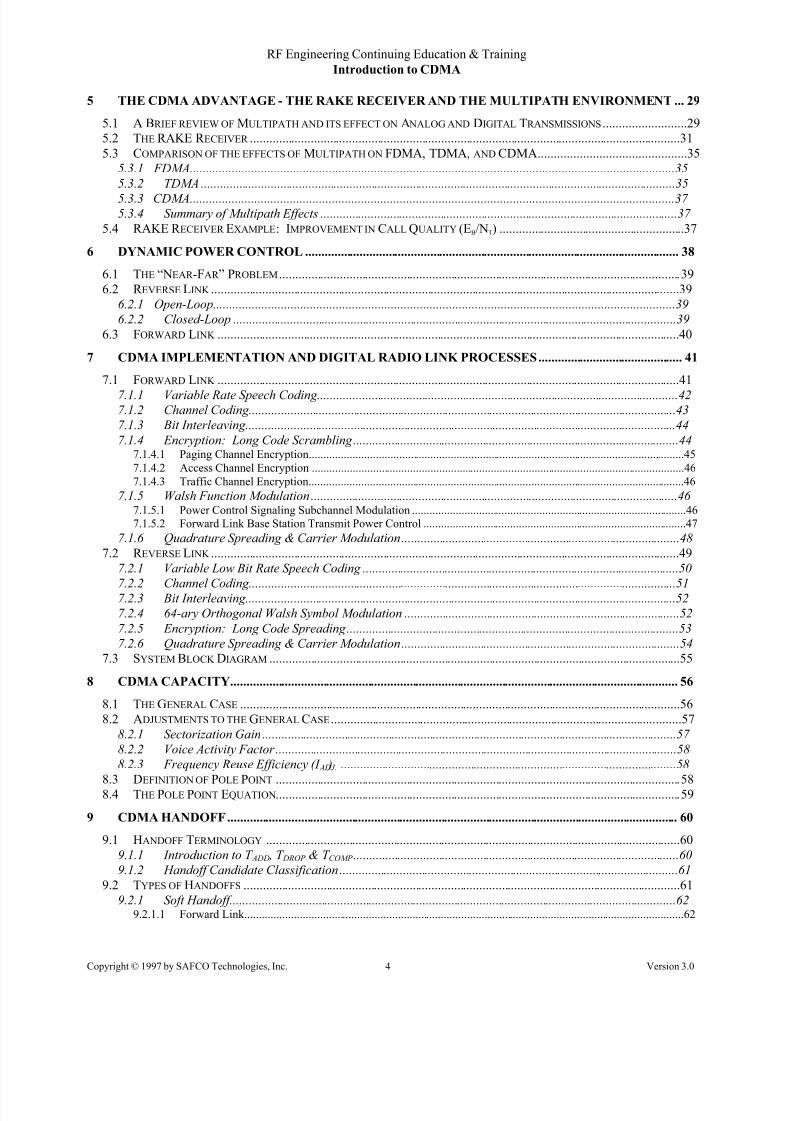
An example of PN sequence generator (four-stage shift register):
1 2 3 40001
10001100
1110
1111
0111
1011
0101
1010
1101
0110
0011
1001
0100
0010
MAXIMUM LENTGH OF
SEQUENCE: 24-1=15
Figure 2-2 Four-stage shift register: generation of PN sequence
2.5 Chips and Chip Rate
A Chip is a “bit” (1 or 0) of a PN sequence. The Chip Rate is the rate at which the PN sequence isgenerated. For CDMA per IS-95, the chip rate is 1.2288 * 106 cps (chips per second).
2.6 Bit RateThe Bit Rate (R b) is the rate of the digitized baseband user information (i.e. user voice). In CDMA,voice is digitized at different rates depending on the speech activity level. The system parameters presented in this discussion are based on a maximum bite rate of 9.6 kbps per IS-95 and 14.4 for PCS CDMA systems (per IS-95-A).
2.7 Traffic Frame
A traffic frame is a 20 ms burst of data (i.e. user voice, error correction coding and controlinformation) from either the base station or the mobile unit.
2.8 Processing Gain
Processing (or Process) Gain is a term common to all direct sequence spread spectrum system.Process gain is defined as the ratio of the Chip Rate (R c) to the information bit rate (R b). This provides a measure of the amount of “spreading” in the system.
same long code (synchronized in time) at both end of the link allows information to be encrypted
and decrypted.
A unique and private, long code mask (thus, PN long code) is assigned to each CDMA user. This
code is referred to as a “user mask”. The user mask is exchanged between the mobile and the
serving cell(s)/sector(s), which allows user traffic data to be encrypted on both the forward andreverse links.
A different long code mask is used to generate the long code for encryption and decryption of
Access and Paging information – more on this later.
2.10.2 PN Short Codes
The Short Code is a PN sequence that is 215
bits (chips) in length. This code is generated at 1.2288
Mbps (or Mcps) giving a period of 26.67 ms. This code is used for final spreading of the signal and
is transmitted as a reference known as the “Pilot Sequence” by the base station. All base stations
use the same short code. Base stations are differentiated from one another by transmitting the PN
short code at different “offsets” in absolute. This time offset is known as a “PN Offset”. All base
stations and mobiles have knowledge of this code, however, mobile units do not have initial
knowledge of absolute time. Mobile units initially search (in time) until they synchronize with a
pilot code transmitted by a base station. The base station then conveys timing information to the
mobile – more on this stuff later.
2.10.3 Walsh Codes
CDMA defines a group of 64 orthogonal sequences, each 64 bits long, known as Walsh Codes.
These sequences are also referred to as Wash Functions. These codes are generated at 1.2288 Mbps
(Mcps) giving them a period of approximately 52 µs. These are used to identify users on theforward link. For this reason they are loosely referred to as CDMA channels. All base stations and
64 bit Walsh Codesused to identify userson downlink
242 - 1 bits
42 bit user maskidentifies user on uplink
64 chip offsetsused to identifybase station/sector to the mobile
PN Long
Codes
215 bits
PN short codes: PN-i(t) = PN-0 (t - i x 64Tc)
Figure 2-1: Summary of Sequences used in CDMA Spread Spectrum
2.11 CDMA Call Quality (Eb /Nt)
With CDMA the raw channel bits have no inherent information and are not available outside of the
spread spectrum receiver. For this reason the fundamental performance measure is the frame error
rate (FER) rather than the bit error rate. Note that a frame includes signaling information and error detection bits as well as user voice/data. This metric includes the error detection/correction coding
inherent in the system. Frame error rate is defined as:
X rateat d transmitte framesof number
X rateat correctlyreceived framesof number FER x ⋅⋅⋅⋅⋅⋅
⋅⋅⋅⋅⋅⋅⋅−=1
Equation 2-1: Frame Error Rate
The “rate X ” term refers to the specific rate at which voice information is being encoded by the
variable rate vocoder.
System performance is typically characterized by plotting Frame Error Rate vs. Received signalE b/Nt. These plots are known as “waterfall curves” due to their shape. These are similar to Bit
Error Rate (BER) curves for other digital communication systems. An example plot of this type is
shown in Figure 2-1 for different modulation types. Specific CDMA performance curves are not
shown as they are specific to vendor hardware. CDMA systems require a Frame Error Rate of less
than 1% for acceptable call quality. This roughly corresponds to a Bit Error Rate (BER) of 10-3
Physical channels are described in terms of a wideband RF channel and code sequence. As definedin IS-95, each RF channel is 1.2288 MHz wide. For each RF channel, there are 64 Walsh
sequences (W0 through W63) available for use on the forward link. These Walsh sequences are
commonly referred to as CDMA channels (though this is not correct for the uplink).
3.2 Logical Channel
Divisions on the physical channel that carry specific types of information are known as logical
channels. Logical channels in CDMA are divided into two categories: Traffic Channels and
Control Channels. For the forward link there are three types of Control/Signaling channels and one
Traffic Channel (per user). For the Reverse Link there is one type Signaling Channel and one
Traffic Channel per user.
It is important to note that signals on the forward link are identified by Walsh codes, however, signals
on the reverse link are identified by Long Codes.
3.2.1 Forward Link (Downlink)
The logical channels for the Forward Link must provide identification of the Base station, timing
and synchronizing of the transmissions between the base station and mobile station, “hailing” of
mobile units in the area, and the voice/data transmission from the base station to the mobile unit.
The Pilot Channel allows a mobile station to acquire the timing of the Forward Traffic Channel -
user information. It provides a phase reference for coherent demodulation and provides a means for
signal strength comparisons between base stations, which is used to determine when to handoff. It
consists of the unmodulated final spreading sequences (PN short codes). The Pilot signal is
transmitted continuously on Walsh 0 by each CDMA base station at the transmitter (cell/sector)
level.
3.2.1.2 Sync Channel
The Synchronization Channel is an encoded, interleaved and modulated spread spectrum signal
that is used with the Pilot Channel to acquire initial system time and synchronization. The sync
channel is always transmitted on Walsh 32.
3.2.1.3 Paging Channel
The Paging Channel is used for transmission of control information to the mobile. When a mobile
is to receive a call it will receive a “page” from the base station. Up to seven (7) channels may be
configured for paging depending on the expected demand.
Page channel messaging to each user takes place in an 80 ms “slot”. The 80 ms slots are grouped
into cycles of 2048 slots (cycle duration 163.84 s) referred to as maximum slot cycles. The base
station can limit the maximum slot cycle used by the mobile. The mobile randomly picks a “slot
cycle index” and informs the base station of its choice when it registers. The mobile now only
monitors the Page channel during its assigned 80 ms slot defined by:
Slot Cycle = 1.28 x 2SLOT_CYCLE_INDEX
(in seconds)
where: SLOT_CYCLE_INDEX is {0 … 7}
That is to say… for a slot cycle index of 5, the mobile “powers up” and monitors the Page channel
for 80 ms once every 1.28 x 25
= 40.96 seconds. This process of periodic monitoring allows
considerable power savings by the mobile unit.
3.2.1.4 Traffic Channel
The Traffic Channel or Traffic Channel Element (TCE) carries all the phone calls (voice or data
signal) from a given base station to all the mobile units active in the coverage area. Each user has a
dedicated TCE, and corresponding Walsh code, on the down link. The forward traffic channelmessage consists of user voice (or data), power control data, and error correction bits. The message
is transmitted as a series of traffic frames. The traffic channel may also carry signaling information
with or in place of user voice (or data). A Walsh code is assigned by the base station for each
CDMA is a spread spectrum modulation scheme. This implies that the transmission bandwidth ismuch larger than the information bandwidth. The types of spread spectrum modulation commonly
used in communication systems are classified as:
• Frequency Hopping
• Direct Sequence
GSM and PCS-1900 are TDMA systems with the ability to frequency hop. CDMA is a direct
sequence technique. These modulation schemes are described further below.
4.1.1 Frequency Hopping
The carrier frequency is varied and the bandwidth of the transmitted signal is comparable to the bandwidth of the information signal. Information is modulated on top of a rapidly changing carrier
frequency. Some advantages and disadvantages of frequency hopping systems are listed in Table
4-1.
Table 4-1: Summary of Frequency Hopping Qualities
Advantages Disadvantages
• Carrier can be hopped over large
portions of the spectrum
• Complex Frequency Synthesizer
• Can be programmed to avoid portions
of the spectrum
• Not useful for location and velocity
measurements
• Shorter Acquisition Time than direct
sequence
• Error correction required
• Less affected by near-far problem than
direct sequence
4.1.2 Direct Sequence
In direct sequence modulation the carrier frequency is fixed and the bandwidth of the transmitted
signal is larger and independent of the bandwidth of the information signal. Some properties of
direct sequence spread spectrum systems are listed in Table 4-2.
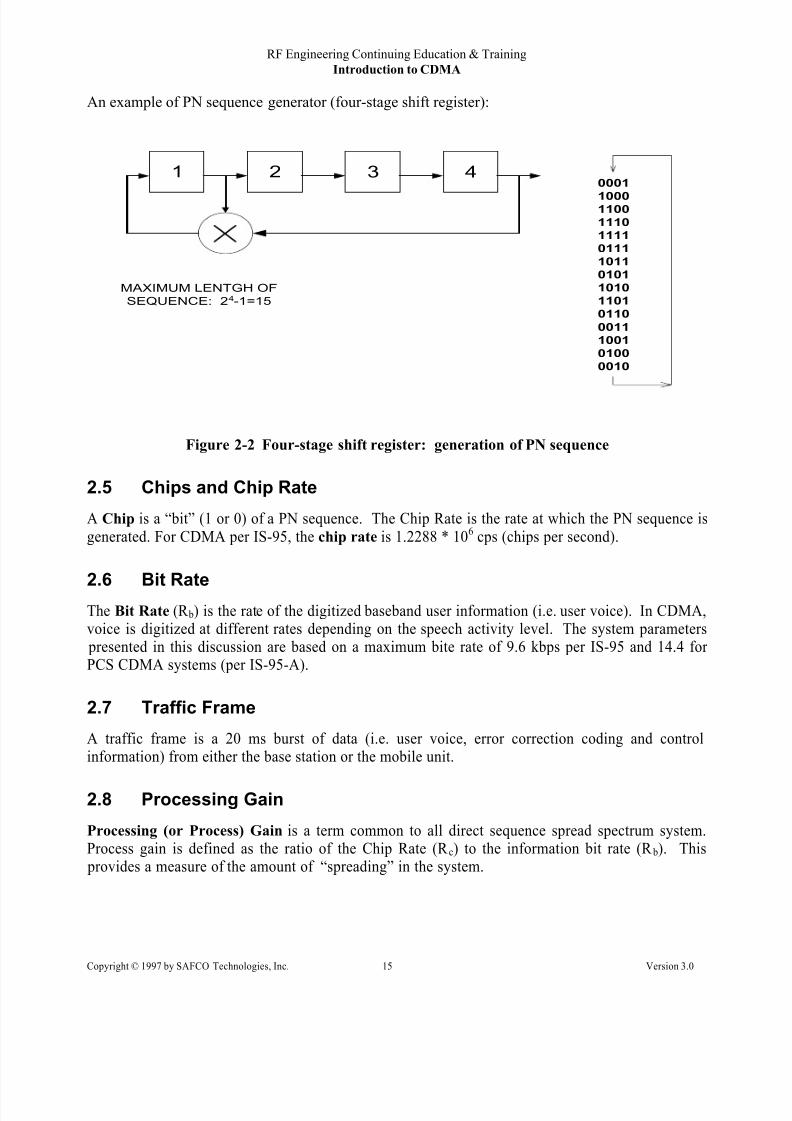
What if the Code 1 signal was also received by a Code 2 receiver ?
C1(t)*C2(t) = C3(t) because of correlation properties of the PN codes. Knowledge of (and timesynchronization to) the PN code associated with a specific information signal allows us to recover
that signal from among other spread spectrum transmissions.
A simple example illustrates how the CDMA signal is transmitted and then recovered in the
presence of another CDMA signal. In the example shown, two (2) information bits are encoded
onto a repeating 7 chip CDMA like code sequence. Note that the effects of noise and interference
are not considered.
Question: What is the processing gain of the spread spectrum signal in this example?
Output of Translated Information Bits (at T + 1 Bit)
Comparitor Output Comparitor Output
5 The CDMA Advantage - The RAKE Receiver and theMultipath Environment
The land based wireless telephone environment is a multipath environment. Multipath is generally
a destructive force in TDMA and FDMA systems and has been factored as a loss in the engineeringof those networks. In CDMA systems, as proposed by the interim standards and proponents of the
technology, multipath is converted to a positive force through the application of the RAKE receiver.
In order to clearly illustrate the benefits associated with the RAKE receiver’s unique ability to
demodulate signals in a multipath environments, it is prudent to briefly review the additive
properties of waves and the multipath phenomena.
5.1 A Brief review of Multipath and its effect on Analog and DigitalTransmissions.
Multipath, as it is referred to in RF engineering, is the result of reflections and scattering of radio
waves off of buildings, water towers, mountains, etc. Multipath will exist anywhere the incidentwave and one or more reflected and/or defracted waves can reach the receiver as shown in Figure
5-1
Multipath, in effect, creates “multiple versions” of the transmitted signal which arrive at the
receiver at different times. These “multiple versions” of the transmitted signal are known as
multipath components. The arrival of multipath components results in destructive interference due
to the superposition of the various waves. The received signal for a given frequency will be the
sum of all the multipath components. When the components arrive perfectly in phase, the overall
Received Signal Level (RSL) will be stronger than any of the individual components. When they
arrive out of phase, as a result of the reflective/defractive process, the overall RSL is less than the
strongest individual component.
Lets consider a single transmitted wave that is scattered such that the receiver detects thetransmitted wave and three multipath components of differing magnitudes and relative phase angles
from the incident wave. Mathematically these waves are given as:
f(t )Incident (Direct) Wave = 2.0 sin (ωt )
f(t )Multipath 1 = 1.5 sin (ωt + 90o)
f(t )Multipath 2 = 1.0 sin (ωt + 180o)
f(t )Multipath 3 = 0.5 sin (ωt + 270o)
The figure below provides a graphic representation of the incident waveform, multipath waveforms
and the resultant waveform. Notice that magnitude of the resultant waveform is less than the
incident waveform as a result of the superpositioning of the multipaths on the incident wave.
Destructive Interference Due to Multipath
-2.50
-2.00
-1.50
-1.00
-0.50
0.00
0.50
1.00
1.50
2.00
2.50
0 2 4 6 8 1 0
1 2
1 4
1 6
1 8
2 0
2 2
2 4
Time
R e l a t
i v e A m p l i t u d e Incident Wave
Multipath 1
Multipath 2
Multipath 3
Resultant Wave
Figure 5-1: Destructive Interference due to Multipath
Destructive (and constructive) interference due to the arrival of equal amplitude and random phase
multipath components is referred to as Rayleigh Fading. The significance or degree that RayleighFading affects system operation is determined by the surrounding environment. If we assume four
(4) different land classifications based on the concentration and size of structures in a given area
and designate them in decreasing concentration as Dense Urban, Urban, Suburban, Rural. In
general we would expect to see the greatest effects of Rayleigh fading in the Dense Urban
environment and the least in a Rural Environment. This is due to the greater concentration of
scattering structures in a Dense Urban Environment than in rural areas
The RAKE receiver is the optimum demodulator structure for multipath propagation paths in a land
mobile telephone environment. It was first implemented in static form in the late 1950’s.
Essentially this device has the capability of “looking” at a given window in time, picking out
multipath components of a given signal and lining them up so that they are in phase again. This process is referred to as coherent addition and results in a greater probability of making or
maintaining the forward link in areas where it would otherwise be prohibited. The RAKE receiver
is also applied to reverse link, however, because of a lack of a coherent reference (pilot signal) the
reverse link uses a non-coherent RAKE demodulator.
To explain the conceptual processes of the RAKE receiver, consider the forward link scenario in
Figure 5-1below in which a mobile unit (in the car), is being served by the nearby base stations
designated BSA.
Figure 5-1: Single Transmitter with Multipath θ
θ1= θ2
θ1
Direct wave
For a single pulse transmitted from BSA, the mobile receives many copies of the pulse, delayed in
time, with amplitude which depend on the interaction with buildings, terrain, and the antenna. The
plot of the received signal vs. Time for a pulse is called an impulse response. In theory, a pulse of
zero time duration requires an infinite bandwidth. In practice this is not possible, therefor, the
transmitted pulse has a finite time duration resulting in a finite bandwidth. For this reason the plot
of receive signal vs. time for a pulse is referred to as a “Band Limited Impulse Response”.
A typical band-limited channel impulse response for the above scenario would be composed of
multipath components from BSA arriving at MU1 at different points in time as shown below in
Figure 5-2. The spikes indicate discernible multipath signals. The surrounding envelope is caused by smaller multipath components, scattering, and background noise.
Figure 5-3: Coherent Combination of Three Strongest Multipath Components from a Single
Transmitter
It is important to note that the only means of adjusting these components is by having a reference
that is also transmitted by BSA along with the traffic information. All IS-95 CDMA base stations
within a given system continuously transmit a pseudorandom (PN) binary (short) code for the
purpose of synchronization and timing (Pilot Channel). Synchronization to the pilot signal allows
the RAKE receiver to operate in an efficient manner.
Each base station starts the PN short code at a unique time which is offset from the system
reference (which is maintained by GPS time). The PN offset makes it appear to a mobile that each
base station is transmitting a unique code because of the correlation properties of the PN sequence.
Note that the PN Code has properties such that when the received PN short code and the PN short
code generated by the mobile unit are aligned in time, a correlation peak occurs. When they are not
aligned, the correlation between the codes is noise.
The RAKE receiver provides for the coherent combination of multipath components from a single
base station and multiple cells/sectors jointly in a CDMA Handoff scenario (see Section 9). In IS-
95 CDMA, the RAKE receiver is limited to resolving and combining a maximum of three multipathcomponents from either a single transmitter, multiple transmitters, or a combination of both. The
limit of resolution in time of the received signals may be as small as ½ of a chip. The maximum
number of signals considered is defined in the system specification and results from the fact that
there is very little added benefit from using more than three components. Typically the RAKE
receiver processes the three strongest three signal components, however, the precise determination
of which signals will be process depends on the handoff type, desired traffic flow, and relevant
Equation 5-1: Call Quality dB to Linear Conversion
The linearized values for each of the multipath components are 3.16, 2.00, 1.58 respectively.Assuming perfect phase alignment and zero processing losses, the combined value for all of the
components is 6.74 which corresponds to a calculated E b/Nt of 8.29 dB which provides the desired
level of call quality.
Additional examples can be made up and solved using Equation 5-1 or Table 5-1 for the
linearization of E b/Nt.
Table 5-1: Call Quality dB to Linear Conversion Table
One of the fundamental requirements for successful IS-95 CDMA operation is the implementation
of Dynamic Power Control (DPC) on the forward and reverse links. Using DPC the power of all
mobile units is controlled so their transmitted signals arrive at the base station at an equal andminimum received power level. In addition, the traffic channel power on the forward link is varied
as a function of voice coding rate. In this way, the interference generated from one mobile unit to
another is kept to a minimum resulting in increased system capacity.
The “near-far” problem in spread-spectrum systems relates to the problem of very strong signals at
a receiver swamping out the effects of weaker signals located on the edge of the coverage area in a
CDMA system resulting in dropped and blocked calls. The direct-sequence spread spectrum
(CDMA) technology is the most susceptible to “near far” due to the ‘N = 1’ frequency reusescheme. A frequency-hopping system is much less susceptible to the near-far problem because it is
an avoidance system. Interference will result only when there is simultaneous occupancy of a given
frequency slot. FDMA and TDMA are virtually immune to “near-far” because of frequency
isolation for FDMA and much lower baud rates for TDMA.
Conceptually, the near-far problem is overcome in CDMA systems by making the base station
receive all signals of equal strength. For a static system, the reverse link transmit powers would be
selectively optimization so that an individual base station receives equal power from all subscribers.
Overcoming “near-far” in the mobile environment requires that the reverse link transmit power for
all subscribers be continuously adjusted. The rate and degree of adjustment should be commiserate
with the maximum anticipated rate and magnitude of change in required power to maintain a
constant RSL at the base station. This is accomplished through the implementation of dynamic
power control.
6.2 Reverse Link
Two forms of power control are used for the reverse link:
• Open-loop, and
• Closed-loop.
6.2.1 Open-Loop
Open loop power control involves only the mobile unit. Open-loop control sets the sum of the
transmit (Access Channel) and receive (Pilot Channel) powers (in dBm) to a constant, nominally
-73 dBm. A reduction in received signal power from the base station results in increased transmit
power from the mobile unit. For example, if the received pilot power from the base station is -85
dBm, the open-loop transmit power setting would be (-73) - (-85 dBm) = 12 dBm. This process is
used for reverse link transmissions made on the access channel prior to setting up a user call. Note
that access attempts are made at successively higher power levels until a response is received from
the base station or a maximum threshold is reached. Once a user call is initiated, closed-loop power
control takes effect.
6.2.2 Closed-Loop
Close-loop power control is used to allow the power from the mobile unit to deviate from the
nominal as set by open-loop control. The base station monitors the power received from each
mobile station and commands each mobile unit to raise or lower its power by a fixed step
(nominally 1 dB) to keep the received signal at the minimum acceptable level. Acceptable signal is
defined by < 1% FER. This process is repeated 800 times per second, or every 1.25 ms. This is
accomplished by dividing each 20 ms traffic frame into 16 power control groups. Each power
control group is preceded by a power control bit. Mobile units support a dynamic range of about
80 dB and can be controlled to transmit as little as -60 dBm.
6.3 Forward Link
Forward traffic channel (TCE) power is attenuated (for each TCE) based on voice coding rate thatis being used. As the data rate is lowered, the output signal is attenuated. This provides a constant
E b for the output signal.
Table 6-1 lists the attenuation levels for the available Vocoder rates.
Table 6-1: Forward Link TCE Attenuation Level vs. Voice Coding Rate
Vocoder
Rate
Data Rate (R b) kbps
(per IS-95)
Attenuation Level
(dB)
1 9.6 0
½ 4.8 3
¼ 2.4 6
1/8 1.2 9
In addition, the available base station transmit power is divided among the pilot, sync, paging, and
traffic channels in use. Table 6-2 lists the nominal power allocations. These allocations are not
dynamic with time but may be adjusted on a per transmitter basis as necessary by the operator.
Table 6-2: Base Station Nominal Channel Power Allocations
Logical Channel Relative Power Allocation Nominal
Allocation
Pilot 0.2 of total power (linear) 20 %Sync + Paging +
7 CDMA Implementation and Digital Radio Link Processes
The following sections provide a general explanation of how a CDMA radio link is implemented.
A detailed hardware description is not discussed here and is provided in Unit 2 of The IS-95 CDMA
Digital Cellular Communication System. Note that the following discussion assumes a maximum bit rate of 9.6 kbps as specified in IS-95 for 850 MHz systems. PCS CDMA systems using a 14.4
kbps maximum data rate, as specified in IS-95-A, follow the same implementation procedure as
discussed below.
The forward and reverse links are broken into functional blocks and a qualitative description of
each block is provided. The digital processing for the forward link and reverse link are not
identical. Pilot signals on the forward link allow more robust detection techniques to be
implemented (e.g. coherent demodulation). A pilot signal is not transmitted on the reverse link,
requiring the use of non-coherent detection at the base station. This necessitates 2 to 3 dB higher
E b/Nt at the base station receiver than at the mobile unit.
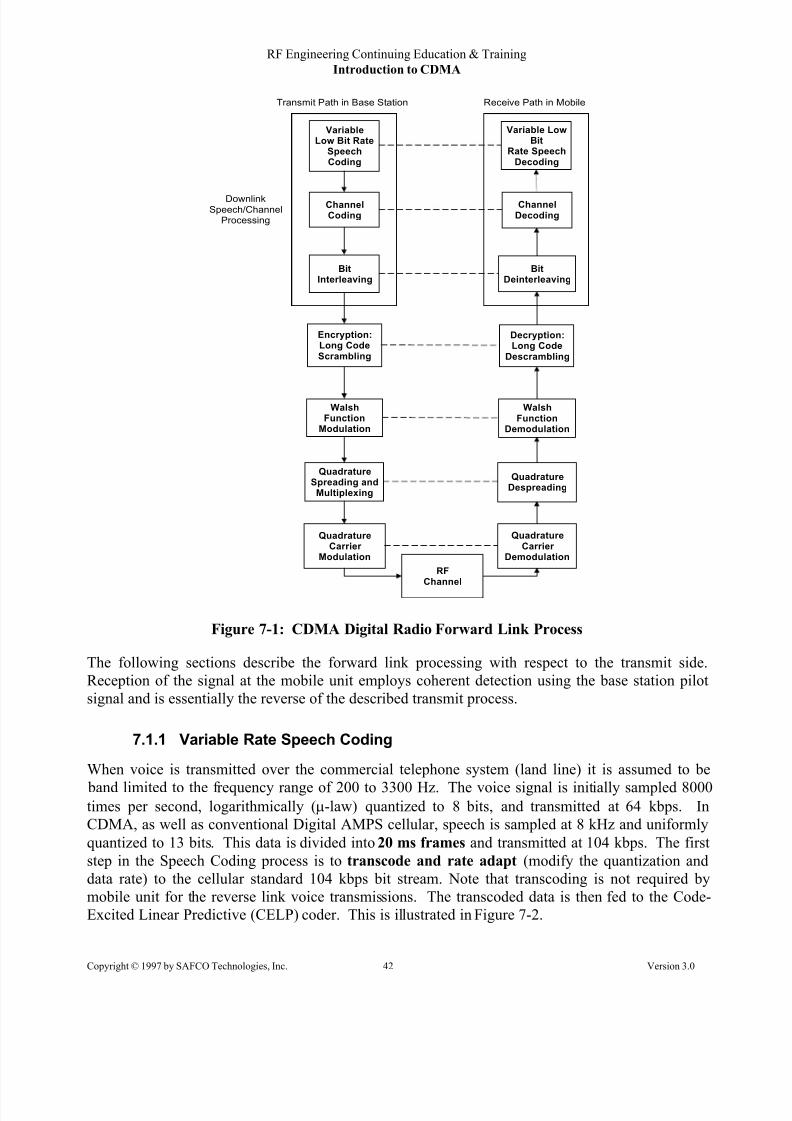
7.1 Forward Link
The forward link or downlink describes the communication from the base station to the mobile user.
A block diagram of the transmit path of the base station and the receive path of the mobile unit is
shown in Figure 7-1. Note that the demodulation process includes a RAKE receiver to combine
multipath signals. The operation of the RAKE receiver is omitted for clarity in the following
sections, however, the RAKE receiver is discussed Section 5.2.
Transmit Path in Base Station Receive Path in Mobile
DownlinkSpeech/Channel
Processing
RFChannel
Figure 7-1: CDMA Digital Radio Forward Link Process
The following sections describe the forward link processing with respect to the transmit side.
Reception of the signal at the mobile unit employs coherent detection using the base station pilot
signal and is essentially the reverse of the described transmit process.
7.1.1 Variable Rate Speech Coding
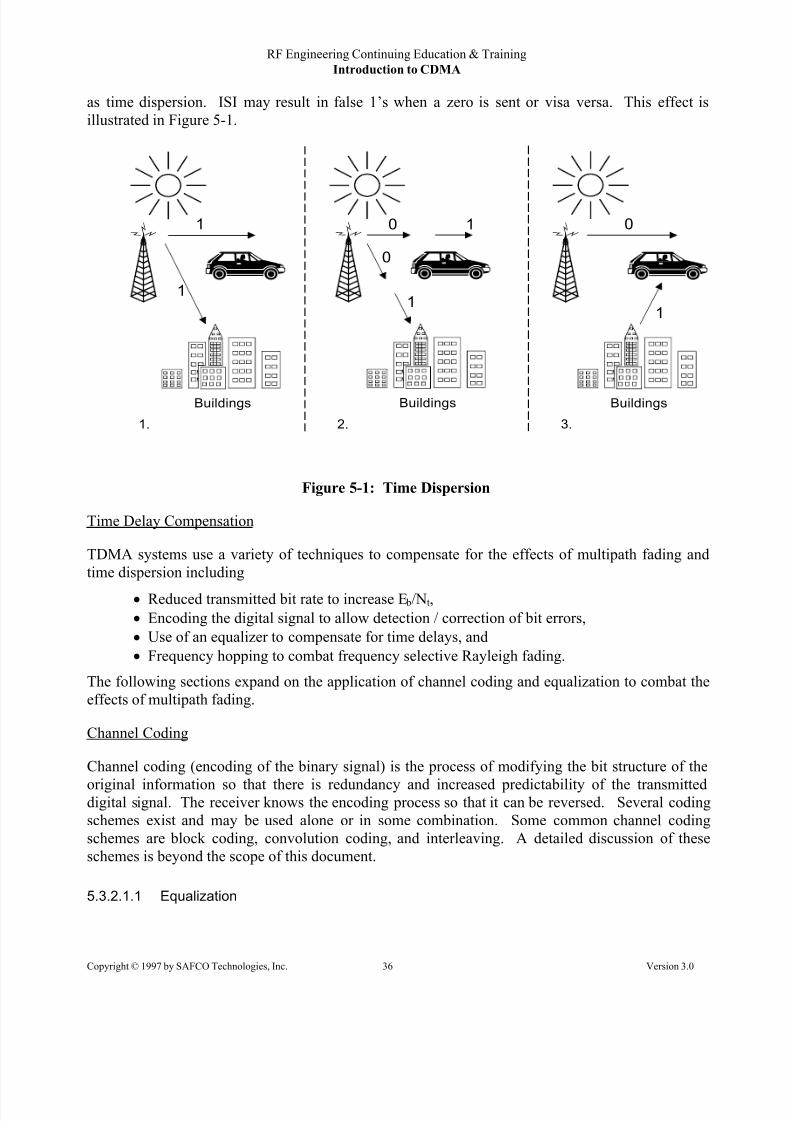
When voice is transmitted over the commercial telephone system (land line) it is assumed to be
band limited to the frequency range of 200 to 3300 Hz. The voice signal is initially sampled 8000times per second, logarithmically (µ-law) quantized to 8 bits, and transmitted at 64 kbps. In
CDMA, as well as conventional Digital AMPS cellular, speech is sampled at 8 kHz and uniformly
quantized to 13 bits. This data is divided into 20 ms frames and transmitted at 104 kbps. The first
step in the Speech Coding process is to transcode and rate adapt (modify the quantization and
data rate) to the cellular standard 104 kbps bit stream. Note that transcoding is not required by
mobile unit for the reverse link voice transmissions. The transcoded data is then fed to the Code-
Excited Linear Predictive (CELP) coder. This is illustrated in Figure 7-2.
Figure 7-2: Forward Link Speech Processing at the Network Side
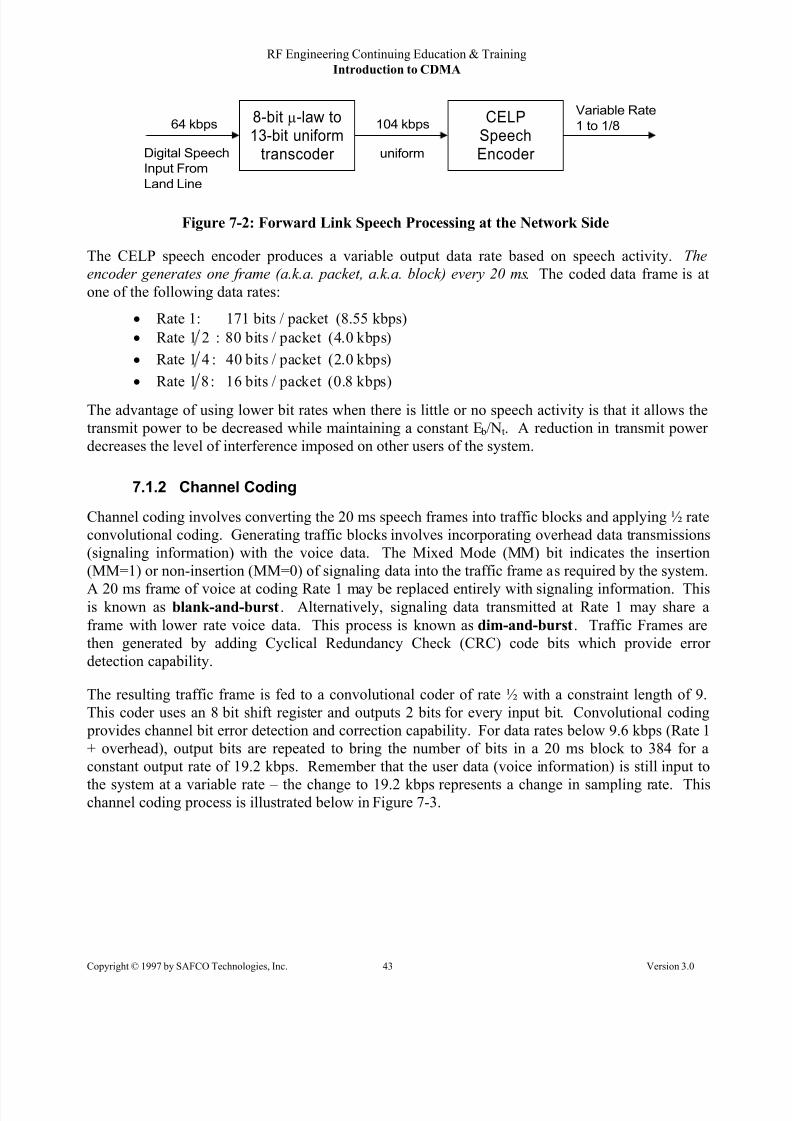
The CELP speech encoder produces a variable output data rate based on speech activity. The
encoder generates one frame (a.k.a. packet, a.k.a. block) every 20 ms. The coded data frame is at
one of the following data rates:
• Rate 1: 171 bits / packet (8.55 kbps)
• Rate 21 : 80 bits / packet (4.0 kbps)
• Rate 41 : 40 bits / packet (2.0 kbps)
• Rate 81 : 16 bits / packet (0.8 kbps)
The advantage of using lower bit rates when there is little or no speech activity is that it allows the
transmit power to be decreased while maintaining a constant E b/Nt. A reduction in transmit power
decreases the level of interference imposed on other users of the system.
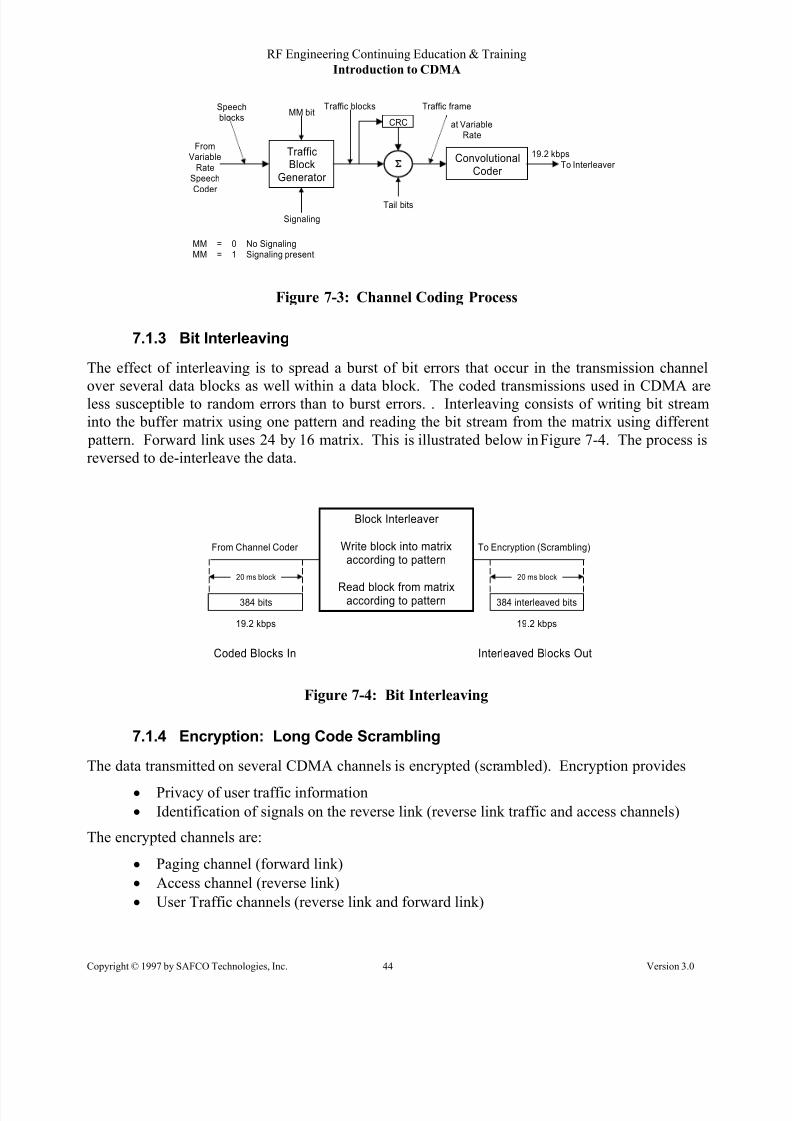
7.1.2 Channel Coding
Channel coding involves converting the 20 ms speech frames into traffic blocks and applying ½ rate
convolutional coding. Generating traffic blocks involves incorporating overhead data transmissions
(signaling information) with the voice data. The Mixed Mode (MM) bit indicates the insertion
(MM=1) or non-insertion (MM=0) of signaling data into the traffic frame as required by the system.
A 20 ms frame of voice at coding Rate 1 may be replaced entirely with signaling information. Thisis known as blank-and-burst. Alternatively, signaling data transmitted at Rate 1 may share a
frame with lower rate voice data. This process is known as dim-and-burst. Traffic Frames are
then generated by adding Cyclical Redundancy Check (CRC) code bits which provide error
detection capability.
The resulting traffic frame is fed to a convolutional coder of rate ½ with a constraint length of 9.
This coder uses an 8 bit shift register and outputs 2 bits for every input bit. Convolutional coding
provides channel bit error detection and correction capability. For data rates below 9.6 kbps (Rate 1
+ overhead), output bits are repeated to bring the number of bits in a 20 ms block to 384 for a
constant output rate of 19.2 kbps. Remember that the user data (voice information) is still input to
the system at a variable rate – the change to 19.2 kbps represents a change in sampling rate. Thischannel coding process is illustrated below in Figure 7-3.
The effect of interleaving is to spread a burst of bit errors that occur in the transmission channel
over several data blocks as well within a data block. The coded transmissions used in CDMA areless susceptible to random errors than to burst errors. . Interleaving consists of writing bit stream
into the buffer matrix using one pattern and reading the bit stream from the matrix using different
pattern. Forward link uses 24 by 16 matrix. This is illustrated below in Figure 7-4. The process is
reversed to de-interleave the data.
Block Interleaver
Write block into matrixaccording to pattern
Read block from matrixaccording to pattern384 bits 384 interleaved bits
From Channel Coder
20 ms block
19.2 kbps 19.2 kbps
20 ms block
To Encryption (Scrambling)
Coded Blocks In Interleaved Blocks Out
Figure 7-4: Bit Interleaving
7.1.4 Encryption: Long Code Scrambling
The data transmitted on several CDMA channels is encrypted (scrambled). Encryption provides
• Privacy of user traffic information
• Identification of signals on the reverse link (reverse link traffic and access channels)
The encrypted channels are:
• Paging channel (forward link)
• Access channel (reverse link)
• User Traffic channels (reverse link and forward link)
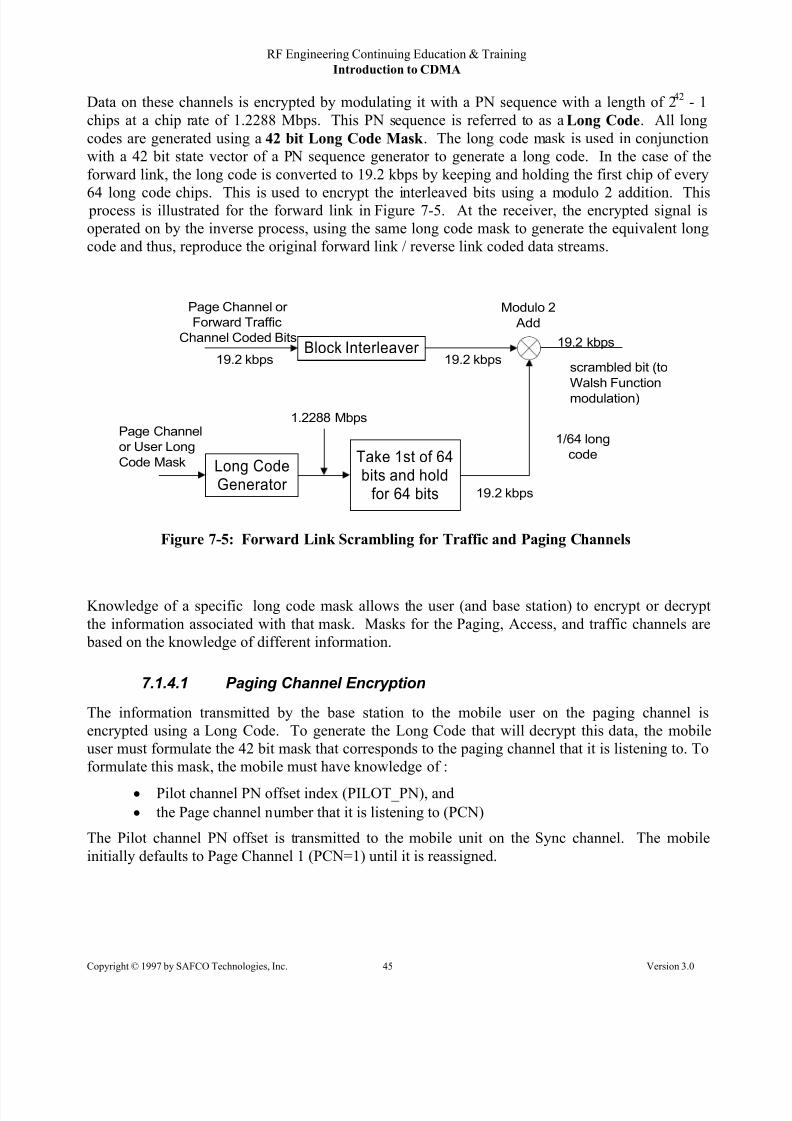
Data on these channels is encrypted by modulating it with a PN sequence with a length of 242
- 1
chips at a chip rate of 1.2288 Mbps. This PN sequence is referred to as a Long Code. All long
codes are generated using a 42 bit Long Code Mask . The long code mask is used in conjunction
with a 42 bit state vector of a PN sequence generator to generate a long code. In the case of the
forward link, the long code is converted to 19.2 kbps by keeping and holding the first chip of every
64 long code chips. This is used to encrypt the interleaved bits using a modulo 2 addition. This process is illustrated for the forward link in Figure 7-5. At the receiver, the encrypted signal is
operated on by the inverse process, using the same long code mask to generate the equivalent long
code and thus, reproduce the original forward link / reverse link coded data streams.
Block Interleaver
Page Channel or
Forward Traffic
Channel Coded Bits
19.2 kbpsscrambled bit (to
Walsh Function
modulation)
19.2 kbps
19.2 kbps
Long CodeGenerator
Take 1st of 64bits and hold
for 64 bits
Page Channel
or User Long
Code Mask
19.2 kbps
1/64 long
code
1.2288 Mbps
Modulo 2
Add
Figure 7-5: Forward Link Scrambling for Traffic and Paging Channels
Knowledge of a specific long code mask allows the user (and base station) to encrypt or decrypt
the information associated with that mask. Masks for the Paging, Access, and traffic channels are
based on the knowledge of different information.
7.1.4.1 Paging Channel Encryption
The information transmitted by the base station to the mobile user on the paging channel is
encrypted using a Long Code. To generate the Long Code that will decrypt this data, the mobile
user must formulate the 42 bit mask that corresponds to the paging channel that it is listening to. To
formulate this mask, the mobile must have knowledge of :
• Pilot channel PN offset index (PILOT_PN), and
• the Page channel number that it is listening to (PCN)
The Pilot channel PN offset is transmitted to the mobile unit on the Sync channel. The mobile
initially defaults to Page Channel 1 (PCN=1) until it is reassigned.
Conversely, a “0” power control bit requests the mobile to increase its power by 1 dB. This
signaling format allows the mobile unit output power to be changed 800 times per second.
Replace 2
consecutive input
bits by one power
control bit every
1.25 ms
Forward TrafficScrambled Interleaved
Output Bits
19.2 kbps
1/64 long
code
19.2 kbps
Walsh Function
Wi
1.2288 Mbps
Power Control
Bits
800 bps
To Quadrature
Spreading &
Carrier
Modulation
Figure 7-6: Power Control Signaling Subchannel
7.1.5.2 Forward Link Base Station Transmit Power Control
As mentioned previously, voice data is coded at varying rates based on the level of speech activity.The base station seeks to transmit signals at a constant Energy per Bit (E b). Since the bit rate isvarying, data coded at a high rate (Rate 1) must be transmitted at a higher power than data coded ata lower rate (e.g. Rate 1/8) in order to maintain a constant E b.
Forward link transmit power control accomplished using a Variable Attenuator which isimplemented immediately following Walsh function modulation as shown in Figure 7-8. Thetransmit power attenuation level vs. Voice encoding data rate is given in Table 7-1. Reducingtransmit power in this manner reduces the interference introduced into the system.
Figure 7-7: Forward Link Base Station Transmit Power Control
Table 7-1: Base Station Transmit Power vs. Data Rate
Voice Coding RateData Rate (R b) kbps
(per IS-95) Base Station Transit Power
Attenuation Level (dB)
19.6
0
214.8
3
41
2.4
6
811.2
9
7.1.6 Quadrature Spreading & Carrier Modulation
After the appropriate Walsh function modulation (spreading) is performed, the pilot, paging, andtraffic channels are summed together. The composite signal is then spread in quadrature bydividing the signal in quadrature and phase modulating the I and Q channels with a “short code” of
length 215 chips at a chip rate of 1.2288 Mbps. Note that this sequence repeats every 26.66 ms. TheBinary “0” and “1” for the I and Q channels are mapped according to phase states as specified inTable 7-2. This process result in a QPSK modulated signal with a bandwidth of 1.2288 MHz.
The CELP speech encoder produces a variable output data rate based on speech activity. The coder
generates one frame, or packet, every 20 ms. The available output rates are:
• Rate 1: 171 bits / packet (8.55 kbps)
• Rate 21 : 80 bits / packet (4.0 kbps)
• Rate 41 : 40 bits / packet (2.0 kbps)
• Rate 81 : 16 bits / packet (0.8 kbps)As with the forward link, the advantage of using lower bit rates when there is little or no speech
activity is that it limits the amount of extraneous information transmitted. Decreasing the bit rate
allows the transmit power to be reduced while maintaining a constant E b/Nt resulting in less
interference imposed on other users of the system.
7.2.2 Channel Coding
The channel coding process for the reverse link is identical to that on the forward link with the
exception of the convolution coding rate. Channel coding involves converting the 20 ms speech
frames into traffic blocks and applying 1/3 rate Convolutional coding. Generating traffic blocks
involves incorporating overhead data transmissions (signaling information) with the voice data.The Mixed Mode (MM) bit indicates the insertion (MM=1) or non-insertion (MM=0) of signaling
data into the traffic frame as required by the system. A 20 ms frame of voice at coding Rate 1 may
be replaced entirely with signaling information. This is known as blank-and-burst. Alternatively,
signaling data transmitted at Rate 1 may share a frame with lower rate voice data. This is known as
dim-and-burst. Traffic Frames are then generated by adding Cyclical Redundancy Check (CRC)
code bits that provide error detection capability.
The resulting traffic frame is fed to a convolutional coder of Rate 1/3 with a constraint length of 9.
This coder uses an 8 bit shift register and outputs 3 bits for every input bit. Convolutional coding
provides channel bit error detection and correction capability. For data rates below 9.6 kbps (Rate 1
+ overhead), output bits are repeated to bring the number of bits in a 20 ms block to 576 for aconstant output rate of 28.8 kbps. Remember that the user data (voice information) is still input to
the system at a variable rate – the change to 19.2 kbps represents a change in sampling rate. This
channel coding process is illustrated below in Figure 7-3.
• User Traffic channels (reverse link and forward link)
Data on these channels is encrypted by modulating it with PN sequences with a length of 242
- 1
chips at a chip rate of 1.2288 Mbps. This PN sequence is referred to as a Long Code. All long
codes are generated using a 42 bit Long Code Mask . The long code mask is used in conjunction
with a 42 bit state vector of a PN sequence generator to generate a long code.
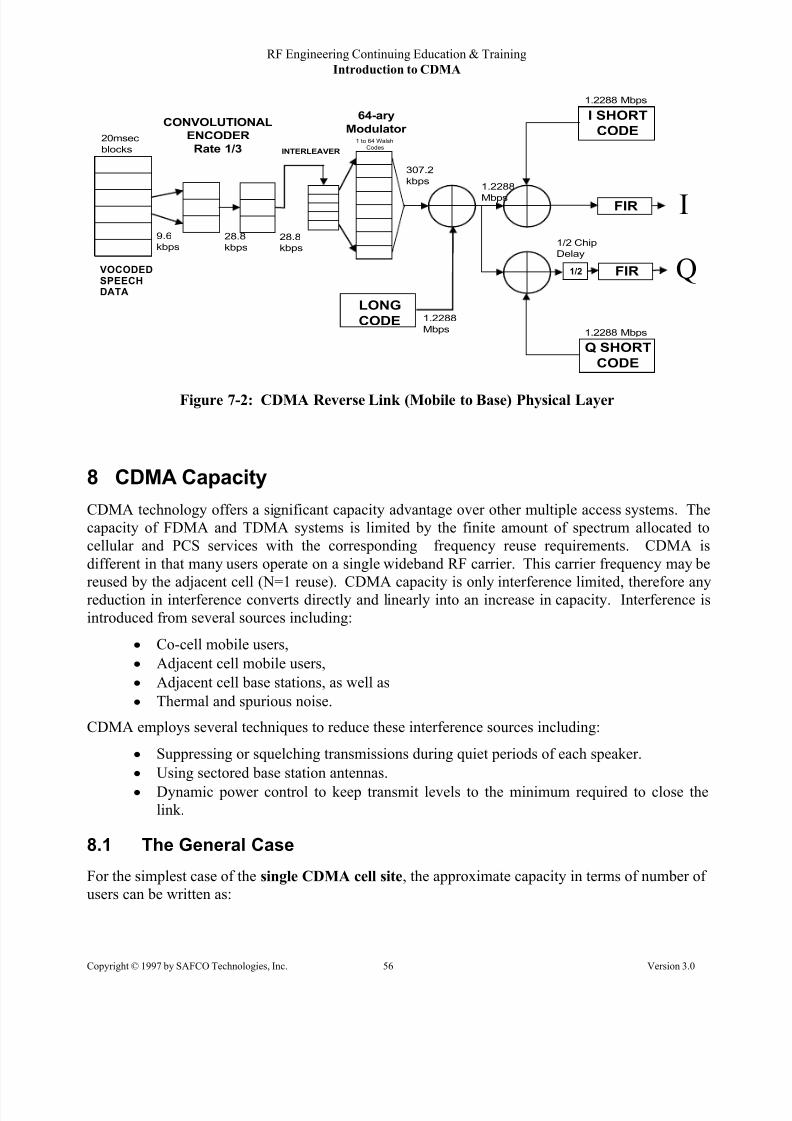
On the reverse link, The 64-ary modulated symbol at 307.2 kbps is modulated with the long code at
1.2288 Mbps. The output stream is encrypted (as well as spread) data at 1.2288 Mbps with 4 chips
for each 64-ary data bit within the symbol. This process is illustrated for the reverse link Traffic
Channel in Figure 7-5. At the receiver, the reverse link data is identified by the long code usedto encrypt it -- not a Walsh Function. The received signal is operated on by the inverse process,
using the same long code mask to generate the equivalent long code and thus, reproduce the original
Figure 7-2: CDMA Reverse Link (Mobile to Base) Physical Layer
8 CDMA Capacity
CDMA technology offers a significant capacity advantage over other multiple access systems. The
capacity of FDMA and TDMA systems is limited by the finite amount of spectrum allocated to
cellular and PCS services with the corresponding frequency reuse requirements. CDMA is
different in that many users operate on a single wideband RF carrier. This carrier frequency may be
reused by the adjacent cell (N=1 reuse). CDMA capacity is only interference limited, therefore anyreduction in interference converts directly and linearly into an increase in capacity. Interference is
introduced from several sources including:
• Co-cell mobile users,
• Adjacent cell mobile users,
• Adjacent cell base stations, as well as
• Thermal and spurious noise.
CDMA employs several techniques to reduce these interference sources including:
• Suppressing or squelching transmissions during quiet periods of each speaker.
• Using sectored base station antennas.
• Dynamic power control to keep transmit levels to the minimum required to close the
link.
8.1 The General Case
For the simplest case of the single CDMA cell site, the approximate capacity in terms of number of
co-frequency) transmissions. This number of users at which this condition occurs is known as the
Pole Point.
8.4 The Pole Point Equation
The pole point equation estimates the maximum number of traffic channels that may be assigned toa single CDMA base station (or sector) on a single carrier frequency. This equation includes the
effects of sectorization, voice activity, and adjacent cell interference.
Equation 8-1: Pole Point Equation
#ofTCEs at Pole Point = ++
11
( )
( )( )( )(
W R
I VAF E N Gb
ADJ b t s)
where:
W = The Spread Bandwidth in Chips/sec = 1.2288 x 10⁶ for IS-95 derivatives,
R b = The Information Bit Rate = 14.4 x 10
3
bps (IS-95-A), (9.6 kbps for IS-95)IADJ = The additional interference contributed by adjacent cells = 0.6,
VAF = Voice Activity Factor = 0.5,
E b/Nt = Minimum E b/Nt required (after despreading) to provide specified voice quality,
Gs = Sectorization Gain
= 1 for omni cells
= 1.18 (that is 3/2.55) for 3-sector cells
To explain these variables further,
• The spread bandwidth (W) is the actual number of chips transmitted on the RF channel after the
data signal is spread by a direct sequence technique, as it is in IS-95 and PCS derivatives.
• The information bit rate (R b) is the channel information bit rate, including both the voice
channel and system overhead bits to support a single voice channel
• The additional interference contributed by adjacent cells (IADJ) is an adjustment factor that has
been stated by equipment vendors to be the nominal amount of extra system-generated noise
contributed by adjacent cells. This is stated as a fraction of the noise generated by the cell
under consideration. In other words, 0.6 means that Nt (neglecting the No component) is 160%
of that which would be observed if a cell is operating in total isolation. This factor is a function
of cell loading, propagation characteristics, and voice activity factor.
• The voice activity factor (VAF) is the fraction of the time that a person is actually speaking (and
transmitting full-rate data) during an average conversation. If a person spends 50% of the time
• Minimum E b/Nt is the E b/Nt required to maintain a 1% frame error rate, that which has been
specified as the minimum acceptable to maintain call quality. This is normally expressed as a
linear energy ratio, not in dB.
• Sectorization gain (Gs) is somewhat similar to the additional interference contributed by
adjacent cells except that it is a factor to describe the noise introduced by adjacent sectors within the same cell. In other words, it is intended to adjust for the fact that sectorizing a cell
does not quite increase the available number of TCEs available at a 3 sector cell by a factor of 3.
For the assumptions stated previously, the # of TCEs at Pole Point = 19.09, or 19 when truncated to
the next lower integer
It is important to note that pole point is expressed per sector, not per cell.
It is also possible to show that the accuracy of the closed loop power control plays a part in the pole
point, as it affects the ratio of the desired signal's power to the total noise. The pole point equation
shown above assumes that perfect power control is maintained. At this time, the specifications isfor ±2.5dB which results in a 20% reduction in the available maximum number of TCEs
2.
9 CDMA Handoff
A CDMA cellular network handles mobile unit call processing transitions more subtly than the
other technologies used for mobile communications networks. CDMA Handoffs require that the
mobile unit maintain an ongoing list of possible base station sites that it may use for Handoffs as it
travels through the system. CDMA offers the unique feature of allowing mobile users to process
signals from multiple (up to 3) base stations simultaneously. The terminology and various types of Handoffs associated with CDMA are described below.
9.1 Handoff Terminology
Handoffs are initiated and terminated as a result of the pilot signal strength as measured by the
mobile unit in terms of Ec/Nt (Energy per chip to Total Noise). The parameters and classifications
associated with CDMA Handoffs are provided below.
9.1.1 Introduction to TADD, TDROP & TCOMP
TADD is the value of the Pilot signal strength, Ec/Nt, in dB received by the mobile unit at which themobile will recognize the cell/sector as a possible contributor to the call processing activities.
Values provided by vendors are typically on the order of -13 dB.
2Reference Robert Padovani, “Reverse Link Performance of IS-95 Based Cellular Systems,” IEEE Personal
The following is a example of a possible cellular call in a CDMA system. The example describes:
• Initial system access
• Call initiation and setup,
• Soft Handoff, and
• Call termination.
10.1 Initial System Access
When the mobile is first turns on, it must find the best base station with which to communicate.
The mobile unit tunes its receiver to a specified “primary” CDMA carrier frequency (Note that
detailed CDMA frequency planning is not addressed in this document). The mobile then scans for
available pilot signals, which are all on different time offsets of the same PN short (215
chips) code.
This acquisition process is similar to what takes place in an analog system where the mobile scans
the control channels and selects the strongest one. The scanning process is made somewhat easier
since the timing of any base station is always an exact multiple of 64 system clock cycles (chips)offset from any other base station. The mobile selects the strongest pilot sequence and establishes
frequency and time reference with this signal. If the mobile does not detect any pilot signals of
adequate strength, the unit tunes its receive to another specified CDMA carrier frequency
The mobile then demodulates the sync channel which is always transmitted on Walsh 32. The Sync
Channel provides master clock information by sending the state of the 42 bit shift register, which
generates the long (242
chips) code, 320 ms in the future. The long code, generated in conjunction
with a private user mask, is used for encryption and decryption. The mobile then starts listening to
the paging channel and waits for a page directed to its phone number.
10.2 Call Initiation and Setup
The mobile user then decides to make a call and enters the desired phone number. This initiates an
access probe. The mobile uses the access channel and attempts to contact the serving base station.
Since no traffic channel has been established, the mobile uses open loop power control. Multiple
tries are allowed at random times to avoid collisions that can occur on the access channel. Each
successive attempt is made at a higher power level. After each attempt, the mobile listens to the
paging channel for a response from the base stations. Once the access request has been received by
the base station, the base station responds with an assignment to a traffic channel (Walsh code).
The base station initiates the land link, and conversation takes place.
10.3 Soft Handoff
During the call the mobile finds another base station with pilot power received at the mobile
adequate to service the call (above the TADD threshold for that cell). The mobile unit makes a
request to its serving cell to initiate a soft Handoff with the additional cell. The base station passes
this request to the MSC. Contingent on some other factors (requested site availability, system, etc.)
the MSC will approve the request for handoff. The MSC then contacts the second base station and
gets a Walsh (traffic channel) assignment. The assignment is sent to the mobile by the first base
station. The land link is connected to both base stations. The mobile coherently combines the
signals from both base stations using the two pilot signals as coherent phase (time) references. On
the reverse link, the MSC examines the signals from each base station and the best 20 ms frame is
selected based on the Frame Error Rate.
At this point, closed-loop power control is conducted by both base stations. In this case, the mobile
will increase its power only if both stations request it. However if any one serving base station
requests a decrease, the mobile will decrease its power. As the signal from the first base station
degrades (drops below the TDROP threshold), the mobile will ask that the Soft Handoff be
terminated. The mobile sends a drop request for the first cell and the MSC then discontinues its
transmission and reception from that cell.
10.4 Call Termination
Call termination can be initiated either from the mobile or the land side. In either case the
transmissions are stopped, the Walsh code is freed, and the land line connection is broken. Themobile unit resumes monitoring the page channel of the current serving cell.
11 Basic System Engineering Issues
The properties of CDMA require that the design guidelines of conventional AMPS or GSM systems
be modified to accommodate the addition of the noise floor (Nt), the constructive benefits
associated with multipath as variables that effect system performance, as well as the non-
symmetrical relationship between the forward and reverse links. There are some basic concepts that
need to be kept in mind when engineering a CDMA system that are not applicable to the other technologies.
1. The coverage provided by CDMA system is not static. As the loading on a given
base station changes, the coverage provided by that base station changes
inversely. Otherwise stated; just because you have great RF coverage doesn’t
guarantee good signal.
2. Holes in coverage may result when there is either insufficient or abundant levels
of RF. System coverage is measured as the ratio of desired signal to all other
signals and that the ratio can be unacceptable regardless of the absolute quantity.
3. CDMA systems allow for the non-symmetrical simultaneous processing of a call by multiple base stations. The energy in the forward link is summed to a greater
strength than the individual components. The reverse link employs the shotgun
effect in that multiple base stations will receive the transmitted signal and the
probability that the signal will be acceptable for at least one of them is greatly
increased.
4. Traffic engineering in a CDMA system requires that in addition to all of the
factors associated with engineering a FDMA or TDMA system, the element of
time also be introduced. PN Offset Planning for a CDMA system requires the
careful assignment of 512 available time offsets to the cells/sectors in a system.
11.1 Propagation Modeling of the Wideband CDMA RF signal
Modern RF engineering must rely on accurate and reliable EM wave propagation models. The
foundations of good propagation models are well-established theory, statistical analysis and ability
to be modified by measured data. The question to ask is: can we use existing narrow-band signal
propagation model to design wideband CDMA system?
A RF signal propagating through wireless medium arrives at the receiver distorted as a result of
different propagation paths. These paths are caused by a scattering, reflection and diffraction from
either a natural or man made structure existing over the propagation area. In addition, the received
signal reaches the receiver significantly attenuated due to the propagation loss phenomena. In
theoretical modeling of the propagation loss we can determine two separate loss mechanisms.
The first one is the signal level decay due to the dispersion of the energy in space, absorption of the
ground and foliage and effects of the ground reflection. This phenomenon defines mean power pathloss. In addition to mean power path loss, existing terrain features as well as large man made
structures impose additional variations of the signal commonly referred to as slow or long-term
fading. The statistical distribution of the long-term fading has been studied extensively and it can
be modeled as additional loss having normal zero mean normal distribution in the logarithmic
domain. For that reason the long-term fading is frequently called log normal fading.
Multipath propagation causes large signal strength variations over distances comparable with signal
wavelength. These large variations are commonly termed short term or fast fading. Due to the fast
fading, the envelope of the received signal has a statistical distribution that is often model by
Rayleigh density function [1].
Theoretical analyses described above, assumes a signal bandwidth which is relatively small in
comparison to the RF carrier frequency. In comparison to other cellular standards, IS-95 CDMA
has a considerably larger bandwidth. Study of the path loss characteristic for the wide-band signals
presented in [2] demonstrated that, provided the power spectrum density of the signal is
approximately flat, narrow-band path loss estimation are of sufficient accuracy as long as the
bandwidth of the signal is smaller than 66% of the carrier frequency. For the case of cellular IS-95
based CDMA systems this is certainly the case. In addition, due to its wide-band nature CDMA
signal has an inherent multipath fading resistance and for that reason fast fading is not as
pronounced as in the case of narrow-band signals.
Two most popular macroscopic propagation models are Lee’s Propagation Model and Hata-
Okumura Propagation Model. As it is shown in [3], Lee’s Model is valid for 1900 MHz band, too.
Although Hata-model is developed for frequencies from 150 and 1500 MHz, there is a separate
version for 1500 to 2000 MHz band called COST-231.
Link budget analysis examines all gains and losses present in the radio path between a transmitter
and a receiver. In order for a system to operate properly, both forward and reverse links have to
satisfy power and quality requirements. Balancing the forward and reverse link budget for a
CDMA system takes into consideration: traffic load in a particular system, various hardwarelimitations, equipment characteristics, signal quality requirements, required coverage reliability and
type of propagation environment. The link budget analysis provides the maximum allowable path
loss that can be tolerated on the radio link and determines the extent of the cell coverage radius.
Due to the different processing schemes for six channel types defined by IS-95 standard, link
budget analysis must be examined separately for each channel type. Usually, analysis starts with
reverse link calculations using the expected traffic load as a main input parameter. The result is
maximal allowable path loss. Next step combines previously calculated maximal path loss and
receiver sensitivity to obtain the appropriate power allocation for each of the forward link channels.
This is illustrated in Table 11-2, which uses pre-calculated receiver sensitivity (see Table 11-1).
Detailed explanation of all aspects of link budget is given in ‘Unit C2: Intermediate CDMA Planing
and Design Issues’.
Table 11-1: Receiver Sensitivity for Different CDMA Channel Types
present configuration of the cell sites are known, the Link Budget is modified to accommodate the
cell specific capabilities. The cell parameters, nominal or otherwise, can be loosely translated into a
circular cell coverage area that meets the coverage minimum criteria for a balanced path. The edge
of the coverage circle is referred to as the nominal cell radii. The nominal cell radii shown in Table
11-1 refers to the expected cell radii for an assumed loading percentage, the propagation model
type, the nominal values for the propagation model, and the signal level which corresponds to adesired area coverage reliability.
Establishing the conditions necessary for Nominal Cell Radii Calculations requires knowledge of
statistics and propagation modeling which is provided in SAFCO’s “Introduction to Statistics,
Propagation Modeling, and the WIZARD
propagation Model” course and is not provided here.
The section below does, however, provide the process for the calculation once the conditions are
established.
Procedure for Calculating the Nominal Cell Radii with Example
• Based on a required signal level for a given performance level, a nominal cell radius can be
computed. The term nominal is used because the calculation process itself assumes a
homogenous terrain type with no effective antenna height gain. However, because we have
assumed a standard deviation in our link calculations the use of a prediction model to show
the desired coverage bands will in fact illustrate the desired coverage reliability we wish to
show.
• The steps to be followed in computing a nominal cell radius for coverage purposes as well
as required coverage bands.
1. Determine the application of the prediction model to the area type. Determine the
standard deviation that can be expected for a model that is optimized for the area where
the model will be used.
2. Determine a nominal cell configuration to be used (antenna radiation centerline, antennagain) as well as path loss slope and 1 mile intercept values,
3. Compute required area and boundary coverage reliability numbers and corresponding
Fade Margin,
4. Calculate a balanced path maximum path loss for the area type, application (in-building,
in-vehicle, and outdoors), and class of mobile or portable. Ensure all factors in the
reverse link and forward link have been accurately accounted for.
5. From the balanced path calculations, ensure that the TX power from the BS (we predict
the DL) is only large enough to represent a balanced path (what you display on screen
will in fact allow the mobile unit. The TX Power (dBm) maximum for a balanced path -
maximum path loss from link budget = received signal level (dBm) for the coverage type
desired.6. Using the antenna height, slope, 1 mile intercept, and the Lee model for the area type
calculate the maximum cell size for a homogenous area of the type specified. The
propagation model will adjust the predictions as the terrain profile is traversed with
candidate set contains the pilot PN offsets associated with all base stations (sectors) likely to be
candidates for soft Handoff. The neighbor set contains all pilot PN offsets for base stations close to
the mobile station. The remaining set contains all pilot PN offsets not included in the other three
sets.
PN offsets are selected based upon the relative time delay (signal travel time at the speed of light) between sites and exact served areas of those sites. The development of a PN offset plan depends
upon exact information on final site locations. There are 512 PN offsets available to allocate to
cells / sectors. Each PN offset is 64 chips. This ‘separation’ between pilots may be increased by
parameter PN-increment (i.e. if PN-increment is 2, separation between pilots is 128 chips and the
total number of pilots is 256).
Basic PN Offset Planning Strategy
In the mobile radio environment the signal transmitted from a BS and arriving at a mobile unit will
be from different paths as a result of the multipath reflection phenomenon. Since each path has a
different path length, the time of arrival for each path is different. This means that, for an impulse
transmitted from the BS, by the time the impulse is received at the MS it is no longer an impulse but
rather a pulse with a spread width which is referred to as the delay spread . Measured data indicates
that the mean delay spread value is different for different kinds of environments. This fact is
intuitive because of the increasing amount of multipath reflectors that are present in different
environments. The table below illustrates some representative numbers:
Table 11-1: Typical Delay Spread Values for Different Environment Types
EnvironmentExpected Range of DelaySpread (micro-seconds)
Heavy Mountains 1 - 100
Dense Urban 6 - 10
Urban 4 - 6
Suburban 2 - 4
Rural .2 - 2
In the above table a delay spread value of 6 microseconds means that a very narrow pulse (i.e. .1 µ
seconds) is transmitted, that the effective pulse width of the received signal is 6µ seconds. The
delay spread number normally, in most situations, refers to the width where the received signal
energy drops to 10 dB below the peak value of energy received. In practice, a single transmitted
pulse will result in a delay spread number which is extremely large, however, only a fraction of thetime is energy received which is usable, and this usable energy is normally defined to be within 10
dB of the peak.
The actual distribution of received pulses versus time will in most cases be a function of the
environment. In some regions an exponential decay versus time is appropriate, in others, a normal
distribution versus time may be appropriate. In the PN offset planning algorithm it is assumed that
the delay spread is symmetric about the center of the specified delay spread number. This means
that the delay spread distribution is more normal than exponential.
11.7 PN Interference
Since all pilot signals in a system are time-shifted versions of the same bit-sequence (short code), a pilot from any sector can appear to belong to any other sector. When receiver can not distinguish
pilots from different sectors, demodulation is erroneous and it is known as PN interference. There
are three types of PN interference:
• Co-PN interference – if there is no enough space separation (signal attenuation) between
cells that reuse PN offset.
• Adjacent PN offset interference – if there is no enough separation (signal attenuation)
between cells that have adjacent PN offsets (i.e. serving site has PN offset 100 and interferer
has a PN offset 101)
• Handoff confusion – interference to a neighbor set pilot (i.e. due to time delay, strong pilot
appear to be a strong neighbor list pilot: unnecessary handoff occurs)
11.8 Nominal Assignment of PN (RAKE) Search Window
The mobile station searches for Pilot code offsets which arrive inside of some nominal time frame
known as the PN or RAKE Search Window. The time frame assigned is determined by the time
dispersion of multipath and desirable speed of tracking the pilot quality. Each type of pilot set
(active, neighbor and remaining) has specific settings for RAKE Search Window size. The size of
Search Window is usually expressed in chips (i.e. 8, 10, 14, 20, …).
Generally, if RAKE Search Window is too small, multipath components will not be received (and
post-processed). In the other hand, if the RAKE Search Window is too big, receiver might be
confused by strong components of nearby pilots. This issue will be covered in ‘Intermediate