8
cmegroup.com
1
introduCtion
Dr. John Lintner, a Harvard Professor, presented the seminal paper entitled “The Potential Role of Managed Commodity – Financial Futures Accounts (and/or Funds) in Portfolios of Stocks and Bonds” at the annual conference of the Financial Analysts Federation in Toronto in May 1983. The findings of his work, namely that portfolios of equities and fixed income exhibit substantially less variance at every possible level of expected return when combined with managed futures, remain as true as ever more than 25 years later. In this brief paper, we attempt to update Professor Lintner’s work by demonstrating that the beneficial correlative properties of managed futures presented in his research persist today. We also reintroduce managed futures as a diverse collection of liquid, transparent hedge fund strategies that tend to perform well in environments that are often difficult for traditional and other alternative investments.
While many casual observers most closely associate managed futures and Commodity Trading Advisors with trend following, the reality is that the strategies and approaches within managed futures vary tremendously, and that the one common unifying theme is that these managers trade highly liquid, exchange-traded instruments and deep foreign exchange markets. As a result, the terms many fund managers choose to implement, including lock-ups, gates, side pockets, and penalties for early redemptions, rarely apply to investments in managed futures. Liquidity and transparency also
simplify risk management, and investing via separately managed accounts, a common practice among managed futures investors, mitigates the risk of fraud since investors retain custody of assets.
Trend following has demonstrated performance persistence over the more than 30 years since the first “turtle” strategies began trading, and many of the largest and best known CTAs employ variations of diversified trend following systems. These strategies should play a role in all well-diversified institutional portfolios, but they account for only one of many varieties of managed futures strategies, the vast majority of which exhibit no statistical relationship whatsoever with trend following programs. Counter-trend strategies attempt to capitalize on the often rapid and dramatic reversals that take place at the end of trends. Some quantitative traders employ econometric analysis of fundamental factors to develop trading systems. Others use advanced quantitative techniques such as signal processing, neural networks, genetic algorithms, and other methods borrowed and applied from the sciences.
Recent advances in computing power and technology as well as the increased availability of data have resulted in the proliferation of short-term trading strategies. These employ statistical pattern recognition, market psychology and other techniques designed to exploit persistent biases in high frequency data. The countless combinations and permutations of portfolio holdings that these trading managers may hold over a limited period of time also tend to result in returns that are not correlated to any other investment, including other short-term traders.
in this paper we attempt to update Professor Lintner’s work by demonstrating that the beneficial correlative properties of managed futures presented in his research persist today.
the countless combinations and permutations of
the portfolio holdings of these managers over a
limited period of time also tend to result in returns
that are not correlated to any other investment.

the Benefits of Managed Futures 25 Years Later
2
Exhibit 1:distribution of Pair-Wise Correlations Among Constituents in the Alternativeedge short-term traders index, January 2003 – october 2008
Exhibit 2:Correlation Matrix of traditional and Alternative investment Benchmarks
A useful analogy for different managed futures trading programs and styles, as well as for alternative investments in general, consists of thinking of each trading style or program as different radio receivers, each of which tunes into different market frequencies. Simply put, some strategies or styles tend to perform better or “tune in” to different market environments. The diverse and uncorrelated investments offered by managed futures allow institutional investors to access an entire universe of liquid transparent hedge fund strategies to add to their portfolios.
The long-term correlations among equities, fixed income and managed futures remain low even 25 years after Lintner’s study, suggesting its continuing relevance to investors interested in attaining the “free” benefits of diversification. Exhibit 2 illustrates the low and occasionally negative correlations among managed futures and other investments.
Freq
uen
cy
Pair-Wise CorrelationSources: AlphaMetrix Manager Database and Burghardt, Galen et al, Newedge Group
60
50
40
30
20
10
0-1.0 -0.9 -0.8 -0.7 -0.6 -0.5 -0.4 -0.3 -0.2 -0.1 0.0 0.1 0.2 0.3 0.4 0.5 0.6 0.7 0.8 0.9 1.0
btO
P 5
0 in
dex
S&
P 5
00
ind
ex
MS
Ci W
orld
Leh
man
bon
d
Com
pos
ite
US
ind
ex
Leh
man
bon
d
Com
pos
ite
Glo
bal
in
dex
GS
Ci t
R
DJ
AiG
Com
mod
ity
hFR
i Fu
nd
W
eigh
ted
ind
ex
hFR
Eq
uit
y h
edge
in
dex
LPx
bu
you
t in
dex
S&
P/C
itig
rou
p W
orld
R
Eit
tR
ind
ex
Alt
ern
ativ
eEd
ge S
tt
iBtoP 50 index 1.00
s&P 500 index (0.03) 1.00
MsCi World (0.07) 0.85 1.00
Lehman Bond Composite u.s. index 0.23 (0.18) (0.20) 1.00
Lehman Bond Composite Global index 0.22 0.19 0.19 0.88 1.00
GsCi tr 0.15 0.02 0.02 0.01 0.01 1.00
dJ AiG Commodity 0.21 0.08 0.21 0.03 0.10 0.88 1.00
HFri Fund Weighted index (0.03) 0.71 0.72 (0.11) 0.04 0.15 0.29 1.00
HFr equity Hedge index (0.02) 0.67 0.67 (0.10) 0.04 0.20 0.27 0.94 1.00
LPX Buyout index (0.25) 0.61 0.62 (0.21) (0.32) 0.01 0.07 0.62 0.59 1.00
s&P/Citigroup World reit tr index 0.03 0.45 0.46 0.10 0.20 (0.05) 0.11 0.41 0.35 0.46 1.00
Alternativeedge stti 0.32 (0.09) (0.01) 0.21 0.33 0.31 0.28 0.03 0.04 (0.32) (0.05) 1.00
sources: AlphaMetrix Alternative investment Advisors, Bloomberg, LPX GmbH. All statistics calculated to maximize number of observations, as such number of observations used for calculations varies (BtoP 50 - Jan 1987, s&P 500 - Jan 1980, MsCi World - Jan 1988, Lehman Bond Composite us index - sep 1997, Lehman Bond Composite Global index - Feb 1980, GsCi tr - Jan 1980, dJ AiG Commodity index - Feb 1991, HFr Fund Weighted index - 1990, HFr equity Hedge index - Jan 1990, LPX Buyout index - Jan 1998, s&P/Citigroup World reit tr index - Jan 1990). All statistics calculated through sep 2008 with the exception of the Lehman Bond indices, which are calculated through Aug 2008. the Alternativeedge stti begins in January 2003 and assumes equal weightings to 23 short-term traders, the constituents, defined as futures traders with an average holding period of less than 10 days. the constituents’ returns are actual, but the index returns are proforma. in instances where the track record for a program or programs had not yet commenced, its weighting is divided on a pro-rata basis among all other constituents.
cmegroup.com
3
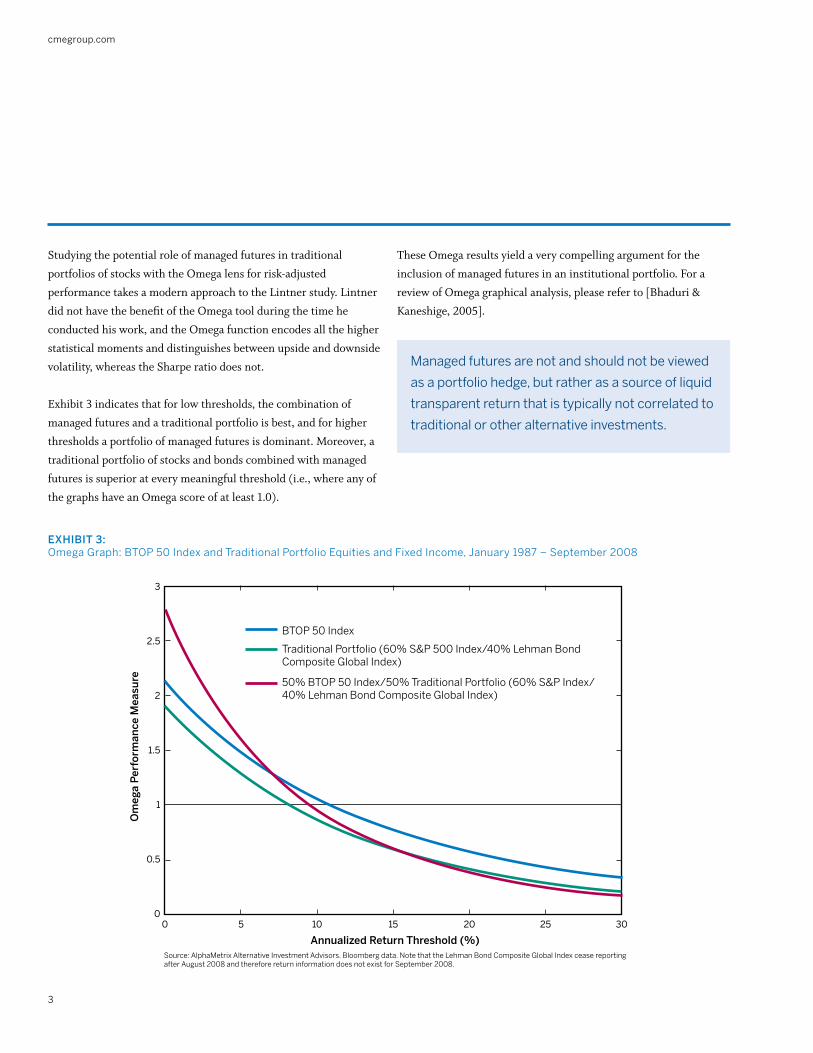
Exhibit 3:omega Graph: BtoP 50 index and traditional Portfolio equities and Fixed income, January 1987 – september 2008
Studying the potential role of managed futures in traditional portfolios of stocks with the Omega lens for risk-adjusted performance takes a modern approach to the Lintner study. Lintner did not have the benefit of the Omega tool during the time he conducted his work, and the Omega function encodes all the higher statistical moments and distinguishes between upside and downside volatility, whereas the Sharpe ratio does not.
Exhibit 3 indicates that for low thresholds, the combination of managed futures and a traditional portfolio is best, and for higher thresholds a portfolio of managed futures is dominant. Moreover, a traditional portfolio of stocks and bonds combined with managed futures is superior at every meaningful threshold (i.e., where any of the graphs have an Omega score of at least 1.0).
These Omega results yield a very compelling argument for the inclusion of managed futures in an institutional portfolio. For a review of Omega graphical analysis, please refer to [Bhaduri & Kaneshige, 2005].
Managed futures are not and should not be viewed
as a portfolio hedge, but rather as a source of liquid
transparent return that is typically not correlated to
traditional or other alternative investments.
3
2.5
2
1.5
1
0.5
00 5 10 15 20 25 30
Om
ega
Per
form
ance
Mea
sure
Annualized Return Threshold (%)Source: AlphaMetrix Alternative Investment Advisors. Bloomberg data. Note that the Lehman Bond Composite Global Index cease reporting after August 2008 and therefore return information does not exist for September 2008.
BTOP 50 Index
Traditional Portfolio (60% S&P 500 Index/40% Lehman BondComposite Global Index)
50% BTOP 50 Index/50% Traditional Portfolio (60% S&P Index/40% Lehman Bond Composite Global Index)

4
the Benefits of Managed Futures 25 Years Later
Although managed futures has often produced outstanding returns during dislocation and crisis events, it must be emphasized that managed futures are not and should not be viewed as a portfolio hedge, but rather as a source of liquid transparent return that is typically not correlated to traditional or other alternative investments. Some of the different approaches taken by managed futures managers tend to exploit the sustained capital flows across asset classes that typically take place as markets move back into
equilibrium after prolonged imbalances. Others thrive on the volatility and choppy price action which tend to accompany these flows. Others still do not exhibit sensitivity to highly volatile market environments and appear to generate returns independent of the prevailing economic or volatility regime. Exhibits 4 – 7 illustrate the performance of the BTOP 50 Index during periods that have historically been difficult for both the S&P 500 Index and most hedge fund strategies.
Exhibit 4:BtoP 50 vs. s&P 500 during s&P 500’s Worst Five drawdowns since 1987
Exhibit 5:Performance of the BtoP 50 index during 15 Worst Quarters of s&P 500 index Performance
Period Event S&P 500 index btOP 50 index Difference
Fourth Quarter 1987 Black Monday – Global stock Markets Crash -23.23% 16.88% 40.11%
third Quarter 2002 WorldCom scandal -17.63% 9.41% 27.05%
third Quarter 2001 terrorist Attacks on World trade Center and Pentagon -14.99% 4.12% 19.10%
third Quarter 1990 iraq invades Kuwait -14.52% 11.22% 25.74%
second Quarter 2002 Continuing Aftermath of technology Bubble Bursting -13.73% 8.52% 22.26%
First Quarter 2001 Bear Market in u.s. equities led by technology -12.11% 5.97% 18.08%
third Quarter 1998 russia defaults on debt, LtCM Crisis -10.30% 10.54% 20.84%
First Quarter 2008 Credit Crisis, Commodity Prices rally -9.92% 5.92% 15.84%
third Quarter 2008 Credit Crisis, Government-sponsored Bailout of Banks -8.88% -3.40% 5.48%
Fourth Quarter 2000 dotCom Bubble Bursts -8.09% 19.78% 27.87%
third Quarter 1999 Anxiety during run up to Y2K -6.56% -0.67% 5.89%
First Quarter 1994 Federal reserve Begins increasing interest rates -4.43% -2.10% 2.33%
Fourth Quarter 2007 Credit Crisis, subprime Mortgage Losses -3.82% 3.02% 6.84%
First Quarter 1990 recession in u.s., oil Prices spike -3.81% 1.76% 5.57%
First Quarter 2003 second Persian Gulf War -3.60% 4.68% 8.28%
source: Bloomberg
source: Bloomberg
10/07 – Present
8/00 – 9/02
5/90 – 10/90
6/98 – 8/98
8/87 – 11/87
8.46%
-30.17%
-15.84% -15.57%
-14.12%
13.79%
+38.95%
+5.62%
5.41%
BTOP 50 Index S&P 500 Index60%
50%
40%
30%
20%
10%
0%
-10%
-20%
-30%
-40%
-50%
BtoP 50 index
s&P 500 index

cmegroup.com
5
Exhibit 6:BtoP 50 vs. HFri Fund Weighted index during HFri Fund Weighted index’s Worst Five drawdowns since 1990
Exhibit 7:Performance of the BtoP 50 index during Worst ten Quarters of HFri Fund Weighted index Performance
Period Event hFRi Fund Weighted index btOP 50 index Difference
third Quarter 1998 russia defaults on debt, LtCM Crisis -8.80% 10.54% 19.34%
third Quarter 2008 Credit Crisis, Government-sponsored Bailout of Banks -8.14% -3.40% 4.74%
Fourth Quarter 2000 dotCom Bubble Bursts -6.39% 19.78% 26.17%
third Quarter 2002 WorldCom scandal -5.71% 9.41% 15.13%
First Quarter 2008 Credit Crisis, Commodity Prices rally -3.44% 5.92% 9.36%
Fourth Quarter 1997 Asian Crisis – devaluation of thai bhat, Malaysian ringgit -1.59% 4.17% 5.76%
Fourth Quarter 1994 tequila Crisis – Mexican Peso devaluation -1.30% 0.90% 2.19%
second Quarter 1998 Asian Crisis Continues – run on Bank of Central Asia -1.27% -1.58% -0.31%
second Quarter 2000 volatility increases as tech Bubble Approachs top -1.25% -4.01% -2.76%
second Quarter 2004 Federal reserve Begins increasing interest rates -1.05% -8.16% -7.11%
source: Bloomberg
source: Bloomberg
8/90 – 10/90
5/98 – 8/989/00 – 11/00
6/02 – 9/02
11/07 – Present
9.57%
7.58%
5.96%
17.39%
5.33%
-10.91%
-5.71%-6.39%
-11.42%
-5.38%
25%
20%
15%
10%
5%
0%
-5%
-10%
-15%
BtoP 50 index
HFri FundWeighted index

6
ConCLusion
better risk-adjusted performance (either through the mean-variance framework, or through the more modern Omega analysis). The results are so compelling that the board of any institution, along with the portfolio manager, should be forced to articulate in writing their justification in not having a substantial allocation to the liquid alpha space of managed futures.
It is also fitting that during the silver anniversary of Dr. Lintner’s fine work, it survived the ultimate litmus test through the historic financial meltdown of 2008. Managed futures have been one of the very few bright spots for investments (both alternative and traditional) during this recent crisis in the economy.
Indeed, one might argue that Dr. Lintner saved his very best work for last.
To contact the authors:
Ryan Abrams [email protected], Ranjan Bhaduri [email protected], Elizabeth Flores [email protected]
References:
1. Bhaduri, Ranjan and Bryon Kaneshige. “Risk Management – Taming the Tail.” Benefits & Pensions Monitor, December 2005.
2. Bhaduri, Ranjan and Christopher Art. “Liquidity Buckets, Liquidity Indices, Liquidity Duration, and their Applications to Hedge Funds.” Alternative Investment Quarterly, Second Quarter, 2008.
3. Bhaduri, Ranjan, Gunter Meissner and James Youn. “Hedging Liquidity Risk.” Journal of Alternative Investments, Winter 2007.
4. Bhaduri, Ranjan and Niall Whelan. “The Value of Liquidity” Wilmott Magazine, January 2008.
5. Burghardt, Galen et.al. “Correlations and Holding Periods: The research basis for the AlternativeEdge Short-Term Traders Index”. AlternativeEdge Research Note. Newedge Group, 9 June 2008.
6. Center for International Securities and Derivatives Markets (CISDM). “The Benefits of Managed Futures: 2006 Update.” Isenberg School of Management, University of Massachusetts, 2006.
7. Fischer, Michael S. and Jacob Bunge. “The Trouble with Trend Following.” Hedgeworld’s InsideEdge. 20 November 2007.
8. Keating, Con and William F. Shadwick. “A Universal Performance Measure.” The Finance Development Centre, 2002.
9. Lintner, John. “The Potential Role of Managed Commodity-Financial Futures Accounts (and/or Funds) in Portfolios of Stocks and Bonds.” The Handbook of Managed Futures: Performance, Evaluation & Analysis. Ed. Peters, Carl C. and Ben Warwick. McGraw-Hill Professional, 1996. 99-137.
10. Ramsey, Neil and Aleks Kins. “Managed Futures: Capturing Liquid, Transparent, Uncorrelated Alpha.” The Capital Guide to Alternative Investment. ISI Publications, 2004. 129-135.
* All charts, graphs, statistics and calculations were generated using data from Bloomberg, the Barclay Alternative Investment Database, LPX GmbH and the AlphaMetrix Manager Database.
The returns of many managed futures funds do not display correlation to traditional or alternative investments, nor to one another. Institutional investors should view managed futures not only as a means to enhance portfolio diversification, but also as liquid absolute return vehicles with intuitive risk management.
Sadly, Litner died shortly after presenting his treatise on the role of managed futures in institutional portfolios. It is remarkable just how solid his argument has remained over the past 25 years. The inclusion of managed futures in an institutional portfolio leads to a
Managed futures offer institutional investors actively managed exposure to a truly global and diversified array of liquid, transparent instruments.
the results are so compelling that the board of any
institution, along with the portfolio manager, should
be forced to articulate in writing their justification
in not having a substantial allocation to the liquid
alpha space of managed futures.
the Benefits of Managed Futures 25 Years Later
CME Group hEadquartErs
20 south Wacker drive Chicago, illinois 60606cmegroup.com
New York212 299 2000
London+44 20 7796 7100
são paulo+55 11 2565 5999
houston713 658 9292
singapore+65 6593 5555
Washington d.C.202 638 3838
tokyo+81 3 5403 4828
CME Group rEGIoNaL offICEs
[email protected] 331 3332312 930 1000
ir235/1M/0310
the Globe logo, CMe, Chicago Mercantile exchange, CMe Group, Globex, e-mini and CMe ClearPort are trademarks of Chicago Mercantile exchange inc. CBot and Chicago Board of trade are trademarks of the Board of trade of the City of Chicago. nYMeX and new York Mercantile exchange are trademarks of new York Mercantile exchange, inc. CoMeX is a trademark of Commodity exchange, inc. All other trademarks are the property of their respective owners. Further information about CMe Group and its products can be found at www.cmegroup.com. the information within this brochure has been compiled by CMe Group for general purposes only. CMe Group assumes no responsibility for any errors or omissions. Although every attempt has been made to ensure the accuracy of the information within this brochure, CMe Group assumes no responsibility for any errors or omissions. Additionally, all examples in this brochure are hypothetical situations, used for explanation purposes only, and should not be considered investment advice or the results of actual market experience. All matters pertaining to rules and specifications herein are made subject to and are superseded by official CMe, CBot and CMe Group rules. Current rules should be consulted in all cases concerning contract specifications.
Copyright © 2010 CMe Group. All rights reserved.


![Untitled-2 [perforatordirectory.api.org]perforatordirectory.api.org/links/5928_1.pdf · 0.41 0.41 0.02 No 21 Truda Stevens - QSD Third Party Self ... Untitled-2 Author: chris.pool](https://static.documents.pub/doc/80x56/5ac5a9f27f8b9a2b5c8dbfe5/untitled-2-041-002-no-21-truda-stevens-qsd-third-party-self-untitled-2.jpg)


