43 Egypt. J. Chem. 59, No. 5, pp. 701-718 (2016)
Characterization of Eu(III) Complex for Determination of Bumetanide in Pharmaceutical Preparations and in Biological Fluids
M. M. Abd-Elzaher1*, Mona. A. Ahmed
2, A. B. Farag
3,
M.S. Attia 4, A. O. Youssef
4 and Sh. M. Sheta
1
1Inorganic Chemistry Department, National Research
Centre, 33, El-Behouth St., Dokki, Giza, 2Department of
Chemistry, College of Women for Art, Science and Education, Ain Shams University, Cairo,
3Department of
Chemistry, Faculty of Science, Helwan University, Helwan and
4Department of Chemistry, Faculty of Science, Ain
Shams University, Cairo, Egypt.
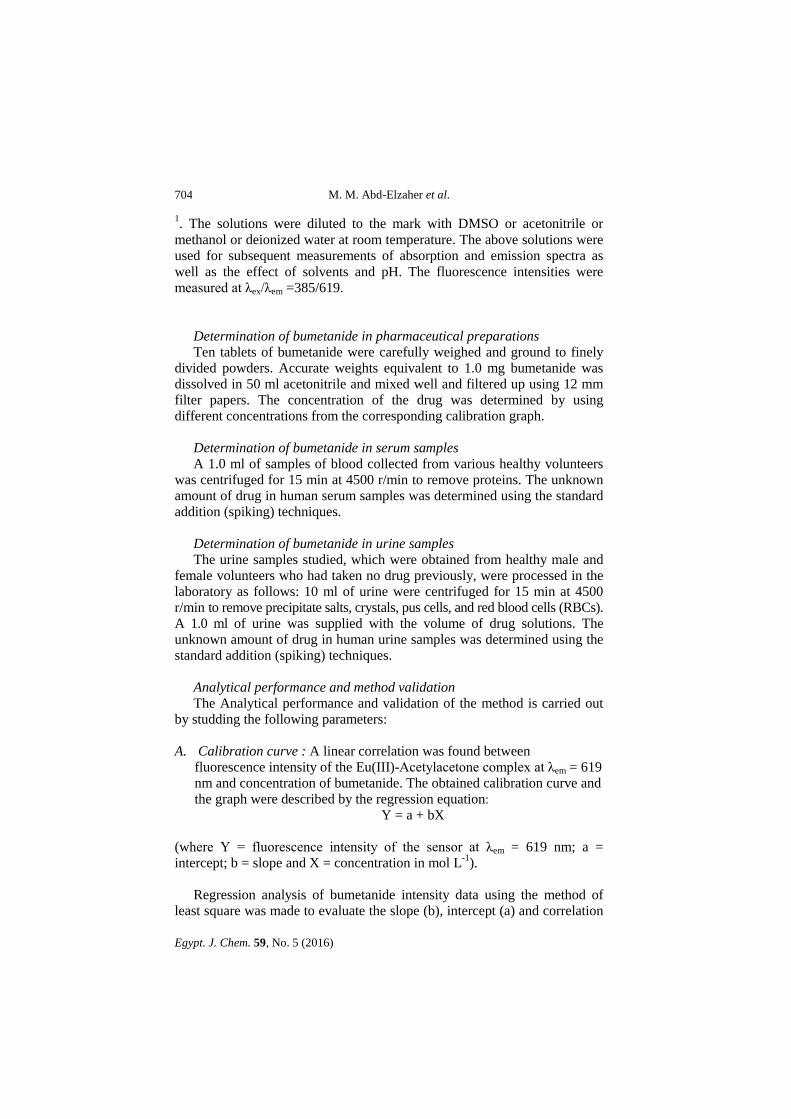
U(III)-Acetylacetone complex 1 was prepared and characterized
by elemental analysis, UV/Vis, IR, 1H-NMR spectroscopy,
conductance and magnetism. The spectral results indicated that the
composition of this complex is [Eu(acac)2(NO3)(EtOH)2(H2O)2].We
development simple, sensitive and selective spectrofluorimetric
method for the determination of trace amounts of bumetanide in
pharmaceutical tablets and biological fluids (serum and urine) using
complex 1. The bumetanide can remarkably enhance the fluorescence
intensity of the complex in acetonitrile at λex/Em = 385/619 nm and
pH 7.1. The dynamic ranges for the determination of bumetanide
concentration were found from 1 x 10-11 to 1 x 10⁻⁴ mol L-1, and the
limit of detection (LOD) and quantitation limit of detection (LOQ)
are 1.6 ×10⁻¹⁰ and 3.2 x 10⁻⁹ mol L-1, respectively.
Keywords: Acetylacetone, Europium, Complex, Characterization,
Bumetanide, Spectrofluorimetric, Fluorescence
intensity.
Bumetanide [chemical name: 3-Butylamino-4-phenoxy-5-
sulphamoylbenzoic acid] (Fig. 1) is considered one of loop diuretic group
and used in the treatment of hypertension, and oedema associated with heart
failure and with renal and hepatic disorders(1-3)
.
E
M. M. Abd-Elzaher et al.
Egypt. J. Chem. 59, No. 5 (2016)
702
Fig. 1. Chemical structure of bumetanide.
A marked dieresis is additionally associated to loss of weight (rapidly
lower body weight), so it's abused in sports that weight classes are
concerned. Fast and intense dieresis hides the ingestion of other doping
drugs by dilution of their concentration in urine samples (4)
. The World
Anti-Doping Agency (WADA) (Medical Commission of the International
Olympic Committee) has forbidden the use of bumetanide in 1986 for this
reason (5)
.
Due to clinical wide use of bumetanide, different analytical methods to
determine bumetanide in pharmaceuticals preparations and biological fluids
have been improved (6, 7)
. The methods like spectrophotometry (8, 9)
,
variable-angle scanning fluorescence spectrometry (10)
, spectrofluorimetry
(11- 12) , potentiometry
(13) , voltammetry
(14) and chromatography
(15 - 17) . were
used. However, most of these methods are time-consuming and technically
demanding and So, we need an alternative method simple, low-cost,
sensitive and rapid for the determination of bumetanide in pharmaceuticals
preparations and biological samples.
The europium complexes are very important, because of the saturated
red emission resulting from emitting strong fluorescence arising from f– f
hyper sensitive transition with a large Stokes shift and long lifetime (18)
. The
distinguished properties of the europium complexes enabled the
development of a fluorescence chemical sensor with high sensitivity.
According to Laporte rule, the 4f– 4f transitions in rare earth ions are
forbidden to some extent; so the absorption and emission spectra observed
in the Eu(III) ions have always weak intensity. The excited states of the
Eu(III) ions may increase by its coordination to organic ligands, which act
as sensitizers, and the ligands that have this property are called by Lehn
Characterization of Eu(III) Complex For Determination …
Egypt. J. Chem. 59, No.5 (2016)
703
“ antennas” (19)
. The organic ligand in Eu(III)-complex absorbs and
transfers energy efficiently to the metal ion and increases its luminescence
intensity consequently.
In this article an Eu(III)-acetylacetone complex 1 was prepared and
characterized using different spectroscopic techniques, then used in
determination of bumetanide in pharmaceuticals and biological samples
(serum and urine).
Experimental
Chemicals and reagents
All chemicals used were of analytical reagents grade obtained from
Aldrich Chemical Company (USA). The drug standard (bumetanide) was
obtained from Sigma-Aldrich. The pharmaceutical preparations containing
the drugs obtained from local drug stores. Urine and serum samples were
obtained from healthy volunteers during morning hours.
Instruments Elemental analyses were carried out in Cairo University, Egypt. The IR
spectra of the ligand and solid complex were recorded as KBr discs using
JASCO FT/IR-460 infrared spectrophotometer. The electronic spectra (200-
900nm) were carried out using a Perkin-Elmer 550 spectrophotometer. The 1H-NMR spectra in deutrated dimethylsulfoxid (DMSO) as a solvent and
were recorded on Gemini-300 MHz NMR spectrometer. The molar
conductance of 10-3
M solution of metal complex in DMSO was measured
on a dip cell and a Bibby conductimeter MC1 conductivity meter model. A
magnetic measurement of the solid complex was measured at room
temperature using Gouy’ s method by a magnetic susceptibility balance
from Johnson Metthey and Sherwood model. The fluorescence
measurements were carried out on a Shimadzu RF5301
spectrofluorophotometer in the range 290– 750 nm.
Procedures General procedure
Eu(III)-Acetylacetone complex 1, was synthesized by mixing 20 ml
aliquot of 1×10⁻²
M of the ligand with a 10 ml aliquot of 1×10⁻²
M Eu(III)
nitrate (2:1 ligand to metal molar ratio) with stirring. The mixture was
refluxed at about 80oC for two hours; then the mixture was cooled to 0
oC.
The resulting precipitate of the complex 1 is greenish yellow; the resulting
precipitate of the complex was filtered off, and washed.
To 10 ml clean measuring flasks, the standard solution of bumetanide
was prepared by different additions of 1 x 10⁻³
mol L-1
drug stock solution
to give the following concentrations of the drug, 1 x 10⁻⁴
to 1 x 10-12
mol L-
M. M. Abd-Elzaher et al.
Egypt. J. Chem. 59, No. 5 (2016)
704
1. The solutions were diluted to the mark with DMSO or acetonitrile or
methanol or deionized water at room temperature. The above solutions were
used for subsequent measurements of absorption and emission spectra as
well as the effect of solvents and pH. The fluorescence intensities were
measured at λex/λem =385/619.
Determination of bumetanide in pharmaceutical preparations Ten tablets of bumetanide were carefully weighed and ground to finely
divided powders. Accurate weights equivalent to 1.0 mg bumetanide was
dissolved in 50 ml acetonitrile and mixed well and filtered up using 12 mm
filter papers. The concentration of the drug was determined by using
different concentrations from the corresponding calibration graph.
Determination of bumetanide in serum samples A 1.0 ml of samples of blood collected from various healthy volunteers
was centrifuged for 15 min at 4500 r/min to remove proteins. The unknown
amount of drug in human serum samples was determined using the standard
addition (spiking) techniques.
Determination of bumetanide in urine samples
The urine samples studied, which were obtained from healthy male and
female volunteers who had taken no drug previously, were processed in the
laboratory as follows: 10 ml of urine were centrifuged for 15 min at 4500
r/min to remove precipitate salts, crystals, pus cells, and red blood cells (RBCs).
A 1.0 ml of urine was supplied with the volume of drug solutions. The
unknown amount of drug in human urine samples was determined using the
standard addition (spiking) techniques.
Analytical performance and method validation The Analytical performance and validation of the method is carried out
by studding the following parameters:
A. Calibration curve : A linear correlation was found between
fluorescence intensity of the Eu(III)-Acetylacetone complex at λem = 619
nm and concentration of bumetanide. The obtained calibration curve and
the graph were described by the regression equation: Y = a + bX
(where Y = fluorescence intensity of the sensor at λem = 619 nm; a =
intercept; b = slope and X = concentration in mol L-1
).
Regression analysis of bumetanide intensity data using the method of
least square was made to evaluate the slope (b), intercept (a) and correlation
Characterization of Eu(III) Complex For Determination …
Egypt. J. Chem. 59, No.5 (2016)
705
coefficient (r). The limit of detection (LOD) and quantitation (LOQ)
calculated according to ICH guidelines (31, 32)
using the formulae:
LOD = 3.3 S/b and LOQ = 10 S/b,
(where S is the standard deviation of blank fluorescence intensity values,
and b is the slope of the calibration plot).
B. Accuracy and precision of the method: To compute the accuracy and
precision, the assays described under “ general procedures” were
repeated three times within the day to determine the repeatability (intra-
day precision) and three times on different days to determine the
intermediate precision (inter-day precision) of the method. These assays
were performed for three levels of analyte. The low percentage relative
standard deviation (%RSD) values (intra-day) and (inter-day) indicating
high precision of the method. The accuracy of the method is evaluated as
percentage relative error (RE) between the measured mean
concentrations and the taken concentrations of bumetanide. Bias {bias %
= [(Concentration found - known concentration) x 100 / known
concentration]} is also calculated.
C. Selectivity: The proposed methods were tested for selectivity by
placebo blank and synthetic mixture analysis. A placebo blank containing
talc (250 mg), starch (300 mg), lactose (30 mg), calcium carbonate (50 mg),
calcium dihydrogen orthophosphate (20 mg), methyl cellulose (40 mg),
sodium alginate (70 mg) and magnesium stearate (100 mg) was extracted
with water and solution made as described under “ analysis of dosage
forms” . A convenient aliquot of solution was subjected to analysis
according to the recommended procedures. In the method of analysis, there
was no interference by the inactive ingredients.
A separate test was performed by applying the proposed method to the
determination of bumetanide in a synthetic mixture. To the placebo blank of
similar composition, different amount of bumetanide of different products
were added, homogenized and the solution of the synthetic mixture was
prepared as done under “ analysis of dosage forms” . The filtrate was
collected in a 100 ml flask. Five ml of the resulting solution was assayed
(n=3) by proposed method and then calculate the recovery percent.
D. Application to formulations: The proposed methods were applied to the
determination of bumetanide in Burinex tablets 1.0 mg (minapharm
Com.) which is purchased from local market and containing other
inactive ingredients and in serum and urine samples of the health state
human.
M. M. Abd-Elzaher et al.
Egypt. J. Chem. 59, No. 5 (2016)
706
E. Recovery study: To further assess the accuracy of the methods, recovery
experiments were performed by applying the standard-addition
technique. The recovery was assessed by determining the agreement
between the measured standard concentration and added known
concentration to the sample. The test was done by spiking the pre-
analysed tablet powder with pure bumetanide at three different levels
(0.1, 1.0 and 10.0 n mol L -1) of the content present in the tablet powder
(taken) and the total was found by the proposed method. Each test was
repeated three times.
Results and Discussion
Characterizations of the Eu(III) Acetylacetone complex 1
The electronic absorption spectra of the prepared complex 1 and
acetylacetone compounds were measured in ethanol at room temperature.
Spectra data of the ligand and complex are represented in Table 1. Uv/Vis
spectra of the Eu(III) complex showed an absorption band (intense high-
energy) at about 218 nm. These high-energy absorption bands are assigned
to n-π* and π – π* transition in the complex (20)
.
The IR spectrum of complex 1 was summarized in Table 1. The
stretching band at 1637 cm-1
found in the ligand L1 was appointed to the
C=O group, and this stretching band shifted to decrease energy by 15 cm-1
in complex 1. This result may be due to the resonance of the deprotonated
anion which affords the C=O bonds the mixed character of single and
double bonds. This shift confirmed L1 also the participation of the carbonyl
group in the complexation with Eu(III) ion (21)
. The IR absorption bands
appeared at 1176, 783 cm-1
for L1; which resulting from the in-plane and
out-of-plane vibrations of C-H bonds. These bands were shifted (26-38 cm-
1) by complexation, and these changes could be attributed to the change in
rigidity of the ligand ring due to complexation (20).
In complex 1 a broad
band appeared in the range 3000–3600 cm−1
assigned to the water molecules
and/or to the OH stretching vibration of the ligands and/or the ethanol
molecules present in the complex (22-24)
. The new bands at 505 cm-1
observed in complex 1 were attributed to M-O bond in complex 1 (25-32)
.
The 1H-NMR spectra of the ligand L1, and Eu(III)-complex 1 were
measured in DMSO-d6 at room temperature. The chemical shift data are
given in Table 1, but unfortunately we could not obtain good spectra for the
complex which may be due to highly paramagnetic properties of the
complex. This adds difficulty to assigning the NMR peaks.
Characterization of Eu(III) Complex For Determination …
Egypt. J. Chem. 59, No.5 (2016)
707
The molar conductivity of 1 x 10⁻³
M solution of the metal complex 1 in
DMSO at room temperature was found to be 32.52 ohm-1
cm2 mol
-1 (Table
2) indicating that the complex is nonelectrolytic in nature (24, 25)
. The
magnetic moment value of complex 1 was measured using Gouy method
and was found 3.12 B.M (Table 2). The Eu(III) ions were paramagnetic due
to their 4f-electrons that were effectively shielded by 5s25p
6 electrons
(24) .
The elemental analysis of the complex is consistent with the calculated
results from the empirical formula (Table 2). The results indicated that
complex 1 is ten-coordinated.
TABLE 1. Electronic absorption, IR, and 1H-NMR data of the ligand and Eu(III)-
complex.
Ligand/
Complex
Absorpti
on Bands
( λ) nm
IR spectral data
1H NMR (DMSO-d6), δ in
ppm υC=
O
δC-H
(in
plane)
δC- H
(out of
plane)
υEu -O
L1 238, 274 1637 1176
783 …… 2.01 (S, 6H, 2CH3), 2.08
(S, 6 H, 2CH3), 3.80 (S, 2H,
CH2 -Keto form), 5.69 (S, H,
CH-enol form), 15.61 (S, H,
OH)
1 218 1622 1150
745
505 2.51 (m, 6 H, 2CH3), 3.35
(S, 2H, CH2 )
TABLE 2. Conductivity, magnetism and elemental analysis of complex 1.
Complex
Formula
(formula
weight)
Calcd. (found)
Am (Ώ-1
cm2 mol-1) µeff (B.M.)
C
H
N
1
C14H34EuNO11
(544.38)
30.89
(30.67)
6.30
(6.47)
2.57
(2.43)
32.52
3.12
From the physical and spectral data of the complex 1 discussed above,
we can deduce that the metal ions are bonded to two molecules of the ligand
as well as one molecule of the nitrate ion and two molecules of water and
two molecules of ethanol. Complex 1 may take the formula [Eu(acac)2
(NO3) (EtOH)2(H2O)2], as illustrated in Fig. 2 (20, 26)
.
M. M. Abd-Elzaher et al.
Egypt. J. Chem. 59, No. 5 (2016)
708
Determination of bumetanide using Eu(III) complex 1 by spectrofluorimetric method
Spectral characteristics
A. Absorption spectra: The absorption spectrum of bumetanide is
showed in Fig. 3. Threshold two bands at 266 nm and band at 352 nm
appeared and can be attributed to n-π* and π-π* transitions. The absorbance
is also enhanced, by increasing the concentration of the bumetanide.
B. Emission and excitation spectra: Figure 4 represents the emission and
excitation spectra of bumetanide (spectrum 1), and that of Eu3+
ions
(spectrum 2) and that of complex (1) [Eu3+
-Acetylacetone] (spectrum 3),
and bumetanide-Eu3+
-Acetylacetone (spectrum 4). From the spectra in
Fig. 4, it was concluded that Eu3+
ion has two very weak peaks.
Comparing spectrum 1 with spectrum 3 [after the addition of bumetanide
into the Eu3+
-Acetylacetone], the results showed that bumetanide can
form a new complex with Eu3+
-Acetylacetone. It can be observed that
the characteristic peak of Eu3+
at 619 nm has been increased remarkably
by addition of bumetanide. This is an evidence that bumetanide enhances
the energy of bumetanide-Eu3+
-Acetylacetone complex.
Fig. 2. Structural representation of complex 1.
Characterization of Eu(III) Complex For Determination …
Egypt. J. Chem. 59, No.5 (2016)
709
Fig. 3. The absorption spectrum of bumetanide .
Fig. 4. The fluorescence spectra of (1) the bumetanide, (2) Eu3+ion, (3)Eu3+-
Acetylacetone and (4) bumetanide-Eu3+-Acetylacetone complex .
Experimental parameter effect
A. pH effect : The fluorescence intensity and absorption spectrum of the
bumetanide depend on pH medium which adjusted using NH4OH and HCl.
The highest intensity peak which appears at 619 nm was obtained at pH = 7.1.
B. Solvent effect: The fluorescence intensity of the bumetanide was
measured in different solvents. From the results we found that in the presence of
395.0 4500
500 550 600 650 700 0.0
20
40
60
80
100
120
140
160
180
200
220
247.7
1
2
3
4
WaveLength (nm)
fluore
scen
ce i
nte
nsi
ty
M. M. Abd-Elzaher et al.
Egypt. J. Chem. 59, No. 5 (2016)
710
acetonitrile there is no quenching in the emission intensity of bumetanide (Fig.
5). C. Bumetanide concentration effect: The bumetanide-concentrations
effect on the fluorescence intensities of the Eu3+
-Acetylacetone complex was
investigated. The emission spectra of the Eu3+
-Acetylacetone gives a
characteristic band at 617 nm after excitation at 385 nm and the fluorescence
intensity was enhanced by increasing the concentration of the bumetanide till 1x
10-4
mol L-1
then it became constant in the acetonitrile preparations (Fig. 6).
Method validation
1. Calibration curve: A linear relationship between fluorescence intensity
of the Eu(III)-Acetylacetone complex at λem = 619 nm and bumetanide-
concentration in the ranges are given in Table 3. The eleven-point (1x10⁻⁴
-
1x10-11
) calibration curve was obtained (Fig. 7). Table 3 presented regression
analysis of bumetanide intensity data, whereas Table 4 contained a comparison
of spectrofluorimetric technique with some published methods and from Table
4 we noted that the low value of LOD indicates the high sensitivity of our
present method for the determination of bumetanide compared with the
previous
methods.
547.6
560
580
600
620
640
664.2
-10.0
20
40
60
80
100
120
140
160
180
200
220
244.4
1
2
3 4
2-
DMSO
3-
methanol 4-
water
1-
acetonitrile
Wavelength (nm)
flu
ore
scen
ce i
nte
nsi
ty
Characterization of Eu(III) Complex For Determination …
Egypt. J. Chem. 59, No.5 (2016)
711
Fig. 5. The fluorescence spectra of 1x10⁻⁵ M of Bumetanide measured in different
solvents.
Fig.6. The fluorescence spectra of the Eu(III)-Acetylacetone at different
concentrations of bumetanide in acetonitrile. at λex = 385 nm and pH 7.1.
Fig. 7. linear relationship between concentration of bumetanide and fluorescence intensity of Eu3+-Acetylacetone complex in acetonitrile .
566.5 580 590 600 610 620 630 640 647.5
0
50
100
150
200
250
301.5
1
11
Flu
ore
scen
ce i
nte
nsi
ty
11- 1x10⁻⁴ mol L-1
1- 1x10-11 mol L-1
Wavelength (nm)
M. M. Abd-Elzaher et al.
Egypt. J. Chem. 59, No. 5 (2016)
712
TABLE 3. Sensitivity and regression parameters for the method.
Parameter Method
λ em nm 619
Linear range, mol L−1 1 ×10⁻¹¹ - 1 ×10⁻⁴
Limit of detection (LOD), mol L−1 1.6 ×10⁻¹⁰
Limit of quantification (LOQ), mol L−1 3.2 x 10⁻⁹
Regression equation, Y* Y=a+bX
Intercept (a) 1.55
Slope (b) 2.9 x 10⁹
Standard deviation 0.34
Variance (Sa2) 8.99
Regression coefficient (r) 0.9986
*Where Y= fluorescence intensity, X= concentration in n mol L−1, a= intercept, b= slope.
TABLE 4. Comparison of spectrofluorimetric technique with some existing
methods for the determination of bumetanide.
Method Linear range Detection
limit Ref.
liquid-chromatography electrospray time-of-flight mass spectrometry
1×10-12 – 3.5×10-
3
5.8×10⁻¹⁰
[Juan C. D., et al., 2015]
Potentiometric method 1×10⁻⁶ – 1×10⁻³ 3.9×10⁻⁷
[El-Tohamy, M. et al., 2006]
LC-MS method 1×10-11 – 1×10⁻⁴
1×10⁻¹⁰
[Deventer, K., et al., 2002]
HPLC method 1×10⁻⁹ – 1×10⁻⁵
1×10⁻⁸
[Richter, K., et al., 1996]
Spectrofluorimetric method: Bumetanide-Eu3+-Acetylacetone
1×10⁻¹¹ - 1 ×10⁻⁴
3.2 ×10⁻⁹
The present work
2. Accuracy and precision of the method: The accuracy and precision
computed according to general procedures and the results are given in Table
5. The relative standard deviation percentage (%RSD) values were ≤ 2.35%
(intra-day) and ≤ 1.29 % (inter-day) and this indicates that our method is
highly precise. Also, the percent of relative error (%RE) was ≤ 4.0 % (intra-
day) and ≤ 3.18 % (inter-day) which indicates that our method is highly
accurate.
3. Selectivity: Our method was tested for selectivity by studying the
effect of placebo blank and synthetic mixture analysis which present
with our drug. From the results we found that the recovery percent was
99.50 ± 0.65, 98.9 ± 1.75, and 97.60 ± 0.80 for tablet, urine, and serum
samples, respectively. The results confirmed the accuracy as well as the
Characterization of Eu(III) Complex For Determination …
Egypt. J. Chem. 59, No.5 (2016)
713
precision of our present method. The results showed that high selectivity
was found in case of our drug in present of placebo blank.
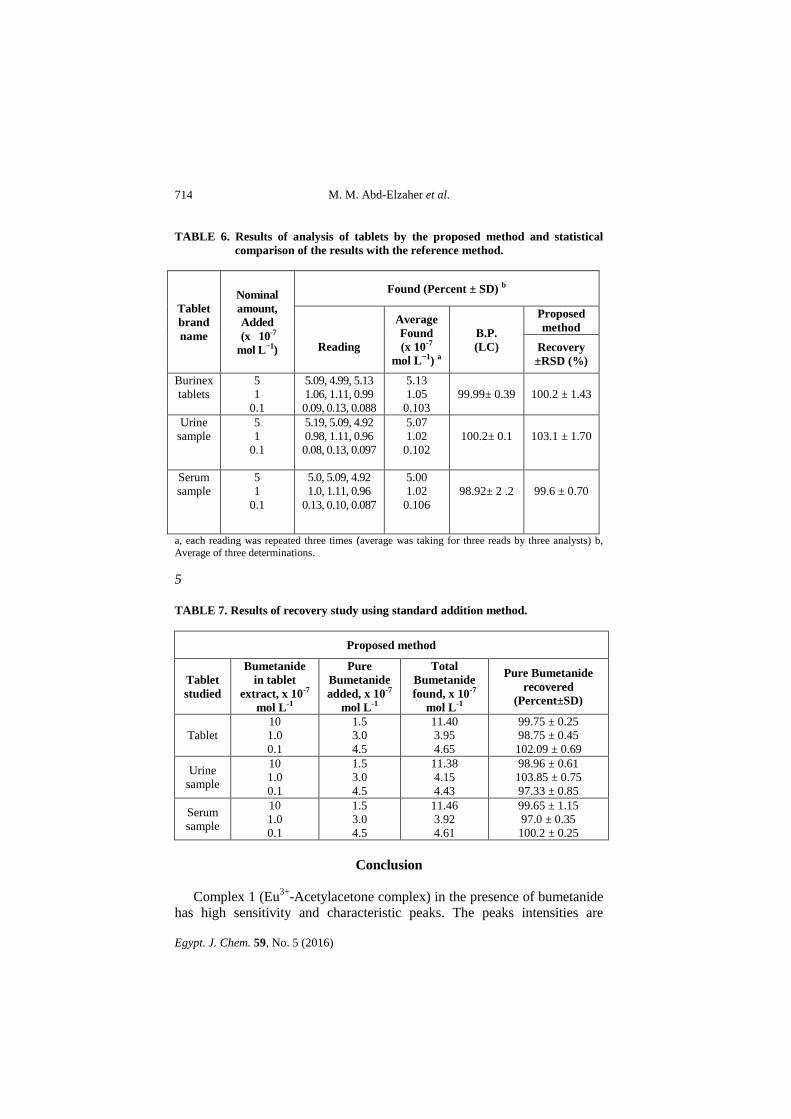
4. Application to formulations:Our present method was applied to the
determination of bumetanide in pharmaceutical tablets and in serum and urine
samples taken from healthy male and female. The results in Table 5 indicated
that the present method is very good for the determination of bumetanide. The
data represented in Table 6, were statistically compared with the reference
method )35, 36(. The average recovery percent and R.S.D in our method found to
be (100.2 ± 1.43 %), (99.6 ±0.70 %), and (103.1 ± 1.70 %) for the tablet, serum,
and urine samples, respectively. Data obtained by B. P. method showed the
average recovery (99.99 %, 98.92 and100.2.) and R.S.D 0.1 % for the tablet,
serum, and urine samples, respectively; were also presented for comparison and
show a good correlation with those obtained by the present methods. Our
results obtained by the present method were found in good agreement with that
of the reference method )35, 36(.
TABLE 5. Evaluation of intra-day and inter-day accuracy and precision.
Metho
d
Bumetanide
Added (x
10-7 mol
L−1)
Intra-day accuracy and
precision (n=3)
Inter-day accuracy and
precision (n=3)
Bumetanide
average
found ± CL
RE
%
RSD
%
Bumetanide
average
found ± CL
RE
%
RSD
%
Burinex
tablets
10.0
5.0
1.0
10.06 ± 0.11
5.05 ± 0.17
1.20 ± 0.23
1.50
0.83
2.50
0.13
1.12
1.11
10.03 ± 0.13
4.95 ± 0.18
1.19 ± 0.24
0.75
0.83
2.37
1.29
1.23
1.19
Urine
sample
10.0
5.0
1.0
10.16 ± 0.23
5.05 ± 0.28
1.19 ± 0.48
4.00
0.83
2.37
2.22
1.86
2.35
9.99 ± 0.30
5.04 ± 0.41
1.03 ± 0.31
2.19
3.18
1.59
0.16
0.13
0.12
Serum
sample
10.0
5.0
1.0
9.99 ± 0.11
5.04 ± 0.16
1.13 ± 0.21
0.25
0.66
1.62
1.11
1.06
1.02
10.11 ± 0.13
5.02 ± 0.18
0.98 ± 0.26
2.75
0.33
1.37
1.26
1.21
1.15
%RE: percent relative error, %RSD: relative standard deviation and CL: confidence limits were calculated from: CL = ±t S √n. (The tabulated value of t is 4.303, at the 95% confidence level; S = standard deviation and n = number of measurements.)
5. Recovery study
From the results of studding the recovery percentage for our proposed
method (Table 7) we found that the values of recovery % for tablet, urine,
and serum samples, ranged between (99.75 and 102.09 %), 103.85 %), and
(97.00 and 100.20 %) with relative standard deviation in the range (0.25 -
0.69 %), (0.61 - 0.85%), and (0.25 - 1.15%) respectively. Closeness of the
results to 100 % showed the fairly good accuracy of the proposed methods.
M. M. Abd-Elzaher et al.
Egypt. J. Chem. 59, No. 5 (2016)
714
TABLE 6. Results of analysis of tablets by the proposed method and statistical
comparison of the results with the reference method.
Tablet
brand
name
Nominal
amount,
Added
(x 10-7
mol L−1)
Found (Percent ± SD) b
Reading
Average
Found
(x 10-7
mol L−1) a
B.P.
(LC)
Proposed
method
Recovery
±RSD (%)
Burinex
tablets
5
1
0.1
5.09, 4.99, 5.13
1.06, 1.11, 0.99
0.09, 0.13, 0.088
5.13
1.05
0.103
99.99± 0.39
100.2 ± 1.43
Urine
sample
5
1
0.1
5.19, 5.09, 4.92
0.98, 1.11, 0.96
0.08, 0.13, 0.097
5.07
1.02
0.102
100.2± 0.1
103.1 ± 1.70
Serum
sample
5
1
0.1
5.0, 5.09, 4.92
1.0, 1.11, 0.96
0.13, 0.10, 0.087
5.00
1.02
0.106
98.92± 2 .2
99.6 ± 0.70
a, each reading was repeated three times (average was taking for three reads by three analysts) b,
Average of three determinations.
5
TABLE 7. Results of recovery study using standard addition method.
Proposed method
Tablet
studied
Bumetanide
in tablet
extract, x 10-7
mol L-1
Pure
Bumetanide
added, x 10-7
mol L-1
Total
Bumetanide
found, x 10-7
mol L-1
Pure Bumetanide
recovered
(Percent±SD)
Tablet
10
1.0
0.1
1.5
3.0
4.5
11.40
3.95
4.65
99.75 ± 0.25
98.75 ± 0.45
102.09 ± 0.69
Urine
sample
10
1.0
0.1
1.5
3.0
4.5
11.38
4.15
4.43
98.96 ± 0.61
103.85 ± 0.75
97.33 ± 0.85
Serum
sample
10
1.0
0.1
1.5
3.0
4.5
11.46
3.92
4.61
99.65 ± 1.15
97.0 ± 0.35
100.2 ± 0.25
Conclusion
Complex 1 (Eu3+
-Acetylacetone complex) in the presence of bumetanide
has high sensitivity and characteristic peaks. The peaks intensities are
Characterization of Eu(III) Complex For Determination …
Egypt. J. Chem. 59, No.5 (2016)
715
enhanced by increasing the concentration of bumetanide, due to energy
transfer from bumetanide to the Europium ion and can be used for
bumetanide determination in biological fluids and pharmaceutical
preparations with high accuracy.
References
1. Delgado, J. N., Remers, W. A., Textbook of Organic Medicinal and
Pharmaceutical Chemistry, 9th ed., J. B. Lippincot: Philadelphia, (1991).
2. Shinto, R. A. and Light, R. W., Am. J. Med., 88, 230, (1990).
3. Kristensen, B. O. and Show, J., Lancet, 2, 699, (1980).
4. Ventura, R. and Segura, J., J. of Chromatogr., B, 687, 127, (1996).
5. International Olympic Committee; Medical Commission, International Olympic
Charter against Doping in Sport, IOC: Lausanne, (1990).
6. Ruiz-Angel, M. J., Berthod, A., Carda-Broch, S. and Álvarez-Coque, M. C. G.,
Separation & Purification Reviews, 35, 39, (2006).
7. Shaikh, B., In Veterinary Drug Residues-Diuretic Drugs Used in Food Producing
Animals; Moats, W. A.; Medina, M. B., Ed.; ACS Symposium Series 636, American
Chemical Society: Washington, (1996).
8. British Pharmacopoeia Her Majesty’ s Stationery Office, London, (1998).
9. Ferraro, M., Castellano, P. and Kaufman, T., J. of Pharm. Biomed. Anal., 26,
443, (2001).
10. García-Sánchez, F., Fernández-Gutiérrez, A. and Cruces-Blanco, C., Anal.
Chim. Acta, 306, 313, (1995).
11. Luis, M. L., Fraga, J. M. G., Jiménez, A. I., Jiménez, F., Hernández, O. and
Arias, J. J., J. Talanta, 62, 307, (2004).
12. Ioannou, P. C., Rusakova, N. V., Andrikopoulou, D. A., Glynoy, K. M. and
Tzompanaki, G. M., Analyst, 123, 2839, (1998).
13. Nicolic, K. I. and Medenica, M., Acta, Pharm. J., 40, 521, (1990).
14. Barroso, M. B., Alonso, R. M. and Jiménez, R. M., Anal. Chim. Acta, 305, 332,
(1995).
15. United States Pharmacopeia, USP 24: Rockville, (2000).
16. El-Saharty, Y. S., J. of Pharm. Biomed. Anal., 33, 699, (2003).
17. Baranowskaa, I., Markowski, P. and Baranowski, J., Anal. Chim. Acta, 570, 46,
(2006).
M. M. Abd-Elzaher et al.
Egypt. J. Chem. 59, No. 5 (2016)
716
18. Yuan, J. and Matsumoto, K., Anal. Sci. 12, 31, (1996).
19. Azab, H., El-Korashy, S., Anwar, Z.M., Hussein, B.H.M. and Khairy, G.M., Spectro- chim. Acta A. Mol. Biomol. Spectrosc. 75, 21, (2010).
20. Gusev, A.N., Hasegawa, M., Shimizu, T., Fukawa, T., Sakurai, S.,
Nishchymenko, G. A., Shul’ gin, V. F., Meshkova, S. B. and Linert, W., Inorg.
Chim. Acta, 406, 279– 284, (2013).
21. Reddy, K. H., M., Reddy, R., Mohana, K. R., Polyhedron, 16, 15, 2673-2679,
(1997).
22. Maurya, R. C. and Rajput, S., J. of Mol. Struct., 833, 133, (2007).
23. Gudasi, K. B.; Shenoy, R. V.; Vadavi, R. S. and Patil, S. A., Trans Met. Chem.
31, 374, (2006).
24. Narang, K.K. and Singh, V.P., Trans. Met. Chem., 2, 507, (1996).
25. Refat, M. S., Al-Azab, F. M., Al-Maydama, H. M. A., Amin, R. R. and Jamil, Y.
M. S., J. of Mol. Struct., 1059, 208– 224, (2014).
26. Nibha, Kapoor, I.P.S., Singh, G. and Frohlich, R., J. of Mol. Struct., 1034,
296– 301, (2013).
27. Abd-Elzaher, M. M. and Fischer, H., J. Organometal. Chem., 588, 2, 35– 241,
(1999).
28. Abd-Elzaher, M. M., Moustafa, S. A., Labib, A. A., Mousa, H. A., Ali, M. M.
and Mahmoud, A. E., Appl. Organometal. Chem., 26, 230– 236, (2012).
29. Abd-Elzaher, M. M., Appl. Organometal. Chem., 18, 149– 155, (2004).
30. Abd-Elzaher, M. M., Hegazy, W. H. and Gaafar, A. M., Appl. Organometal.
Chem., 19, 911– 916, (2005).
31. Attia, M. S., Diaba, M. and El-Shahat, M. F., Sensors and Actuators, B, 207,
756– 763, (2015).
32. Azab, H. A., Anwar, Z. M., Rizk, M. A., Khairy, G. M. and El-Asfoury, M. H.,
J. of Lumin. 157, 371– 382, (2015).
33. International Conference on Hormonisation of Technical Requirements for
Registration of Pharmaceuticals for Human Use, ICH Harmonised Tripartite
Guideline, Validation of Analytical Procedures: Text and Methodology Q2(R 1),
Complementary Guideline on Methodology dated 06 November (1996), incorporated
in November (2005).
34. Michael, H. W., Yunhui, W., Tsang-Lin, H., Xue-Zhi, Q., Shyam, K. and
Varaporn, T., J. Chromatogr. B; 810(2), 209-219, (2004).
Characterization of Eu(III) Complex For Determination …
Egypt. J. Chem. 59, No.5 (2016)
717
35. British Pharmacopoeia, vol. II, Her Majesty’ s Stationary Office, London, p.2705,
(1999).
36. The United States Pharmacopeia xxv, United States Pharmacopeial Convention, Inc.,
12061, Twinbrook Parkway, Rockville, MD 20852, (2002).
37. Cho, I., GillKang, J. and Sohn, Y., J. of Lumin. 157, 264– 274, (2015).
38. Gaspar, D., Freire, J. M., Pacheco, T. R., Barata, J. T. and Castanho, M., Biochimica et Biophysica Acta, 1853, 308– 316, (2015).
39. Goel, N., J. of Mol. Struct., 1080, 1– 7, (2015).
40. Martinez, E., Sevillano, J., Cuss َ , F. B. and Oca َ, A. M., J. of Alloys and
Compounds, 619, 44–51, (2015).
41. Martins, J. P., Ramos, P., Coya,C., Silva, M., Eusebio, M. Andrés, A., Álvarez,
Á. and Gil, J. M., J. of Lumin. 159, 17–25, (2015).
42. Masuya, A., Igarashi, C., Kanesato, M., Hoshino, H. and Iki, N., Polyhedron, 85,
76–82, (2015).
43. Zhao, M., Tang, R. and Xu, S., Spectrochimica Acta Part A: Molecular and
Biomolecular Spectroscopy, 135, 953–958, (2015).
(Received ;
accepted )
M. M. Abd-Elzaher et al.
Egypt. J. Chem. 59, No. 5 (2016)
718
تقدير البيوماتانيد ل واستخدامه الثالثي االربييوم توصيف متراكب
ل البيولوجية والسوائ في تركيباته الصيدلية
مد عبد الظاهرـمخلص مح
*منى عبد العزيز أحمد ,
**عبد الفتاح بسطاوى ,
فرج***مد سعيد عطيهـمح ،
أحمد عثمان يوسف ،********د شتاـو شتا محم
*
*يمياء التحليلية الكقسم **الكيمياء غير العضوية المركز القومى للبحوثقسم
جامعة عين شمس –كلية البنات ***
جامعة –العلوم كلية الكيمياء التحليليةقسم
– حلوان****
– جامــعة عين شمس –الكيمياء غير العضوية كلية العلوم قسم
.مصر
االربييومون مع االسيتل اسيتمن تفاعل 1فى هذا البحث تم تحضير متراكب رقم
طيف االشعة فوق البنفسيجية والمرئيه, واسطة طيف االشعة ب الثالثي وتوصيفه
, التوصيل العنصري, التحليل النووي المغناطيسيتحت الحمراء, الرنين
وقد اثبتت النتائج ان التركيب الجزيئي للمتراكب .المغناطيسيالموالرى والعزم
طريقة وميضية , وقد تم تطوير [Eu(acac)2(NO3)(EtOH)2(H2O)2]هو
في صورته البيوماتانيدة وحساسة وانتقائية لتحديد كميات ضئيلة من بسيط
باستخدام تركيباته الصيدلية وفى( الدم والبول) الطبيعية أو فى السوائل البيولوجية
. المتراكب المحضر
على قياس الطيف البيوماتانيد اعتمادا ف طريقة وميضية مباشرة لتقدير يتم توص
وكان مدى . فى محلول االسيتونتريل 1.1ي مناسبالوميضى عند اس هيدروجين
11القياس للطريقة يتراوح من-11
– 11-4
تم الحصول على عالقة خطية . موالري
ولقد أظهرت النتائج دقة عالية . تلك المادهبين شدة الطيف الوميضى وتركيز
11*1.1فكان مدى الكشف عن البيوماتانيد يصل الى للطريقة-11
ن وكان موالري
11* 2.3تقدير هذه الماده يصل الى مدى -9
.