1 Chapter 1 : Introduction Ecological and Economical efficiency of Constructed Wetlands and Transferability of Decentralized Wastewater Treatment Operation to Nepal 1 Introduction 1.1 Background Constructed wetlands (CWs) have been defined as „„engineered systems, designed and constructed to utilize the natural functions of wetland vegetation, soils and their microbial populations to remove contaminants in surface water, groundwater or waste streams” and which is to as nature‟s kidneys (ITRC, 2003). CWs can be used as part of decentralized wastewater treatment systems, due to their characteristics as low construction cost, low-technology systems, relatively low operational & maintenance cost and requires significantly less energy. Denny et al., (1997) pointed out that CWs are particularly suitable for developing countries as well as any rural or low density area in the world, whereas conventional systems are appropriate in industrialized regions and densely populated areas with guaranteed power supplies, easily replaceable parts, and available of skilled manpower to ensure operation and maintenance requirement. Wolverton (1987) pointed out that the scientific basis for waste water treatment in a vascular aquatic plant system is the cooperative growth of both the plants and the microorganisms associated with the plants. A major part of the treatment process for degradation of organics is attributed to the microorganisms living on and around the plants roots. Once microorganisms are established on aquatic plants root, they form a symbiotic relationship in most cases with the higher plants. This relationship normally produces a synergic effects resulting in increased degradation rates and removal of organic compounds from the wastewater surrounding the plant root systems. Also, microorganisms can use some or all metabolites released through plant roots as a food source. By each using the other waste products, this allows a reaction to be sustained in favor of rapid removal of organics from wastewater. Generally, common reed (Phragmites australis) is among the most popular plants used in constructed wetlands because of high tolerance and abundance in several areas of the world (Kadlec and Knight 1996). The first experiments aimed at the possibility of wastewater treatment by wetlands plants were undertaken by Käthe Seidel in Germany in 1957 at the Max Plank Institute in Plön (Seidel, 1995). From 1995, Seidel carried out numerous experiments
Transcript
1 Chapter 1 : Introduction
Ecological and Economical efficiency of Constructed Wetlands and Transferability of Decentralized Wastewater Treatment Operation to Nepal
1 Introduction
1.1 Background
Constructed wetlands (CWs) have been defined as „„engineered systems, designed
and constructed to utilize the natural functions of wetland vegetation, soils and their
microbial populations to remove contaminants in surface water, groundwater or
waste streams” and which is to as nature‟s kidneys (ITRC, 2003). CWs can be used
as part of decentralized wastewater treatment systems, due to their characteristics as
low construction cost, low-technology systems, relatively low operational &
maintenance cost and requires significantly less energy. Denny et al., (1997) pointed
out that CWs are particularly suitable for developing countries as well as any rural or
low density area in the world, whereas conventional systems are appropriate in
industrialized regions and densely populated areas with guaranteed power supplies,
easily replaceable parts, and available of skilled manpower to ensure operation and
maintenance requirement.
Wolverton (1987) pointed out that the scientific basis for waste water treatment in a
vascular aquatic plant system is the cooperative growth of both the plants and the
microorganisms associated with the plants. A major part of the treatment process for
degradation of organics is attributed to the microorganisms living on and around the
plants roots. Once microorganisms are established on aquatic plants root, they form
a symbiotic relationship in most cases with the higher plants. This relationship
normally produces a synergic effects resulting in increased degradation rates and
removal of organic compounds from the wastewater surrounding the plant root
systems. Also, microorganisms can use some or all metabolites released through
plant roots as a food source. By each using the other waste products, this allows a
reaction to be sustained in favor of rapid removal of organics from wastewater.
Generally, common reed (Phragmites australis) is among the most popular plants
used in constructed wetlands because of high tolerance and abundance in several
areas of the world (Kadlec and Knight 1996).
The first experiments aimed at the possibility of wastewater treatment by wetlands
plants were undertaken by Käthe Seidel in Germany in 1957 at the Max Plank
Institute in Plön (Seidel, 1995). From 1995, Seidel carried out numerous experiments
2 Chapter 1 : Introduction
Ecological and Economical efficiency of Constructed Wetlands and Transferability of Decentralized Wastewater Treatment Operation to Nepal
on the use of wetland plants and especially Bulrush (Schoenoplectus = Scirpus
lacustris) for the treatment of various types of wastewater. In the mid-1960s, Seidel
began collaboration with Reinhold Kickuth from Göttingen University, but the
collaboration ended after a few years due to person reasons (Kadlec and Wallace,
2009). After then Kickuth developed a HSSF wetland process, which is also known
as root zone method (RZM). Constructed wetlands with sub-surface horizontal flow
drew more attention in Europe during the 1980s and 1990s with vertical flow and
their combination (Cooper et al., 1996; Vymazal et al., 1998). The first European
national guideline was published in Germany by ATV (Abwassertechnische
Vereinigung) in 1989 (ATV H 262, 1989) followed by European Guidelines (2008).
According to the inventory almost 3000 CWs existed in Lower Saxony in1994 and
more than 50000 small constructed wetlands were in operation by 2003 with majority
of system built to upgrade septic tank efficiency (Vymazal and Kröpfelová, 2008,
Vymazal 1998).
Similarly, CWs with sub-surface technology was started in North America during the
early 1970s. Similarly, Tanner et al. (2000) reported that many communities in New
Zealand have been using constructed wetlands as a cost effective means of
secondary and tertiary wastewater treatment. Since the mid 1980s, the concept of
using constructed wetlands has gained increasing support in Southern Africa. At
present, CWs are in operation, in Asian countries like India, China, Korea, Taiwan,
Japan, Nepal, Malaysia and Thailand for various types of waste wastewater (Kadlec
and Wallace, 2009).
CWs can be divided into two types, first is free-water surface type (FWS) in which the
water level is over the surface, and second is subsurface type (SF), in which the
water level is maintained below the surface. The subsurface can be further
categorized into two types based on the flow pattern, one with horizontal subsurface
(HSF) and another with vertical subsurface flow (VSF) (Vymazal, et. al., 2010). The
illustration of each system can be seen in the figure below. The free water surface
constructed wetlands (FWS) closely resemble natural wetlands because they look
like ponds containing aquatic plants that are rooted in the soil layer on the bottom.
The water flows through the leaves and stems of the plants. Their design and
operation is very close to pond systems.
3 Chapter 1 : Introduction
Ecological and Economical efficiency of Constructed Wetlands and Transferability of Decentralized Wastewater Treatment Operation to Nepal
The main focus is based on the constructed wetlands with subsurface flow. This is
due to several researches indicating that the pollutant removal efficiency is better
than in FWS per unit of land, implying the area requirement is lower. These systems
also pose no problem of mosquito or other insects breeding as well as the human,
probably children, exposure to surface wastewater. Some disadvantages of this type
are higher cost and have lower ecological value comparing to the FWS wetlands,
which are of minor concerns. The HSF and VSF systems do not resemble natural
wetlands because they have no Surface flow of water. They contain a bed of media
which is typically gravel and sand, but also soil or crushed rocks can be also used.
Within the media, emergent macrophytes are planted and the water is introduced
beneath the surface of the media and is flowing through the roots and rhizomes of
the plants. Conventionally, the flow in HSF systems is continuous, hence it creates a
“saturated” condition within the wetland body whereas the flow in VSF systems is
commonly intermittent, which results in an “unsaturated” and thus aerobic condition.
A simple and effective operation and maintenance system is essential for operating a
wastewater treatment system. Centralized wastewater management systems are
difficult to operate because of the difficulties in maintaining the long sewer networks
and treatment plant. So the constructed wetland as polishing biotopes in Gadenstedt
was constructed in 1998 as a part of decentralized waste water treatment system
covering the area of 1.1 hectare. The project„‟ Ecotechnological treatment of waste
water and sewage sludge in Lahstedt‟‟ was registered and officially sponsored project
at the world exhibition EXPO 2000 in Hanover. After achieving the good results, the
Lahstedt Municipality has decided to expand and improvement in the sewage plants
in another locality of Municipality like Oberg, Münstedt, Adenstedt, and Groß-
Lafferde. Likewise, small community of 600 residents in Berel introduced CWs
system in 2008 to ensure environment protection and better effluent quality before
discharging into the water receiving course. CWs are working as secondary
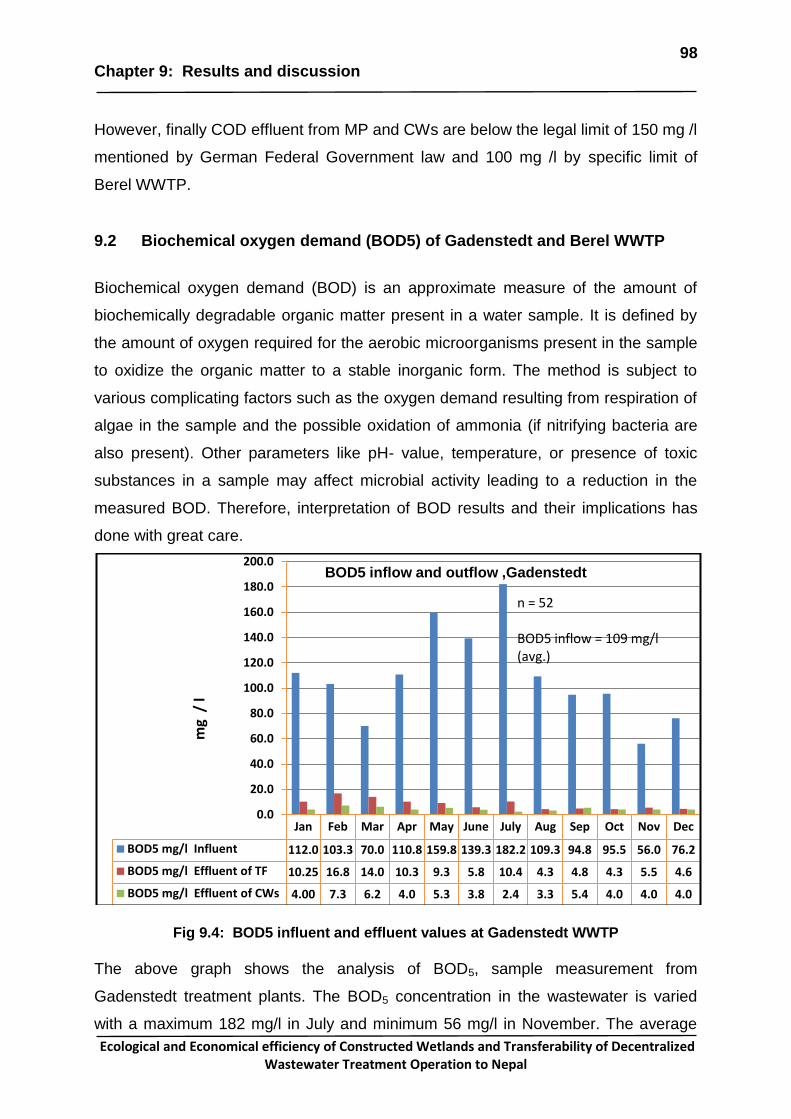
treatment plant and in the combination with pond system. The overall efficiency of
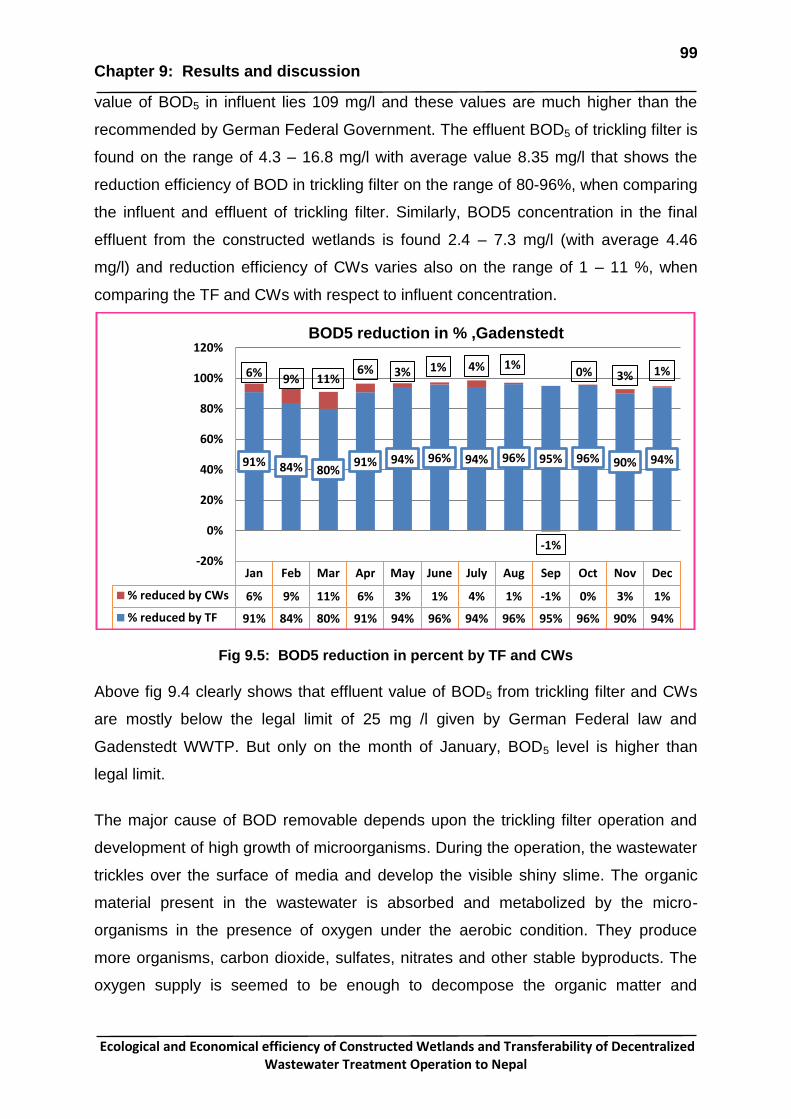
and 55% TP at Gadenstedt and similarly 86 % COD, 94% BOD, 81% NH4-N, and
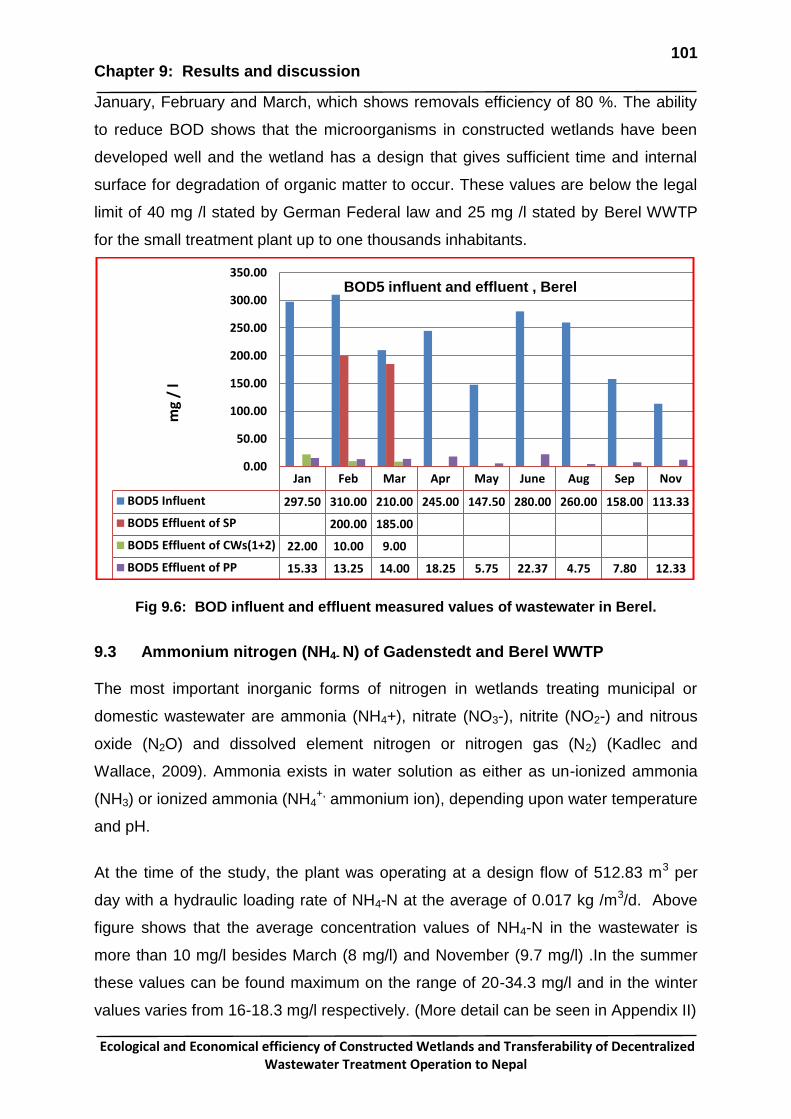
52% TP at Berel.
4 Chapter 1 : Introduction
Ecological and Economical efficiency of Constructed Wetlands and Transferability of Decentralized Wastewater Treatment Operation to Nepal
Decentralized system of treating wastewater ,with constructed wetlands, can provide
not only a more economical and energy efficient means of achieving treatment
objective , but also a resource in the form of reclaimed water available for landscape
irrigation or creation of wildlife habitats. Such an approach is more in line with the
philosophy of sustainable development and suitable technology for developing
countries.
1.2 Objectives
The objectives of this thesis were to evaluate the treatment efficiency of the
constructed wetland built in Gadenstedt and Berel. Similarly other objectives are as
follows:
Visiting in the study area.
Analysis of data of influent and effluent concentration of BOD, COD, NH4-N, TN,
TP
To study the efficiency of CWs to reduce BOD,COD,NH4-N,TN,TP
To examine the hydraulic characteristics of the flow-through system.
Economic analysis of power consumption and cost.
Evaluate the effect of influent pH and temperature effects
To focus as Constructed Wetlands are suitable technology in the context of
Nepal
1.3 Methodology
Literature Reviews Literature review is one of the most important methodologies, which helps to bring
clarity and focus in the research subjects. The literatures relevant to the study subject
were studied from available books, journals, previous thesis, reports and internet
sites to formulate the subject matter, develop conceptual study framework, select
study area, and later discuss the results. Further, before visiting field various
published/unpublished national and international reports and maps related to the
study area were collected and studied, which attributed to understand more deeply.
5 Chapter 1 : Introduction
Ecological and Economical efficiency of Constructed Wetlands and Transferability of Decentralized Wastewater Treatment Operation to Nepal
Data collections Data collections are the secondary methodology that has been used during the
research study for this thesis. Both primary and secondary data collections have
been made.
Primary data collection: Field visit, sample taken of wastewater, direct measurement pH and temperature in
field and measurement of influent and effluent concentration of BOD, COD, NH4-N,
TN, and TP in the central Laboratory were observed and data collected. Similarly
discharge, power consumption were also collected directly in field.
Secondary data collection (Data regarding the climate and hydrology from the relevant organizations) The existing data in relevant to this thesis writing from the different organizations can
be categorized into this group. The data and information from the various
meteorological departments, research organizations come under this category. An
enormous number of such data and information have been used in this study.
Analysis, Discussion and Interpretation of the data The primary and secondary data obtained from the field and laboratory is processed
for further analysis and interpretation.
Conclusions and Recommendations Depending upon the analysis and interpretations of the data conclusions and
recommendations has been suggested for the future.
Report Writing Finally, the report is prepared after data processing and analyzing along with
evaluation and interpretation of the field data, laboratory inferences and maps. All the
results and discussion will be synthesized and presented in the reports. It is obvious
that all these stages will be carried out with the iterative and frequent consultative
approach.
6 Chapter 1 : Introduction
Ecological and Economical efficiency of Constructed Wetlands and Transferability of Decentralized Wastewater Treatment Operation to Nepal
1.4 Structure of Thesis
Thesis Layout This thesis, presented in ten chapters, will give more information to the reader about
the constructed wetlands of Gadenstedt and Berel. This research work is basically
concerned with the investigation of constructed wetlands, types of wetlands used for
waste water treatment, method of reduction of organic matter (BOD, COD) and
nutrients (N,P) ,types of vegetation used in the treatment plants , soil properties, and
design process of subsurface vertical flow and horizontal flow CWs. Besides, the
thesis is presenting the present scenario of wastewater treatment in Nepal and
suitability of CWs technology transfer to Nepal.
Chapter 1 presents a general introduction about the thesis, objectives of the study,
the methodology used. Chapter 2 describes an overview of Organization
involvement (Ingenieurbüro Blumberg, Wasserverband Peine, and Lahstedt
Municipality) and their responsibility. Chapter 3 discuss about wastewater treatment
through Constructed Wetlands and its importance and implication. This chapter
focuses to wastewater qualities basically chemical, physical, and Biological
characteristics and Nutrients. This chapter also provides description on treatment
requirements guidelines, types of constructed wetlands and treatment mechanism.
Chapter 4 outlines a description on the theoretical approaches and methodology of
basic design recommendation and design principle of horizontal and vertical
subsurface CWs. This chapter also indicates the soil clogging and soil aeration in
vertical flow CWs. Chapter 5 explain an overview of soil used in substrate for
wastewater treatment process in the CWs. Chapter 6 shows the scenario of
Macrophytes used and its function for the wastewater decomposition in the CWs.
Chapter 7 describes the scenario of wastewater treatment in Nepal. Chapter 8
presents a brief description of study area geography, topography; climate, hydrology
and detail about project structure of Gadenstedt and Berel. This chapter describes
also the field data analysis of BOD, COD, NH4-N, TN, and TP. Chapter 9 presents
the analysis and discussions of the results of wastewater effluent from the CWs.
Especially focus to BOD, COD, NH4-N, TN, TP, and pH and temperature analysis.
Also focus to economic analysis of power consumption in two study area and
7 Chapter 1 : Introduction
Ecological and Economical efficiency of Constructed Wetlands and Transferability of Decentralized Wastewater Treatment Operation to Nepal
highlighted about CWs as a suitable technology in Nepal. Chapter 10 deals the
conclusions and recommendations that have been lay out from the investigation of
result analysis of BOD, COD, N, P, pH value in concern to the improvement of CWs
efficiency.
8 Chapter 2: Organization involvement
Ecological and Economical efficiency of Constructed Wetlands and Transferability of Decentralized Wastewater Treatment Operation to Nepal
2 Organization involvement
2.1 Ingenieurbüro Blumberg
Blumberg Engineers is associated with a network of consulting firms in Germany,
Europe and other countries round the world. Involvement of Ingenieurbüro Blumberg
is in planning, designing, and construction as well as monitoring and supervision of
various engineering projects of water and wastewater treatment for more than 20
years. Ingenieurbüro has experiences in the successful application of wastewater
and water treatment systems, having completed over 350 large and small scale
projects worldwide, including industrial project across several sectors over the last 20
years. They have also long experience of constructed wetlands for the wastewater
treatment of small community, industrial effluent, agricultural effluent and road run-
off. Ingenieurbüro works closely with municipalities and districts for the promotion of
wastewater treatment by constructed wetlands as an eco-technology. They are
providing consulting services in the environment sector. Especially, Ingenieurbüro
involves in monitoring and supervision as well as provides technical advice for the
betterment in the Lahstedt municipality and Berel wastewater treatment project after
the construction.
2.2 Wasserverband Peine
The Wasserverband Peine has been working in the drinking water supply and
industrial water since 1952. In 1996, Wasserverband Peine has involved in the
wastewater treatment sector and especially providing services in the region of Peine,
Baddeckenstedt, Borsum and Dransfeld. The regional office in Baddeckenstedt is
responsible for the water sample collection, analysis and data recording of Berel
wastewater treatment plant.
2.3 Lahstedt municipality
Lahstedt Municipality has given more importance on the conservation of nature and
the environment and municipality are operating „‟ community sanitation Lahstedt „‟ in
the five villages of the municipality. Municipality has their own central laboratory,
which is responsible for monitoring, water sample collection, analysis and data
recording of Gadenstedt.
9 Chapter 3: Wastewater treatment through Constructed Wetlands
Ecological and Economical efficiency of Constructed Wetlands and Transferability of Decentralized Wastewater Treatment Operation to Nepal
3 Wastewater treatments through the Constructed wetlands
(Literature review)
3.1 Constructed Wetlands
Constructed wetland treatment systems are engineered systems that have been
designed and constructed to utilize the natural processes involving wetland
vegetation, soils, and their associated microbial assemblages to assist in treating
wastewater (Vymazal, 1998). There are three types of wetlands categorizes
according to flow type like free water surface flow, horizontal subsurface flow and
vertical subsurface flow. They all have macrophytes coverage of varying degree and
the flow is usually driven under gravity system. In constructed wetlands, pollutants
are removed through a unique combination of physical, chemical and biological
processes, including sedimentation, precipitation, adsorption to soil particles,
assimilation by plant tissue and microbial transformations.
Bastian et al.,(1993) described that constructed wetlands have been designed not
only for the single purpose of treating wastewater but also implemented for multi use
objective such as treated wastewater effluent using as a water source for creation
and restoration of wetland habits for wildlife and environmental enhancement. The
efficiency of CWS for the pollutants removable is largely depends upon the bed size,
composition of substrate, type of vegetation, flow pattern, environmental conditions
and wastewater composition. The degree of control is larger than in a natural wetland
where species composition and performance may change over time. The treatment
methods by CWs were developed in Germany in 1952 at the Max Planck Institute in
Plön (Seidel 1995) and in the mid-1980 in Europe (Copper, 1996).
CWs are suitable to treat the wastewater coming from single house, small
community, as well as industrial effluent; land fill leachate, agricultural effluent and
road run-off. A relatively large amount of treatment plants are currently in use in
Europe and North America. Most of them are small, but for example in Denmark,
where the total amount is about 100 plants, there are more than 30 plants
constructed for 5 000-6 000 person equivalents (Leonardson, 1994).
10 Chapter 3: Wastewater treatment through Constructed Wetlands
Ecological and Economical efficiency of Constructed Wetlands and Transferability of Decentralized Wastewater Treatment Operation to Nepal
Due to simple construction, low cost and large buffering capacity, CWs with
subsurface flow have been constructed in Africa, Asia, and South America.
3.1.1 Application and Importance of Constructed Wetlands
Constructed wetlands are an appropriate technology for small communities in rural
and suburban areas. Many rural projects with activated sludge plants failed because
it was not properly operated, often no skilled stuff is available or the energy costs is
no longer affordable. Constructed wetlands may also be applied for primary,
secondary or tertiary treatment and may need a pre treatment before discharging into
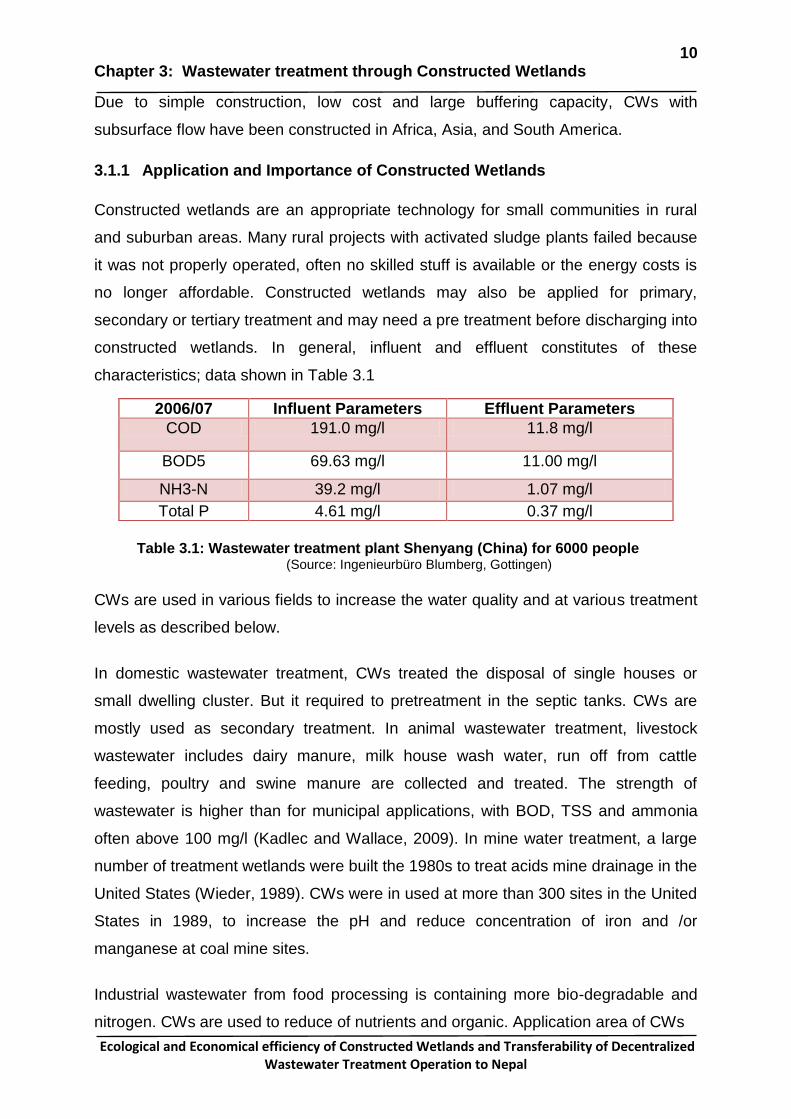
constructed wetlands. In general, influent and effluent constitutes of these
characteristics; data shown in Table 3.1
Table 3.1: Wastewater treatment plant Shenyang (China) for 6000 people
(Source: Ingenieurbüro Blumberg, Gottingen)
CWs are used in various fields to increase the water quality and at various treatment
levels as described below.
In domestic wastewater treatment, CWs treated the disposal of single houses or
small dwelling cluster. But it required to pretreatment in the septic tanks. CWs are
mostly used as secondary treatment. In animal wastewater treatment, livestock
wastewater includes dairy manure, milk house wash water, run off from cattle
feeding, poultry and swine manure are collected and treated. The strength of
wastewater is higher than for municipal applications, with BOD, TSS and ammonia
often above 100 mg/l (Kadlec and Wallace, 2009). In mine water treatment, a large
number of treatment wetlands were built the 1980s to treat acids mine drainage in the
United States (Wieder, 1989). CWs were in used at more than 300 sites in the United
States in 1989, to increase the pH and reduce concentration of iron and /or
manganese at coal mine sites.
Industrial wastewater from food processing is containing more bio-degradable and
nitrogen. CWs are used to reduce of nutrients and organic. Application area of CWs
2006/07 Influent Parameters Effluent Parameters
COD 191.0 mg/l 11.8 mg/l
BOD5 69.63 mg/l 11.00 mg/l
NH3-N 39.2 mg/l 1.07 mg/l
Total P 4.61 mg/l 0.37 mg/l
11 Chapter 3: Wastewater treatment through Constructed Wetlands
Ecological and Economical efficiency of Constructed Wetlands and Transferability of Decentralized Wastewater Treatment Operation to Nepal
is now in wine, starch, alcohol, sugar and meat processing industries. Pulp and paper
mill are using CWs to reduce the effluent value in limitation. Process water and storm
water coming from petroleum refineries are being treated by constructed wetlands as
using advanced secondary and tertiary treatment (Knight et al., 1997). When the
inorganic and organic degraded water combines with the rainfall and groundwater,
then leachates are produced with more toxic and damaging surrounding
environment. In modern lined landfills, leachates are collected from the lined cells
and treated by constructed wetlands, which is one of rapidly developing technology,
with both surface flow and sub surface flow.
After the rainfall, pollutants concentration and loads are generally low range in the
undeveloped area, low density residential and commercial. Similar pollutants
concentration can be found high range in the high density resident and commercial
as well as large industrial area. The use of constructed wetlands, usually with
accompanying ponds, is now a routine best management practice (BMP) for
controlling the quality of runoff (Kadlec and Wallace, 2009). In agricultural runoff
treatment, concentration of main contaminants like suspended solids, nitrate,
phosphorus and chemicals depend upon farming practices, rainfall intensity soil type
and topography. CWs are only the economically feasible means of controlling
phosphorus, nitrogen and ability to abate the pulse of some pesticides.
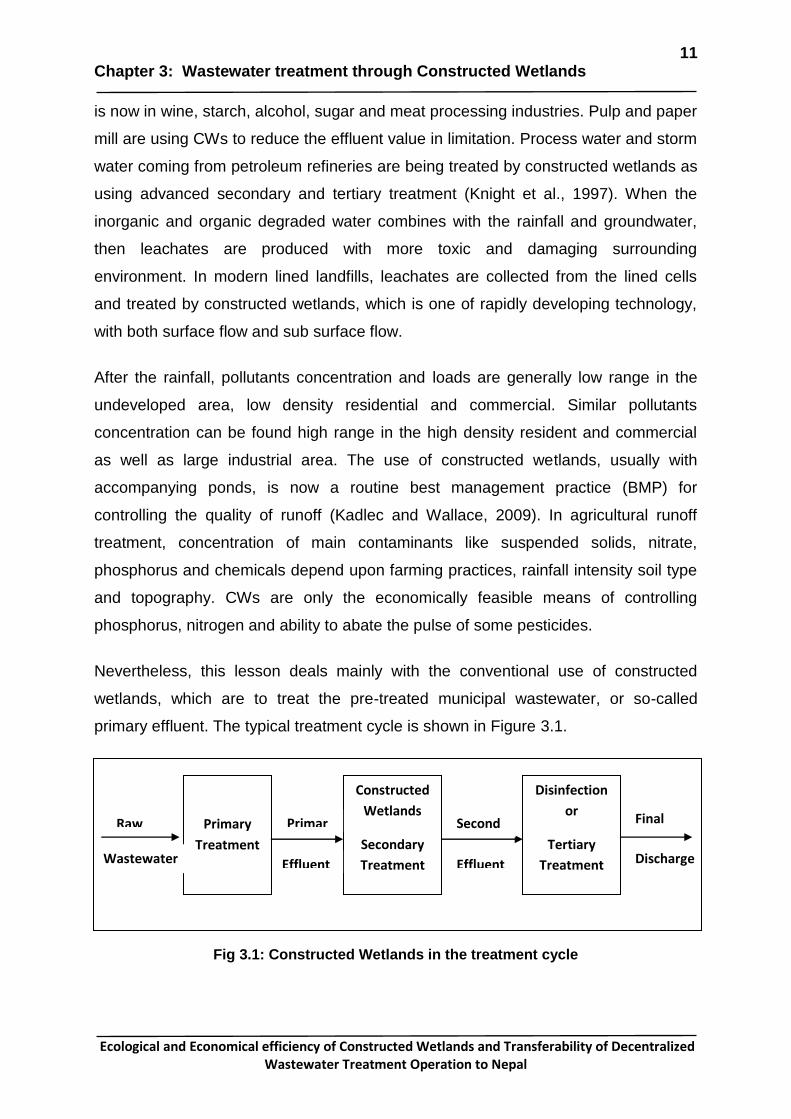
Nevertheless, this lesson deals mainly with the conventional use of constructed
wetlands, which are to treat the pre-treated municipal wastewater, or so-called
primary effluent. The typical treatment cycle is shown in Figure 3.1.
Fig 3.1: Constructed Wetlands in the treatment cycle
Constructed
Wetlands
Secondary
Treatment
Primary
Treatment
Disinfection
or
Tertiary
Treatment
Raw
Wastewater
Primar
y
Effluent
Second
ary
Effluent
Final
Discharge
12 Chapter 3: Wastewater treatment through Constructed Wetlands
Ecological and Economical efficiency of Constructed Wetlands and Transferability of Decentralized Wastewater Treatment Operation to Nepal
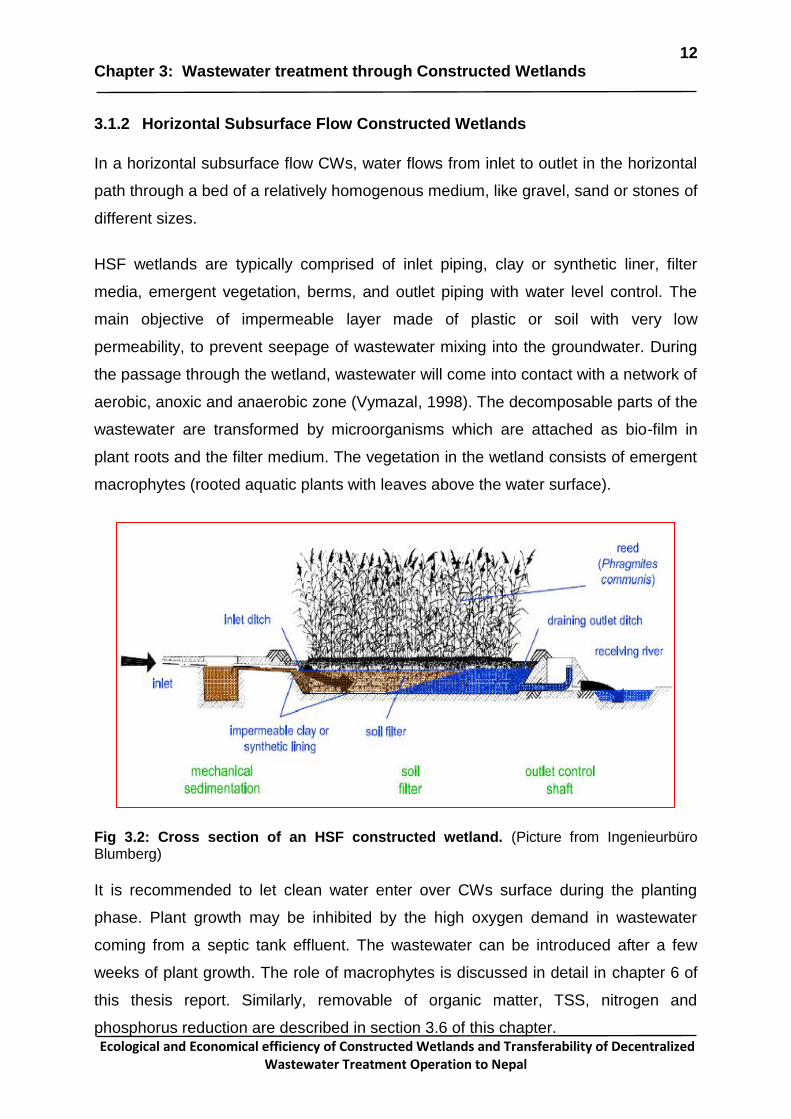
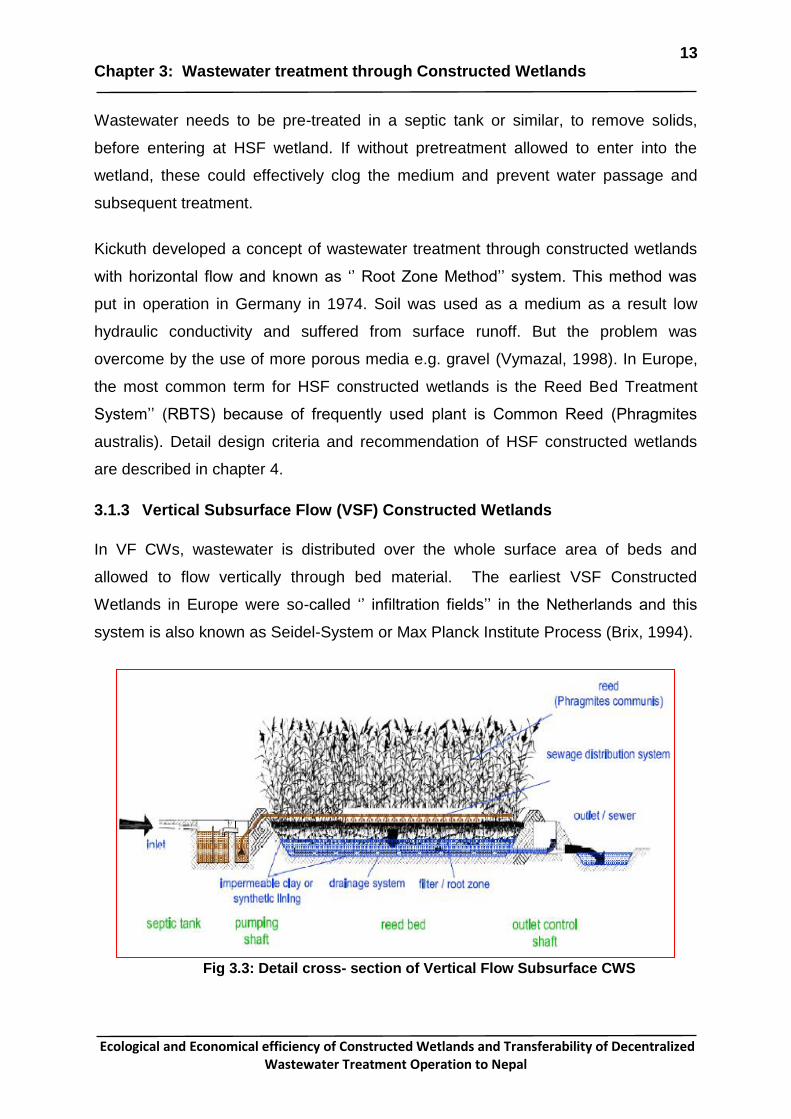
In VF CWs, wastewater is distributed over the whole surface area of beds and
allowed to flow vertically through bed material. The earliest VSF Constructed
Wetlands in Europe were so-called „‟ infiltration fields‟‟ in the Netherlands and this
system is also known as Seidel-System or Max Planck Institute Process (Brix, 1994).
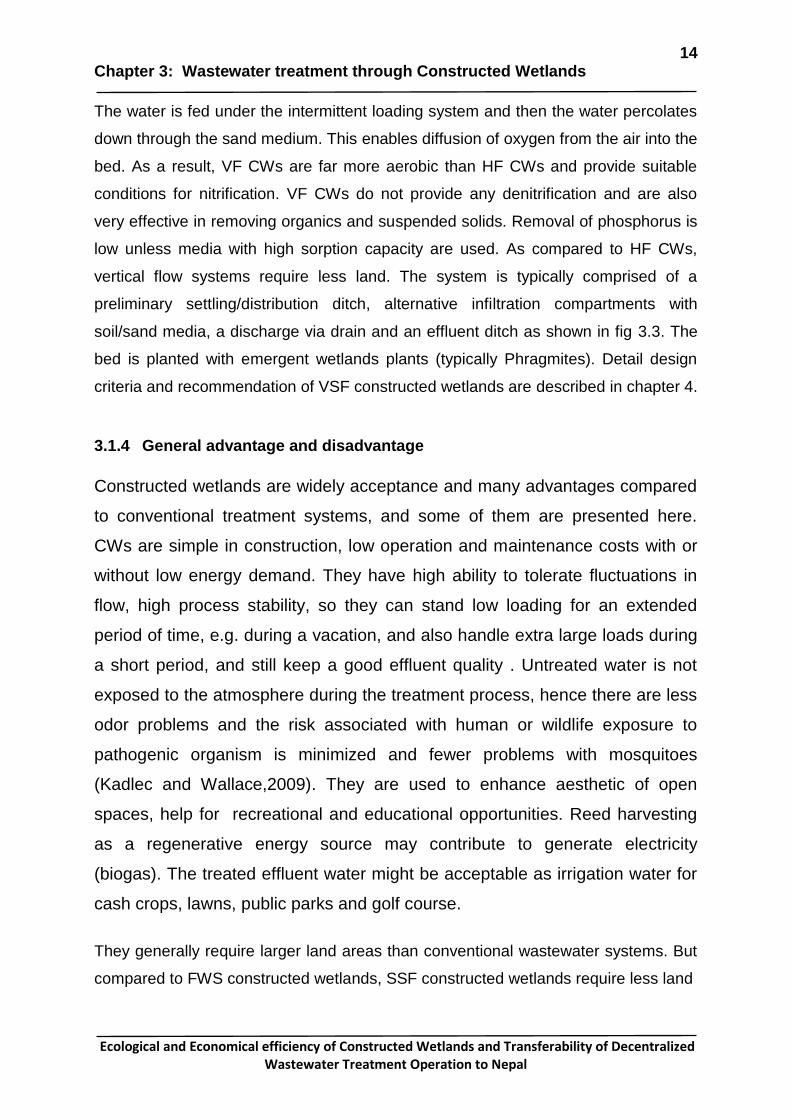
Fig 3.3: Detail cross- section of Vertical Flow Subsurface CWS
14 Chapter 3: Wastewater treatment through Constructed Wetlands
Ecological and Economical efficiency of Constructed Wetlands and Transferability of Decentralized Wastewater Treatment Operation to Nepal
The water is fed under the intermittent loading system and then the water percolates
down through the sand medium. This enables diffusion of oxygen from the air into the
bed. As a result, VF CWs are far more aerobic than HF CWs and provide suitable
conditions for nitrification. VF CWs do not provide any denitrification and are also
very effective in removing organics and suspended solids. Removal of phosphorus is
low unless media with high sorption capacity are used. As compared to HF CWs,
vertical flow systems require less land. The system is typically comprised of a
preliminary settling/distribution ditch, alternative infiltration compartments with
soil/sand media, a discharge via drain and an effluent ditch as shown in fig 3.3. The
bed is planted with emergent wetlands plants (typically Phragmites). Detail design
criteria and recommendation of VSF constructed wetlands are described in chapter 4.
3.1.4 General advantage and disadvantage
Constructed wetlands are widely acceptance and many advantages compared
to conventional treatment systems, and some of them are presented here.
CWs are simple in construction, low operation and maintenance costs with or
without low energy demand. They have high ability to tolerate fluctuations in
flow, high process stability, so they can stand low loading for an extended
period of time, e.g. during a vacation, and also handle extra large loads during
a short period, and still keep a good effluent quality . Untreated water is not
exposed to the atmosphere during the treatment process, hence there are less
odor problems and the risk associated with human or wildlife exposure to
pathogenic organism is minimized and fewer problems with mosquitoes
(Kadlec and Wallace,2009). They are used to enhance aesthetic of open
spaces, help for recreational and educational opportunities. Reed harvesting
as a regenerative energy source may contribute to generate electricity
(biogas). The treated effluent water might be acceptable as irrigation water for
cash crops, lawns, public parks and golf course.
They generally require larger land areas than conventional wastewater systems. But
compared to FWS constructed wetlands, SSF constructed wetlands require less land
15 Chapter 3: Wastewater treatment through Constructed Wetlands
Ecological and Economical efficiency of Constructed Wetlands and Transferability of Decentralized Wastewater Treatment Operation to Nepal
area. They can tolerate temporary water level draw downs, but not complete drying
(a base flow of water is required).The Evapotranspiration rate of aquatic macrophytes
in treatment wetlands is high thus reducing the water volume available for irrigation.
Some disadvantages with HSF wetlands are risk of shortcuts on the surface between
inflow and outflow and possibility of clogging if pre-treatment is insufficient. In
temperate regions the performance might be decreased during winter. Constructed
wetlands are regarded as an attractive alternative for small to medium-sized
communities in sparsely populated areas and in developing countries (Brix, 1993).
3.2 Characteristics of Wastewater.
In order to design wastewater treatment systems, it is very necessary to understand
the nature of wastewater. The treatment capacity and treatment efficiency of systems
are calculated based upon the wastewater characteristics because the effluent
quality depends upon the influent characteristics. Wastewater generally includes a
large variety of contaminants and can be very complex in composition, originating
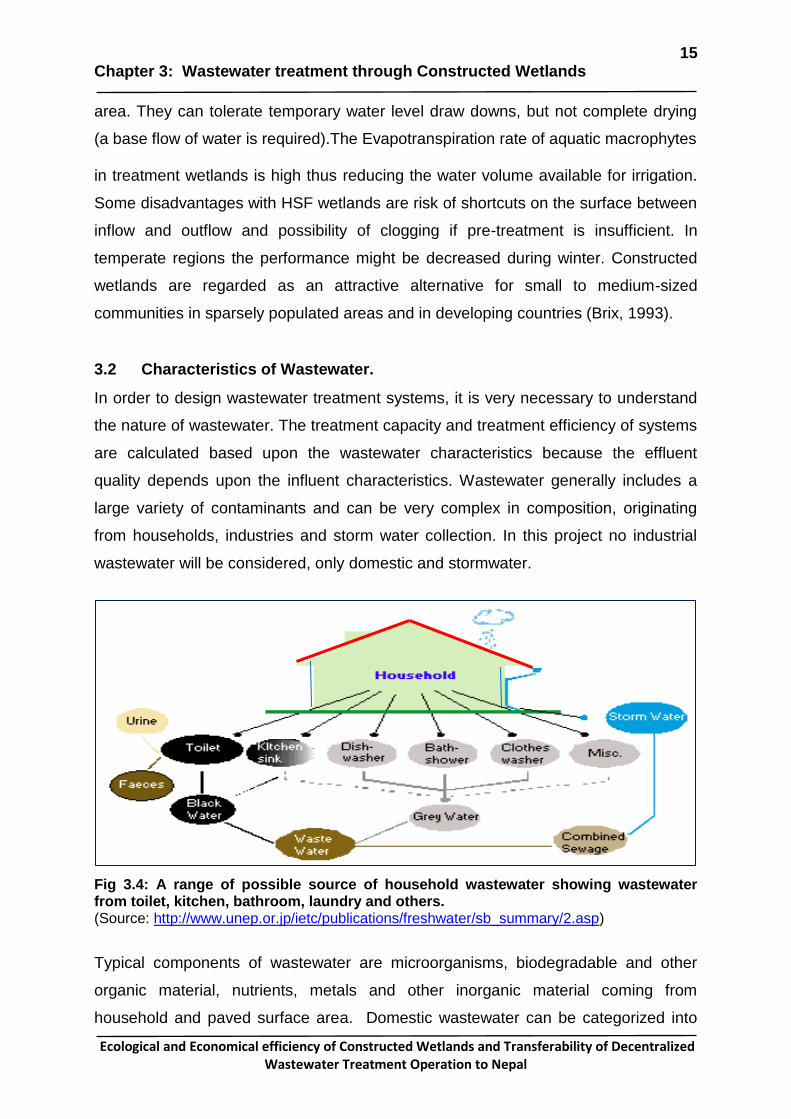
from households, industries and storm water collection. In this project no industrial
wastewater will be considered, only domestic and stormwater.
Fig 3.4: A range of possible source of household wastewater showing wastewater from toilet, kitchen, bathroom, laundry and others. (Source: http://www.unep.or.jp/ietc/publications/freshwater/sb_summary/2.asp)
Typical components of wastewater are microorganisms, biodegradable and other
organic material, nutrients, metals and other inorganic material coming from
household and paved surface area. Domestic wastewater can be categorized into
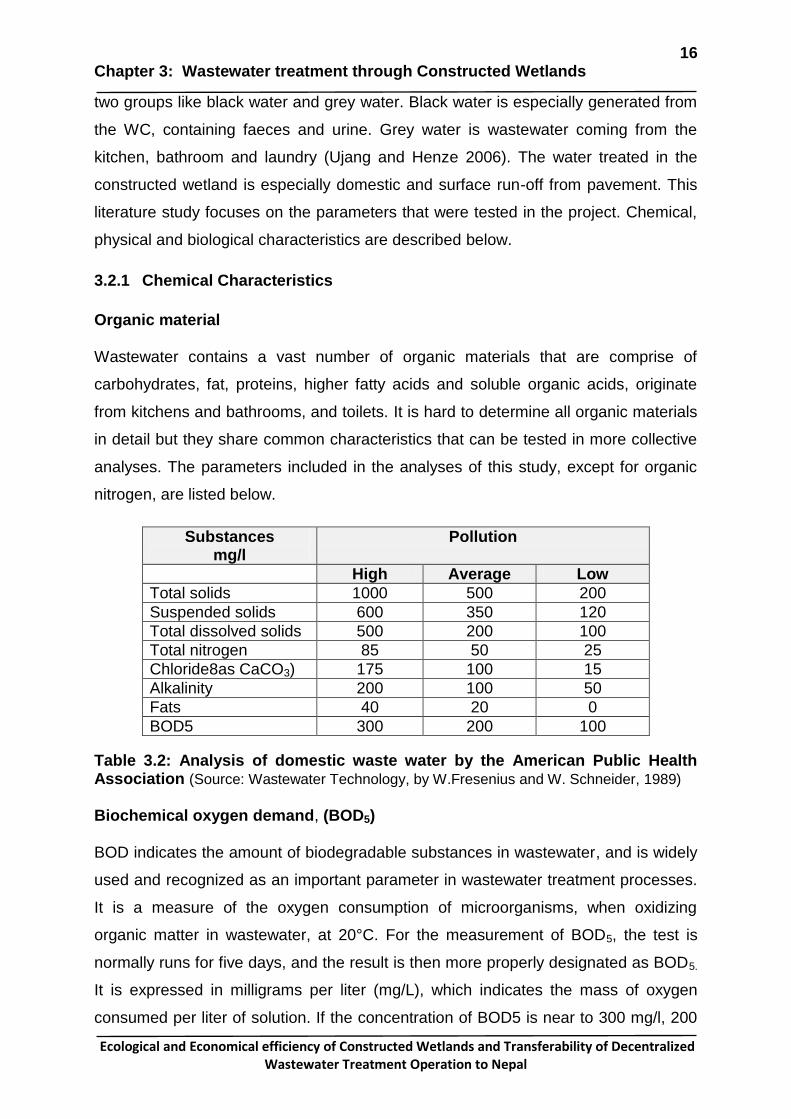
from kitchens and bathrooms, and toilets. It is hard to determine all organic materials
in detail but they share common characteristics that can be tested in more collective
analyses. The parameters included in the analyses of this study, except for organic
nitrogen, are listed below.
Table 3.2: Analysis of domestic waste water by the American Public Health Association (Source: Wastewater Technology, by W.Fresenius and W. Schneider, 1989)
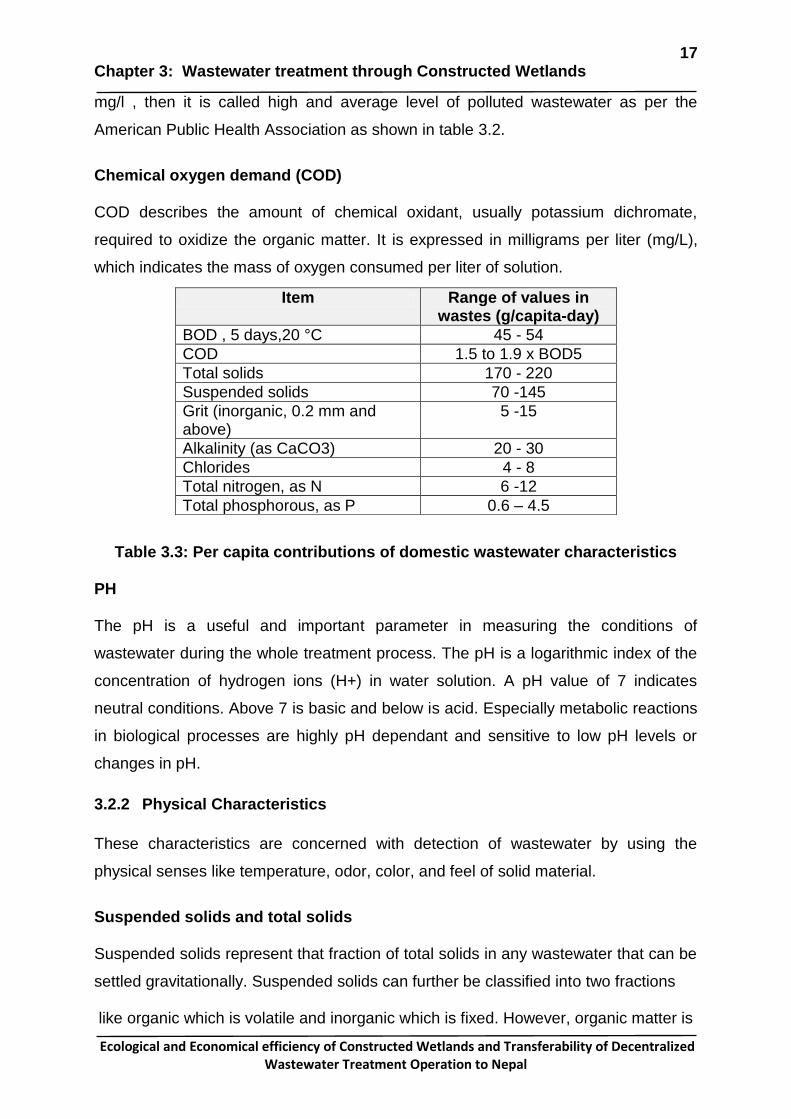
Biochemical oxygen demand, (BOD5) BOD indicates the amount of biodegradable substances in wastewater, and is widely
used and recognized as an important parameter in wastewater treatment processes.
It is a measure of the oxygen consumption of microorganisms, when oxidizing
organic matter in wastewater, at 20°C. For the measurement of BOD5, the test is
normally runs for five days, and the result is then more properly designated as BOD5.
It is expressed in milligrams per liter (mg/L), which indicates the mass of oxygen
consumed per liter of solution. If the concentration of BOD5 is near to 300 mg/l, 200
21 Chapter 3: Wastewater treatment through Constructed Wetlands
Ecological and Economical efficiency of Constructed Wetlands and Transferability of Decentralized Wastewater Treatment Operation to Nepal
European Communities (EC) developed a Waste Water Treatment Regulations 2005.
These Regulations contain general binding rules requiring sanitary authorities to
ensure that waste water treatment plants do not cause a nuisance through odours or
noise emissions. The Regulations set a legal requirement for waste water treatment
plants to be designed, constructed, operated and maintained so as to avoid causing
nuisance from odor emissions or noise. Operators of such plants, including sanitary
authorities, must indicate to the Environmental Protection Agency each year all steps
taken to comply with the Regulations and, on request from the Agency, must furnish
copies of all complaint records.
The Urban Waste Water Treatment Directive of EC has already contributed to an
improvement of the quality of big European rivers by reducing BOD levels by 20-
30%, of phosphorus concentrations by 30-40% and of NH4-N levels by around 40%.
Austria, Denmark and Germany, plus with certain restrictions the Netherlands have
shown that successful and timely implementation is possible, leading to significant
improvements in water quality by achieving compliance rate of about 2/3 of the
pollution load covered by the 1998 and 2000 deadlines (H. Blöch ,2005). The
Austrian Water Act (1959/1990) is based on the principle of provision with respect to
water considering whole environment and its relationship with water and wastewater
are taken into consideration. The effluent values from treatment plant should be
within limiting values, which is legally regulated (Vymazal, Brix, 1998).
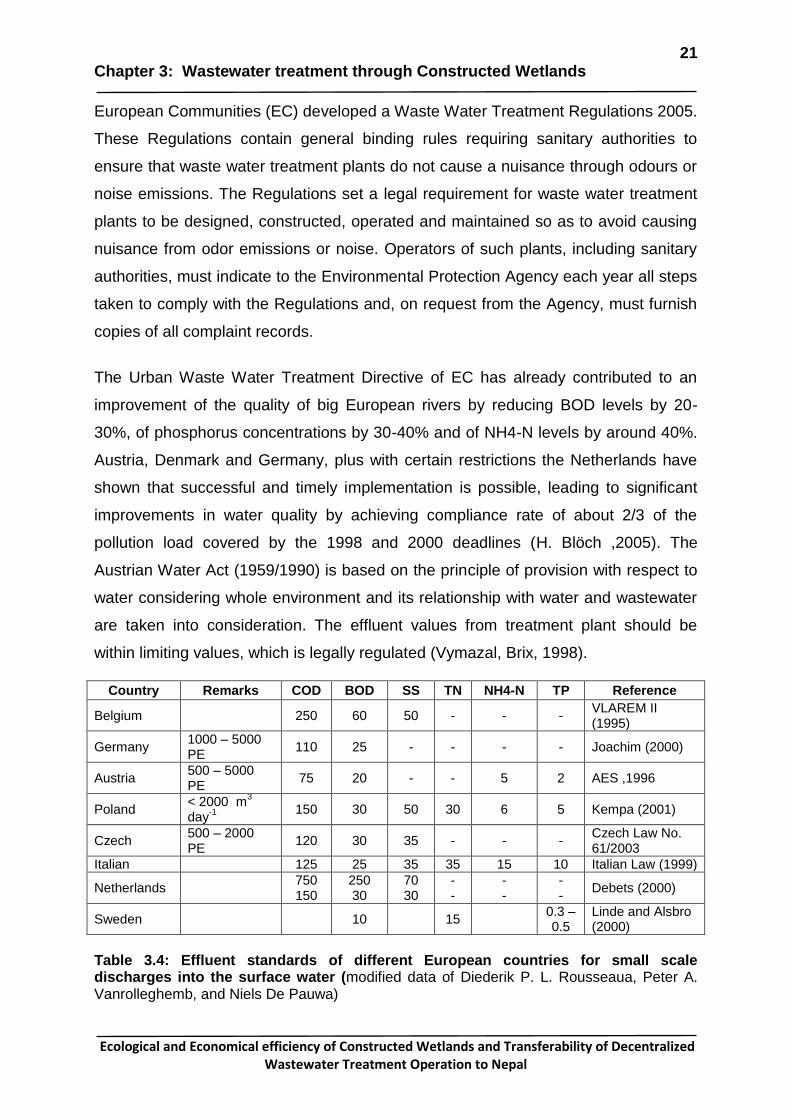
Table 3.4: Effluent standards of different European countries for small scale discharges into the surface water (modified data of Diederik P. L. Rousseaua, Peter A. Vanrolleghemb, and Niels De Pauwa)
Country Remarks COD BOD SS TN NH4-N TP Reference
Belgium 250 60 50 - - - VLAREM II (1995)
Germany 1000 – 5000 PE
110 25 - - - - Joachim (2000)
Austria 500 – 5000 PE
75 20 - - 5 2 AES ,1996
Poland < 2000 m
3
day-1
150 30 50 30 6 5 Kempa (2001)
Czech 500 – 2000 PE
120 30 35 - - - Czech Law No. 61/2003
Italian 125 25 35 35 15 10 Italian Law (1999)
Netherlands 750 150
250 30
70 30
- -
- -
- -
Debets (2000)
Sweden 10 15 0.3 – 0.5
Linde and Alsbro (2000)
22 Chapter 3: Wastewater treatment through Constructed Wetlands
Ecological and Economical efficiency of Constructed Wetlands and Transferability of Decentralized Wastewater Treatment Operation to Nepal
Wastewater coming from domestic use, industry, agriculture or any other activity that
can contaminate the water of lakes, rivers and aquifers, should be treated before
discharge. To protect the environmental and water course, effluent from wastewater
treatment systems should be standard limit governed by national law. Some of the
European country has set the standard norms of effluent wastewater as shown in
table 3.4.
3.4.2 Guidelines
A over growing population, unrelenting urbanization, increasing scarcity of good
quality water resources and rising fertilizer prices are the driving forces behind the
accelerating upward trend in the use of wastewater, excreta and greywater for
agriculture and aquaculture. The health risks associated with this practice have been
long recognized, but regulatory measures were, until recently, based on rigid
guideline values whose application often was incompatible with the socio-economic
settings where most wastewater use takes place.
In 2006, WHO published a third edition of its guidelines for the safe use of
wastewater, excreta and grey water in Agriculture and Aqua culture. These
guidelines are divided into four volumes, which propose a flexible approach of risk
assessment and risk management linked to health-based targets that can be
established at a level that is realistic under local conditions. Some of the
recommendations regarding reuse of treated wastewater for irrigation purposes and
decentralized wastewater treatment systems will be presented here. To reuse water
for activities and areas with public access, for example parks and irrigation of crops
that will be eaten raw or that are not commercially processed, WHO (2004)
recommends that there should be no detectable faecal coliforms /100 ml of water,
and BOD values of less than 10 mg O2/l. This is called unrestricted irrigation. For
restricted irrigation, when irrigating areas with limited or no public access and cereal
crops, industrial crops, fodder crops, pasture and trees, the recommendations from
USEPA (2004) are faecal coliform concentrations of less than 200 faecal coliforms
/100 ml and BOD and SS levels of less than 30 mg/l. In the guidelines from WHO
(1989) on safe wastewater reuse, the recommended limit was 1000 faecal coliforms
/ml for unrestricted irrigation. in the new guidelines from 2006, WHO validated their
earlier general recommendation of 1000 E.coli/100 ml for unrestricted wastewater
23 Chapter 3: Wastewater treatment through Constructed Wetlands
Ecological and Economical efficiency of Constructed Wetlands and Transferability of Decentralized Wastewater Treatment Operation to Nepal
use in agriculture, but other values were also given, e.g. 105 E.coli/100 ml for drop
irrigation of higher crops (WHO, 2006).
3.5 Hydraulics in Constructed Wetlands
3.5.1 Retention Time (RT) and Hydraulic Loading Rate (HLR)
Nominal retention time is defined as the wetland water volume involved in flow
divided by the volumetric water flow. Alternatively, it can be described a measure of
retention time, it takes for the whole water volume of a wetland to be replaced. It is
defined as RT = V/Q, where V is the total water volume and Q is the flow through the
wetland. The assumptions are steady-state conditions, i.e. the inflow is equal to the
outflow (Q = Q in = Q out), and no mixing of the water column. The total volume of the
wetland is occupied by the medium, e.g. sand, gravel. These medium having the
porosity holds water. The actual retention time for a constructed wetland is given by
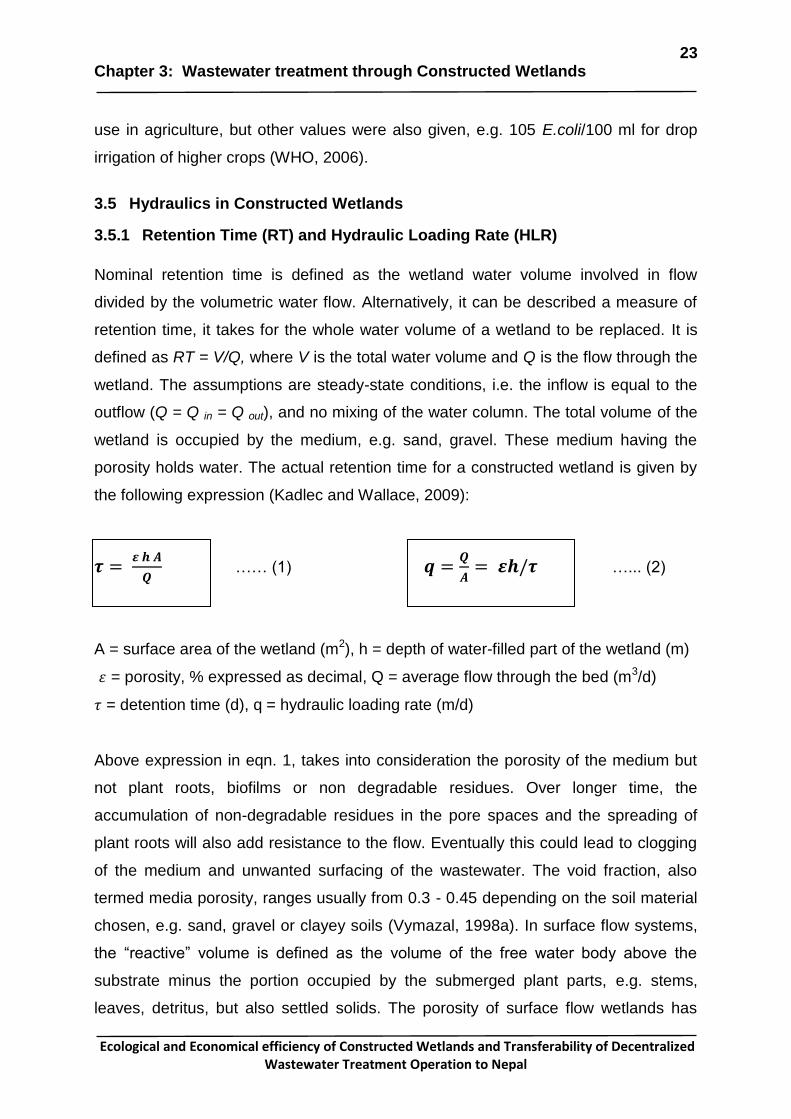
the following expression (Kadlec and Wallace, 2009):
…… (1)
…... (2)
A = surface area of the wetland (m2), h = depth of water-filled part of the wetland (m)
= porosity, % expressed as decimal, Q = average flow through the bed (m3/d)
= detention time (d), q = hydraulic loading rate (m/d)
Above expression in eqn. 1, takes into consideration the porosity of the medium but
not plant roots, biofilms or non degradable residues. Over longer time, the
accumulation of non-degradable residues in the pore spaces and the spreading of
plant roots will also add resistance to the flow. Eventually this could lead to clogging
of the medium and unwanted surfacing of the wastewater. The void fraction, also
termed media porosity, ranges usually from 0.3 - 0.45 depending on the soil material
chosen, e.g. sand, gravel or clayey soils (Vymazal, 1998a). In surface flow systems,
the “reactive” volume is defined as the volume of the free water body above the
substrate minus the portion occupied by the submerged plant parts, e.g. stems,
leaves, detritus, but also settled solids. The porosity of surface flow wetlands has
24 Chapter 3: Wastewater treatment through Constructed Wetlands
Ecological and Economical efficiency of Constructed Wetlands and Transferability of Decentralized Wastewater Treatment Operation to Nepal
proved difficult to exactly measure, thus, porosity values for surface flow wetlands in
the literature are highly variable. For example, Reed (1995) recommended wetland
porosity values ranging from 0.65 - 0.75 for fully vegetated surface flow beds.
To meet advanced treatment standards in surface flow as well as in subsurface flow
wetlands, the HRT should be at least 5 days (Vymazal, 1998a; WPCF, 1990). Reed
(1995) suggested a hydraulic retention time of at least 6 to 8 days to ensure
adequate nitrification rates. It can be concluded that there are no universally
applicable recommendations in the literature.
Hydraulic loading rate also play important role in the treatment efficiency of CWs.
There is also relationship between nominal detention time and hydraulic loading rate
as expressed in eqn. 2. From the expression, it can be seen that hydraulic loading
rate is inversely proportional to nominal detention time for the given wetlands depth
(Kadlec and Wallace, 2009). Hydraulic loading rate therefore embodies the notion of
contact duration, just as nominal detention time does.
Horizontal subsurface flow wetlands
2.0 - 5.0 cm/d for secondary treatment (Vymazal, 1998)
< 20 cm/d for tertiary treatment (Vymazal, 1998)
Vertical flow wetlands
6.0 cm/d (Mennerich, 2003)
The required energy to overcome the resistance of the medium, plant roots and
residues, is provided by the difference in hydraulic head between the inlet and the
outlet of the wetland. The time it takes for the water to pass from the inlet to the outlet
of the wetland may be less than the nominal retention time since the velocity of the
water may be higher in certain channels of the bed and shortcuts can be formed.
According to USEPA (2000) the actual retention time has frequently been reported to
be 40-80 % less than the theoretical retention time. This is one of the reasons to loss
of pore volume, preferential flow and dead volume, i.e. stagnation pockets sometimes
exits.
3.5.2 Porosity and Permeability
Porosity can be defined as the ratio of fraction volume of voids over the total volume
of materials. Soil porosity refers that pore spaces are filled with air, other gases, or
25 Chapter 3: Wastewater treatment through Constructed Wetlands
Ecological and Economical efficiency of Constructed Wetlands and Transferability of Decentralized Wastewater Treatment Operation to Nepal
water. Large pores known as macropores allow the ready movement of air and the
drainage of water. They are also large enough to accommodate plant roots and the
wide range of tiny animals that inhabit the soil (Brady and Weil, 1999; Munshower,
1994). Clay soils have numerous micropores which help to hold large quantities of
water, but since they have few macropores cause very slow infiltration rates. The
pores in the clays may be so small and hold water so tenaciously that the water is not
available to plants. Sandy soils with numerous macropores but few micropores have
higher infiltration and percolation rates but a lower water-holding capacity than other
soil textures. (Munshower, 1994).
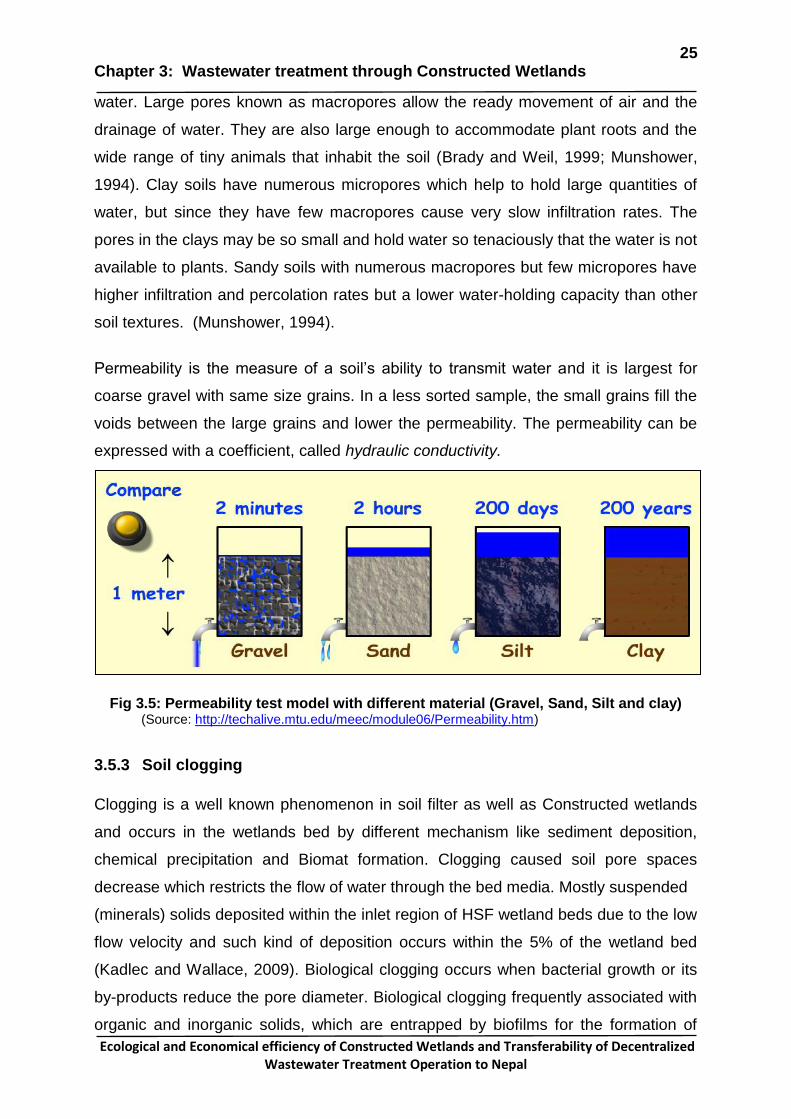
Permeability is the measure of a soil‟s ability to transmit water and it is largest for
coarse gravel with same size grains. In a less sorted sample, the small grains fill the
voids between the large grains and lower the permeability. The permeability can be
expressed with a coefficient, called hydraulic conductivity.
Fig 3.5: Permeability test model with different material (Gravel, Sand, Silt and clay) (Source: http://techalive.mtu.edu/meec/module06/Permeability.htm)
3.5.3 Soil clogging
Clogging is a well known phenomenon in soil filter as well as Constructed wetlands
and occurs in the wetlands bed by different mechanism like sediment deposition,
chemical precipitation and Biomat formation. Clogging caused soil pore spaces
decrease which restricts the flow of water through the bed media. Mostly suspended
(minerals) solids deposited within the inlet region of HSF wetland beds due to the low
flow velocity and such kind of deposition occurs within the 5% of the wetland bed
(Kadlec and Wallace, 2009). Biological clogging occurs when bacterial growth or its
by-products reduce the pore diameter. Biological clogging frequently associated with
organic and inorganic solids, which are entrapped by biofilms for the formation of
Lactobacillus, Micrococcus, Proteus, Pseudomonas and Spirillum are capable of
dissimilatory nitrate reduction (Cooper, 1996).
Denitrification occurs when oxygen levels are depleted and nitrate becomes the
primary oxygen source for microorganisms. The process is performed under anoxic
conditions, when the dissolved oxygen concentration is less than 0.5 mg/L, ideally
less than 0.2. When denitrifying bacteria break apart nitrate (NO3-) to gain the oxygen
(O2), the nitrate is reduced to nitrous oxide (N2O), and, in turn, nitrogen gas (N2). In
unbalanced equation form:
NO3-
→ NO2 - →NO → N2O → N2
Since nitrogen gas has low water solubility, it escapes into the atmosphere as gas
bubbles. Free nitrogen is the major component of air, thus its release does not cause
any environmental concern. Since denitrifying bacteria are facultative organisms,
they can use either dissolved oxygen or nitrate as an oxygen source for metabolism
and oxidation of organic matter. If dissolved oxygen and nitrate are present, bacteria
31 Chapter 3: Wastewater treatment through Constructed Wetlands
Ecological and Economical efficiency of Constructed Wetlands and Transferability of Decentralized Wastewater Treatment Operation to Nepal
will use the dissolved oxygen first. That is, the bacteria will not lower the nitrate
concentration. Denitrification occurs only under anaerobic or anoxic conditions.
Conditions that affect the efficiency of denitrification include nitrate concentration,
anoxic conditions, and presence of organic matter, pH, temperature, alkalinity and
the effects of trace metals.
Cooper et al. (1996) pointed out that optimum pH values for denitrification are
between 7.0 and 8; however, pH value rised due to the alkalinity production during
denitrification. Denitrification is also strongly temperature dependent and proceeds at
very slow rates, at temperature below 5°C.
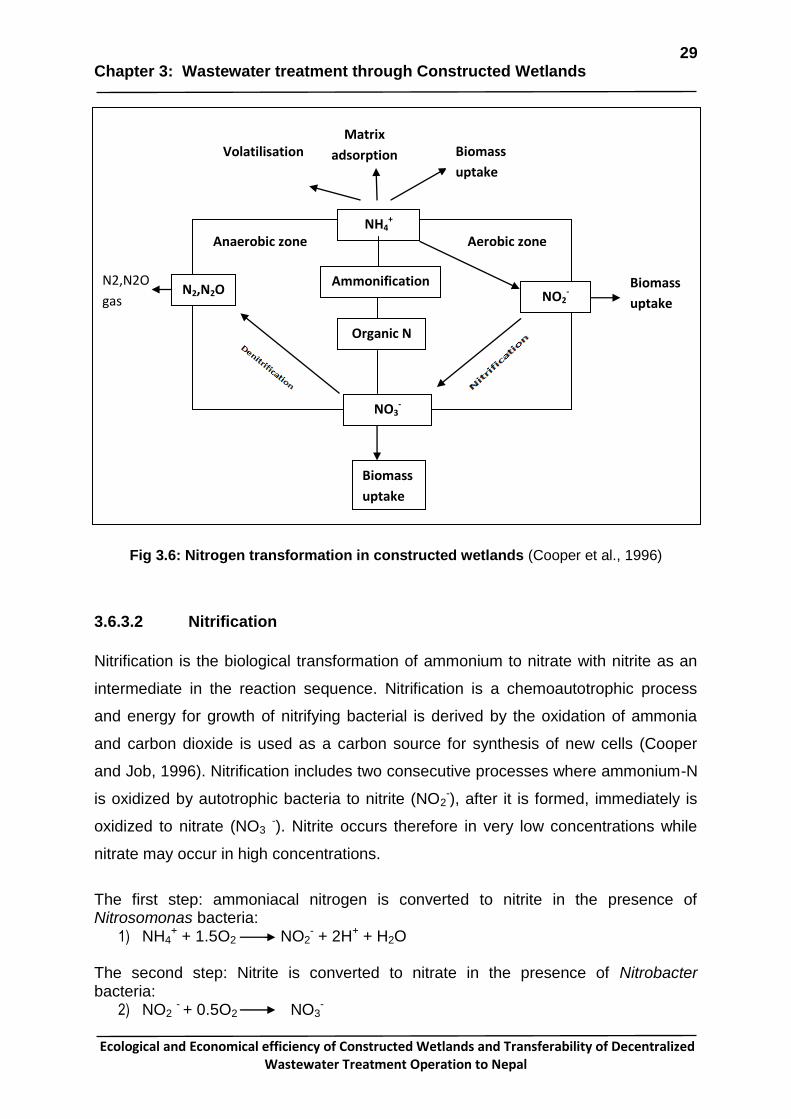
3.6.3.4 Plant uptake
Nitrogen removable mechanism also depends upon plant uptake system especially
macrophytes which are used in CWs will take up nitrogen in its mineralized state and
incorporate it into its biomass and tissue through their root system. However, the
potential nitrogen uptake capacity by plants is limited by its productivity (growth rate)
and the nutrient content in the plant tissue.
The uptake capacity of emergent macrophytes, when the biomass is harvested, is
roughly on the range of 1000-2500 kg N ha-1yr-1 and highly productive Water
Hyacinth (Eichhornia crassipes) have higher uptake capacity up to nearly 6000kg N
ha-1yr-1 whereas submerged macrophytes is lower range of about 700 kg N ha-1yr-1
(Brix,1994a, Vymazal,1998). Similarly, Gersberg et.al (1985) pointed out that the
amount of nitrogen removed with biomass under optimum condition can be achieved
10-16% of the total removed nitrogen. Furthermore, nitrogen is only temporarily
stored in the emergent plant biomass and will return back to the wetland system by
decomposition process through an annual cycle of growth and die back. Regularly
harvesting of the aboveground biomass can be realized in order to improve the total
nitrogen removal efficiency. Although wetland plants show generally a high
productivity and can incorporate considerable amounts of nitrogen into their biomass,
the uptake rates are relatively insignificant compared to the total nitrogen loading
charged into the constructed wetland (Brix, 1994a).
32 Chapter 3: Wastewater treatment through Constructed Wetlands
Ecological and Economical efficiency of Constructed Wetlands and Transferability of Decentralized Wastewater Treatment Operation to Nepal
3.6.3.5 Sediment adsorption
Removal of nitrogen through matrix adsorption (fixation of nitrogen at soil particles)
accounts for the third pathway nitrogen can be removed from wastewater. In a
reduced state of ammonium N is stable and can be adsorbed onto active sites of the
bed matrix. However, cation exchange in the bed matrix is not a long-term sink for
NH4-N removal and NH4-N sorption in continuous flow will be equilibrium with NH4-N
sorption solution. Only in the intermittent loading of a system will show rapid
removals of NH4-N by adsorption mechanism due to depletion of NH4-N during rest
periods (Cooper, 1996). This process amounts to about another 10 % of the total
nitrogen removal rate and can be considered as insignificant (Wissing, 2002).
3.6.4 Phosphorus Removal
Phosphorus in wastewater occurs mostly in the form of phosphates and organic
phosphorus. The main mechanisms for phosphorus removal in subsurface flow
systems are chemical and physical adsorption, precipitation in the soil matrix and
plant uptake. The adsorption and retention of phosphorus in wetland soils depends
primarily on the soil type and chemical composition, and further, surrounding
conditions such as pH value, redox potential (Vymazal et al.1998). In acid soils,
inorganic P is adsorbed on hydrous oxides of Fe and Al and may precipitate as
insoluble Fe phosphates and Al phosphates. Precipitation as Ca-P is the dominant
transformation at pH greater than 7.0 (Cooper, 1996).
Soil with high amounts of clay has a large capacity to bind P than non-cohesive,
coarser-textured soils (gravel beds), but the permeability is low. Hence there have
been hydraulic problems in constructed wetlands. The P removal can be improved
using a filter medium that has a large capacity to bind P, like gravel with high
amounts of calcium or iron.
Like nitrogen, phosphorus is taken up through the root system and transports it to the
growing tissues, particularly at the beginning of the growing season (in temperate
regions during the early spring). The uptake capacity of emergent macrophytes is
lower as compared to nitrogen and phosphorus removal by plant uptake is roughly
50-100 kg P ha-1yr-1(Brix, 1994a). However, the wetland vegetation acts only as a
33 Chapter 3: Wastewater treatment through Constructed Wetlands
Ecological and Economical efficiency of Constructed Wetlands and Transferability of Decentralized Wastewater Treatment Operation to Nepal
temporary storage, thus, phosphorus removal through plants is limited to seasonal
uptake during the vegetation period. Phosphorus contents for plants such as reeds
ranges from 0.9 to 1.35 mg/g (dry weight) for stems, 1.0 to 1.7 for leaves, and 0.9 to
1.63 for whole shoots (Davies, 1993).Phosphorus removal by plant harvesting is also
found often less than 10% of the annual load even in lightly loaded wetlands
(Herskowitz, 1986) and Hurry et al. (1990) pointer out the uptake of phosphorus by
plant in constructed wetland is only 7 %.
3.6.5 Pathogen Removal
Bacteria and viruses are important organisms from a public point of view as well as
protozoan pathogens and helminth worms are also of particular importance in tropical
and subtropical countries. Pathogens are removed in constructed wetlands by the
suitable combination of physical, chemical and biological process (Cooper, 1996).
In the physical factor, filtration and sedimentation are major processes, which may be
involved in the reduction of pathogens in wetlands. Chemical factors include
oxidation, UV radiation, exposure to biocides excreted by some plants and
absorption to organic matter. Biological removal mechanisms include antibiosis,
predation by nematodes, protists and zooplankton, attack by lytic bacteria and
viruses and natural die-off (Cooper et al. 1996). The die-off rates of all the bacteria
and coliphage were greater in the water column than the sediment. The die-off rates
of fecal coliforms in the water and sediment were 0.256 log10 day-1 and 0.151 log10
day-1, respectively (Karim, 2004).
With the literature survey of 60 constructed wetlands around the world, the removal
efficiency of total coliforms (TC) and fecal coliforms (FC) in constructed wetlands with
emergent macrophytes is high, usually 95 to >99% while removal of fecal
streptococci is lower, usually 80–95%. Whereas TC and FC in the outflow
concentrations are usually in the range of 102 to 105 CFU/ 100 ml while for fecal
streptococci (FS) the range is between 102 and 104 CFU/ 100 ml. Bacterial removal
efficiency is a function of inflow bacteria number, therefore, the outflow numbers of
bacteria are more important (Vymazal, 2005). The removal efficiency also depends
upon the hydraulic retention time.
34 Chapter 4: Criteria for the design of subsurface flow CWs
Ecological and Economical efficiency of Constructed Wetlands and Transferability of Decentralized Wastewater Treatment Operation to Nepal
4 Criteria for the design of subsurface flow CWs
Constructed wetlands are usually designed as a secondary treatment for removal of
suspended solids (SS) and organic matter (BOD and COD) and as a tertiary
(advanced) treatment for nutrient removal (nitrogen and phosphorus). Primary
treatment occurs normally conventionally in septic tanks having three-room digesters
or Imhoff tanks, but also in pond systems. They also remove pathogens, heavy
metals and organic contaminants.
4.1 Basic design recommendations
4.1.1 General consideration about planning /necessary conditions
The general considerations for being able to use constructed wetlands for wastewater treatment are: Retention, enhancement and interpretation of existing ecological, landscape and
cultural values, such as trees and other native vegetation and sites of archeological
significance should be considered. These are valuable assets that will be of interest
to the local community and help to create a unique sense of place. A successful
physical pre-treatment is necessary for a good performance of all constructed
wetlands. Enough space should be availability because it is a “low-rate system” with
a higher space requirement than technical systems. Construction place of CWs
should be fully receiving sunlight instead of shadow. Urbanization and population
developments have to be considered when calculating the expected wastewater flow
rate to the constructed wetland. The use of locally indigenous species in wetland
plantings ensures that plants are adapted to local environmental conditions and that
the character of the wetland is „in keeping‟ with the surrounding landscape
The substrate used should not contain loam, silt or other fine material, nor should it
consist of material with sharp edges. Uniform distribution of the wastewater in the
inlet area and surface area. A sufficient hydraulic capacity of the beds has to be
proven by application of Darcy´s law. The surface of the beds should be flat to omit
unequal distribution or surface run off so that short circuits can be avoided. Basic
design of CWs has to take into account suspended solids and organic load. CWs
beds have to be designed considering nitrification and denitrification using oxygen
consumption, soil aeration, and availability of carbon source as additional criteria.
35 Chapter 4: Criteria for the design of subsurface flow CWs
Ecological and Economical efficiency of Constructed Wetlands and Transferability of Decentralized Wastewater Treatment Operation to Nepal
4.1.2 Design life
The exact design life of constructed wetlands cannot be calculated but only be
expected to have at least 30-40 years. This is one of assumption based on different
literature study. The design life will be long till CWs fulfill the objective of treatment.
There are no theoretical reasons which would indicate that constructed wetlands
would stop working after a certain length of time (at least for removal of organic
matter, nitrogen and pathogens).
The design life is determined by the design life of major components involved in
constructed wetland such as influent pump, plastic pipes, plastic lining, gravel and
sand. The pumps and feeding pipes can easily be replaced if necessary. The gravel
and sand will never need replacement. The exact design life of the plastic lining is
also unknown and the condition of the plastic lining can also not be verified in an
operational constructed wetland. If a constructed wetland ever has to be abandoned,
it is easy to use the space of the former constructed wetland for other purposes, or to
just let the plants grow wild.
4.1.3 Design parameters
There are several design parameters or approaches for subsurface flow CWs which
are used at different points in the design calculations, depending on the type of
wastewater and climate:
Average flow rate of wastewater (m3/s)
Surface area per person equivalent (in m²/p.e.)
Organic loading per surface area (in g BOD or gCOD/(m² d))
Hydraulic load (in mm/d or m3/(m2·d))
Oxygen consumption and input.
Detention time (day)
Hydraulic gradient (m/m or %)
Base slope (m/m or %)
36 Chapter 4: Criteria for the design of subsurface flow CWs
Ecological and Economical efficiency of Constructed Wetlands and Transferability of Decentralized Wastewater Treatment Operation to Nepal
4.2 Design principles of subsurface flow CWs
The focus of this chapter is the general principles for horizontal flow (HF) and vertical
flow (VF) constructed wetlands, which are both subsurface flow type constructed
wetlands. The filter bed is based on sand and plant roots (the gravel in the bed does
not have a filtering function, but just covers the drainage pipe and avoids puddles on
the surface layer). Detailed design of a subsurface flow CWs are described below
detail as per the literature information achieved.
4.2.1 Horizontal flow (HF) CWs
In the beginning HF CWs had some problems with surface run-off and therefore often
poor treatment results, but nowadays well-designed HF CWs are widely accepted as
a robust and low maintenance treatment system. HF CWs are an interesting option
especially in locations without energy supply and low hydraulic gradient.
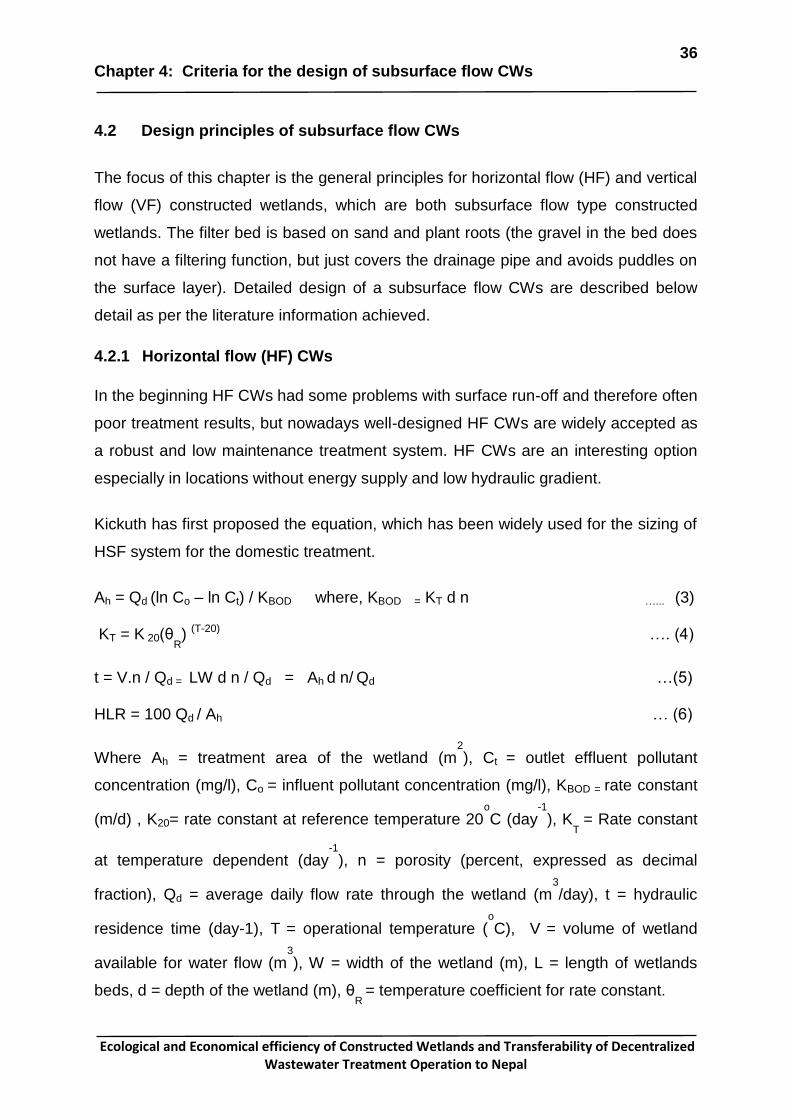
Kickuth has first proposed the equation, which has been widely used for the sizing of
HSF system for the domestic treatment.
Ah = Qd (ln Co – ln Ct) / KBOD where, KBOD = KT d n …... (3) KT = K 20(θ
R) (T-20) …. (4)
t = V.n / Qd = LW d n / Qd = Ah d n/ Qd …(5) HLR = 100 Qd / Ah … (6)
(m/d) , K20= rate constant at reference temperature 20o
C (day-1
), KT
= Rate constant
at temperature dependent (day-1
), n = porosity (percent, expressed as decimal
fraction), Qd = average daily flow rate through the wetland (m3
/day), t = hydraulic
residence time (day-1), T = operational temperature (
o
C), V = volume of wetland
available for water flow (m3
), W = width of the wetland (m), L = length of wetlands
beds, d = depth of the wetland (m), θR
= temperature coefficient for rate constant.
37 Chapter 4: Criteria for the design of subsurface flow CWs
Ecological and Economical efficiency of Constructed Wetlands and Transferability of Decentralized Wastewater Treatment Operation to Nepal
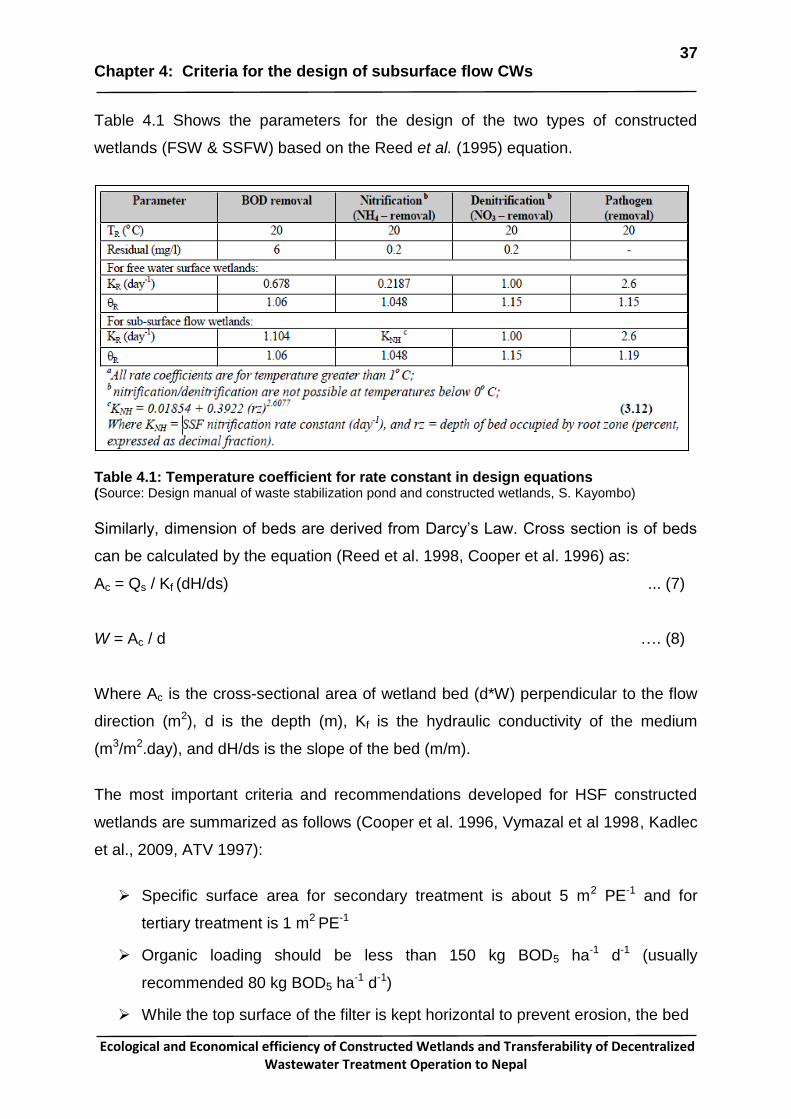
Table 4.1 Shows the parameters for the design of the two types of constructed
wetlands (FSW & SSFW) based on the Reed et al. (1995) equation.
Table 4.1: Temperature coefficient for rate constant in design equations (Source: Design manual of waste stabilization pond and constructed wetlands, S. Kayombo)
Similarly, dimension of beds are derived from Darcy‟s Law. Cross section is of beds
can be calculated by the equation (Reed et al. 1998, Cooper et al. 1996) as:
Ac = Qs / Kf (dH/ds) ... (7)
W = Ac / d …. (8)
Where Ac is the cross-sectional area of wetland bed (d*W) perpendicular to the flow
direction (m2), d is the depth (m), Kf is the hydraulic conductivity of the medium
(m3/m2.day), and dH/ds is the slope of the bed (m/m).
The most important criteria and recommendations developed for HSF constructed
wetlands are summarized as follows (Cooper et al. 1996, Vymazal et al 1998, Kadlec
et al., 2009, ATV 1997):
Specific surface area for secondary treatment is about 5 m2 PE-1 and for
tertiary treatment is 1 m2 PE-1
Organic loading should be less than 150 kg BOD5 ha-1 d-1 (usually
recommended 80 kg BOD5 ha-1 d-1)
While the top surface of the filter is kept horizontal to prevent erosion, the bed
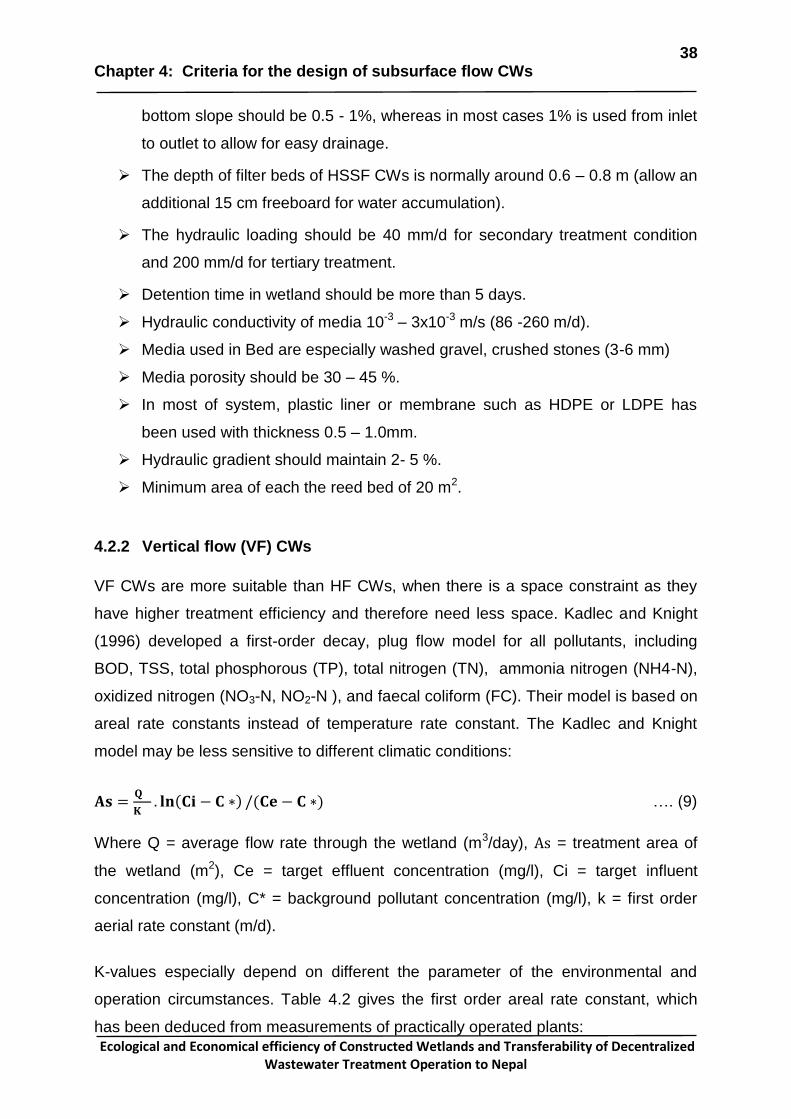
38 Chapter 4: Criteria for the design of subsurface flow CWs
Ecological and Economical efficiency of Constructed Wetlands and Transferability of Decentralized Wastewater Treatment Operation to Nepal
bottom slope should be 0.5 - 1%, whereas in most cases 1% is used from inlet
to outlet to allow for easy drainage.
The depth of filter beds of HSSF CWs is normally around 0.6 – 0.8 m (allow an
additional 15 cm freeboard for water accumulation).
The hydraulic loading should be 40 mm/d for secondary treatment condition
and 200 mm/d for tertiary treatment.
Detention time in wetland should be more than 5 days.
Hydraulic conductivity of media 10-3 – 3x10⁻³ m/s (86 -260 m/d).
Media used in Bed are especially washed gravel, crushed stones (3-6 mm)
Media porosity should be 30 – 45 %.
In most of system, plastic liner or membrane such as HDPE or LDPE has
been used with thickness 0.5 – 1.0mm.
Hydraulic gradient should maintain 2- 5 %.
Minimum area of each the reed bed of 20 m2.
4.2.2 Vertical flow (VF) CWs
VF CWs are more suitable than HF CWs, when there is a space constraint as they
have higher treatment efficiency and therefore need less space. Kadlec and Knight
(1996) developed a first-order decay, plug flow model for all pollutants, including
BOD, TSS, total phosphorous (TP), total nitrogen (TN), ammonia nitrogen (NH4-N),
oxidized nitrogen (NO3-N, NO2-N ), and faecal coliform (FC). Their model is based on
areal rate constants instead of temperature rate constant. The Kadlec and Knight
model may be less sensitive to different climatic conditions:
…. (9)
Where Q = average flow rate through the wetland (m3/day), = treatment area of
the wetland (m2), Ce = target effluent concentration (mg/l), Ci = target influent
concentration (mg/l), C* = background pollutant concentration (mg/l), k = first order
aerial rate constant (m/d).
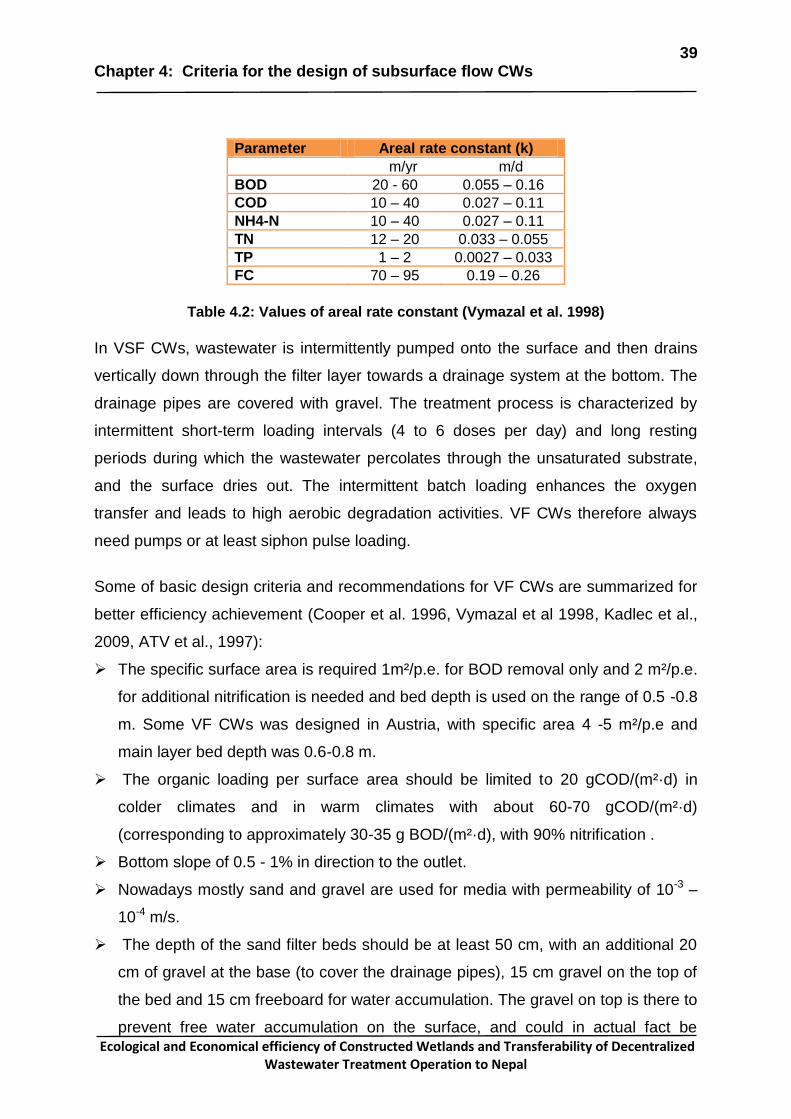
K-values especially depend on different the parameter of the environmental and
operation circumstances. Table 4.2 gives the first order areal rate constant, which
has been deduced from measurements of practically operated plants:
39 Chapter 4: Criteria for the design of subsurface flow CWs
Ecological and Economical efficiency of Constructed Wetlands and Transferability of Decentralized Wastewater Treatment Operation to Nepal
Parameter Areal rate constant (k)
m/yr m/d
BOD 20 - 60 0.055 – 0.16
COD 10 – 40 0.027 – 0.11
NH4-N 10 – 40 0.027 – 0.11
TN 12 – 20 0.033 – 0.055
TP 1 – 2 0.0027 – 0.033
FC 70 – 95 0.19 – 0.26
Table 4.2: Values of areal rate constant (Vymazal et al. 1998)
In VSF CWs, wastewater is intermittently pumped onto the surface and then drains
vertically down through the filter layer towards a drainage system at the bottom. The
drainage pipes are covered with gravel. The treatment process is characterized by
intermittent short-term loading intervals (4 to 6 doses per day) and long resting
periods during which the wastewater percolates through the unsaturated substrate,
and the surface dries out. The intermittent batch loading enhances the oxygen
transfer and leads to high aerobic degradation activities. VF CWs therefore always
need pumps or at least siphon pulse loading.
Some of basic design criteria and recommendations for VF CWs are summarized for
better efficiency achievement (Cooper et al. 1996, Vymazal et al 1998, Kadlec et al.,
2009, ATV et al., 1997):
The specific surface area is required 1m²/p.e. for BOD removal only and 2 m²/p.e.
for additional nitrification is needed and bed depth is used on the range of 0.5 -0.8
m. Some VF CWs was designed in Austria, with specific area 4 -5 m²/p.e and
main layer bed depth was 0.6-0.8 m.
The organic loading per surface area should be limited to 20 gCOD/(m²·d) in
colder climates and in warm climates with about 60-70 gCOD/(m²·d)
(corresponding to approximately 30-35 g BOD/(m²·d), with 90% nitrification .
Bottom slope of 0.5 - 1% in direction to the outlet.
Nowadays mostly sand and gravel are used for media with permeability of 10-3 –
10-4 m/s.
The depth of the sand filter beds should be at least 50 cm, with an additional 20
cm of gravel at the base (to cover the drainage pipes), 15 cm gravel on the top of
the bed and 15 cm freeboard for water accumulation. The gravel on top is there to
prevent free water accumulation on the surface, and could in actual fact be
40 Chapter 4: Criteria for the design of subsurface flow CWs
Ecological and Economical efficiency of Constructed Wetlands and Transferability of Decentralized Wastewater Treatment Operation to Nepal
omitted in case of constructed wetlands without free access for members of the
public.
The hydraulic loading for VF CWs in colder climate should not exceed 100 - 120
mm/d and in summer hydraulic rates up to 200 mm/d of pre-treated wastewater
could be applied without negative influence.
Minimum area of each reed bed size 10 m2.
41 Chapter 5: Substrate in Subsurface flow CWs
Ecological and Economical efficiency of Constructed Wetlands and Transferability of Decentralized Wastewater Treatment Operation to Nepal
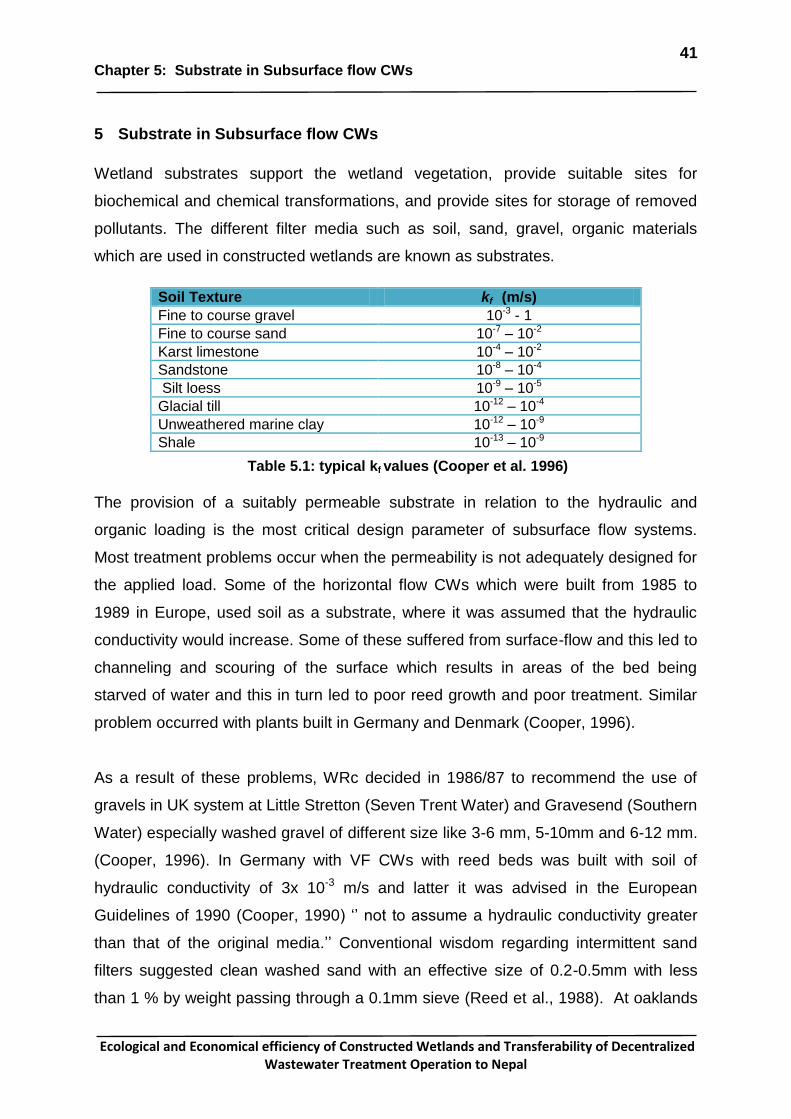
5 Substrate in Subsurface flow CWs
Wetland substrates support the wetland vegetation, provide suitable sites for
biochemical and chemical transformations, and provide sites for storage of removed
pollutants. The different filter media such as soil, sand, gravel, organic materials
which are used in constructed wetlands are known as substrates.
Table 5.1: typical kf values (Cooper et al. 1996)
The provision of a suitably permeable substrate in relation to the hydraulic and
organic loading is the most critical design parameter of subsurface flow systems.
Most treatment problems occur when the permeability is not adequately designed for
the applied load. Some of the horizontal flow CWs which were built from 1985 to
1989 in Europe, used soil as a substrate, where it was assumed that the hydraulic
conductivity would increase. Some of these suffered from surface-flow and this led to
channeling and scouring of the surface which results in areas of the bed being
starved of water and this in turn led to poor reed growth and poor treatment. Similar
problem occurred with plants built in Germany and Denmark (Cooper, 1996).
As a result of these problems, WRc decided in 1986/87 to recommend the use of
gravels in UK system at Little Stretton (Seven Trent Water) and Gravesend (Southern
Water) especially washed gravel of different size like 3-6 mm, 5-10mm and 6-12 mm.
(Cooper, 1996). In Germany with VF CWs with reed beds was built with soil of
hydraulic conductivity of 3x 10⁻³ m/s and latter it was advised in the European
Guidelines of 1990 (Cooper, 1990) „‟ not to assume a hydraulic conductivity greater
than that of the original media.‟‟ Conventional wisdom regarding intermittent sand
filters suggested clean washed sand with an effective size of 0.2-0.5mm with less
than 1 % by weight passing through a 0.1mm sieve (Reed et al., 1988). At oaklands
Soil Texture kf (m/s)
Fine to course gravel 10-3 - 1
Fine to course sand 10-7 – 10-2
Karst limestone 10-4 – 10-2
Sandstone 10-8 – 10-4
Silt loess 10-9 – 10-5
Glacial till 10-12 – 10-4
Unweathered marine clay 10-12 – 10-9
Shale 10-13 – 10-9
42 Chapter 5: Substrate in Subsurface flow CWs
Ecological and Economical efficiency of Constructed Wetlands and Transferability of Decentralized Wastewater Treatment Operation to Nepal
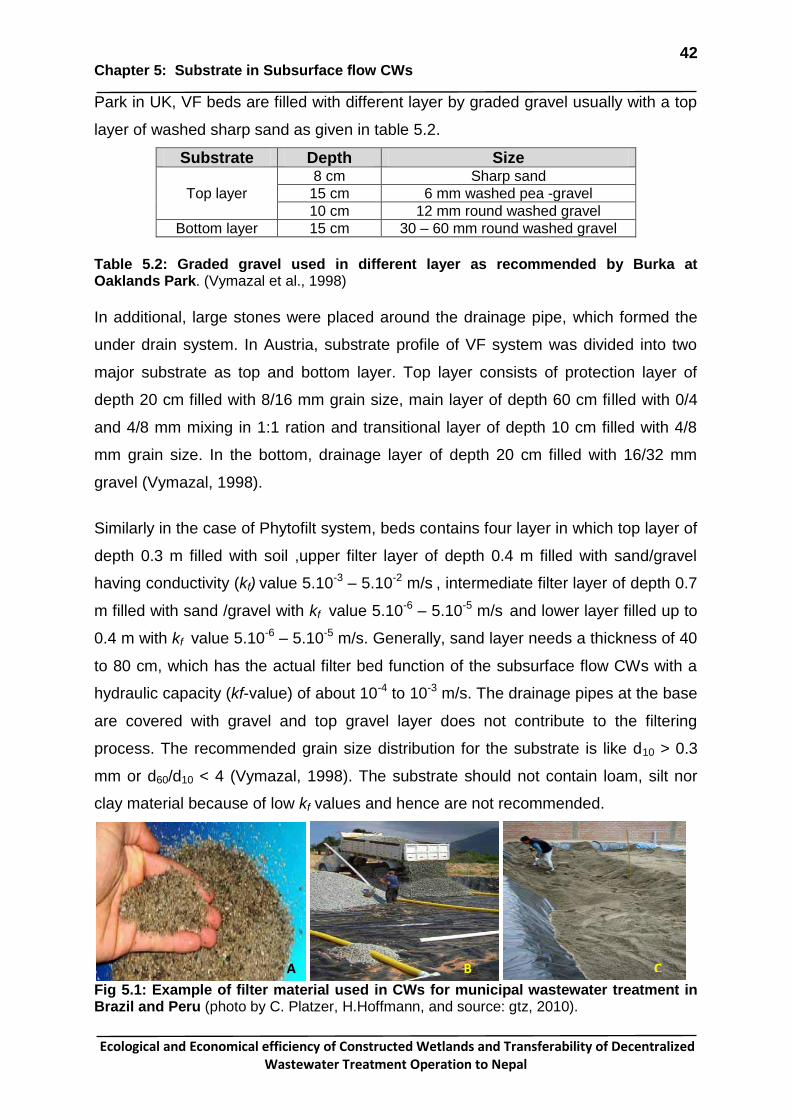
Park in UK, VF beds are filled with different layer by graded gravel usually with a top
layer of washed sharp sand as given in table 5.2.
Substrate Depth Size
Top layer
8 cm Sharp sand
15 cm 6 mm washed pea -gravel
10 cm 12 mm round washed gravel
Bottom layer 15 cm 30 – 60 mm round washed gravel
Table 5.2: Graded gravel used in different layer as recommended by Burka at Oaklands Park. (Vymazal et al., 1998)
In additional, large stones were placed around the drainage pipe, which formed the
under drain system. In Austria, substrate profile of VF system was divided into two
major substrate as top and bottom layer. Top layer consists of protection layer of
depth 20 cm filled with 8/16 mm grain size, main layer of depth 60 cm filled with 0/4
and 4/8 mm mixing in 1:1 ration and transitional layer of depth 10 cm filled with 4/8
mm grain size. In the bottom, drainage layer of depth 20 cm filled with 16/32 mm
gravel (Vymazal, 1998).
Similarly in the case of Phytofilt system, beds contains four layer in which top layer of
depth 0.3 m filled with soil ,upper filter layer of depth 0.4 m filled with sand/gravel
having conductivity (kf) value 5.10-3 – 5.10-2 m/s , intermediate filter layer of depth 0.7
m filled with sand /gravel with kf value 5.10-6 – 5.10-5 m/s and lower layer filled up to
0.4 m with kf value 5.10-6 – 5.10-5 m/s. Generally, sand layer needs a thickness of 40
to 80 cm, which has the actual filter bed function of the subsurface flow CWs with a
hydraulic capacity (kf-value) of about 10-4 to 10-3 m/s. The drainage pipes at the base
are covered with gravel and top gravel layer does not contribute to the filtering
process. The recommended grain size distribution for the substrate is like d10 > 0.3
mm or d60/d10 < 4 (Vymazal, 1998). The substrate should not contain loam, silt nor
clay material because of low kf values and hence are not recommended.
Fig 5.1: Example of filter material used in CWs for municipal wastewater treatment in Brazil and Peru (photo by C. Platzer, H.Hoffmann, and source: gtz, 2010).
A B C
43 Chapter 6: Macrophytes used in Constructed Wetlands
Ecological and Economical efficiency of Constructed Wetlands and Transferability of Decentralized Wastewater Treatment Operation to Nepal
6 Macrophytes used in the Constructed wetlands
Macrophytic plants provide much of the visible structured of wetland treatment
system. These macrophytes are very important for physical, chemical and microbial
process in the CWs. A basic understanding of the growth requirement and
characteristics of these wetland plants is essential for successful treatment wetlands
design and operation.
Macrophytes have several properties in relation to the treatment process and most
important effects of the macrophytes are the physical effects that plant tissues
prevent the formation of erosion channel, prevent clogging of bed medium, provide
the surface area for attached microorganisms (Brix, 1994a). Similarly plant uptake of
nutrients is only of quantitative importance in low loaded system which is described
detail in chapter 3 (section 3.6) and more focus is given in this chapter about the
transfer of oxygen to the rhizosphere by leakage from root and type of macrophytes
used in CWs. Moreover, macrophytes have additional site specific values such as
providing a suitable habit for wildlife and giving a system an aesthetically
appearance.
6.1 Type of macrophytes used in CWs
A wide range of macrophytic plants occur naturally in wetlands environment and have
been recognized to have the ability to treat wastewater. The United State Fish and
Wildlife Service has found more than 6700 plant species on their list of obligate and
facultative wetland plant species in the United States (Kadlec, 2009). Four groups of
aquatic macrophytes can be used distinguished on a basis of morphology and
physiology (Wetzel, 2001).
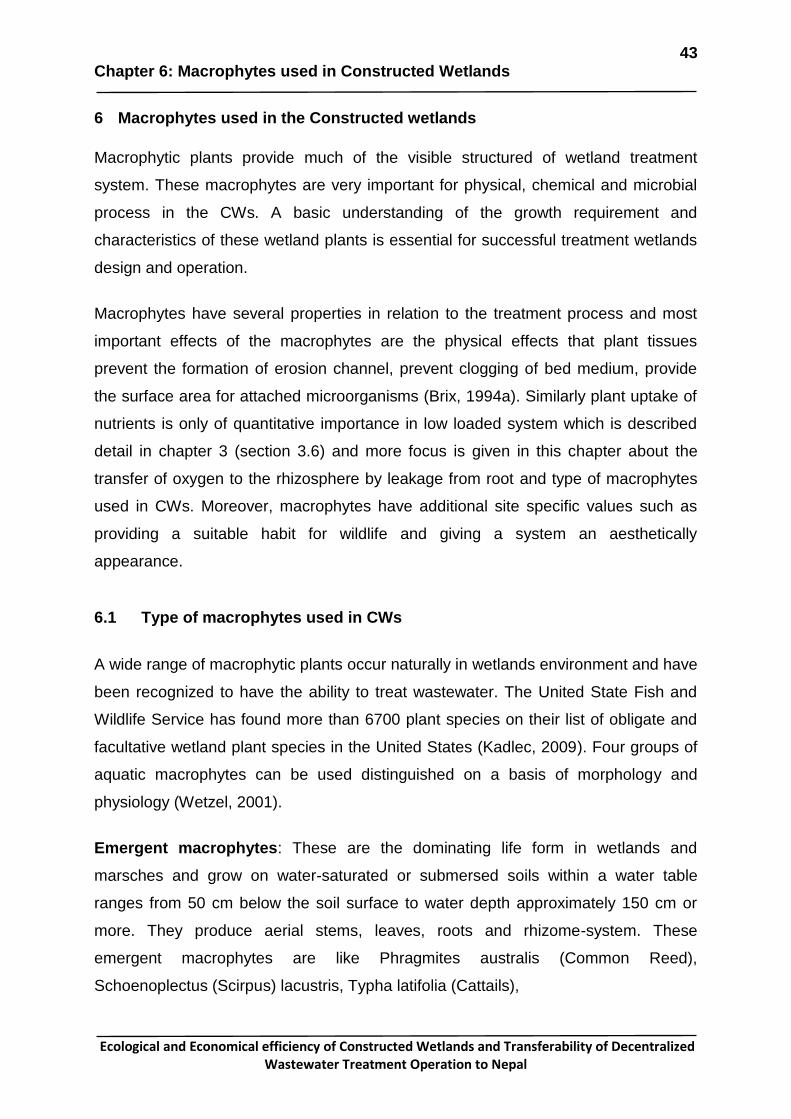
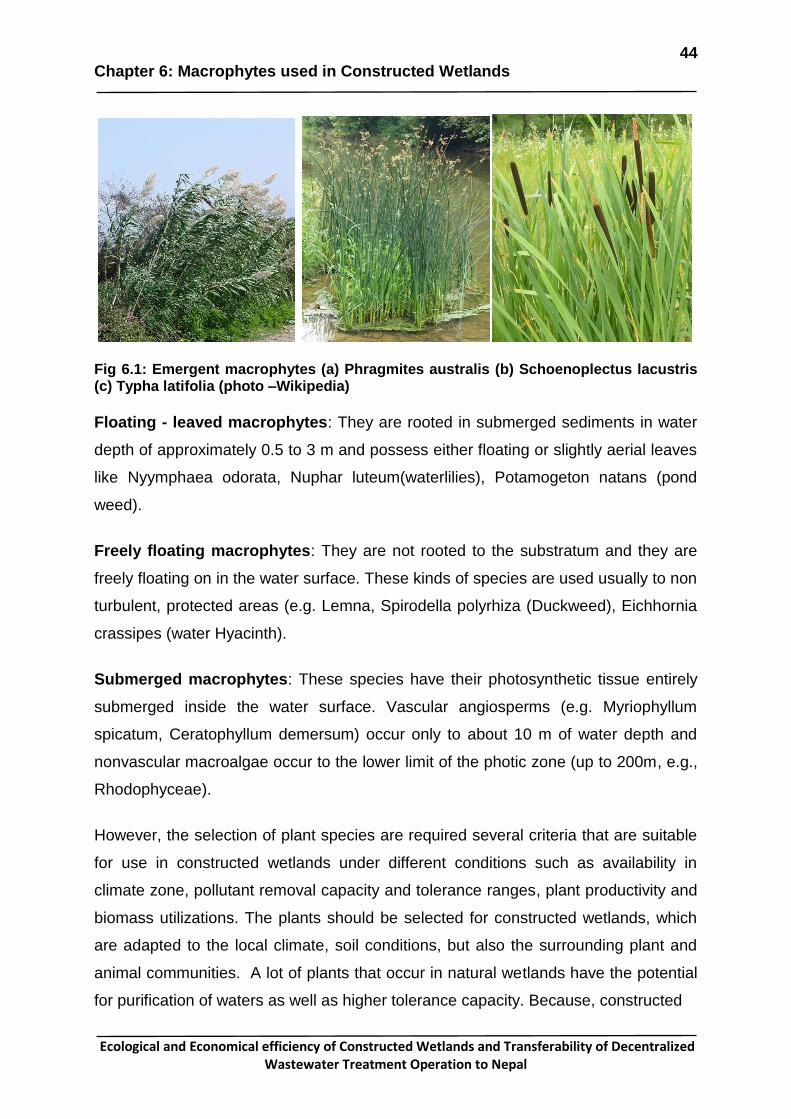
Emergent macrophytes: These are the dominating life form in wetlands and
marsches and grow on water-saturated or submersed soils within a water table
ranges from 50 cm below the soil surface to water depth approximately 150 cm or
more. They produce aerial stems, leaves, roots and rhizome-system. These
emergent macrophytes are like Phragmites australis (Common Reed),
calamus (Sweet-flag) (Cooper et al., 1996, Vymazal et al., 1998). The emergent
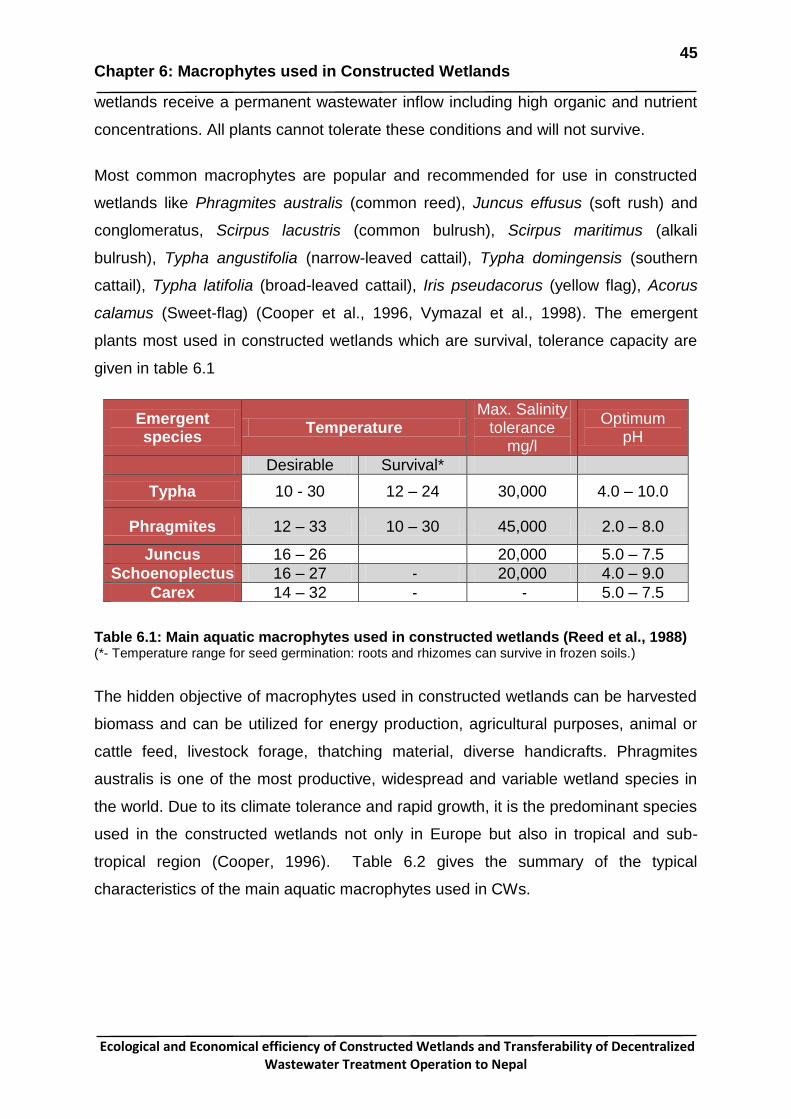
plants most used in constructed wetlands which are survival, tolerance capacity are
given in table 6.1
Table 6.1: Main aquatic macrophytes used in constructed wetlands (Reed et al., 1988) (*- Temperature range for seed germination: roots and rhizomes can survive in frozen soils.)
The hidden objective of macrophytes used in constructed wetlands can be harvested
biomass and can be utilized for energy production, agricultural purposes, animal or
cattle feed, livestock forage, thatching material, diverse handicrafts. Phragmites
australis is one of the most productive, widespread and variable wetland species in
the world. Due to its climate tolerance and rapid growth, it is the predominant species
used in the constructed wetlands not only in Europe but also in tropical and sub-
tropical region (Cooper, 1996). Table 6.2 gives the summary of the typical
characteristics of the main aquatic macrophytes used in CWs.
Emergent species
Temperature Max. Salinity
tolerance mg/l
Optimum pH
Desirable Survival*
Typha 10 - 30 12 – 24 30,000 4.0 – 10.0
Phragmites 12 – 33 10 – 30 45,000 2.0 – 8.0
Juncus 16 – 26 20,000 5.0 – 7.5
Schoenoplectus 16 – 27 - 20,000 4.0 – 9.0
Carex 14 – 32 - - 5.0 – 7.5
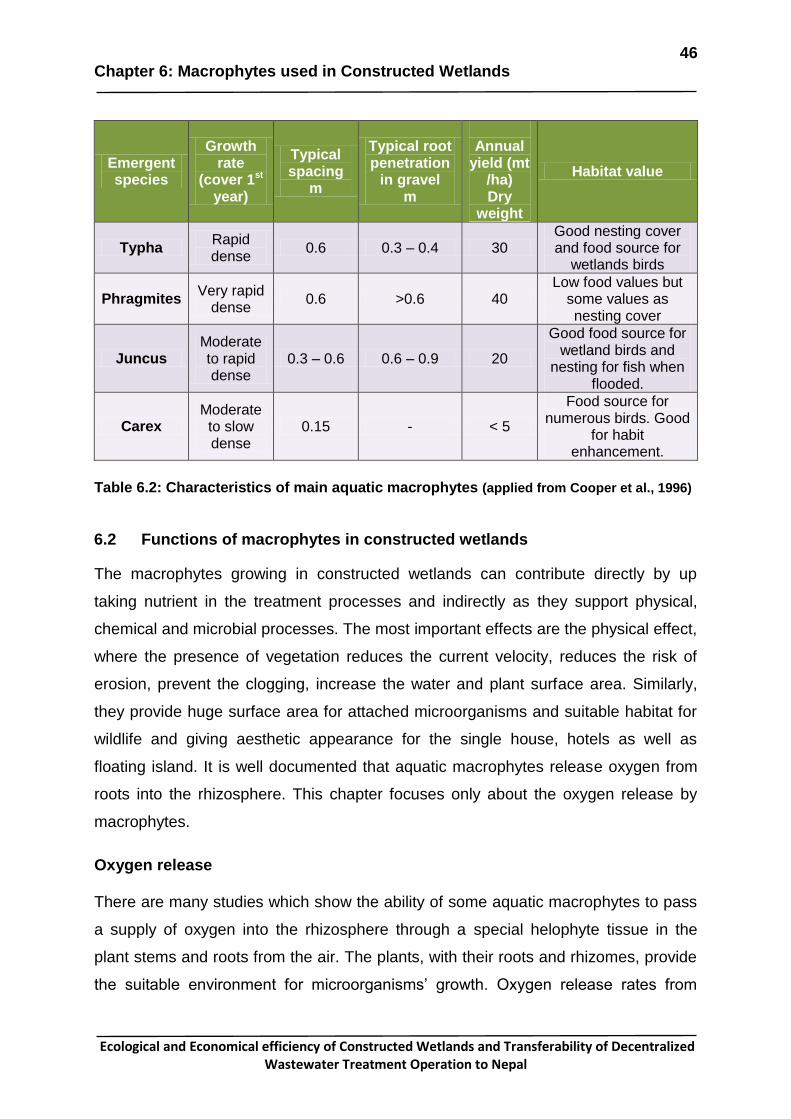
46 Chapter 6: Macrophytes used in Constructed Wetlands
Ecological and Economical efficiency of Constructed Wetlands and Transferability of Decentralized Wastewater Treatment Operation to Nepal
Emergent species
Growth rate
(cover 1st year)
Typical spacing
m
Typical root penetration
in gravel m
Annual
yield (mt /ha) Dry
weight
Habitat value
Typha Rapid dense
0.6 0.3 – 0.4 30 Good nesting cover and food source for
wetlands birds
Phragmites Very rapid
dense 0.6 >0.6 40
Low food values but some values as nesting cover
Juncus Moderate to rapid dense
0.3 – 0.6 0.6 – 0.9 20
Good food source for wetland birds and
nesting for fish when flooded.
Carex Moderate to slow dense
0.15 - < 5
Food source for numerous birds. Good
for habit enhancement.
Table 6.2: Characteristics of main aquatic macrophytes (applied from Cooper et al., 1996)
6.2 Functions of macrophytes in constructed wetlands
The macrophytes growing in constructed wetlands can contribute directly by up
taking nutrient in the treatment processes and indirectly as they support physical,
chemical and microbial processes. The most important effects are the physical effect,
where the presence of vegetation reduces the current velocity, reduces the risk of
erosion, prevent the clogging, increase the water and plant surface area. Similarly,
they provide huge surface area for attached microorganisms and suitable habitat for
wildlife and giving aesthetic appearance for the single house, hotels as well as
floating island. It is well documented that aquatic macrophytes release oxygen from
roots into the rhizosphere. This chapter focuses only about the oxygen release by
macrophytes.
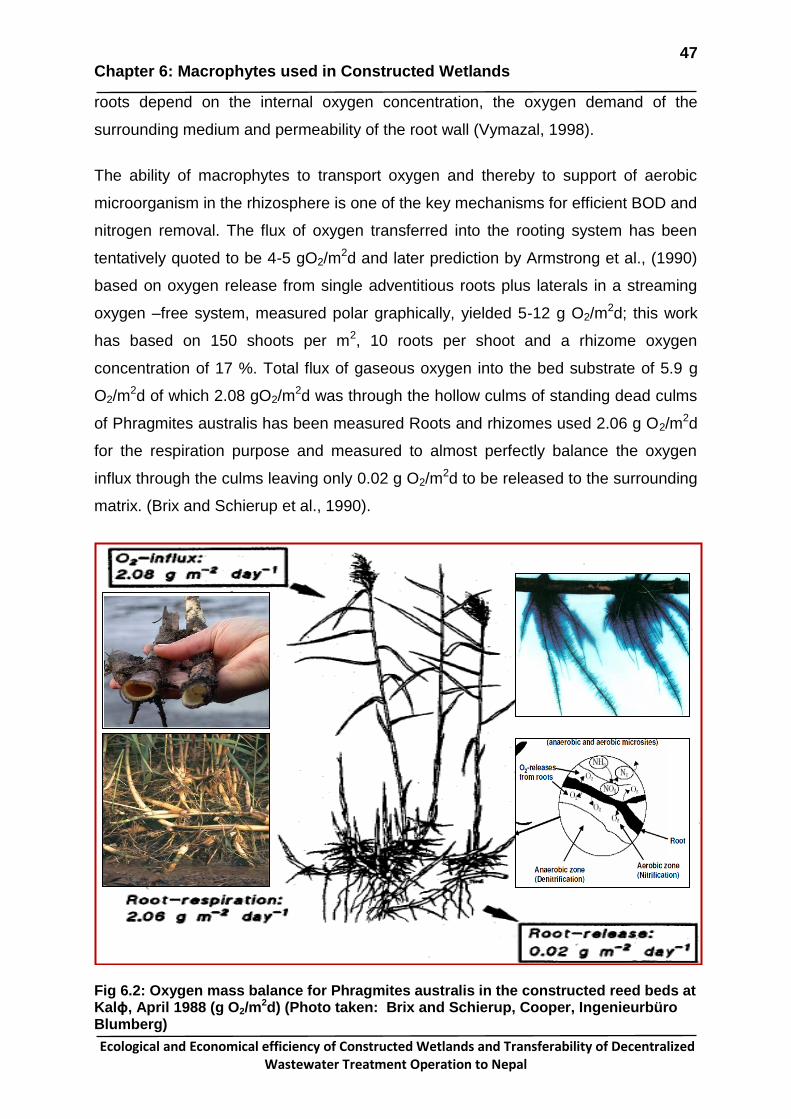
Oxygen release There are many studies which show the ability of some aquatic macrophytes to pass
a supply of oxygen into the rhizosphere through a special helophyte tissue in the
plant stems and roots from the air. The plants, with their roots and rhizomes, provide
the suitable environment for microorganisms‟ growth. Oxygen release rates from
47 Chapter 6: Macrophytes used in Constructed Wetlands
Ecological and Economical efficiency of Constructed Wetlands and Transferability of Decentralized Wastewater Treatment Operation to Nepal
roots depend on the internal oxygen concentration, the oxygen demand of the
surrounding medium and permeability of the root wall (Vymazal, 1998).
The ability of macrophytes to transport oxygen and thereby to support of aerobic
microorganism in the rhizosphere is one of the key mechanisms for efficient BOD and
nitrogen removal. The flux of oxygen transferred into the rooting system has been
tentatively quoted to be 4-5 gO2/m2d and later prediction by Armstrong et al., (1990)
based on oxygen release from single adventitious roots plus laterals in a streaming
oxygen –free system, measured polar graphically, yielded 5-12 g O2/m2d; this work
has based on 150 shoots per m2, 10 roots per shoot and a rhizome oxygen
concentration of 17 %. Total flux of gaseous oxygen into the bed substrate of 5.9 g
O2/m2d of which 2.08 gO2/m
2d was through the hollow culms of standing dead culms
of Phragmites australis has been measured Roots and rhizomes used 2.06 g O2/m2d
for the respiration purpose and measured to almost perfectly balance the oxygen
influx through the culms leaving only 0.02 g O2/m2d to be released to the surrounding
matrix. (Brix and Schierup et al., 1990).
Fig 6.2: Oxygen mass balance for Phragmites australis in the constructed reed beds at Kalϕ, April 1988 (g O2/m
2d) (Photo taken: Brix and Schierup, Cooper, Ingenieurbüro Blumberg)
48 Chapter 6: Macrophytes used in Constructed Wetlands
Ecological and Economical efficiency of Constructed Wetlands and Transferability of Decentralized Wastewater Treatment Operation to Nepal
Individual experiments has been conducted in the laboratory to detect the oxygen
release from roots and rhizomes of Phragmites australis, Typha latifolia, Glyceria
maxima and Iris pseudacorus by using oxygen microelectrodes ( Fruergaard ,1987).
With the help of microelectrode, oxygen concentration within the internal gas-space
of roots and rhizomes was measured by microelectrode penetrating into the root and
rhizome wall. Generally, no release of oxygen from the surface of rhizomes and old
roots could be detected even though the internal oxygen concentration was relatively
high as shown in table 6.3. Only young white roots without laterals released oxygen
to the surrounding medium and it was found that the oxygen release rates were
highest in the sub apical region of the roots and decreased with distance from the
root – apex (Brix and Schierup, 1990). The root –apex itself actually consumed
oxygen from the surrounding medium. However form the experiments of four species,
Phragmites showed the highest oxygen release rate and Typha the lowest. At lower
experiment temperatures the release rates would probably have been higher
because of lower tissue respiration.
Table 6.3: Oxygen release from individual roots of Phragmites, Typha latifolia, Glyceria maxima and Iris pseudacorus measured by an oxygen microelectrode (from Fruergaard, 1987)
Species O2 –release
(10 - 8 g cm-2min-1) Internal O2-con
(vol %)
Phragmites australis
Root apex < 0 Not analysed
2mm from apex 6.3 Not analysed
5mm from apex 4.7 Not analysed
9 mm from apex 4.2 Not analysed
60 mm from apex < 0 Not analysed
Rhizome 0 12.3
Typha latifolia
10 mm from apex >0 10.8
35 mm from apex 0.55 Not analysed
65 mm from apex 0 Not analysed
Glyceria maxima
Root apex < 0 Not analysed
8 mm from apex 1.3 Not analysed
40 mm from apex 2.3 4.7
Iris pseudacorus
Root apex < 0 Not analysed
15 mm from apex 2.0 Not analysed
70 mm from apex >0 5.8
150 mm from apex 0.62 8.5
49 Chapter 7: Scenario of Wastewater Treatment in Nepal
Ecological and Economical efficiency of Constructed Wetlands and Transferability of Decentralized Wastewater Treatment Operation to Nepal
7 Scenario of Wastewater treatment in Nepal
7.1 Country background
Nepal is a small and beautiful landlocked country lies between two big neighbouring
countries like China on the north side and India on the south, east and west. It is also
known as Himalayan country with total area of 147,181 sq. km (56,827 sq mi) and
divided as per geographically into the three main regions like mountains, hills and
terai regions. Mountains cover 20%, hills fall 63% and terai covers 17% of total area
respectively. It is located between the latitudes 27°42' N and longitudes 85° 19' E
(http://en.wikipedia.org/wiki/Nepal). The altitude varies from some 60 m above sea
level in the terai to 8,848 m the Mt. Everest, which is the highest peak of the world.
Nepal has a population of 29.9 million with an average annual population growth rate
of 1.7 % and life expectancy for males and females is 59 years and 58 years
respectively.Nepal is one of the least developed country with Gross Domestic
Production (GDP) per capita is $ 438 and ranked as low human development
country, at 138 out of 169, with a Human Development Index (HDI) is 0.428 (UNDP,
HDR 2010). The population living below the national poverty line has declined from
42% (1990-1995) to 31% (2003-2004) (www.who.int).
As per the Department of Water Supply and Sewerage (DWSS) under the
Government of Nepal indicates the figure in the period of mid July 2003 to mid July
2007 that 80.4 % of the population have access to drinking water supply and 46 % in
basic sanitation.
Fig 7.1: Map of Nepal showing Mountains, Mid hill and Terai regions (http://www.worldmapfinder.com/De/Asia/Nepal)
Table 7.4: Summary statistics of inlet and Outlet concentration and mean efficiency Dhulikhel Hospital Constructed Wetland System (1997 to 2000) (Source: Poh, 2003)
The Hospital as well as the local people is very satisfied with the performance of the
treatment system and the system has become a showpiece for the Hospital. Many
58 Chapter 7: Scenario of Wastewater Treatment in Nepal
Ecological and Economical efficiency of Constructed Wetlands and Transferability of Decentralized Wastewater Treatment Operation to Nepal
researchers, students, journalists and other people regularly visit the Hospital to see
the constructed wetland in action and learn from it. The Hospital is now in the
process of expanding the system.
Sunga community
Madhyapur Thimi municipality, one of Nepal‟s oldest settlements living Newar
community, is a small municipality located in Kathmandu Valley. It has a population
of 47,751 in 2001 and covers a total area of 11.47 sq. km with 20% residential area,
70% agricultural land and around 10% vacant land. As the town was designated as a
municipality only in 1996, major infrastructure developments like the sewerage
system, water supply and road network are all still in the planning phase. Due to lack
of funds, still wastewater treatment through oxidation ponds was not completed;
however a part of the municipality was connected to sewers in the 1990s. From the
social-economic analysis more than 50% of the populations are still lacking proper
sanitation facilities. Sanitation improvement is one of the most urgent issues in the
municipality that should to be addressed, so the local people of Madhyapur Thimi
and the municipality showed an interest in managing the wastewater through
innovative technology.
Fig 7.5: Solid Waste dumping site before and after the construction of CWs at Sunga wastewater treatment plant, Thimi (Photo by: UN-HABITAT and Water Aid/ Marco Betti)
The people of Sunga village are interested to implement the innovative urban
wastewater treatment technology to improve sanitation, improve water quality of
rivers, and provide alternate water uses other than for drinking purposes and to link
with livelihood opportunities for poor communities. At the request of community
59 Chapter 7: Scenario of Wastewater Treatment in Nepal
Ecological and Economical efficiency of Constructed Wetlands and Transferability of Decentralized Wastewater Treatment Operation to Nepal
people and the Municipality, in 2005, ENPHO, with support from ADB, UN-HABITAT
and Water Aid Nepal, initiated the construction of a community-based wastewater
treatment plant. Sunga constructed wetlands are also known as the first community-
based wastewater treatment plant in Nepal. In addition to the funding agencies,
Madhyapur Thimi municipality provided the required land for construction along with
the financial assistance for operation and maintenance of the wastewater treatment
plant. Under this initiative, ENPHO joined hands with the local people of Sunga and
built CWs on steep terrain, which was previously a waste dumping site near to a
school at Sunga. This treatment plants has come in operation since October, 2005.
Now the site has a beautiful garden and a model treatment plant that provides a
learning ground for students as well as professionals.
The constructed wetland at Sunga consists of a coarse screen and a grit chamber for
preliminary treatment, an anaerobic baffle reactor (ABR) with capacity of 42 m3 for
primary treatment, Horizontal Flow (HF) followed by Vertical Flow (VF) reed beds for
secondary treatment and two sludge drying beds for treating sludge of area 70 m2.
The total area of the constructed wetland is 375 m2 in which HF and VF beds covers
150 m2 by each (UN-HABITAT, 2008). The treatment plant has a capacity to treat
wastewater from 200 households, but it is urgently treating wastewater from 80
households. The plant receives an average daily flow of 10 m3 of very high -strength
wastewater (average BOD5 of raw wastewater is 900 mg/l).
Monitoring of the performance of the system over its first year of operation shows that
it removes organic pollutants highly efficiently (up to 98% TSS, 97% BOD5 and 96%
COD). It was also found that the ABR was very effective in removing organic
pollutants and could remove up to 74% TSS, 50% BOD5 and 18% COD (UN-
HABITAT, 2008). The effluent values show that there is a significant reduction of
BOD5, COD and TSS as compared to the raw wastewater and these values are
below the legal limits (50mg/l TSS , 50 mg/l BOD5 , 250 mg/l COD ) as specified by
the Government of Nepal for the combined wastewater treatment.
The total cost of the treatment plant was Rs. 2.5 million in which the total construction
cost of the wetland amounted to NRs. 1,800,000 (US$ 26,000) at NRs. 2,900 (US$
40) per m2 of the wetland. The average O&M cost of the wetland is about NRs.
20,000 (US$ 290) per year. As per the tripartite agreement made between ENPHO,
60 Chapter 7: Scenario of Wastewater Treatment in Nepal
Ecological and Economical efficiency of Constructed Wetlands and Transferability of Decentralized Wastewater Treatment Operation to Nepal
the management committee of Sunga WWTP and Madhyapur Thimi municipality, the
municipality has committed Rs 50,000 annually for operation and maintenance
including remuneration (NRs. 3000/month) and equipment for the caretaker. The
average annual O & M cost of the wetland at present is about NRs. 20,000 (US$ 290)
per year, which is less than the amount allocated by the municipality. It has been
agreed that the surplus amount will be transferred to the operation and maintenance
reserve fund for future maintenance of the plant.
(Source: UN-HABITAT, 2008)
By visually observing CWs operation and treatment efficiency, other surrounding
communities of Sunga village are also interested to implement such kind of treatment
plant. During the handover ceremony on 1st September 2006, many other local
communities requested ENPHO to construct additional similar treatment plants in
other parts of the Municipality. These opinions and demands from the local
community clearly indicate that CWs has been well accepted.
The Sunga constructed wetland is a clear demonstration of the effectiveness of the
community based wastewater management project and its contribution. Due to easy
operation and maintenance, this project has many advantages such as treated
effluent from wastewater can be used as multiple purposes like for irrigation,
gardening, toilet flushing, and washing vehicle. In addition, the project has also
become successful in enhancing the river quality and making the treatment plant
healthier and aesthetically attractive with an enhanced environment thus ensuring
benefits to the community dwellers. This has inspired people to adopt this type of
technology that can be managed by the community itself for the solution of currently
mismanaged wastewater in the city.
Table 7.5: Concentration of pollutants at Sunga (August,2006)
Parameter Units RAW ABR HFCW VFCW
TSS mg/l 796 204 28 16
BOD5 mg/l 950 450 165 30
COD mg/l 1438 1188 213 50
Ammonia mg/l 145.5 408.9 214.1 21
Nitrate mg/l 4.1 36.8 32.6 56.6
Total Phosphorus mg/l 26.4 44.3 20.4 24.3
Fecal Coliform CFU/ ml 1.3E+5 1.3 E+6 1.1E+6 8.1E+3
61 Chapter 8: Case Study of Project Area
Ecological and Economical efficiency of Constructed Wetlands and Transferability of Decentralized Wastewater Treatment Operation to Nepal
8 Case study of Project Area
8.1 Study area of Gadenstedt
8.1.1 Location
Gadenstedt is a small village lies in the Lahstedt municipality of Peine district situated
in the German Federal State Lower Saxony, south-east of Hanover. The population
of Gadenstedt is annually varying and according to present data total Gadenstedt
population has 2434 (see fig 8.2). The highest point lies in Degree Mountain which is
105.2 m above from sea level and the lowest point 70.2 m above sea level lies in is
Fuhse river south of the „‟ lukewarm Thaler mill „‟ in Gadenstedt.
Fig 8.1: Map of Gadenstedt, Lahstedt (source:http://de.wikipedia.org/wiki/Datei:Landkreise_Niedersachsen.svg and
Ecological and Economical efficiency of Constructed Wetlands and Transferability of Decentralized Wastewater Treatment Operation to Nepal
Considering this advantage, the municipality of Lahstedt focused to introduce such
kind of technology. The municipal area consists of 43 km2 with 5 villages and a total
of 10.100 populations living in the five villages like Gadenstedt, Adenstedt,
Mündstedt, Oberg, and Groß Lafferde. It was decided to use such kind of treatment
processes however requiring extensive land for constructed wetlands and open
lagoons. This resource is cheaply available in the rural area. The Federal
Government of Germany developed the standard guidelines mentioning the rule and
regulation to treat wastewater according to the population. The treatment of
wastewater is a duty prescribed by the law of government authorities.
The project „‟ Ecotechnological treatment of waste water and sewage sludge in
Lahstedt‟‟ was registered and officially sponsored project at the world exhibition
EXPO 2000 in Hanover. The constructed wetland as polishing biotopes in
Gadenstedt was constructed in 1998 for the waste water treatment covering the area
of 1.1 hectare. After achieving the good results, the Municipality of Lahstedt has
decided to expand and improvement in the sewage plants in the locality of Oberg,
Münstedt, Adenstedt, and Groß-Lafferde.
Fig 8.3: Combined waste water biotope in Oberg
In the 2001 combined wastewater biotopes was constructed in Oberg and Münstedt
covering an area of 0.57 ha and 1.4 hectares respectively. Similarly sewage sludge
processing plant covering an area of 0.6 ha was constructed in Groß-Lafferde in
2002. This is one of the innovative ideas for the alternative system on natural method
is gaining popularity not only in the state of Lower Saxony but also in Europe. This is
64 Chapter 8: Case Study of Project Area
Ecological and Economical efficiency of Constructed Wetlands and Transferability of Decentralized Wastewater Treatment Operation to Nepal
one of model which show decentralized wastewater treatment under the local level
initiative for the environment protection.
However the main focus is given to waste water treatment through the CWs of
Gadenstedt. The waste water is being treated in Gadenstedt through the combination
of conventional and natural system. The treatment plant is located around 500 m far
in the west side of village. Gadenstedt has an old trickling filter which was
constructed in 1959 and treating the waste water.
Fig 8.4: Isometric view of Gadenstedt and project site (from Google)
An old trickling filter system is also functioning properly but community people are not
interested to replace by new activated sludge systems due to high operation cost.
They are planning to be continuing use of old sewage treatment plant to eliminate the
pollutants from wastewater and will close in near future within the 10 years. After then
they will depend totally upon Constructed Wetland. With the concept of ecological
technology, the project especially designed and constructed in 1998 under the direct
supervision and involvement of Ingenieurbüro Blumberg.
The project was designed with different objective for the wastewater treatment. So
the project was divided into three parts: polishing biotope (reed bed treatment
system); combined waste water biotope (cascade of ponds and reed beds); reed
Gadenstedt
Village
Constructed
Wetlands and
Lagoon area
Screening, Grit chamber,
Trickling filter and Sludge
drying bed
65 Chapter 8: Case Study of Project Area
Ecological and Economical efficiency of Constructed Wetlands and Transferability of Decentralized Wastewater Treatment Operation to Nepal
planted dry beds for sewage sludge. A total cost of construction was 1.7 million DM,
whereas Lahstedt municipality shared the cost by 75% and state government of
Lower Saxony by 25 %.
8.1.4.1 Screening
Screening is the first unit operation used at wastewater treatment plants. The main
objective of screening is to remove floating materials like faecal matter, toilet paper
and mineral solids, plastics, stone and metals preventing to damage and clogging of
downstream equipment, piping, and appurtenances. Coarse and fine screens are
used 15-75 mm and 3-12.5 mm.
Fig 8.5: Screening and collection drum (HUBER Screenings Treatment Systems in
Gadenstedt)
A screening compactor is usually situated close to the mechanically cleaned screen
and compacted screenings are conveyed to a dumpster or disposal area. Total 195.7
cubic meter floating materials was screened during the whole year periods, but
values from October and November was not included due to absence of record and
maximum screening material found in January equals to 189.7 cubic meter and
remaining months collected varies from 0.25 to 1.0 cubic meter respectively.
8.1.4.2 Aerated grit chamber
Grit includes sand, gravel, cinder, or other heavy solid materials that are “heavier”
(higher specific gravity) than the organic biodegradable solids in the wastewater.
Screening
66 Chapter 8: Case Study of Project Area
Ecological and Economical efficiency of Constructed Wetlands and Transferability of Decentralized Wastewater Treatment Operation to Nepal
Aerated grit chambers are typically designed to remove particles of 70 mesh (0.21
mm) or larger. When wastewater flows into the grit chamber, particles settle to the
bottom according to their size, specific gravity, and the velocity of roll in the tank.
Aerated grit chamber was designed in a rectangular type to treat around the 400 to
600 m3 per day. It was constructed with the cross section area of 2.5 m2 and the
length of 14 m respectively.
Air is introduced in the grit chamber along one side, causing a perpendicular spiral
velocity pattern to flow through the tank. Heavier particles are accelerated and
diverge from the streamlines, dropping to the bottom of the tank, while lighter organic
particles are suspended and eventually carried out of the tank. Grit is collected from
bottom of channel by automatic sand scraper and pumped into the collecting drum.
Total sand was collected 4 m3 in 2010.
Fig 8.6: Grit chamber in Gadenstedt treatment plant (photo by R. Shrestha, drawing from Ingenieurbüro Blumberg)
8.1.4.3 Trickling filter
Trickling filter was constructed in 1959 and one of the oldest treatment plants
operating to treat the wastewater coming from Gadenstedt village. The trickling filter
was filled with the lava and gravel of sizes ranging from 40 to 80 mm corresponding
with specific surface area of ca. 100 m2 /m3. In the trickling filter the treatment
process proceeds from top to bottom. The lava and gravel are providing more surface
area for the development of biofilms when wastewater flows downwards. The
Gritchamber
67 Chapter 8: Case Study of Project Area
Ecological and Economical efficiency of Constructed Wetlands and Transferability of Decentralized Wastewater Treatment Operation to Nepal
removal of pollutants from the wastewater involves both absorption and adsorption of
organic compounds by the layer of microbial biofilms. The BOD5 volumetric loading
rate is found 0.1 kg/ m3.d which is less than 0.4 kg/ m3.d and total nitrogen loading
rate is found 0.039 kg/m3.d which is less than 0.1 kg /m3.d. The surface loading rate
is 4.17 m / d. Under operating conditions ca. 2/3 of this can be assumed to be
biologically active. The depth and diameter of trickling filter consists of 3 m and 13 m
respectively.
Fig 8.7: a) Wastewater dosing into the bed through the rotating arm, b) lay out plan of project, c) trickling filter and d) diagram of biological process in trickling filter
BOD 5
NH4 +
NO3 -
Trickling filter
By R. shrestha From Ingenieurbüro Blumberg
By R. shrestha
68 Chapter 8: Case Study of Project Area
Ecological and Economical efficiency of Constructed Wetlands and Transferability of Decentralized Wastewater Treatment Operation to Nepal
8.1.4.4 Constructed Wetland as polishing biotopes
Constructed wetland is used as a tertiary treatment plants like a polishing biotopes
which is used to treat effluent coming from the existing trickling filter. Four vertically
flow CWs was designed and constructed in 1998 covering the total area of 1.1 hector
of which 7300 m2 is covered by reeds (Phragmites) in four vertically percolated CWs.
These ground surfaces are sealed with a lining at bottom to prevent wastewater
entering into the ground water.
Fig 8.8: a) Construction phase of Lagoon, b) Bed preparation of Constructed wetlands, c) planting Reeds in bed during the construction period of 1997-1998, d) after the maturation of Reed
The system was designed to treat 500 m3 / day of the wastewater during summer to
more than 2000 m3 / day in winter. But it was found by data analysis of discharge in
the whole year of 2010 that the actual wastewater treated with varies maximum 650
m3 / day to minimum 496 m3 / day. It was assumed that the treatment capacity would
in the future be extended up to 3000 inhabitants in Gadenstedt. The depth of the
vertical beds is 1.5 meter and filled with different filter materials of different depth
considering as a research purposes (Ingenieurbüro Blumberg, 1998). The area of
a b
c d
From Ingenieurbüro
Blumberg
From Ingenieurbüro
Blumberg
From Ingenieurbüro
Blumberg
By R. Shrestha
69 Chapter 8: Case Study of Project Area
Ecological and Economical efficiency of Constructed Wetlands and Transferability of Decentralized Wastewater Treatment Operation to Nepal
constructed wetland is divided into four small reed bed areas and materials used in
these beds are categorized into two groups. Top layer of 10 cm depth was filled with
aggregate and second layer was filled with sand (+ 5% limestone) and aggregate 2/8
mixing in 1:1 ratio in the depth from 10 - 80 cm in the bed 1 & 3. Sand (+ 5%
limestone) and root wood mixing also in 1: 1 ratio was filled in 80 – 125 cm depth and
125 – 135 cm depth with aggregate 2/8. Similarly in bed 2 & 4 are also filled with
limestone 0/32 at depth 0-20 cm, Sand (+ 5% limestone) and without root wood in
depth 20-135 cm. Finally bottom layer of four beds (1, 2, 3, and 4) was filled with
coarse aggregate16/32.
However, there are different filter material used for the purpose of wastewater
treatment with an estimated conductivity (Kf) of 10-4 to 10 -3 m/s and a designed pore
volume of 30-40%. The drained basins are lined with a polyethylene membrane. The
planned freeboard allows storage of a volume up to 2.000 m3 above the filter
substrate. The beds were planted with Phragmites Australis (Common Reed).
Technical data of CWs of Gadenstedt
Total size of area 1.1 hectares Surface Area
Vertical subsurface flow reed beds with total size
7500 m2 Surface area
Depth 1.5 metres
Capacity 3000 P.E Person equivalents
Current connected load 2600 P.E Person equivalents
20 – 80 cm Sand 0/1 + 5% Limestone Without Root wood 80 – 125 cm Sand 0/ 1 + 5% Limestone
Root wood } 1:1 mixing
125 – 135 cm Aggregate 2 / 8
135 – 150 cm Aggregate 16 /32 Aggregate 16 /32
Table 8.1: Technical data of Constructed Wetlands at Gadenstedt WWTP
New sewer was constructed from the old sewage treatment plant to the nearby
Polishing biotope. Similarly effluent from trickling filter collected in collection chamber
and pump was installed to distribute wastewater on the polishing biotope (reed beds)
under intermittent loading with a low pressure distribution system. First time samples
were analyzed in 1999 to measure the efficiency of CWs and obtained the good
70 Chapter 8: Case Study of Project Area
Ecological and Economical efficiency of Constructed Wetlands and Transferability of Decentralized Wastewater Treatment Operation to Nepal
results as shown in fig 8.9. Constructed Wetlands are used as a tertiary treatment
system.
Fig 8.9: Constructed Wetlands used as a tertiary treatment system
Nonetheless, CWs are also used as secondary treatment of municipal wastewater to
check the efficiency and main objective to replace the trickling filter slowly. The
wastewater was treated through the CWs from December 2001 to April 2002 and it
was found by the analysis that removal efficiency of COD, BOD5 and NH4-N in CWs
were 92%, 96% and 44% respectively. Similarly reduction of TN and TP were found
52% and 29% respectively. Influent and effluent values of organic and nutrients can
be seen detail in fig 8.10.
mg/l mg/l mg/l mg/l mg/l mg/l mg/l
COD BOD5 NO2-N NO3-N NH4-N TN TP pH
Influent 40.0 7.7 0.58 17.2 1.4 19.2 4.5 7.4
Effluent 10.0 4.9 0.035 4.7 0.2 4.90 1.0 7.1
0.0
5.0
10.0
15.0
20.0
25.0
30.0
35.0
40.0
45.0First Results in 1999
mg/l mg/l mg/l mg/l mg/l mg/l mg/l
COD BOD5 NO2-N NO3-N NH4-N TN TP pH
Influent 54.0 16.0 0.30 14.0 2.0 16.0 3.0 7.3
Effluent 15.0 4.0 0.10 9.0 0.7 9.00 2.0 7.4
0.0
10.0
20.0
30.0
40.0
50.0
60.0
October 2004 - Setember 2005
n = 50
n = 20
71 Chapter 8: Case Study of Project Area
Ecological and Economical efficiency of Constructed Wetlands and Transferability of Decentralized Wastewater Treatment Operation to Nepal
Fig 8.10: CWs used as secondary treatment system at Gadenstedt WWTP
8.1.4.5 Combined waste water biotope
First of all, domestic wastewater and rain water from paved surfaces area of
Gadenstedt flow together through the combined sewer system into the treatment
plants. During heavy rains a considerable amount of such combined wastewater is
diverted into the open lagoons before entering to the treatment plants. Combined
wastewater biotopes are used to treat large amount of wastewater coming from
paved surface during the rainy season and protected the receiving river being
polluted from organic and inorganic pollutants. This lagoon system was designed to
treat wastewater 123000 m3 per year and 19250 kg COD per year from 38.5 hectare
paved area.
Fig 8.11: Combined wastewater treatment biotope (Lagoon) at Gadenstedt WWTP
mg/l mg/l mg/l mg/l mg/l mg/l mg/l
COD BOD5 NO2-N NO3-N NH4-N TN TP pH
Influent 301.0 165.0 0.60 9.8 13.4 22.1 4.1 7.5
Effluent 24.0 4.0 0.10 3.1 7.5 10.70 2.9 7.3
0.0
50.0
100.0
150.0
200.0
250.0
300.0
350.0
December 2001 to April 2002
n = 19
72 Chapter 8: Case Study of Project Area
Ecological and Economical efficiency of Constructed Wetlands and Transferability of Decentralized Wastewater Treatment Operation to Nepal
Combined wastewater biotopes of total area covering of 17000 m2 are divided into
three parts, which are called settling pond, unaerated storage pond and reed planted
soil filter. Wastewater is first passed though settling ponds with covering area of 2940
m2 to settle the suspended solids and after then treated in retention pond where
organic pollutants are oxidized by aerobic and anaerobic process. Storage pond has
a covering the area 5070 m2 with a large retention capacity of 13440 m3 and
detention volume of 4680 m3.
Floating islands are also constructed in the storage pond. Marsh plants growing on
floating islands accelerate the sewage purification process and absorb noxious
substances and nutrients dissolved in the waste water. The root zone under the
water provides a suitable place for the growth of microbiofilms (e.g. fixed nitrifying
bacteria). The wastewater is finally treated in a reed planted soil filter covering net
area 1.330 m2 before it is discharged into the receiving river Fuhse.
Gadenstedt
Total size 1700 m2 Surface area
Settling pond 2940 m2 Surface area
Retention pond 5070 m2 Surface area
Permanent retention volume 4680 m3 capacity
Maximum volume of water 13440 m3 capacity
Storage volume 8760 m3 capacity
Reed bed filter 2400 m2 Total Surface area
Hydraulic load on Reed bed filter 132 m/ yr
Table 8.2: Facts and figures about the combined wastewater treatment biotope
(Source: Ingenieurbüro Blumberg, Leaflet of Lahstedt Municipality)
The former method of combined waste water treatment in Gadenstedt did not
conform to legal requirements. The permissible pollutant overflow rate of 250 kg COD
/ ha / yr was clearly exceeded with a figure of 372 kg COD / ha .yr. The specific
overflow load will be below 64 kg COD / ha /yr well within the limit in Lower Saxony.
Samples were taken from December 2001 to April 2002 to analyze the concentration
of organic matter and nutrients. This system is therefore far superior in efficiency to
conventional combined waste water treatment systems with concrete basins.
Construction and maintenance costs are clearly lower. Hydraulic stress impacts on
the receiving river are avoided. A secondary environmental complex with valuable
biotope functions is established.
73 Chapter 8: Case Study of Project Area
Ecological and Economical efficiency of Constructed Wetlands and Transferability of Decentralized Wastewater Treatment Operation to Nepal
Figure 8.12: Isometric view of wastewater treatment plant at Gadenstedt
8.1.4.6 Sewage sludge dewatering and mineralization in reed beds
Sewage sludge is the end product of wastewater which is settled in the primary
settling tank and pumped into the reed beds for dewatering and mineralization
process where such kind of sludge is treated with aerobically and anaerobically. This
scarcely known method of dewatering and stabilizing sewage sludge in dry beds
planted with reeds has been in practice in Gadenstedt for nine years. Three reed
beds are used for this purpose covering area of 516 m2 .The roots of the plants which
penetrate the dumped sludge helps to accelerating the dewatering and mineralization
process.
Dewatering process is achieved by evapotranspiration and especially by drains which
are fitted at the bottom of the reed beds. Dry bed also helped in reduction of
pollutants in sewage sludge. It was found that sewage sludge dewatered and
stabilized in the reed beds which are designed for operation approximately 10 to 15
years with energy saving method and after then beds are cleared and refilled with
sludge for the next 10-15 years. However, from the experienced showed that dry
Source: Ingenieurbüro Blumberg
website (http://www.blumberg-
engineers.de/)
Common Reed
in CWs
74 Chapter 8: Case Study of Project Area
Ecological and Economical efficiency of Constructed Wetlands and Transferability of Decentralized Wastewater Treatment Operation to Nepal
matter content of over 50 % is currently achieved. The major advantages of dry reed
beds are to store surplus sludge load during the winter months when agricultural use
is prohibited. Transport costs are lowered by volume reduction and new options for
utilization and recycling of this valuable nutrient source in landscaping, horticulture,
tree nurseries, private gardening and recultivation can be explored. It is one of the
natural sludge dewatering and stabilization at reasonable investment and
maintenance costs.
8.1.5 Method and Field works
8.1.5.1 Field work - pH measurement
It is very important to measure the pH value of influent and effluent of waste water
because of the pH value shows the characteristic of water whether it is an acidic or
basic. Pure water is said to neutral with a pH value close to 7.0 at 25 °C. Influent and
effluent of wastewater with a pH lesser than 7 are said to be acidic and a pH greater
than 7 are basic nature. It is measured on a scale of 0 to 14. The term pH is derived
from “p” the mathematical symbol of the negative logarithm (base10) and “H” the
chemical symbol of Hydrogen. The formal definition of pH is the negative logarithm of
the hydrogen ion concentration i.e. pH = -log10 [H] +.
pH variation is dependent upon the hydrogen ions concentration. When hydrogen
ions concentration is low, pH indicates high and water becoming more basic. Water
with low pH cause the acidic or high pH cause basic nature is harmful to the flora and
fauna. Most organisms have adapted to life in water of a specific pH and may die if it
changes even slightly. This is especially true for aquatic life. The most significant
environmental impact of pH involves synergistic effects. Synergy involves the
combination of two or more substances which produce effects greater than their sum.
Changes pH value of water shows the negative impact on the quality of the receiving
river and soil properties. So pH is a critical factor determining the health of a
waterway. pH measurement is important for environmental science, civil engineering,
food science and many other applications.
In addition to controlling various biological processes, pH is also a determinant of
several important chemical reactions. Ammonium changes to free ammonia at pH
75 Chapter 8: Case Study of Project Area
Ecological and Economical efficiency of Constructed Wetlands and Transferability of Decentralized Wastewater Treatment Operation to Nepal
above neutral and at higher temperature. The protonation of phosphorus changes
with pH and the hydroxide and oxyhydroxide precipitations of iron, manganese and
aluminum and pH sensitive. (Kadlec und Wallace, 2009)
Limiting pH Values
Minimum Maximum Effects 3.8 10.0 Fish eggs could be hatched, but deformed young are often
produced
4.0 10.1 Limits for the most resistant fish species 4.1 9.5 Range tolerated by trout --- 4.3 Carp die in five days 4.5 9.0 Trout eggs and larvae develop normally 4.6 9.5 Limits for perch --- 5.0 Limits for stickleback fish 5.0 9.0 Tolerable range for most fish --- 8.7 Upper limit for good fishing waters 5.4 11.4 Fish avoid waters beyond these limits 6.0 7.2 Optimum (best) range for fish eggs --- 1.0 Mosquito larvae are destroyed at this pH value 3.3 4.7 Mosquito larvae live within this range 7.5 8.4 Best range for the growth of algae
Table 8.3: Limiting pH values for different aquaculture (Source: CWQRB, 1963)
A pH meter is used to measure the pH
value of water. It is an electronics
instrument consist of a glass electrode
connected to an electronic meter which
helps to measure pH by the activity of
hydrogen ions nears it tips and displays
in digitally on the electronic meter. Three
pH values are measured every day in
the morning and sometimes afternoon
by using pH meter and recorded for the
data analysis. Firstly, pH value of influent waste water is taken at Grit chamber before
entering to the trickling filter. Second measurement is done on the effluent water from
Trickling and third measurement on the effluent coming from constructed wetlands.
Daily measured values of pH are recorded in the dairy by manually. It was found that
pH meter was kept in a wet condition when it was not used to prevent the glass
electrode being dehydrated and cleaned once in a month by using HCl.
Figure 8.13: pH meter (WTW pH 315i)
76 Chapter 8: Case Study of Project Area
Ecological and Economical efficiency of Constructed Wetlands and Transferability of Decentralized Wastewater Treatment Operation to Nepal
8.1.5.2 Temperature measurement
Daily meteorological variations in air temperature, cloudiness, windiness and relative
humidity cause responses in the water temperature changes. The annual cycle of
wetland water temperatures follows a sinusoidal pattern with summer maximum and
minimum in winter. Kadlec and Wallace et al. (2009) pointed out four reasons for the
importance of water temperature in treatment wetlands like several key biological
processes, water quality parameter, evaporative water loss processes and functional
in subfreezing conditions even in cold-climate. Several biogeochemical processes
that regulate the removal of nutrients in wetlands are affected by temperature, thus
influencing the overall treatment efficiency (Kadlec and Reddy, 2001). The
temperature conditions in a wetland affect both the physical and the biological
activities in the system. The biological reactions responsible for BOD removal,
nitrification, and denitrification are known to be temperature dependent (Reed et al.,
1995). In the studies highlighted above, it is reasonable to expect temperature to be
significant in wetlands treating the waste water.
To analysis the temperature effects on the biological activity, daily air temperature of
maximum to minimum was recorded by automatic temperature reading equipment
installed in the site and similarly water tempera was also measured by a pH meter
together during pH reading. Daily water temperature is recorded in daily record book
by manually.
8.1.5.3 Sample collection for COD, BOD, NH4-N, TN, TP analysis
Field work Water sample were taken for chemical / physical and biological analysis from three
different places of treatment plants. Water sample were taken from the site using
1000 ml bottle washed with a 2 percent HCl solution and rinsed with distilled water.
Rinsing with acid and distilled water is necessary to remove any contaminant present
in the bottle. The samples were collected mostly in the morning time and once in a
week. Actually sample collection was done four times in every month for physical and
chemical analysis but sometimes found to be 5 to 6 times in a month. There are
always five to six days differences between each start of new sample collections.
77 Chapter 8: Case Study of Project Area
Ecological and Economical efficiency of Constructed Wetlands and Transferability of Decentralized Wastewater Treatment Operation to Nepal
Fig 8.14: Influent and effluent sample taken at Gadenstedt WWTP
First influent sampling was taken near to grit chamber and second sample taken
effluent of trickling filter and third was taken effluent of constructed wetlands. More
priority was given sample collection and handling so samples were always deliver to
Laboratory within two hours of last sampling time. It was always kept in mind that if
analysis was not started within two hours, sample should be kept at sample container
below 4 °C from the time of collection. All samples were stored in a dark insulated
box until the return to the laboratory.
Sample were analyzed for COD, BOD5, total Nitrogen (TN), and total phosphorus
(TP) and nitrogen in the form of nitrate (NO3-), nitrite (NO2
-) and ammonia (NH4-N).
Mitsch et. al., (1998) explained that samples, if not analyzed immediately after
collection, were preserved with concentrated H2SO4 and refrigerated for later
analysis. Sample preservation or analysis was completed within 48 hours of
collection.
Lab procedure There is central laboratory located in Groß-Lafferde, where samples ware brought for
the experiment of COD, BOD5, NH4-N, NO3-N, TN and TP from different treatment
plants situated in Lahstedt municipality like Lahstedt, Oberg, Adenstedt, Münstedt
and Groß-Lafferde. In the Lab, wastewater sample was tested by the HACH LANGE
cuvettes test method and this method being much easier, saves space, time and high
efficiency of achieving the reliable data. The method is also known as „‟ operational
analytical method‟‟ and is an alternative to reference DIN method. The sample after
collecting in Gadenstedt treatment plants is returned into the laboratory within the 45
78 Chapter 8: Case Study of Project Area
Ecological and Economical efficiency of Constructed Wetlands and Transferability of Decentralized Wastewater Treatment Operation to Nepal
minutes and sample analyses are conducted. The results obtained by this method
are verified by water authority of Peine four times in a year.
Fig 8.15: left: Sample of wastewater in the Laboratory for the analysis .Right: Miss Katharina Ohlemann (Lab technician) using the Homogenizer to homogenize the sample.
Biochemical Oxygen Demand (BOD5) Biochemical oxygen demand represents the amount of oxygen consumed by bacteria
and other microorganisms while they decompose organic matter under aerobic
conditions at a specified temperature. The Biochemical Oxygen Demand in 5 days is
of the sum parameter for the assessment of organic and oxidatively degradable
wastewater pollution. In the operational analytical method, LCK -555 Cuvettes test is
used to analysis BOD5 considering the recommended concentration on the range of
4-1650 mg / l. BOD5 is measured with referring to the Hack Lange booklet3.
First, dilution water was made with reference to the Dr. Lange booklet. Wastewater
sample is homogenized with the help of homogenizer within 30 seconds, which rotate
20000 rpm. Wastewater sample are screened by filter paper and filled into three
cuvettes by opening DosiCap Zip. Reagents (tablets and beads) is poured into
cuvettes with the help of funnel and sealed immediately after funnel is removed and
there should not be air bubbles inside the sample cuvettes. Repeatedly invert the
dilution water and sample cuvettes for 3 minutes until the reagent tablets have been
3 LCK cuvettes method can be found in the internet online for more information in the website
Ecological and Economical efficiency of Constructed Wetlands and Transferability of Decentralized Wastewater Treatment Operation to Nepal
Chemical oxygen demand (COD) COD is used to measure the oxygen equivalent of the organic material in wastewater
that can be oxidized chemically using potassium dichromate – sulphuric acid solution
in the presence of silver sulphate as a catalyst. Chloride is masked by mercury
sulphate. The green coloration of Cr3+ is evaluated (www.hach-lange.co.uk).
Fig 8.17: COD measurement of LCK-514, LCK-314 cuvettes kits box and HT200S high temperature Thermostat.
For the COD analysis, Hach - Lange method was followed and selected the LCK -
514 cuvettes test for the inflow wastewater sample considering the COD
concentration range 100 – 2000 mg/l O2 and LCK – 314 cuvette test for the effluent
water with low COD concentration ranging 15 -150 mg/l. Three cuvettes is taken and
filled with 2 ml sample water, initially homogenized with the help of homogenizer and
screened with filter paper. After closing the cuvettes and thoroughly cleaned the
outside, cuvettes are inverted for few times and put into the thermostat for heating
these sample at a temperature 170 ° C for 15 minutes instead of heating at 148°C for
2 hours. When the heating process is completed then hot cuvettes are taken out and
immediately inverted two times after the lock opening of thermostat. These sample
cuvettes is put again in thermostat for cooling down at room temperature (18-20°C).
It is also important to see that sediment must be completely settled before evaluation
is carried out and clean the outside of the cuvette. Cuvettes are evaluated by
spectrophotometer, which shows directly the COD concentration in mg / l O2 of inflow
and out flow of wastewater sample.
81 Chapter 8: Case Study of Project Area
Ecological and Economical efficiency of Constructed Wetlands and Transferability of Decentralized Wastewater Treatment Operation to Nepal
Total Nitrogen (TN) Total nitrogen of wastewater was also analysis by LCK – 338 cuvette test as per the
Hach –Lange method and process taken into eight steps. First of all, 0.2 ml sample
was put into the reaction tube and poured the reagents of 2.3 ml solution A and 1
tablet reagent B, whereas A indicate the sodium hydroxide solution and B represents
oxidant tablet. Then reaction tube is
closed immediately and put in the HT
200S thermostat at the temperature
170°C for 15 minutes. After cooling down
the reaction tube into room temperature
(18-20°C) in which 1 micro cap C
reagents is added and inverted a few
times until the streak are vanished. Such
digested sample of 0.5 ml from reaction
tube is filled slowly into the cuvettes test by
pipette and 0.2 ml of D solution reagent is
mixed. Then cuvettes tests are quickly closed and inverted few times until no more
streaks can be seen. After 15 minutes, outside of cuvettes are thoroughly cleaned
and measured the total nitrogen in mg/l O2 by spectrophotometer DR2800. The total
nitrogen compounds are known as the sum of the Kjeldahl-N + NO2-N + NO3-N.
Total phosphorus Total phosphorus was analyzed LCK - 348 cuvette test method. Firstly foil is removed
carefully from the Dosi Cap Zip of cuvettes and opened the Zip, after then filled 0.5
ml sample into the three cuvettes. The Dosi Cap Zip is tightened and shaken the
cuvettes firmly and put these sample into the thermostat for standard heating at
temperature 170°C for 15 minutes. After cooling then mixed 0.5 ml reagent B and
screwed by a grey DosiCap C onto the cuvettes. Cuvettes are inverted for few times
and after 10 minutes also inverted a few times more afterwards thoroughly cleaned
outside of the cuvettes. Finally Cuvettes are put into the spectrophotometer which
displays the concentration of total phosphorus in sample in mg/l.
Fig 8.18: Total nitrogen (TN) measurement of LCK-338 cuvettes kits box with reagents (A, B, C and D)
82 Chapter 8: Case Study of Project Area
Ecological and Economical efficiency of Constructed Wetlands and Transferability of Decentralized Wastewater Treatment Operation to Nepal
Ammonium - Nitrogen (NH4-N) The main principle of measurement is ammonium ions
react at pH 12.6 with hypochlorite ions and salicylate
ions in the presence of sodium nitroprusside as a
catalyst to form indophenol blue. In the laboratory,
NH4-N is analyzed very simple and quickly way by
LCK -303 cuvettes test as per described by Hach-
Lange method. Firstly foil is removed carefully from
the DosiCap Zip and opened the cap. In the three
cuvettes, 0.2 ml homogenized sample is filled with the
help of pipette and quickly closed by DosiCap. After
cuvettes are shaken 2- 3 times and kept in rest. After
15 minutes, outside of cuvettes are thoroughly
cleaned and kept in spectrophotometer which displays
the concentration of ammonium nitrogen (NH4-N) in
sample in mg/l.
Fig 8.19: LCK-303 cuvettes test sample for NH4-N and Kit box with instruction of measurement process.
Nitrate - Nitrogen (NO3 - N)
In the laboratory, nitrate nitrogen (NO3-N) is analyzed very quickly by LCK -340 and
LCK- 339 cuvettes test method. In LCK -340 cuvettes test is conducted considering
the concentration of NO3-N high in influent sample in the range of 5- 35 mg/l and
LCK -339 cuvettes test for the NO3-N concentration low in effluent of sample within
the range of 0.23 – 13.5 mg/l.
First test sample is prepared as LCK-340 test method by filling 0.2 ml sample into the
cuvette and mixed 1.0 ml the reagent A solution. Similarly second test sample
prepared as LCK-339 by filling the cuvette with 1.0 ml sample and mixed with 0.2 ml
solution A reagent. After then both cuvettes are closed and inverted a few times until
no more streaks can be seen in the sample. Cuvettes are cleaned thoroughly after 15
minutes and evaluated with the help of spectrophotometer which displays digitally the
concentration of nitrate - nitrogen (NO3-N) in sample in mg/l.
83 Chapter 8: Case Study of Project Area
Ecological and Economical efficiency of Constructed Wetlands and Transferability of Decentralized Wastewater Treatment Operation to Nepal
Fig 8.20: LCK -340 and LCK -339 cuvettes kit boxes for NO3-N measurement
Nitrite-Nitrogen (NO2-N) Nitrite is tested in the laboratory by the LCK -342 cuvettes test method. Considering
nitrite nitrogen concentration in the wastewater sample should be low as within the
range of 0.6 – 6.0 mg/l. This analysis is also similar to previous described method of
NH4-N and NO3-N. Three cuvettes is filled with 0.2 ml sample for the test and
immediately closed by the DosiCap. The cuvettes are shaken 2-3 times with firmly
then kept in rest for 10 minutes. After then cuvettes are again inverted few time and
cleaned outside surface of cuvettes. Finally, cuvettes are evaluated with the help of
spectrophotometer which displays digitally the concentration of nitrite - nitrogen
(NO2-N) in sample in mg/l.
8.2 Study area of Berel
8.2.1 Location
Berel is one of the very small village of Baddeckenstedt municipalities and situated in
Wolfenbüttel district (Lower Saxony). This small village lies 20 km south of Peine, 21
km east of Hildesheim and 11 km west of Salzgitter. The Population of Berel was
found from 1996 to 2003 on average 684 inhabitants, (1999 Max 698 inhabitants and
2003 Min 668 inhabitants).
84 Chapter 8: Case Study of Project Area
Ecological and Economical efficiency of Constructed Wetlands and Transferability of Decentralized Wastewater Treatment Operation to Nepal
Fig 8.21: Map of Wolfenbüttel district and Berel (Source: http://commons.wikimedia.org/wiki/File:Landkreise_Niedersachsen-en.svg And http://maps.google.de/maps)
8.2.2 Geography and topography
The project area is situated in the Berel of Baddeckenstedt municipality. The
surrounding land of Berel is flat and used for agricultural purpose. The project area
as per the geographical location lies in 52°9‟54‟‟ north latitude and 10°13‟4‟‟ east
longitude. According to the topographic map, this village is 167 meters high from the
sea level.
Fig 8.22: Geographic location of Berel (Source: http://maps.google.de/maps )
Ecological and Economical efficiency of Constructed Wetlands and Transferability of Decentralized Wastewater Treatment Operation to Nepal
recommended the limiting values of COD, BOD5, TN, TP concentration before
discharging into the receiving water course Sangebach are shown in Table 8.5
Monitoring values of the district Wolfenbüttel
Chemical oxygen demand (COD)
100 mg /l
Biological oxygen demand (BOD)
40 mg /l
Phosphor (P total) 8 mg/l
Nitrogen (N total) 40 mg/l Table 8.5: Requirements for waste water at the point of discharge into the Sangebach
Fig 8.24: COD and BOD effluent values of self-monitoring of the treatment plant Berel
Fig 8.25: Ntotal and Ptotal effluent values of self-monitoring of the treatment plant Berel
87 Chapter 8: Case Study of Project Area
Ecological and Economical efficiency of Constructed Wetlands and Transferability of Decentralized Wastewater Treatment Operation to Nepal
From 31.01-19.03.2003, around 45 days, the Water Association of Peine investigated
the hydraulic conditions of the sewage system around the catchment area of Pond
treatment plant. The assessment of the external water inputs to the sewage system
was based on the specific water consumption and population of 668 inhabitants.
Total wastewater volume runoff into the sewer pipe was measured 5952 m3 during 45
days in which average water consumption was by inhabitants was 3607 m3
This showed that the difference 2345 m³ wastewater was entered into the pipe from
outside. The external water share was limited to 65% of the waste water runoff.
Regarding the flow characteristics, the low rainfall condition was also observed
during the investigation period. Water Association Peine was concluded that the
more external water into the sewer pipes due to improperly connected drains and
leaky channel coverage layer and ground water discharging into the sewage system.
Community people were interested to improve the water quality as per the required
limit and upgrading the sewage treatment pond safely through constructed wetland.
The project especially was designed and constructed in 2008 under the direct
supervision and involvement of Ingenieurbüro Blumberg. The project cost was
541,830.00 Euro.
8.2.3.1 Screening
Screening is the first unit operation used at wastewater treatment plants. The main
objective of screening is to remove floating materials like faecal matter, toilet paper
and mineral solids, plastics, stone and
metals preventing to damage and clogging
of downstream equipment, piping, and
appurtenances. The Screen system in the
influent of the Berel treatment plant is
designed as a flat fine screen with a gap
width of 3 mm. Because of the relatively low
feed rate to the treatment plant, the
smallest size is provided by the company
Grimmel Water Technology (or equivalent)
The maximum hydraulic capacity of the
Fig 8.26: Screening and automatic
screening waste collected in
dust pin at Berel WWTP
88 Chapter 8: Case Study of Project Area
Ecological and Economical efficiency of Constructed Wetlands and Transferability of Decentralized Wastewater Treatment Operation to Nepal
proposed computer system provides a adequate security for future new connections
to the sewage treatment plant in Berel.
Technical data of Screening system
Wastewater supply Q max 10 l/s
Channel width W 500 mm
Channel depth 600 mm
Bar rack width 460 mm
Bar gap width 3 mm
Maximum water level before screening H 200 mm
Machine height from channel bottom 1360 mm
Machine width 800 mm
Machine length 1650 mm
Electrical power around 4.5 kW
Table 8.6: Technical data of screening system installed in Berel
8.2.3.2 Pond system
The treatment plant in Berel was designed in the late eighties as a naturally aerated
pond treatment system. The treatment plant consists of three successive lagoons
with a total surface area of 6,800 square meters. The surface ratio of the ponds is
around 4:3:3. The largest pond 1 has a surface area of 2,700 square meters.
Structurally, the lagoons have been designed with a slope gradient of 1:1.5, a depth
of 1.20 m and a freeboard of 20 cm. The inflow into a pond branches off from the
shaft 109 and terminates in an inlet structure as shown in fig 8.27. In pond 1, a mud
pocket and a floating baffle wall were installed. Baffles walls were constructed in
ponds 1 and 3 to allow the flow through the entire treatment plant. The overflow of
the ponds and the drainage area to the receiving waters consist of a landscaped area
of shallow water depth of 20 to 50 cm with embankment slope 1:1.6. Overflow and for
the period of sludge removal from Pond 1, wastewater is diverted directly from
manhole No. 109 to pond 2 through the manhole No. 110 as shown in fig 8.27
Fig 8.27: Isometric view of Berel WWTP and settling pond
89 Chapter 8: Case Study of Project Area
Ecological and Economical efficiency of Constructed Wetlands and Transferability of Decentralized Wastewater Treatment Operation to Nepal
Wastewater was first treated through a combination of physical, biological, and
chemical processes in the pond1, also known as settling pond, where suspended
solids settled and organic material is decomposed by aerobic bacteria under the
biological reaction to reduce the COD, BOD. After then wastewater is pumped into
the constructed wetland. Effluents from constructed wetlands enter the pond 3, which
is working as polishing pond. Finally effluent of polishing pond is discharged into the
receiving small river called Sangebach. For the efficiency of pond system is
described more detail in chapter 9 (result and discussion).
8.2.3.3 Constructed Wetlands (CW)
Constructed wetlands are designed in Berel for a maximum treatment capacity of 600
residents. The calculation and design of CWs is based on the DWA Worksheet A 262
(2006) and the design of the FLL / IÖV worksheet "recommendation for planning,
construction, care and maintenance and operation of constructed wetlands"
2005/2006. Total surface area of constructed wetland is 2400 sq.m and divided into
four equal small reed bed areas having each surface area of 600 sq.m .
Fig 8.28: a) Gravel filling over the drain pipe in the bottom layer of bed, b) Reed planting in the bed, c) Lay out plan of Berel treatment plant (Pond and constructed wetlands) d) Reed after the maturation, e) End cape fitting at distribution pipe
The total depth of the vertical flow beds is 1.0 meter and filled with different filter
materials of different depth (Ingenieurbüro Blumberg, 2006). At the bottom layer,
By Ingenieurbüro Blumberg
By Ingenieurbüro Blumberg By Ingenieurbüro Blumberg
a
b c
d
e
90 Chapter 8: Case Study of Project Area
Ecological and Economical efficiency of Constructed Wetlands and Transferability of Decentralized Wastewater Treatment Operation to Nepal
where HDPE drain pipe were laid down
to drain water, was filled with coarse
aggregate of 16/32 mm size up to 0.25 m
depth. Second layer was also filled with
fine aggregate of 5,6/8 mm size up to
0.15 m and top layer of about 0.60 m
depth was filled with fine sand filter
materials. Figure 8.29: shows the structure of the filter
materials used in CWs schematically.
Phragmites communis (common reed) was planted on the surface area of CWs.
Two pumps were installed to deliver controlled amounts of the waste water
intermittently and alternately on the four beds of CWs. The distribution of the waste
water to the four reed bed is controlled by four electrically operated valves.
Wastewater is evenly distributed on the surface through a feed system of HDPE
pipes with low pressure largely maintenance. Possible blockages can be washed out
by removing the end caps of distribution pipes. Bed slope was maintained about 2%
to drain water under gravity system and percolated water was collected by drainage
pipe. These pipes are also connected with main drainage pipe (DN 200) and
collected into the collection chamber after then discharged directly into pond 3.
8.2.4 Method and Field work
8.2.4.1 Field work
At Berel treatment plant, water samples were collected mostly once a week in the
morning time and totally four times in a month for better result analysis. Actually
samples were taken for Lab analysis from four different places of treatment plants
and collected in 1000 ml plastic bottle separately. First influent sampling was taken
near to inlet of settling pond, second sample taken effluent of settling pond, third was
taken effluent of constructed wetlands (1 and 2) and fourth sample was final effluent
of polishing pond. All samples were stored in a dark insulated box until the return to
the laboratory. In Labor, Sample ware analyzed for COD, BOD5, total Nitrogen (TN),
and total phosphorus (TP) and nitrogen in the form of nitrate (NO3-), nitrite (NO2
-) and
ammonia (NH4-N).
91 Chapter 8: Case Study of Project Area
Ecological and Economical efficiency of Constructed Wetlands and Transferability of Decentralized Wastewater Treatment Operation to Nepal
Fig 8.30: Water sample collection as shown in circle at Berel treatment plant
A pH meter is used to measure pH value of water, which help to find out whether it is
acidic or basic or neutral nature and with together ph reading, temperature reading is
also recorded. A pH meter is an electronics instrument which displays pH and
temperature values in digitally on the electronic meter after the glass electrode
dipping into the sample and hold at least 60 seconds. Water temperature and pH
values are recorded by manually, when the sample is collected for Laboratory
analysis.
8.2.4.2 Laboratory work
There is branch laboratory of Wasserverband Peine located in Baddeckenstedt,
where samples ware brought for the experiment of COD, BOD5, NH4-N, NO3-N, TN
and TP. In the Lab, wastewater sample was tested by the HACH LANGE cuvettes
test method and this method being much easier, saves space, time and high
efficiency of achieving the reliable data. The procedure of measurement of COD,
NH4-N, NO3-N, TN and TP was same as Gadenstedt treatment plant and detail
described in section 8.1.5.3 of this chapter. Only measurement procedure was
different in the case of BOD5 than HACH LANGE cuvettes method. The
92 Chapter 8: Case Study of Project Area
Ecological and Economical efficiency of Constructed Wetlands and Transferability of Decentralized Wastewater Treatment Operation to Nepal
measurement method proceed in the laboratory is also known as „‟ operational
analytical method‟‟ and is an alternative to reference DIN method. The sample after
collecting in Berel treatment plants is returned into the laboratory within the 1 hour
and sample analyses are conducted.
Fig 8.31: left: Mr. Marko Lux (Lab technician) using the Homogenizer to homogenize the sample and right: Sample of wastewater in the Lab for the analysis. (Wasserverband Peine Laboratory at Baddeckenstedt)
Biochemical Oxygen Demand (BOD5)
BOD is measured by using OxiTop® BOD
Respirometer Systems. This method is based on a
pressure measurement in a closed system where
microorganisms in the sample consume the oxygen
and form CO2. This is absorbed by NaOH, creating a
vacuum which can be read directly as a measured
value in mg/l BOD. The sample volume being tested
regulates the amount of oxygen available for a
complete the respirometer system's BOD
measurement. BOD measurement ranges of up to 4,000 mg/l can be measured with
the respirometer system using different sample volumes. The OxiTop® BOD
respirometer systems have two different heads; one is green used for inflow and
yellow for outflow. The influent sample of 164 ml is taken in green head bottle and
yellow head bottle is filled with 432 ml effluent sample after then mixed with 2 tablets
NaOH. These samples are kept inside the heating box at room temperature for 5
Fig 8.32: OxiTop Respirometer for
BOD measurement in Laboratory
93 Chapter 8: Case Study of Project Area
Ecological and Economical efficiency of Constructed Wetlands and Transferability of Decentralized Wastewater Treatment Operation to Nepal
days. However, every day one value of effluent and influent are observed and
recorded and continue up to 5 days. The final value after 5 days is measured as
BOD5 values, but there is some constant multiple factor to obtain the exact value of
BOD5 in the case of influent and generally the measured value is multiplied by 10.
Respirometer systems further measured BOD values that can be read at all times
after the period of 5 days, which permits the tracking of check values or
measurements over longer periods.
Chemical oxygen demand (COD) For the COD analysis, Hach - Lange method was followed and selected the LCK -
514 cuvettes test for the inflow wastewater sample considering the COD
concentration range 100 – 2000 mg/l O2 and LCK – 414 cuvette test for the effluent
water with low COD concentration ranging 5 - 60 mg/l. Four cuvettes is taken and
filled with 2 ml sample water, initially homogenized with the help of homogenizer and
screened with filter paper. Detail measurement process of COD is followed as
instruction given and described detail in section 8.1.5.3.
Ammonium nitrogen (NH4-N) In the laboratory, for the measurement of NH4-N, LCK 303 and LCK 305 cuvette test
method is used for the measurement of influent and effluent of wastewater sample of
Berel. Detail processes are same as Gadenstedt sample measurement, which is
described in detail in chapter 8.1.5.3
Nitrate-Nitrogen (NO3 -
N) and Nitrite-Nitrogen (NO2-N) In the laboratory, nitrate nitrogen (NO3-N) is analyzed very quickly by LCK -340 and
LCK- 339 cuvettes test method. In LCK -340 cuvettes test is conducted considering
the concentration of NO3-N high in influent sample in the range of 5- 35 mg/l and LCK
-339 cuvettes test for the NO3-N concentration low in effluent of sample within the
range of 0.23 – 13.5 mg/l. Nitrite is tested in the laboratory by the LCK -342 cuvettes
test method. Considering nitrite nitrogen concentration in the wastewater sample
should be low as within the range of 0.6 – 6.0 mg/l.
94 Chapter 8: Case Study of Project Area
Ecological and Economical efficiency of Constructed Wetlands and Transferability of Decentralized Wastewater Treatment Operation to Nepal
Total phosphorus (TP) Total phosphorus was analyzed by LCK - 350 and LCK - 348 cuvettes test method.
Influent and effluent of waste sample taken from settling pond was analyzed by LCK
– 350 cuvette considering the phosphorus concentration on the range of 2-20 mg/l
and effluent from constructed wetland and final polishing pond was analyzed by LCK-
348 cuvette test with low range of phosphorus (0.5-5.0 mg/l).
95 Chapter 9: Results and discussion
Ecological and Economical efficiency of Constructed Wetlands and Transferability of Decentralized Wastewater Treatment Operation to Nepal
9 Results and discussion
The mean value for sampling data are taken for the analysis and other parameters
that are being studied covers the six main wastewater sampling i.e. COD, BOD, NH4-
N,TN,TP and pH. Other analysis including nitrate, nitrite and temperature are
included in this study.
9.1 Chemical Oxygen Demand (COD) of Gadenstedt and Berel WWTP
Fig 9.1: COD influent and effluent values at Gadenstedt WWTP
Chemical Oxygen Demand (COD) is a widely known parameter used to measure the
amount of oxygen required that can chemically oxidize organic matter as well as
inorganic substances present in the wastewater. COD values are much larger than
BOD values due to presence of humic materials in wastewater. For untreated
domestic wastewaters, COD concentration is found on the range of 250 - 1000 mg/l
(Metcalf and Eddy, 1991).
The above graph shows that concentration of COD in wastewater varies from 114
mg/l in November to 460 mg/l in July. The average value of influent of total 52
samples is 257 mg/l. This shows that volumetric loading of COD on the trickling filter
is 0.23 kg/m3.d. The effluent COD concentration is mostly below than 50 mg/l except
in the month of February and July. However, the average value of COD is 38.23 mg/l
Ecological and Economical efficiency of Constructed Wetlands and Transferability of Decentralized Wastewater Treatment Operation to Nepal
biochemical process which converts organic ammonia nitrogen into ammonia and
further oxidized first into nitrite, then into nitrate. Then effluent of NH4 –N, NO3-N and
NO2-N contains 1.2 mg/l, 14.75 mg/l and 0.09 mg/l respectively. This results show
nitrite and ammonium nitrogen are at minimum concentration (at or near zero) and
nitrate is at a maximum value, the wastewater has been fully nitrified. A fully nitrified
wastewater will have little or no organic nitrogen being utilized as a nutrient by
microorganisms in the treatment process (www.asaanalytics.com/total-
nitrogen.php)
Fig 9.11: Total Nitrogen influent and effluent values of Berel WWTP
In the case of Berel, effluent data of NO3-N, NO2-N and TN was measured in the
constructed wetlands and polishing pond to analysis the efficiency of treatment
process. Data analysis about the ammonium nitrogen was already discussed in
previous section 9.3 of this chapter.
Table 9.3: Monthly average effluent data of different nitrogen form measured in constructed wetlands and polishing pond at Berel WWTP (data - 2010, n = 46 sample)
Table 9.4: Summary of removal efficiency of constructed Wetlands in Germany and Nepal. (* as tertiary treatment system, ** as secondary treatment system)
In the given table 9.4, all the data are taken in average inflow and outflow values and
focused to measure the removal efficiency of constructed wetlands. Concentration of
pollutants in wastewater and removal efficiency of CWs at Gadenstedt and Berel are
already discussed in this chapter and similarly in the case of Dhulikhel and Sunga
described detail at chapter 7. But here the main objective of the results analysis is to
compare the treatment efficiency of constructed wetlands between Nepal and
flow CWs (1500m2). The treatment plant at Pokhara is the largest constructed
wetland in Nepal and it was built at a cost of US$ 85,700 (Rs. 6 million) under the
financial support of Asian Development Bank (ADB). The effectiveness of the
treatment plant has not yet been monitored as it is still not fully operational. It is yet in
observation and however, as experiences from other countries have shown that
constructed wetlands can be used to treat faecal sludge as well landfill leachate, the
treatment plant built in Pokhara can be a model for other cities if it is operated
properly.
Nonetheless, one of the conventional treatment system plant at Guheshwori, the
operation and maintenance cost is estimated NRs 12.5 million per year (US $
167,000 /year) (Richards, 2003). This cost is really very big difference than the
constructed and operation cost of constructed wetlands. So, Constructed wetlands
(CWs) are less expensive for construction, operation & maintenance as compare to
conventional expensive technology as well as higher removal efficiency of pollutants
124 Chapter 9: Results and discussion
Ecological and Economical efficiency of Constructed Wetlands and Transferability of Decentralized Wastewater Treatment Operation to Nepal
and utilization of treated effluent for multiple purposes. Therefore, CWs are an
alternative and suitable technology in Nepal, which are considered as effective,
economic and environmentally friendly and sustainable systems for wastewater
treatment.
9.11 Wildlife habitat at Gadenstedt WWTP
Constructed Wetlands and Combined biotopes (Lagoon) at Gadenstedt has been a
new destination to many wildlife habits. Some of the macro invertebrate groups can
be seen in the wetland area, such as Mollusca and insects but there are no
comprehensive lists of even the most common species in these groups. Especially
focus to bird species, about 70 species have been recorded from the Gadenstedt
WWTP and more than 1380 individuals have been caught and ringed. Reed Warbler,
Reed Bunting, Mallard, Greylag Goose and Tufted Duck are dominating bird in the
wetlands area. These are the high bird density (33 – 48 BP/ha.). Some of 27 species
birds are found migrants from the different places of Germany and as well as from
other country during the early spring and summer seasons. Some of them have been
achieved remarkable of long distant migrants from Ibiza, Southern Spain and France.
Fig 9.23: (a) Mr. Matthias Meyer with a Kingfisher in the station. (b) Snails
(invertebrates) on bed, (c) Tufted Ducks swimming at combined biotopes (Lagoon) The water bodies are enriched by nutrients and organic matter from wastewater and
stormwater discharge, which are suitable food chain supply for Tufted Duck and
macroinvertebrate are the main food of other birds in the wetlands area. There is no
hunting but consequent bird protection system. Some of artificial nest are provided
for the breeding process focus to Weißstorch birds. The diversity and abundance of
birds in and around wetlands attract the many birds watcher. So, constructed
wetlands are providing benefits beyond effective water treatment, such as wildlife
Ecological and Economical efficiency of Constructed Wetlands and Transferability of Decentralized Wastewater Treatment Operation to Nepal
10 Conclusion and Recommendation
Constructed wetlands have been evolved during the last five decades into a reliable
treatment technology which can be applied to all types of wastewater including
domestic, industrial and agricultural wastewaters, landfill leachate and stormwater
runoff. Pollution is removed through the processes which are under more controlled
conditions.
These treatment systems are very favorable for use in rural community and semi-
urban areas of low population density, where land is easily available with low price
and can usually be constructed from local materials. Constructed wetlands are very
effective in removing organics and suspended solids, whereas removal of nitrogen is
lower but could be enhanced by using a combination of various types of CWs.
Removal of phosphorus is usually low unless special media with high sorption
capacity are used.
Constructed wetlands require very low or zero energy input and, therefore, the
operation and maintenance costs are much lower compared to conventional
treatment systems. In addition to treatment, constructed wetlands are often designed
as dual- or multipurpose ecosystems which may provide food and habitat for wildlife
and create pleasant landscapes. So Gadenstedt WWTP is one of the tourist
attraction places for many visitors from different country as well as lot of flora and
fauna can be seen.
At Gadenstedt, constructed wetlands are used as tertiary treatment only for polishing
purpose which helps further reduction of organic matter and nutrients from the
wastewater to ensure better surrounding environment of receiving water course. And
the final effluent of CWs can be used for the multipurpose such as irrigation crops,
aquaculture products. However these practices are not in use and directly discharge
to small river Fuhse but it alternatively helps to recharging the ground water. The
concentration of organic matter and nutrients are very less than legal limit of Federal
law and specific limit of Gadenstedt WWTP.
As per trial experiment from December 2001 to April 2002, CWs used as secondary
treatment and removal efficient of COD, BOD5 was found more than 90 % and
126 Chapter 10: Conclusion and Recommendation
Ecological and Economical efficiency of Constructed Wetlands and Transferability of Decentralized Wastewater Treatment Operation to Nepal
nutrients reduction 50% and 30% respectively. So it is recommended that CWs can
be used as secondary treatment to make more sense fulfilling its objective instead of
tertiary treatment and energy cost can be saved. The operation of trickling filter
would be better to close.
At Berel, wastewater is treated with the combination of CWs and pond system. The
treatment process achieves high effective in the reduction of organic matter and
nutrients. Final effluent values of polishing pond are increased than effluent of CWs.
So it is better to divert the effluent of CWs directly into the small river Sangebach
instead of pond 3.
CWs are also very suitable for the application in developing countries where most of
the problems with inadequate sanitation occur. A crucial step for the implementation
of CWs in developing countries is proper technology transfer.
Constructed wetlands (CWs) are an alternative and suitable technology in Nepal,
which are considered as effective, economic and environmentally friendly and
decentralized sustainable systems for wastewater treatment.
127 References
Ecological and Economical efficiency of Constructed Wetlands and Transferability of Decentralized Wastewater Treatment Operation to Nepal
References
AGEB - Arbeitsgemeinschaft Energiebilanzen (2008): Energiebilanz der Bundesrepublik 2006. http://www.ag-energiebilanzen.de/viewpage.php?idpage=63. (acc. 4 Feb, 2011) ADB (Asian Development Bank), (2000) “Country Assistance Plan (200-2002) Pipeline Update Nepal”, June 2000. Arata, Tetsuji. (2003) “Wastewater in the Greater Kathmandu”, Japan Association of Environment and Society for the 21st Century, March 2003 Armstrong, J & Armstrong, M.,(1988). Phragmites australis preliminary study of soil-oxiding sites and internal gas transport parthays. New Phytol, 108, 373-382. ATV(Abwassertechnische Vereinigung),H262,(1989). Behandlung von häusöichem Abwasser in Pflanzenbeeten. St Augustin ATV(Abwassertechnische Vereinigung), (1997). Vorläufliger Entwurf zum ATV-Arbeitsblatt A262: Grundsätze für Bemessung,Bau und Betrieb von Pflanzenbeeten für kommunales Abwasser bei Ausbaugrössen bis 1000 EW. Bastian, R.K.,(1993). Constructed Wetlands for Wastewater Treatment and Wildlife Habit.17 Case studies. EPA 832-R-93-005, Municipal Technology Branch, Washington, DC. BASP(Bagmati Area Sewerage Construction/Rehabilitation Project), 2002. The mplementation & Monitoring of the Bagmati Area Sewerage Construction/Rehabilitation Project (BASP). Kathmandu: BASP, 2002 (brochure). Blöch, H. (2005) European Union legislation on wastewater treatment and nutrients removal European Commission, Directorate General Environment, 200 Rue de la Loi, B-1049 Brussels http://www.euwfd.com/IWA_Krakow_Sep_2005_REV.pdf (acc. 23 Feb,2011) Brady, N.C., and Weil, R.R.,(1999). The Nature and Properties of Soils. Prentice Hall, Upper Saddle River, New Jersey http://ecorestoration.montana.edu/mineland/guide/analytical/physical/porosity.htm# (acc. 24 Feb. 2011) Brix, H. (1993), Wastewater Treatment in Constructed Wetlands: System Design, Removal Processes, and Treatment Performance. In: Moshiri, G.A. (Ed), Constructed wetlands for water quality improvement, Lewis Publishers, Boca Raton, Florida, pp. 9-18 Brix, H., (1994): Use of constructed wetlands in water pollution control: historical development, present status, and future perspectives Water Science & Technology, 30 (8): 209 – 219 http://mit.biology.au.dk/~biohbn/hansbrix/pdf_files/Wat_Sci_Tech_30%20(1994)%20209-223.pdf (acc. feb-15, 2011) Brix, H. (1994a). Functions of macrophytes in constructed wetlands, Water Science & Technology, 29 (4): 71 – 78 http://mit.biology.au.dk/~biohbn/hansbrix/pdf_files/Wat_Sci_Tech_29%20(1994)%2071-78.pdf (acc. feb-20, 2011)
Ecological and Economical efficiency of Constructed Wetlands and Transferability of Decentralized Wastewater Treatment Operation to Nepal
Brix,H.,and Schierup, Hans-Henrik., (1990): Soil oxygenation in constructed reed Beds: the role of Macrophytes and Soil atmosphere interface oxygen transport. Botanical institute,Aarhus University ,Nordlandsvej 68, DK-8240 Risskov, Denmark ,pp 53-66 http://mit.biology.au.dk/~biohbn/hansbrix/pdf_files/CooperFindlater(1990)_53_66.pdf
(acc. 10 Jan, 2011)
Chilton, J. (1996) Groundwater. In, Chapman, D. Ed. Water Quality Assessments, published on behalf of UNESCO (United Nations Educational, Scientific and Cultural Organisation) WHO (World Health Organisation) and UNEP (United Nations Environmental Programme). 413-510. http://www.who.int/water_sanitation_health/dwq/chemicals/en/nitratesfull.pdf (acc. 10 Feb, 2011)
Cooper P.F. (ed) 1990. European Design and Operation Guidelines for Reed Bed Treatment System. WRc Report UI 17,Swindon, U.K Davies T.H and Cottingham P.D.(1993). Phosphorus removal from Wastewater in a constructed wetland. In: Moshiri, Gerald A. Edt., Constructed Wetlands for Water Quality Improvement, pp 315-320, Lewes Publisher Denny P. (1997). Implementation of constructed wetlands in developing countries. Water Science and Technology. 35(5), 27-34. Fruergaard, D.(1987) : Adaptation of wetland plants to growth in water-saturated sediments.MS thesis, institute of Biological Science, University of Aarhus.(in Danish) Gersberg, R.M., Elkins, S.R., Lyons, S.R. & Goldman, C.R. (1985). Role of aquatic plants in wastewater treatment by artificial wetlands. Water Res., 20, 363-368. Green, Hillary. The Effects of Carpet Dye on the Bagmati River. A dissertation for the fulfillment of degree of the Master of Engineering in Civil and Environmental Engineering. Massachusetts Institute of Technology, Cambridge, MA. 2003. Green,Hillary , Poh, Saik-Choon, Richards, Amanda,(2003). Wastewater Treatment in Kathmandu, Nepal. A dissertation for the fulfillment of degree of the Master of Engineering in Civil and Environmental Engineering. Massachusetts Institute of Technology, Cambridge, MA. http://web.mit.edu/watsan/Docs/Student%20Reports/Nepal/NepalGroupReport2003-
Wastewater.pdf (acc. 10 Jan, 2011)
Harleman, D and Murcott, S; “An Innovative Approach to Urban Wastewater Treatment in the Developing World”, Water 21: Magazine of the International Water Association, June 2001. Heers, M. (2006) Constructed wetlands under different geographic conditions: Evaluation of
the suitability and criteria for the choice of plants including productive species. Master thesis,
Faculty of Life Sciences, Hamburg University of Applied Sciences, Germany,
HMG/Hydrology Division (1996). Water Quality Data of River of Kathmandu Valley. Department of Hydrology and Meteorology/HMG, Kathmandu 1996 Howard-Williams, C.(1985) „Cycling and retention of nitrogen and phosphorus in wetlands: A theoretical and applied perspective‟, Freshwater Biol. 15, 391–431. Hurry, R.J., Bellinger, E.G.,(1990): Potential yield and nutrient removal by harvesting of Phalaris arundinacea in a wetland treatment system In: P.F. Cooper and B.C. Findlater, Constructed wetlands in water pollution control, Pergamon Press, Oxford, UK pp. 543 - 546 ITRC, (2003). Technical and Regulatory Guidance Document for Constructed Treatment
Wetlands, The Interstate Technology Regulatory Council Wetlands Team, USA,
Jin,X., Wang S.,Pang Y., Zhao H.,Zhou X. ( 2005) The adsorption of phosphorus on different tropic lake sediments.Colloids and Surfaces A: Physicochemical Engineering Aspects 254: 241-248 http://cat.inist.fr/?aModele=afficheN&cpsidt=16465542 (acc. 8 Feb, 2011) Kadlec, R. H and Wallace, Scott D, (2009). Treatment Wetlands, Second edition , CRC
Press ,Taylo & Francis Group ,pp 3-25, 64-69,101-127,203-234, 237-261, 267-269,278-279,
354-355, 741-747
Kadlec R.H., and Watson J.T.(1993). Hydraulics and solids accumulation in gravel bed
treatment wetlands. In: Constructed Wetlands for Water Quality Improvement, Moshiri G.A.
(ed) Lewes Publishers: Boca Raton, Florida, pp. 227-235.
Kadlec, R.H., Knight, R.L., (1996): Treatment wetlands ,CRC Press, Lewis Publishers, Boca Raton, Florida, USA, 1996 Kadlec R.H.,Reedy, K.R. (2001) Temperature effects in the treatment wetlands. Water Environment Research 73(5): 543-557 Karim, Mohammad R., Manshadi, Faezeh D., Karpiscak, Martin M., Gerba, Charles P.(2004) The persistence and removal of enteric pathogens in constructed wetlands Water Research 38 (2004) pp 1831–1837, http://www.bvsde.paho.org/bvsacd/leeds/persistence.pdf (acc. 25 Feb, 2011) Knight R.L, Kadlec R.H, Ohlendorf H.M. (1997). The use of treatment wetlands for petroleum
industry effluents, prepared for the American Petroleum Institute (API), publication Number
4672, API publishing services: Washington D.C.
Leonardson, L. (1994). Wetlands as nitrogen sinks –Swedish and international experiences). Naturvårdsverket, rapport 4176, Gotab, Stockholm, pp. 70-74, 77, 223-232
Mennerich, Artur.,(2003). Naturnahe Lösungen der dezentralen Abwasserreinigung .In
Ecological and Economical efficiency of Constructed Wetlands and Transferability of Decentralized Wastewater Treatment Operation to Nepal
Minnesota Pollution Control Agency (MPCA),(July 2007) : Phosphorus: Sources, Forms,
Impact on Water Quality - A General Overview http://www.pca.state.mn.us/index.php/view-
document.html?gid=8547 (acc. 22 Feb,2011)
Mohaupt V., Behrendt, H. and Feldwisch, N. (1996) Die aktuelle Nährstoffbelastung der Gewässer in Deutschland und der Stand der Belastungsvermeidung in den Kommunen und der Landwirtschaft. In: Deutsche Gesellschaft für Limnologie (DGL), Tagungsbericht 1995 (Berlin), Krefeld 1996, S. 376-383. Munshower, F.F (1994). Practical Handbook of Disturbed Land Revegetation, Lewis Publishers, Boca Raton, Florida
Nyachhyon B L (2006) Service Enhancement and Development of Sanitary Sewarage System in Urban and Semi-Urban Setting in Nepal, Policy Paper 23, prepared for Economic Policy Network, Ministry of Finance (MOF)/HMGN and Asian Development Bank (ADB) Nepal Resident Mission. Pant, Pradip Raj and Dongol, Devendra. (2009): Kathmandu Valley Profile Briefing Paper, Workshop 11 – 13 February 2009, Kathmandu Metropolitan City, Nepal http://www.eastwestcenter.org/fileadmin/resources/seminars/Urbanization_Seminar/Kathmandu_Valley_Brief_for_EWC___KMC_Workshop__Feb_2009_.pdf (acc.10 Jan , 2011) Platzer, C and Mauch, K. (1997), Soil clogging in vertical flow reed beds: Mechanisms, parameters, consequences and...solution Water Science and Technology 35(5):175-182 http://www2.gtz.de/Dokumente/oe44/ecosan/en-soil-clogging-2008.pdf (acc. 20 Jan, 2011)
Poh, Saik-Choon (2003). Assessment of Constructed Wetland System in Nepal. A dissertation for the fulfillment of degree of the Master of Engineering in Civil and Environmental Engineering. Massachusetts Institute of Technology, Cambridge, MA. 2003. http://www.watersanitationhygiene.org/References/EH_KEY_REFERENCES/SANITATION/Wastewater%20Treatment%20Disposal%20and%20Reuse/Constructed%20Wetland%20Systems%20(MIT).pdf (acc. 1 Jan, 2011)
Reed, S.C., Middlebrooks, E.J., and Crites, R.W.( 1988,1995). Natural Systems for Waste
Management and Treatment. First and Second Edition, McGraw-Hill, New York, USA
Reddy K.R., Patrick W.H.(1984). Nitrogen transformations and loss in flooded soils and
sediments.CRC Critical Reviews in Environment Control 13: 273-309
Reddy, K.R. & DeBusk, W.F. (1987). Nutrients storage capabilities of aquatic and wetland
plants. In Reddy, K.R & Smith, W.H. (eds.) Aquatic Plants for Water Treatment and
Ecological and Economical efficiency of Constructed Wetlands and Transferability of Decentralized Wastewater Treatment Operation to Nepal
Richards, Amanda,(2003). Effects of Detergent Use on Water Quality in Kathmandu, Nepal. A dissertation for the fulfillment of degree of the Master of Engineering in Civil and Environmental Engineering. Massachusetts Institute of Technology, Cambridge, MA. 2003. http://web.mit.edu/watsan/Docs/Student%20Theses/Nepal/Richards2003.pdf (acc. 13 Feb, 2011) Schneider, W. and Fresenius, W., (1989). For reference „‟ Waste Water Technology‟‟ origin, collection, treatment and analysis of waste water, Institute Fresenius GmbH ,Taunusstein-Neuhof, commissioned by the Deutsche Gesellschaft für Technische Zusammenarbeit (GTZ) GmbH, pp 12-40, 581 - 600 Seidel, K. 1995. Die Flechtbinse Scirpus lacustris. In : Ökologie,Morphologie und Entwicklung,ihre Stellung bei den Volkern und ihre wirtschaftliche Bedeutung, stuttgart. pp 37-52 Shrestha, Roshan R and Shrestha, Prajwal : Constructed Wetlands in Nepal: Chronicle, Continuance and Challenges ,Environment and Public Health Organization (ENPHO), P.O.Box – 4102, Kathmandu Nepal.
Shrestha, Roshan R. (1999) Application of Constructed Wetlands for Wastewater Treatment
in Nepal. A dissertation for the fulfillment of degree of the Doctor of Applied Natural
Sciences. University of Agricultural Sciences, Vienna, Austria.
S. Kayombo, T.S.A. Mbwette, J.H.Y Katima N. Ladegaard, S.E. Jørgensen WSP & CW Research Project, Prospective College of Engineering and Technology University of Dar es Salaam. Danish University of Pharmaceutical Sciences , Section of Environmental
Chemistry Copenhagen Denmark. http://www.unep.or.jp/ietc/Publications/Water_Sanitation/ponds_and_wetlands/Design_Manual.pdf (acc 25 Jan, 2011) SWAMP (2002). Sustainable Water Management and Wastewater Purification in Tourism Facilities. Guidelines developed within the 5th Framework Programme of the EU Tanner, C.C, Sukias, J.P., Dall C. (2000) Constructed Wetlands in New Zealand: Evaluation of an emerging „‟ natural‟‟ wastewater treatment technology. Water 2000: Guarding the global Resources Conferences, Auckland, New Zealand. US EPA (2000). Constructed Wetlands Treatment of Municipal Wastewater. EPA/625/R-99/010 Office for Research and Development, Cincinnati Ohio. http://water.epa.gov/type/wetlands/restore/cwetlands.cfm (acc. 15 Jan, 2011)
USEPA (2004), Guidelines for Water Reuse, EPA/625/R- 04/108, p. 167-168, Washington, DC. http://www.epa.gov/nrmrl/pubs/625r04108/625r04108.pdf (acc. 15 Jan 2011) Vymazal, J.; Kröpfelová, L,(2008). Wastewater Treatment in Constructed Wetlands with Horizontal Sub-Surface Flow; Springer: Czech Republic, Ch-7, pp 369-370 http://books.google.de/books?id=IfqerCqRvg8C&pg=PA370&dq=constructed+wetlands+development+history+of+Germany&hl=de&ei=fk7- TNG8K9yR4gaB_8nmCA&sa=X&oi=book_result&ct=result&resnum=1&ved=0CCwQ6AEwAA#v=onepage&q=constructed%20wetlands%20development%20history%20of%20Germany&f=false (acc. 15 Jan, 2011)
Ecological and Economical efficiency of Constructed Wetlands and Transferability of Decentralized Wastewater Treatment Operation to Nepal
Vymazal Jan, et. al.,(2010). Constructed Wetlands for Wastewater Treatment, Water ISSN 2073-4441 http://www.mdpi.com/2073-4441/2/3/530/pdf , (acc. 10 Jan, 2011) Vymazal, J. (2005). Removal of Enteric Bacteria in Constructed Treatment Wetlands with Emergent Macrophytes: A Review Journal of Environmental Science and Health, 40:1355–1367, 2005 Copyright C @ Taylor & Francis Inc. http://www.uvm.edu/~atuttle/john%20todd%20copy/zanzibar/enteric%20bacteria%20removal%20constructed%20wetlands%20macrophites.pdf (acc. 25 Feb, 2011) Vymazal, J. (2005a) Horizontal subsurface flow and hybrid constructed wetland systems for
for wastewater Treatment in Europe, ISBN 90-73348-72-2, Backhuys Publishers, Leiden the
Netherlands. pp 9, 17-53, 74,123-150, 169-188
UNDP (2010), Human Development Report 2010. http://hdr.undp.org/en/media/HDR_2010_EN_Complete_reprint.pdf (acc. 5 Feb, 2011)
UN-HABITAT (2008): Constructed Wetlands Manual, case study in Nepal, ch-9, pp 55-72
Ujang, Z., Henze, M. (2006). Municipal Wastewater Management in Developing Countries: Principles and Engineering. IWA Publishing, pp. 2-5, 14 Water aid Nepal: Decentralized wastewater management using constructed wetlands in
Wetzel R.G.,(2001) Limnology. Lakes and River Ecosystems. Third Edition, Academic Press:
San Diego, California.
WHO,(2008): Regional Workshop on Ecological Sanitation, Park Village Hotel, Kathmandu, regional office for South- East Asia Nepal, 22-25 September, 2008 http://www.searo.who.int/LinkFiles/SDE_EH-557.pdf (acc 13 Feb, 2011)
WHO (World Health Organization) and UNEP (United Nations Environment Programme) (2006). WHO guidelines for the safe use of wastewater, excreta and greywater, vol 1-2. WHO Press, Geneva. http://www.who.int/water_sanitation_health/wastewater/gsuww/en/index.html (acc.15 Jan 2011) Wieder, R.K.(1989) A survey of constructed wetlands for acids coal mine drainage treatment
in the eastern United States, Wetlands 9: 299-315
Winter K.J.and Goetz, D.(2003). The impact of sewage composition on soil clogging
phenomena of vertical flow constructed wetland. Water Science and Technology 48(5): pp 9-
Ecological and Economical efficiency of Constructed Wetlands and Transferability of Decentralized Wastewater Treatment Operation to Nepal
Winthrop C.A., Hook P., Biederman J.A., and Stein O. (2002). Wetland aquatic processes; Temperature and wetland plant species effects on wastewater treatment and root zone oxidation. Journal of Environmental Quality, Vol. 31: 1010-1016. Wissing, F., Hoffmann, K.F.,(2002). Wasserreinigung mit Pflanzen Eugen Ulmer GmbH & Co, 2nd. edition, 2002 Wolvertor, B.C. (1987), Aquatic plants for wastewater treatment: an Overview. In: Aquatic
Plants for Water Treatment and Resources Recovery, Reddy K.R., Smith W.H (eds)
Magnolia Publishing, Orlando, Florida, pp 3-15.
Zhu, T., and Sikora, F. (1994). “Ammonium and nitrate removal in vegetated and unvegetated gravel bed microcosm wetlands.” Conf. Wetland systems for water pollution control, Guangzhou, China, 355 - 366.