80


Introduction to Confocal & MultiphotonMicroscopy

• Basics of Light Microscopy
• Principles of Fluorescence
• Optical Resolution
• Confocal microscopy principle
• Some important aspects
• Basic Multiphoton Microscopy
• Multiphoton Microscopy Application
• Super resolution: STED
Introduction to Confocal Microscopy

Basics of Light Microscopy

World of small structures

• Magnification : The way to see small detail
• Resolution : The way to distinguish between small detail
• Contrast : The way to see resolved and magnified detail
To see the Micro-cosmos
We need a Microscope

• Human eye : 100000 nm
• Simple magnifier : 10000 nm
• Optical microscope : 200 nm
• Electron microscope : 0.5 – 3 nm
• Scanning Probe microscope : 0.1 – 10 nm
To see the Micro-cosmos

WideField Microscopy
• Simultaneous illumination and observation of an extended area.
• Image formed contains in focus and out of focus information
• No scanning procedure necessary
• Standard light sources are sufficient

Imaging Modes
BF
PH
DIC
FL

Principles of Fluorescence

• Only specific structures are stained and images
• Unwanted structures remain are not visible
• Detail can be seen even if smaller than resolution limits
• With the advent of special dyes, staining of living cells is now possible
Contrast using Fluorescence

Fluorescence Jablonski Diagram
Energy
Prof. Alexander Jablonski, 1935
Absorption
Emission
Stokes-Shift
488nm
525nm
Excited Energy levels
Ground Energy levels

Fluorescence
Dichroic spectral position

Fluorescence Filter Block
Prof. Ploem’s invention

Fluorescence Filters

Optical resolution

XY Plane
Airy disc
Optical Resolution Limited by Diffraction
D0 = 1.22 * / NA
XZ Plane

Objective NA
Point Spread Function (PSF)

Fluorescence Resolution
Res = 0.61*
credit: http://www.microscopyu.com/tutorials/
Example:
63X Oil N.A. 1.4
Resolution = 210nm

Fluorescence in a thick specimen
Lack of contrast due to flare

Confocal microscopy principle

Confocal Microscopy
• Patented by Marvin Minsky in 1957
• Elimination the out of focus flare observed influorescence in thick sections

Conventional vs Confocal
Basement membrane labeled with cy2 (green)Neurons labeled with cy3 (red)http://www.atto.com/Carv/CarvSkinSection.htm

Confocal Principle
Objective
Laser
Emission Pinhole
Excitation Pinhole
PMT
EmissionFilter
Excitation Filter

Why Laser ?
Intense light source confined to small beam size to increase the signal and to allow easy focus on the diffraction limited spot.
As different fluorescence dyes have different spectralcharacteristics, many laser lines are required

Scanning Galvanometers
x y
Laser in
Laser out
Point Scanning
ToMicroscope

Scanning could be really fast!!!
Resonant Scanner for fast imaging at high z-resolution,dynamic measurement at high speed(imaging of Ca2+ transients, movement imaging, Kineticmeasurements) Lines: 8000 lines/sec unidirectional
16000 lines/sec bidirectional
Frames: 25 frames/sec at 512x512 pixels
250 frames/sec at 512x16 pixels

Resonant Scanner
Fish embryo (Medaka)Flow of red blood cells and migration of macrophages.Macrophage: YFP and RFP (1st & 2nd ch)Red blood cells: TLD
Courtesy of Clemens Grabher and Jochen Wittbrodt(EMBL), Heidelberg, Germany

Arabidopsis thalianaFirst channel: Cell wall in reflection.2 & 3 channel: Monitoring mitochondrial (GFP-green) and plastid (autofluorescence-red) movement.
Courtesy of Prof. Dr. D. Menzel, Institut für Zelluläre und Molekulare BotanikZellbiologie der Pflanzen, Bonn University.
Resonant Scanner

Resonant Scanner
Lines
8000 lines/sec unidirectional
16000 lines/sec bidirectional
Frames
25 frames/sec at 512x512 pixels
250 frames/sec at 512x16 pixels
Fish embryo (Medaka)Flow of red blood cells and migration of macrophages.Macrophage: YFP Red blood cells: TLD
Courtesy of Clemens Grabher and Jochen Wittbrodt(EMBL), Heidelberg, Germany

Resolution: Widefield vs Confocal
Conventional Confocal
Res = 0.61* Res(xy) = 0.4*
Res(xz) = 0.45*n(1-cos
Formulas by Kino

Resolution Widefiled vs Confocal
Credit : Prof. A. Diaspro
Conventional Confocal
Res = 0.61* Res = 0.4*

Diffraction Limit:

Widefield vs. Confocal imaging
Drosophila melanogaster (larvae)
Green: Nuclei (RNA binding protein), Alexa 488; Red: Axons, Cy 3; Blue: Axon endings (of MJ94-positive neurons), Cy 5
Courtesy: Dr. Christoph Melcher, Research Center Karlsruhe
Widefield Confocal

Some important aspects

Choose the right objective
Needs for confocal imaging:
• High aperture• High colour correction• Flat field• Long working distance• High transmittance• Variety of coupling media (oil, water, glycerol)
i.e. Plan Apochromat &Plan-Fluotar

Match the refractive index
• Avoid mismatch of refractiveindex!
•Select objectives accordingto the sample preparation
• Oil objective gives the bestconfocal effect only when the specimen is close to the coverslip
•Matching the refractive index between immersion medium and the specimen gives better Z-resolution. (e.g. Water, Glycerol)

Match the refractive index
XY XY
XZ XZ
YZ YZ
glycerol lens oil lens
Muscle tissue embedded in glycerol/waterrecorded stack: 100umCourtesy of Dr. Günther Giese, MPI, Heidelberg

Match the refractive index

Coverslip thickness
Use coverslip with thickness = 170um
15um mismatch will kill ½ of resolution
Water/Glycerol objectives provide correction collar for coverslip thickness compenstation.
No. 0 – 0.085 to 0.13 mm thick No. 1 – 0.13 to 0.16 mm thick No. 1.5 – 0.16 to 0.19 mm thick No. 1.5H – 0.17 to 0.18 mm thick

Format Size
The Scan format is adjustable for Confocal microscope (e.g. 512 X 512, 1024 X 1024)
The format size must be big enough in order to truly represent the information recorded by your objective.

Sampling Theory
The Nyquist Theorem Nyquest theory describes the sampling frequency (f) required to
represent the true identity of the sample. i.e., how many times must you sample an image to know that your
sample truly represents the image? In other words to capture the periodic components of frequency f in
a signal we need to sample at least 2f times Nyquist claimed that the rate was 2f. It has been determined that in
reality the rate is 2.5f - in essence you must sample at least 2 times the highest frequency. For example in audio, to capture the 22 kHz in the digitized signal, we
need to sample at least 44.1 kHz

Matching the pixel size with the resolution of the objective

Diffraction Limit:

QuestionQuestion??

MULTIPHOTON MULTIPHOTON MICROSCOPY BASICSMICROSCOPY BASICS

Basic principle of multiphoton excitation
Fluorescence emission
Fluorescence emission
1-photon excitation 2-photon excitation
exci
tatio
n
Two-photon excitation
• Simultaneous absorption of 2 photons for excitation of a fluorophore with the half energy
Single photon
• 1 photon is absorbed by a fluorophore• From fundamental state to excited state
Two-photon excitation
• Simultaneous absorption of 2 photons for excitation of a fluorophore with the half energy
Single photon
• 1 photon is absorbed by a fluorophore• From fundamental state to excited state

Basic principle of multiphoton excitation
1-photon excitation
Focal plane
2-photon excitation
1-photon excitation
Advantages of Multiphoton excitation
Greater penetration depth due to lower scattering
Excitation restricted to focal plane – no volume bleaching
Optical sectioning properties without use of pinhole
Reduced phototoxicity due to spatial confinement, ideal for living cells
photoactivation or photobleaching in a diffraction limited volume

Confocal microscopy vs. Multiphoton microscopy
Pulse
continuous

Achievable depth: ~ 300 – 500 µm
Maximum imaging depth depends on:
Available laser power
Tissue properties
Density properties Microvasculature organization Cell-body arrangement Collagen / myelin content
Collection efficiency (NDD vs internal PMT)
The depth limit
Acute mouse brain sections containing YFP neurons,maximum projection, Z stack: 233 m
Courtesy: Dr Feng Zhang, Deisseroth laboratory, Stanford University, USA

na Pavg
2
f 2
NA 2
hc
2
na:probability of excitation: excitation cross sectionPavg: average power incident light (peak power): pulsewidth: repetition rateNA:Numerical apertureh: Planck‘s constantc: Speed of light: Wavelength
Two-photon: excitation probability
Given the formula, MP excitation is favoured when we have:• Molecules with large cross-section• High peak power• High-NA objective lenses

Examples of cross section in 2P excitation
The best excitation is not always the double of 1P excitation

Blab et al., 2001Two-Photon Excitation Cross-Sections of the Autofluorescent Proteins. Chemical Physics Letters 350: 71-7
TP cross-section of standard FPs

Bestvater et el.Two-photon fluorescence absorption and emissionspectra ofdyes relevant for cell imagingJournal of Microscopy, Vol. 208, Pt 2 November 2002, pp. 108–115
Examples of cross section in 2P excitation

Multiphoton excitation of selected dyes
780 nm 820 nm 1064 nm
Cell WallStain
Calcofluor White 440/500-520
Calcofluor White 440/500-520
Nucleic AcidStains
DAPI, Hoechst 350/470350/460
DAPI (885,9703P), Hoechst
350/470350/460
Ethidium Bromide 518/605 Propidium Iodide 530-615Feulgen 480/560 Feulgen 480/560 Feulgen 480/560
Cell Viability Fluorescein DiAcetate
495/520 Fluorescein DiAcetate
495/520
Calcium Indo 1 (720,885 3P)
340-365/400-480
Fura 2 (720) 340-380/512
CalciumGreen/Texas Red
(770)
488/530,596/620
Calcium Green 488/530Protein
ConjugatesAMCA 431/498
FITC 490/525 FITC 490/525CY2 (760 nm) 489/506 CY2 489/506 BodipyR6G 528/547CY3 (760 nm) 550/570 CY5 649/670 Oregon Green
514506/526
CY5 (760 nm) 649/670 TRITC 541/572 TRITC 541/572Texas Red 596/620 Texas Red 596/620
CY3 550/570Gene
ExpressionGFPuv 395/509 S65T (860) 488/507 S65T 488/507
MitoTracers
Rhodamin 123 507/529 Rhodamin 123 507/529 Rhodamin 123 507/529
Rosamin 550/574Rhodamin 6G 530/590
JC1 514/529Vacuolar
TracerFM4-64 515/614
Lipid Tracer Nile Red 485-530/526-605
DiI (12, 16) 549/565Neuronal
TracerDID (760-780) Lucifer Yellow 430/535 Evans Blue 550/610

Advantage of Multifphoton vs Confocal for imaging scattering tissue No confocal pinhole necessary detectors as close as possible to the specimen enables scattered photons to be collected much higher photon collection efficiency
compared to confocal microscopy
2 NDDs architecture different dichroics availableto separate pairs of fluorochromes
TCS SP5 MP: NDDs

Highest photon collection efficiency
Detectors directly behind Objective, RLD
Detectors directly behind Condensor, TLD
Advantage:
Scattered fluorescent photons can also becollected
Special dichroic allows simultaneousacquisition of fluorescence and IR-SGC
Protected by Leica patent US 6,831,780 B2
TCS SP5 MP: NDDs

Mouse brain slice: ~ 20 µm (center plane)Detection range: 500 – 550 nmPMT: 950 VObjective: 20 x 1.0 WExcitation: 920 nm, power level identical
internal RLD TLD
Mean intensity image: 20 52 58
Photon Collection Efficiency - Internal vs. NDDs

MULTIPHOTON MULTIPHOTON MICROSCOPY MICROSCOPY
ApplicationApplication

Mounted artery of the mouse
ImagingExcitation at 890nm
3 channel acquisition: • Autofluorescence of elastin (blue), • Syto13 for nuclei of cells in the vascular wall (green/white),• Eosin auto-fluorescence (red);
Imaging depth 650µm.
PreparationCommon carotid arteries from mice are carefully dissected, excised, and stored in Hanks’ balanced salt solution (HBSS, pH 7.4).
Courtesy of Marc van Zandvoort, Biophysics, Univ. of Maastricht, Netherlands
In vivo imaging – Thick specimen

Eye of zebrafish embryo (stained with DAPI)
Image size (xz): 125 m x 125 m - Objective: 63x 1.2 Water - Detection window: 400nm – 500nm
Ex: UV / 365 nmPMT: 360V
Ex: IR / 780 nmPMT: 360V
Confocal vs. Two photon – depth penetration

Introduction of a photoactivated markerallows for: Studying cell lineage
Organell dynamics
Protein trafficking
Compartment connectivity
photoactivation/ / ~conversion typicallyachieved with high intensity flash of 405 nm
Photoactivation with Fluorescent Proteins

Patterson750photoactivation
paGFP
Wiedemann
mEOSFP
Switched on / off
Miyawakigreen780, 1010
photochromicDronpaLukyanovgreen / red960Dendra
Lukyanovcyan / green800PS-CFP
Miyawakigreen / red760KikGrR1Miyawakigreen / red730 KAEDE
CommentReference
Fluorescence2 PE (nm)
TypeFP
Photo-activatable / switchable FPs

SHG involves virtual transitions in whichno energy is absorbed
2 photons „simultaneously“ scattered, resulting in „frequency doubling“
In contrast 2PE involves absorption (real transition) and excitation of molecules
SHG = λincident/2
Excited state
Ground state
hν
hν
hνSHG
Virtual state
Virtual state
Second Harmonic Generation: Jablonski diagram
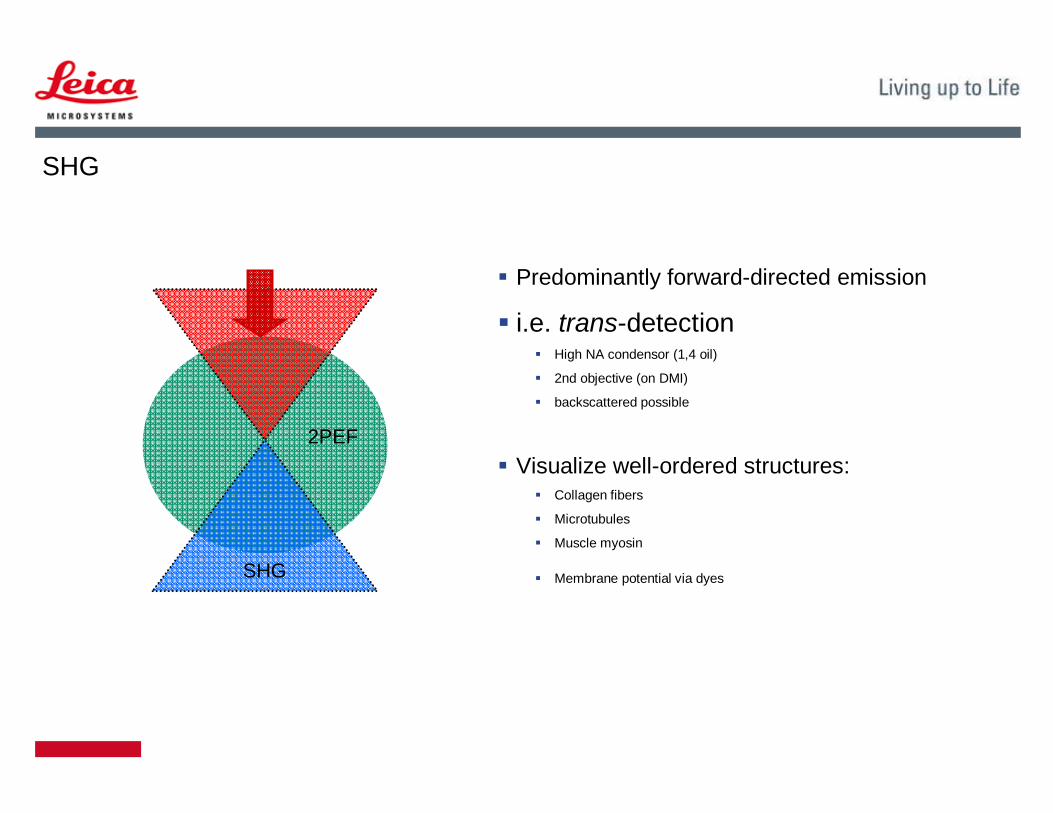
2PEF
SHG
Predominantly forward-directed emission
i.e. trans-detection High NA condensor (1,4 oil)
2nd objective (on DMI)
backscattered possible
Visualize well-ordered structures: Collagen fibers
Microtubules
Muscle myosin
Membrane potential via dyes
SHG
1
2
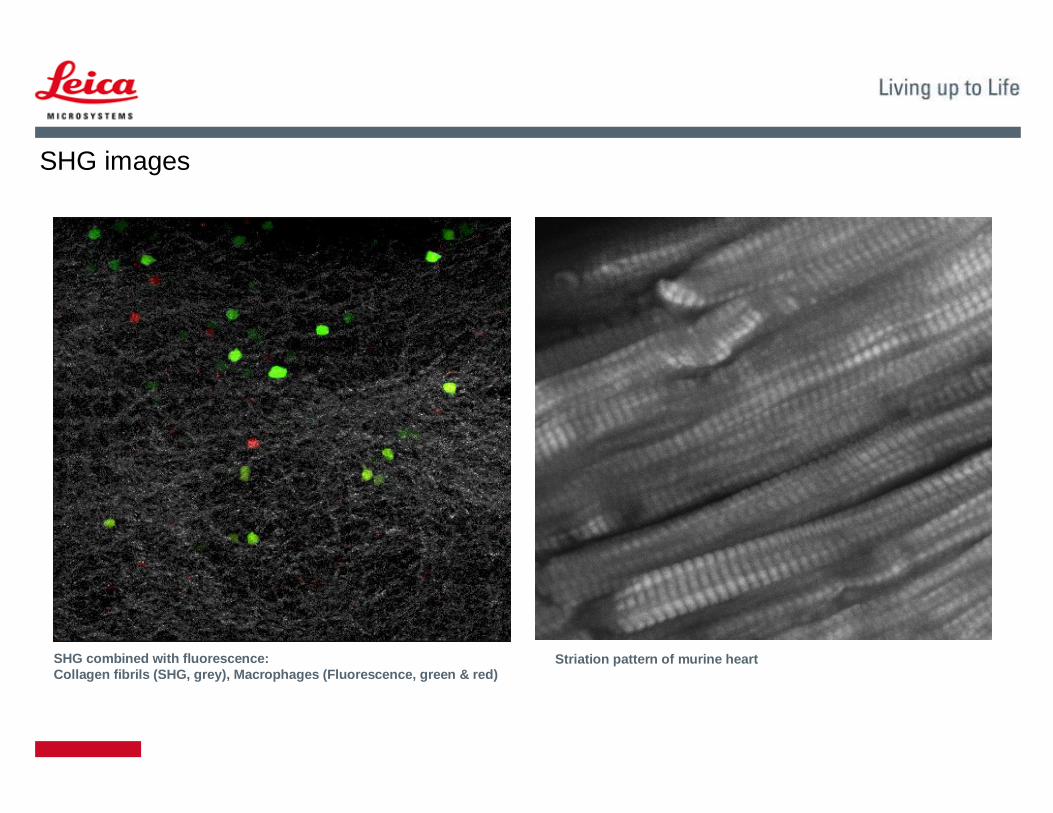
Striation pattern of murine heartSHG combined with fluorescence:Collagen fibrils (SHG, grey), Macrophages (Fluorescence, green & red)
SHG images

QuestionQuestion??

STED: Technology and Applications

Why super-resolution?
We want to study details!
beyond the diffraction limit with standard dyes/FPs inside cells/organisms

Why super-resolution?
The purpose of STED microscopy is to increase lateral (xy) resolutioni n fluorescence microscopy over classical Abbé Limits:

STED Microscopy: The Principle
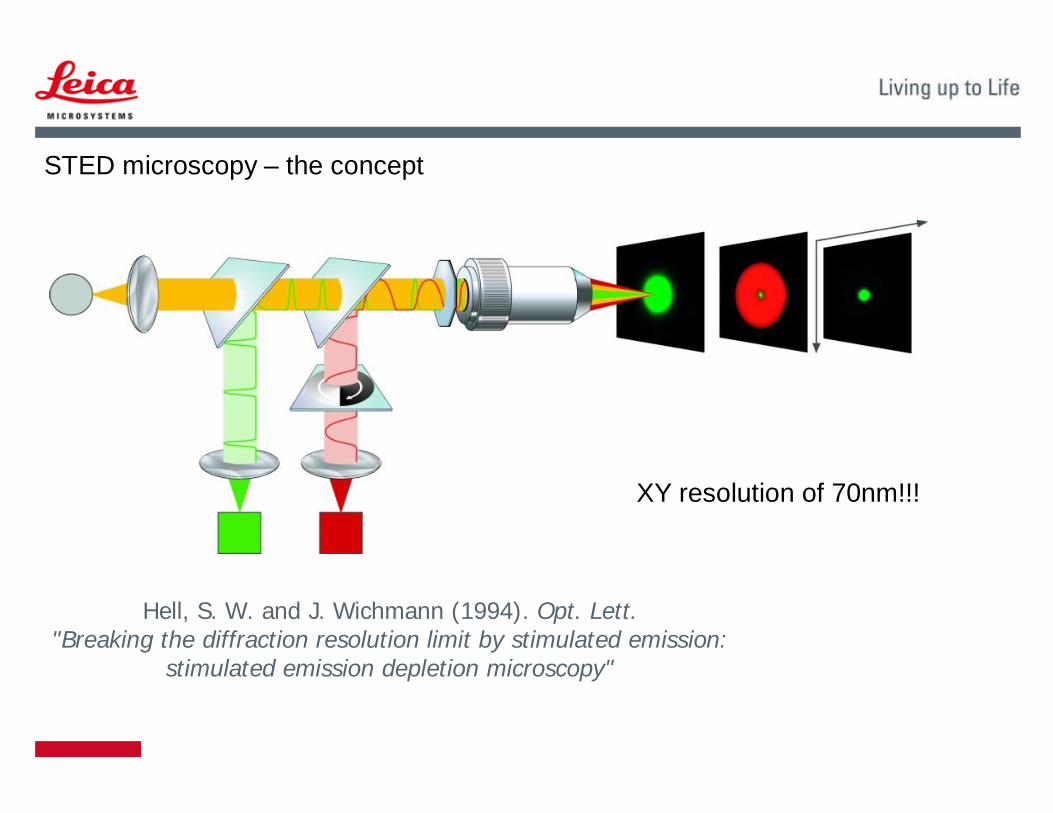
STED microscopy – the concept
Hell, S. W. and J. Wichmann (1994). Opt. Lett."Breaking the diffraction resolution limit by stimulated emission:
stimulated emission depletion microscopy"
XY resolution of 70nm!!!

STED microscopy – the concept
the focal spot

Confocal super-resolution
STED microscopy allows optical sectioning
z
penetration depth depends on refractive index matching best results at coverglass routinely good results achieved at 20µm deeper imaging possible

Maximum projection confocal
4 µm
z-pos: 0.9 µm z-pos: 2 µm z-pos: 4 µm z-pos: 6 µm
3D capability
Maximum projection STED
Oregon Green 488 Vimentin

Application
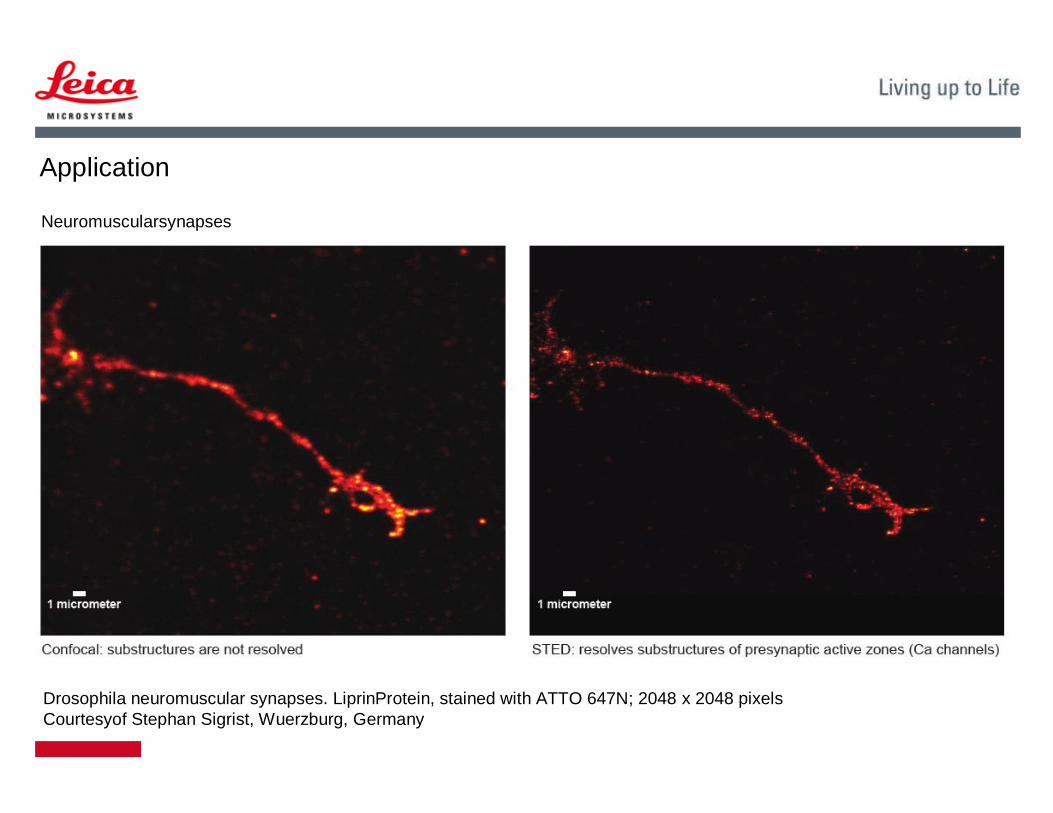
Application
Drosophila neuromuscular synapses. LiprinProtein, stained with ATTO 647N; 2048 x 2048 pixelsCourtesyof Stephan Sigrist, Wuerzburg, Germany
Neuromuscularsynapses

Dye Vendor Laser lines 2 color
Abberior STAR 635 Abberior 640/750 recommended
Atto 647N ATTO-TEC 640/750 recommended
Atto 655 ATTO-TEC 640/750
Atto 665 ATTO-TEC 640/775
Some working dyes for TCS STED

Sample preparation
• STED is fully compatible with all standard staining procedures for fluorescence microscopy (FISH, direct IF, indirect IF ….)
• Stay as close as possible to your original staining protocol
• Be aware of the size of the label
• If you want to work deep inside the samples match the refractive index
QuestionQuestion??


