KIT – Universität des Landes Baden-Württemberg und nationales Forschungszentrum in der Helmholtz-Gemeinschaft Lukas Hehn, Institut für Kernphysik, KIT www.kit.edu Introduction to RooFit Lukas Hehn KSETA PhD Workshop Freudenstadt, October 16 th to 18 th 2003
Transcript
KIT – Universität des Landes Baden-Württemberg undnationales Forschungszentrum in der Helmholtz-Gemeinschaft
Lukas Hehn, Institut für Kernphysik, KIT
www.kit.edu
Introduction to RooFitLukas HehnKSETA PhD Workshop Freudenstadt, October 16th to 18th 2003
Institut für Kernphysik, KIT2 Introduction to RooFit
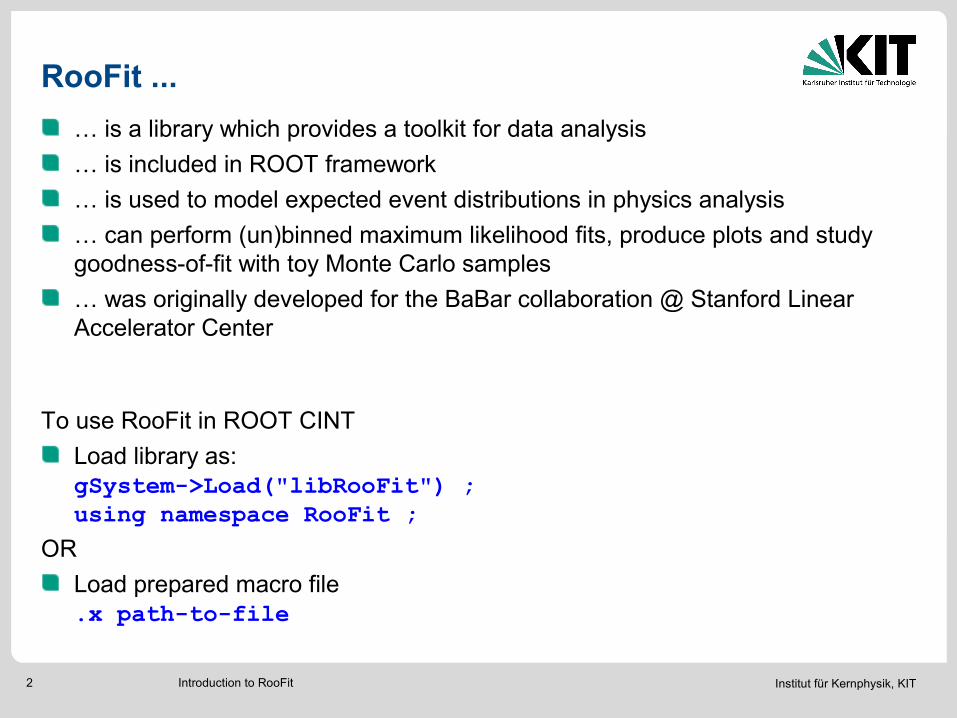
RooFit ...
… is a library which provides a toolkit for data analysis
… is included in ROOT framework
… is used to model expected event distributions in physics analysis
… can perform (un)binned maximum likelihood fits, produce plots and study goodness-of-fit with toy Monte Carlo samples
… was originally developed for the BaBar collaboration @ Stanford Linear Accelerator Center
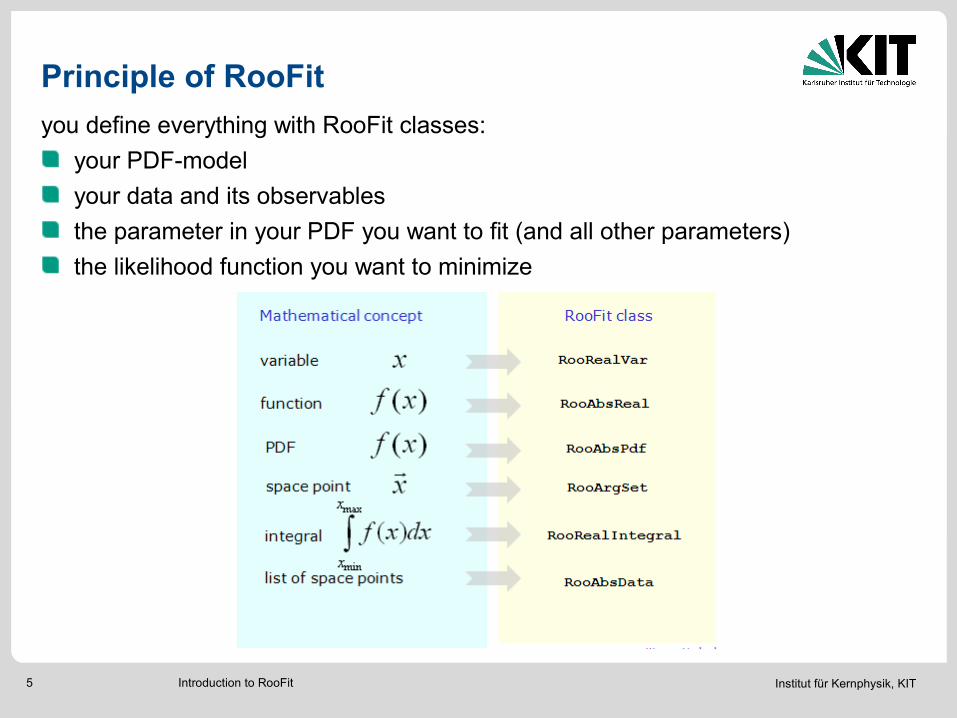
observables (i.e. x, y, energy, time) and parameters of a PDF (i.e. mean, sigma, slope) are both variables→ the data set “tells” a PDF what it's observable is→ all other variables must be parameters
when fitting a PDF model to data: all free floating (= not fixed) parameters are fitted
you can later on define and exclude a parameter from being fitted by the methodRooRealVar.setValue(value) and RooRealVar.setConstant()
Institut für Kernphysik, KIT12 Introduction to RooFit
2. About PDFs
construction of PDF is one of the most important steps
bad PDF → bad fit
the PDF contains the parameters which are fitted:this can either be parameters defining the shape of a PDF (like decay constant, Gaussian width, …) or often fractions of different PDF components (i.e. signal vs. background component)
PDFs are automatically normalized within RooFit
Institut für Kernphysik, KIT13 Introduction to RooFit
Build in PDFs
~20 predefined PDFs to build models from
Basic functions:
RooGaussian: normal Gaussian
RooBifurGauss: different width on low and high side of mean
RooExponential: standard exponential decay
RooPolynomial: standard polynoms
RooChebychev: Chebychev polynomials (recommended because of higher fit stability due to little correlation)
RooPoisson: Poisson distribution
Physics inspired functions:
Landau (RooLandau), Breit-Wigner, Crystal Ball, …
Specialized functions for B physics:
Decay distributions with mixing, CP violation, …
all one parameter less than normal because for a PDF→ integral != 1
Institut für Kernphysik, KIT14 Introduction to RooFit
More on PDFs
Other non-parametric functions:
RooHistPdf: from external ROOT histogram, optional interpolation for smoothing
RooKeysPdf: Kernel estimation, superposition of Gaussians on external unbinned data
Writing your own PDF class
from a formula expression:RooGenericPdf gp(“gp”,”Generic PDF”,”exp(x*y+a)-b*x”, RooArgSet(x,y,a,b)) ;
RooClassFactory to write and compile own C++ code for PDFs
Institut für Kernphysik, KIT15 Introduction to RooFit
Composite PDF models
realistic models are often a sum of multiple PDFs, i.e.Gaussian signal + flat background
class RooAddPdf adds N PDFs with (N-1) RooRealVar fraction coefficients
caveat: total PDF can become negative in some cases!
all methods work normally on such a PDF (fitTo(), plotOn(), ...)
exemplary tree view of such a PDF
Institut für Kernphysik, KIT16 Introduction to RooFit
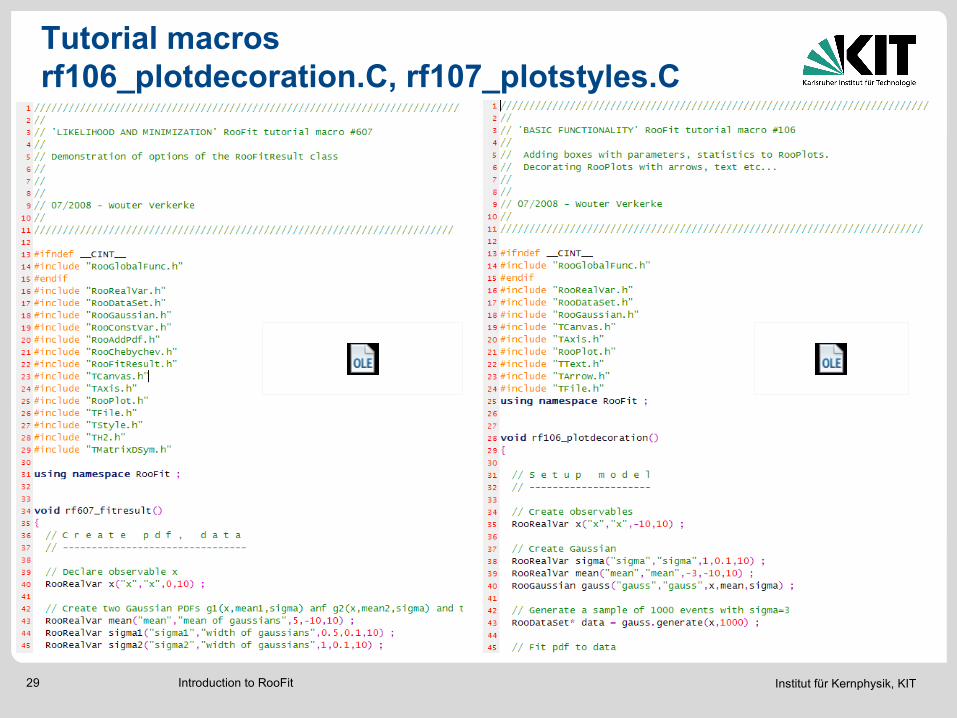
Tutorial macro rf201_composite.C
Institut für Kernphysik, KIT17 Introduction to RooFit
Convoluting PDFs
typical for experiments: expected observable behaviour (physics) is smeared with a (Gaussian) resolution function (detector)→ convolution of 2 different PDFs
RooFit offers several different methods to achieve this:
RooNumConv: brute force numeric convolution
RooFFTConvPdf: convolution based on fast fourier transformation (FFT)
(other predefined particle physics convolutions)
Institut für Kernphysik, KIT18 Introduction to RooFit
Multidimensional PDF models
replace parameter in 1D PDF with another PDF in another observable:
create model for more than 1 Observable (i.e. energy & time, x & y) with RooProdPdf class
with RooGenericPdf gp(“gp”,”sqrt(x+y)*sqrt(x-y)”,RooArSet(x,y)) ;
Institut für Kernphysik, KIT19 Introduction to RooFit
Tutorial macro rf301_composition.C
Institut für Kernphysik, KIT20 Introduction to RooFit
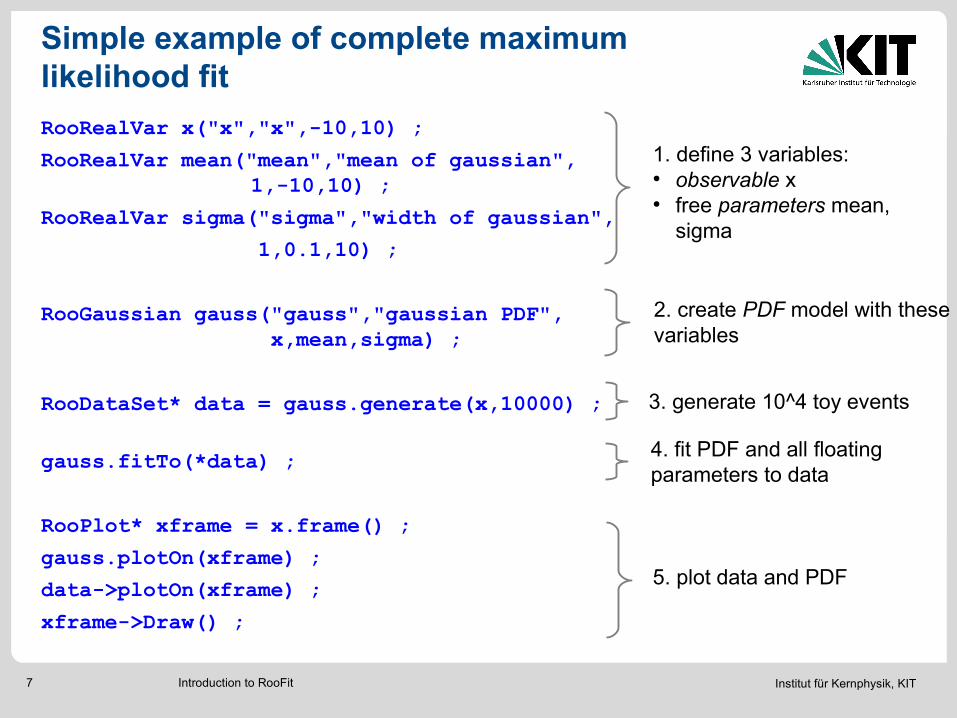
Simple example of complete maximum likelihood fit
RooRealVar x("x","x",-10,10) ;
RooRealVar mean("mean","mean of gaussian", 1,-10,10) ;


![Institut ]iir Theoretische Kernphysik der Universitat ... · Institut ]iir Theoretische Kernphysik der Universitat - Bon~ G. TALENTI lstituto Matematico dell' Universit~ - Genova](https://static.documents.pub/doc/80x56/5f9c4c2bf212e0406319fb83/institut-iir-theoretische-kernphysik-der-universitat-institut-iir-theoretische.jpg)


