The Carbon Footprint of Canada’s Food Guide Shwetha Yegna Research Paper submitted to Dr. Joshua Ramisch, Ph.D., and the Institute of the Environment in partial fulfillment of the requirements for the degree of Master of Science, Environmental Sustainability Institute of the Environment University of Ottawa Ottawa, Ontario, Canada Shwetha Yegna, Ottawa, Canada, 2017
Transcript
The Carbon Footprint of Canada’s Food Guide
Shwetha Yegna
Research Paper submitted toDr. Joshua Ramisch, Ph.D., and the Institute of the Environment
in partial fulfillment of the requirements for the degree of
Master of Science,Environmental Sustainability
Institute of the EnvironmentUniversity of Ottawa
Ottawa, Ontario, Canada
Shwetha Yegna, Ottawa, Canada, 2017
Abstract
The current version of Canada’s Food Guide was last updated in 2007 and helps individuals choose foods that improve health, meet nutrient needs, and reduce risk of nutrition-related chronic (long-term) diseases and conditions. Canada’s Food Guide is currently being revised to better fit the needs of different Canadian lifestyles. However, it is still only being looked at from a health standpoint. The sustainability of our food choices is left absent from the old and currently being updated guide. With the impacts of climate change increasingly important and visible, growing exponentially, it is vital to recognize that accounting for emissions related to dietary choices and (especially animal) agriculture could be part of decisions to eat more sustainably. Thus, my research attempts to determine the carbon footprint of Canada’s Food Guide based on the recommended serving size for males and females aged 19-50. A simple model was created using a food emissions calculator as the basis. The end user can observe the carbon footprints of many food items and manipulate the model to determine what their carbon footprint is or what the carbon footprint of certain types of diets are. The results show ‘Grain Products’ as having the largest contribution to emissions merely because of a high recommended number of servings. ‘Meat & Alternatives’ has the highest contribution to emissions per serving when compared with the other food groups. Models for diets that reduced or eliminated animal-based products within the Food Guide’s daily serving recommendations substantially reduced the carbon footprint of a Canadian diet. Animal agriculture is one of the leading contributors of greenhouse gas emissions posing many threats to the environment. As a result, several countries now promote plant-based diets in their national food guides. Decreasing meat intake will lower one’s carbon footprint, protect the environment and provide many health benefits as well. Thus, it is argued that Canada should move in this direction as well if we are to protect against the impacts of climate change.
2.0 Methods........................................................................................82.1 Food Emissions Calculator......................................................................82.2 Data Collection and Organization............................................................9
4.2.1 Animal Agriculture..............................................................................................164.3 Milk and Alternatives............................................................................184.4 Vegetables and Fruits...........................................................................194.5 Dietary Changes...................................................................................19
4.5.1 Climate Impacts of a Plant-Based Diet................................................................204.5.2 Health Benefits of a Plant-Based Diet.................................................................24
4.6 Assumptions and Limitations................................................................264.6.1 CleanMetrics.......................................................................................................264.6.2 Data Collection/Organization..............................................................................294.6.3 Time....................................................................................................................30
5.0 Conclusion..................................................................................316.0 Works Cited...............................................................................327.0 Appendix.....................................................................................34
1.0 Introduction
1.1 Background Information
3
Canada’s Food Guide (henceforth, “CFG” or “the Guide”) is a nutrition guide produced by Health Canada to help children, teens and adults make healthy food choices. The CFG is currently undergoing a reform so that it meets the needs of different Canadian audiences (Health Canada, 2017). The changes, per Health Canada, are part of an effort to improve the eating habits of Canadians and make the food guide more accessible and easier to understand (Mortillaro, 2016). A few topics that have been flagged for attention are emphasizing the need to replace saturated fat with unsaturated fat, which may decrease the risk of heart disease, and to reduce the high intakes of sugar sweetened beverages that are currently related to an increased risk of obesity. The revision also seeks to accommodate a diversity of dietary contexts (e.g. of First Nations) as well. Further, Canadian life-style is changing from stay-at-home moms to dual-worker households whereby 69% of households with families are dual-earners; this has clear consequences when it comes to eating (Stats Can, 2016).
The problem, however, is that the sustainability of our food choices remains conspicuously absent from the Guide (Lee, McLeod-Kilmurray, & Chalifour, 2017). Food production is a major driver of greenhouse gases (henceforth, “GHGs”), water, and land use. It is estimated that livestock production accounts for 70% of all agricultural land use and occupies 30% of the land surface of the planet (David Suzuki Foundation, n.d.). In Canada, crop and livestock production represents 10% of GHGs (AAFC, 2016). The growing of livestock and other animals for food is also an extremely inefficient process. For example, it takes approximately five to seven kilograms of grain to produce one kilogram of beef. Each of those kilograms of grain takes considerable energy and water to produce, process, and transport (David Suzuki Foundation, n.d.). As meat consumption has grown around the world, so has its climate impact.
Shifts in dietary patterns can therefore potentially provide benefits for both the environment and health (Aleksandrowicz et al., 2016). Studies show that switching to more sustainable diets can reduce emissions by approximately 70-
4
80% and can reduce water consumption by 50% (Aleksandrowicz et al., 2016). In the U.S., Wilson (n.d.) compared five different diets on the basis of their reliance on animal products, from “meat lover” at one end, through the “average” (the American diet’s average intake of meat), with “no beef”, “vegetarian” (lacto-ovo), and “vegan” (no animal products at all) at the other end of the spectrum. The “average” diet had an annual footprint of around 2.5 t CO2e1 per person. For the “meat lover” diet, this rose to 3.3 t CO2e. The “no beef” diet was 1.9 t CO2e. The vegetarian and vegan diets were 1.7 t CO2e and 1.5 t CO2e respectively (Wilson, n.d.). The study concluded that a vegetarian’s footprint is about two thirds of the average American and almost half that of a meat lover. For a vegan, it was even lower (Wilson, n.d.). A similar study was done in the United Kingdom where findings were similar. It concluded that dietary GHGs in self-selected meat-eaters was approximately twice as high as those in vegans and that it is likely that reductions in meat consumption would lead to reductions in dietary GHGs (Scarborough et al., 2014).
As such, several nations such as the United Kingdom, Sweden, Germany, Brazil and Qatar have now begun including environmentally sustainable food guidelines within their national food guide in addition to healthy food choices. For example, Qatar’s dietary guidelines recognize that the production and consumption of food impacts the environment and also depletes water. Qatar’s new dietary guidelines includes a section entitled “Eat Healthy while Protecting the Environment”. These sustainability-based guidelines include recommendations to eat a plant-based diet, reduce food waste, choose local and regionally produced foods, conserve water, and serve fresh homemade foods rather than processed or purchased ones (Lee et al., 2017). Further, Sweden’s national dietary guidelines, which were revised in 2015, explicitly encourage customers to eat less meat and meat products and eat more plant foods, for health and sustainability benefits (Lee et al., 2017). 1 “Carbon dioxide equivalent” is a standard unit for measuring carbon footprints, which expresses the impact of different greenhouse gases in terms of the amount of CO2 that would create the same amount of warming
5
The current CFG revision process is being led exclusively by the Ministry of Health. Although there are many concerns that scholars and advocacy groups have raised about this process, one assertion relevant to this research paper is that Health Canada should not be the sole authority responsible for revising the Guide; Environment and Climate Change Canada should be an equal partner as well (Lee et al., 2017). With Environment and Climate Change Canada as an equal partner, suggestions and insights on food sustainability could be incorporated as well. If we are to address the multiple social, health and environmental challenges caused by, and affecting food systems, global populations need to move towards dietary patterns that are both healthy and respectful of environmental limits (Reynolds, n.d.). With the environmental footprint of food production and consumption left out of both the existing food guide and the process for updating it, an important opportunity to ensure healthy eating and protecting the long-term viability of our natural resources is lost.
1.2 Project Context
This research paper will therefore attempt to determine the carbon footprint of the CFG based on the recommended number of food guide servings per-day for males and females aged 19-50. My research will enable me to shed new light on the environmental sustainability of present dietary choices as it will help to understand how carbon friendly or un-friendly the CFG’s requirements are. I can then can portray the need to include or not include sustainability in the Canadian food guide. Past research studies have and continue to analyze the carbon footprint of individual food items, various types of diets such as meat lover and vegetarian, and of the animal agriculture industry. My research, although limited in scope and time, will be the first attempt to study the carbon footprint of the CFG.
2.0 Methods
6
2.1 Food Emissions Calculator
A simple model to determine the carbon footprint of the CFG requirements was created and a food emissions calculator was used on which to base the model on. The model can be found in the Appendix (section 7.0). The food emissions calculator used in this project is a free calculator created by CleanMetrics, a Portland, Ore.-based environmental consulting firm2. In selecting a suitable calculator for this project, there were several criteria that had to be met:
First, the calculator had to be tailored to the North American context. It was important that the calculator include a wide range of food items in
order to better encapsulate the various food items that make up Canadian diets. The CleanMetrics calculator organizes a plethora of commonly used food items into the following categories – beans/pulses, dairy, fruits/berries, grains, herbs, meat/poultry, miscellaneous food crops, nuts/seeds, oils, processed foods, root crops, seafood, tubers, and vegetables.
Further, it was required that the calculator have the option to generate results based on the weight of each serving size, rather than using fixed quantities. The flexibility of choosing a specific weight to input was vital because the CFG has varying serving sizes for food items and these constitute with different weights. The CleanMetrics calculator allows the user to set the quantity purchased by the consumer, in pounds, to provide more specific results for the end user.
Additionally, the calculator needed to provide information on GHGs related to production. The CleanMetrics calculator provides information on emissions related not only to production, but transport and waste as well. However, for the purposes of this project, only emissions during the production of the food item will be included and analyzed. Production emissions are for the production (cradle to farmgate). Packaging and cooking are not included.
Another important feature was that the calculator takes into account the
various types of GHGs that result from food systems. All food carbon emissions in this calculator are reported in kg of CO2e, which standardizes reporting of different GHGs involved in the food (carbon dioxide, methane and nitrous oxide) even though they have different radiative forcings. More information regarding the validity and credibility of the calculator created by CleanMetrics will be found in section 4.6.1.
Other tools and calculators were considered for this project such as the Economic Input-Output Life Cycle Assessment created by Carnegie Mellon. This tool estimates the materials and energy resources required for, and the environmental emissions resulting from, activities in our economy (Carnegie Mellon University, 2017). This tool was ultimately not chosen because it was not as user-friendly and flexible as the calculator by CleanMetrics. A specific weight could not be inputted and the tool required information such as the economic activity of the sector expressed in millions of dollars. The results produced when the model was run only provided information on emissions for the entire industry and sector as opposed to individual food items.
2.2 Data Collection and Organization
All food items listed in the calculator were transferred into the model and organized into the four food groups as per the CFG, namely “Vegetables and fruits”, “Meat and alternatives”, “Milk and alternatives” and “Grain products”. This can be found in the spreadsheet file, on the sheet “Food items by CFG categ”. Next, as the serving sizes for certain items varied, the food item’s respective serving size in the CFG was found and recorded in the column “1 serving size”. Information on serving size was found on the Government of Canada’s website. For example, one food guide serving size of asparagus is 125ml, ½ cup, 6 spears and 1 serving size of beef is 125 mL, (½ cup). Next, the weight of each food item, if not already given in grams, was found. For example, 1 serving of asparagus (½ cup) weighs in at 65g and 1 serving of Atlantic cod weighs in at 75g. The websites used
8
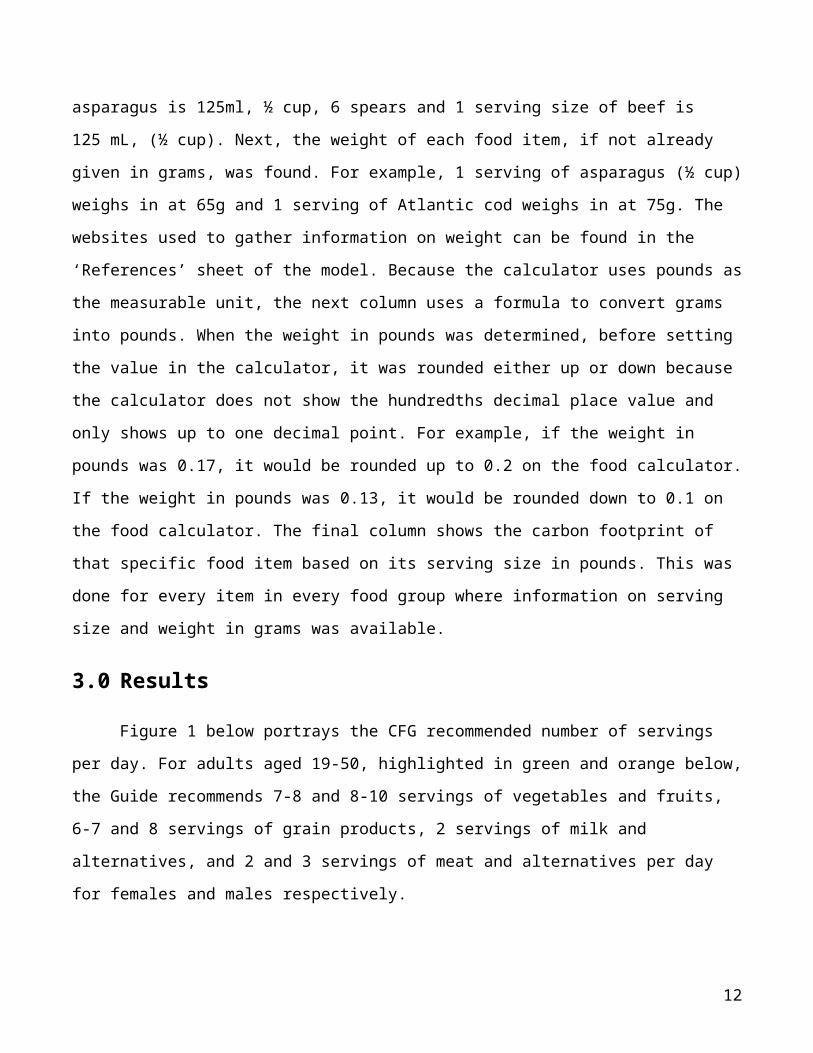
to gather information on weight can be found in the ‘References’ sheet of the model. Because the calculator uses pounds as the measurable unit, the next column uses a formula to convert grams into pounds. When the weight in pounds was determined, before setting the value in the calculator, it was rounded either up or down because the calculator does not show the hundredths decimal place value and only shows up to one decimal point. For example, if the weight in pounds was 0.17, it would be rounded up to 0.2 on the food calculator. If the weight in pounds was 0.13, it would be rounded down to 0.1 on the food calculator. The final column shows the carbon footprint of that specific food item based on its serving size in pounds. This was done for every item in every food group where information on serving size and weight in grams was available.
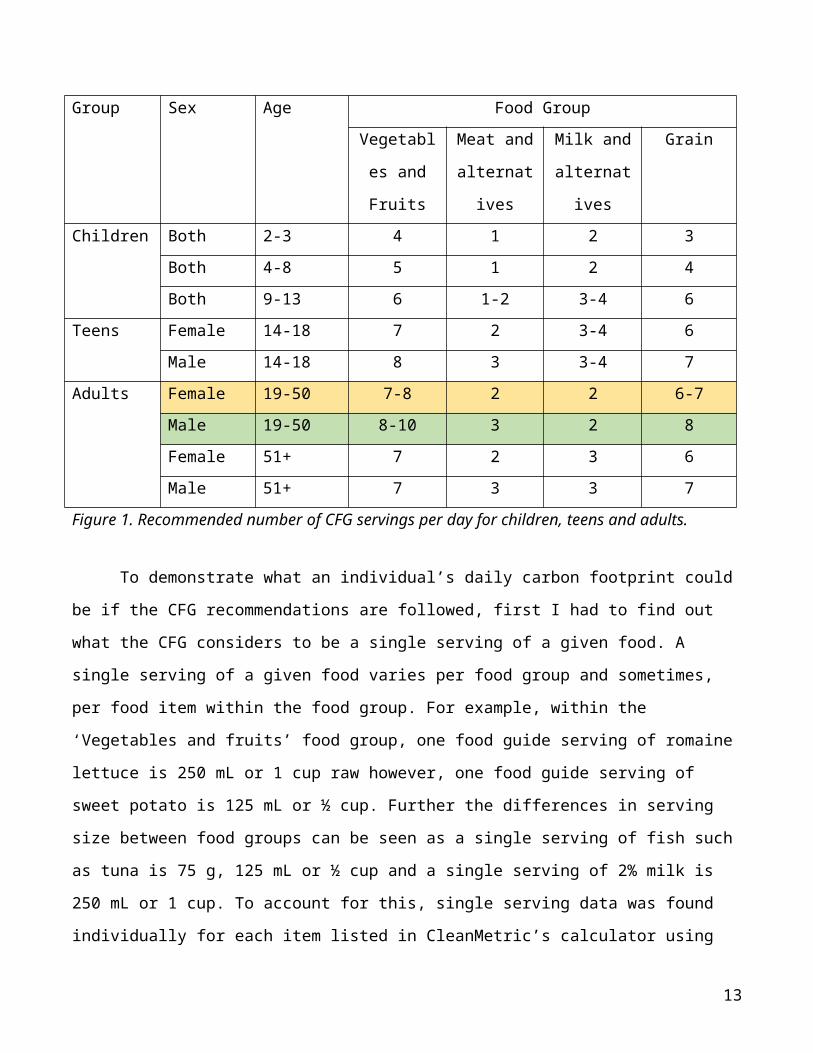
3.0 ResultsFigure 1 below portrays the CFG recommended number of servings per day.
For adults aged 19-50, highlighted in green and orange below, the Guide recommends 7-8 and 8-10 servings of vegetables and fruits, 6-7 and 8 servings of grain products, 2 servings of milk and alternatives, and 2 and 3 servings of meat and alternatives per day for females and males respectively.
Group Sex Age Food GroupVegetable
s and Fruits
Meat and alternativ
es
Milk and alternativ
es
Grain
Children Both 2-3 4 1 2 3Both 4-8 5 1 2 4Both 9-13 6 1-2 3-4 6
Male 51+ 7 3 3 7Figure 1. Recommended number of CFG servings per day for children, teens and adults.
To demonstrate what an individual’s daily carbon footprint could be if the CFG recommendations are followed, first I had to find out what the CFG considers to be a single serving of a given food. A single serving of a given food varies per food group and sometimes, per food item within the food group. For example, within the ‘Vegetables and fruits’ food group, one food guide serving of romaine lettuce is 250 mL or 1 cup raw however, one food guide serving of sweet potato is 125 mL or ½ cup. Further the differences in serving size between food groups can be seen as a single serving of fish such as tuna is 75 g, 125 mL or ½ cup and a single serving of 2% milk is 250 mL or 1 cup. To account for this, single serving data was found individually for each item listed in CleanMetric’s calculator using government websites such as Health Canada. Once this information was collected, the weights of food item listed in CleanMetric’s calculator had to be determined, as mentioned above in section 2.2. This step took a considerable amount of time as each food item listed in CleanMetric’s calculator constitutes with a different weight. For example, the weight of one food guide serving of romaine lettuce is different than the weight of one food guide serving of sweet potato. Thus, for each item listed in the food calculator, I consulted nutrition charts to determine the weights of each item, expressed in grams, and can be seen in the spreadsheet file, on the sheet “Food items by CFG categ”. The weights, in grams, were then converted to pounds in order to use the CleanMetrics calculator to generate an emissions total for each food item. After the emissions total for each food item was computed, I calculated the average serving for males and females in different age groups for each of the four categories. For example, I have averaged “7-8” servings of fruits and vegetables for adult females as “7.5”, etc. Next, the average values of a single serving in each of the four food groups was calculated and can be seen in the “per g” page of the model, using the raw data provided in the “Food items by CFG
10
categ” sheet of the model. Figure 2 below graphs the average per serving values to display the distribution between the four food groups.
4%
34%
32%
30%
Average Emissions per Serving
VegFruit MeatAlt MilkAlt Grains
Figure 2. Average daily emissions per serving of the four food groups.
Meat and alternatives contributes the highest to average per serving with a value of 0.465 kg CO2e. Second is milk and alternatives with a value of 0.433 kg CO2e. Third is grain products with a value of 0.4 kg CO2e and fourth is vegetables and fruits with a value of 0.052 kg CO2e.
The average values per serving (Figure 2) were then multiplied by the Guide’s recommendations for daily intake for men and women (Figure 1). This calculation can also be seen in the “per g” page of the model. Figure 3 below displays the daily emission values per food group after the calculations have been done for men and women aged 19-50.
VegFruit
MeatAlt MilkAlt Grains TOTAL
Average per serving
0.052 0.465 0.434 0.399
F 19-50 0.388 0.930 0.533 1.528 3.380
11
M 19-50 0.465 1.396 0.533 1.880 4.276Figure 3. Emissions per category (average values x recommended servings for Adults)
From these results, it can be seen that the total daily carbon footprint for adult females is 3.380 kg CO2e and 4.276 kg CO2e for adult males. Vegetables and fruits contribute the least to emissions per category and average per serving. Meat and alternatives contributes the highest per serving (0.465 CO2e) however, it is not the largest contribution to emissions in the recommended adult diet; grain products are. Grain products contribute 1.528 kg CO2e and 1.880 kg CO2e for females and males respectively. Milk and alternatives is the third largest contributor to emissions and average per serving.
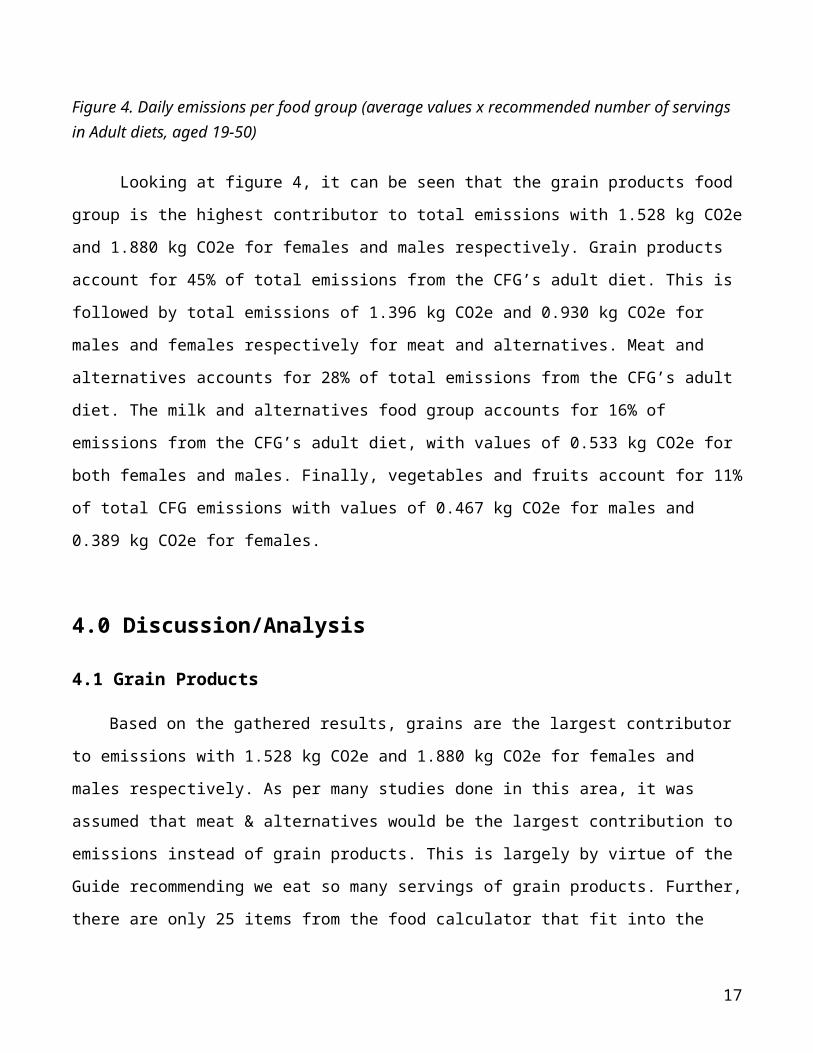
Figure 4. Daily emissions per food group (average values x recommended number of servings in Adult diets, aged 19-50)
VegFruit MeatAlt MilkAlt Grains0.000
0.200
0.400
0.600
0.800
1.000
1.200
1.400
1.600
1.800
2.000
Emissions per Category
MalesFemales
Food Groups
Carb
on F
ootp
rint (
CO2e
)
12
Looking at figure 4, it can be seen that the grain products food group is the highest contributor to total emissions with 1.528 kg CO2e and 1.880 kg CO2e for females and males respectively. Grain products account for 45% of total emissions from the CFG’s adult diet. This is followed by total emissions of 1.396 kg CO2e and 0.930 kg CO2e for males and females respectively for meat and alternatives. Meat and alternatives accounts for 28% of total emissions from the CFG’s adult diet. The milk and alternatives food group accounts for 16% of emissions from the CFG’s adult diet, with values of 0.533 kg CO2e for both females and males. Finally, vegetables and fruits account for 11% of total CFG emissions with values of 0.467 kg CO2e for males and 0.389 kg CO2e for females.
4.0 Discussion/Analysis
4.1 Grain Products
Based on the gathered results, grains are the largest contributor to emissions with 1.528 kg CO2e and 1.880 kg CO2e for females and males respectively. As per many studies done in this area, it was assumed that meat & alternatives would be the largest contribution to emissions instead of grain products. This is largely by virtue of the Guide recommending we eat so many servings of grain products. Further, there are only 25 items from the food calculator that fit into the CFG’s grain food group. Of the 25 items in the calculator, a lack of information regarding serving size information and weights decreased the number of items used in the spreadsheet model to just 19 when calculating the average. Further, the 19 grain items for which there is information only encompasses a small range of the grain products Canadians commonly consume. While most items on the list have relatively low carbon footprints, several types of rice skew the average upward as they are quite high. This influence, therefore, brings up the entire average. “White rice, wild”, is the grain product with the highest carbon footprint sitting at 1.01 kg CO2e. The lowest are oats, bran rice, wheat bread, wheat bread rolls, whole wheat bread, and whole wheat bread rolls with 0.04 kg CO2e. If more items were
13
included, the average has the potential to be less skewed by a single (high) CO2e value. The list of meat and alternative items included in the model for example, includes 63 items, more than three times as long as the list of grain items. The average for the meat and alternatives group is therefore less vulnerable to the influence of outliers.
4.2 Meat & Alternatives
As noted above (figures 2 and 4), it can be seen that contrary to the expectations, the “meat & alternatives” group is not the largest contribution to total emissions for adults (or for any demographic category). However, meat and alternatives does contribute the most GHG per serving. What this means is that in actuality, meat products do contribute a lot to emissions however, when multiplied with the recommended number of servings, which is just 2 or 3, the total emissions value amounts to less than grains. Replacing meats with non-meat protein (currently calculated as 0.062 CO2e per serving, although it is mostly tofu) will have a big impact on emission reductions. These results are contrasting to other studies that have been done where meat is typically the highest contributor to emissions. This could be because there are several food items that skew the results. As mentioned previously, there are a lot of meat items listed but not a lot of grain items. So, meat averages out more than grain products do. There are also a lot more seafood items listed than animal meat items which brings the average down slightly. Looking at the model, items in the meat and alternatives category range from 0.01-2.26 kg CO2e. On the lower end of this range are the alternatives such as walnuts, pistachio, peanut butter, tofu, and certain fish such as mackerel, and industrial fish. On the higher end of this range exists meats such as lamb, beef, arctic char, etc. As mentioned in section 4.1, there are well over 60 items included in the model under meat and alternatives. With several alternatives with low carbon footprints, as well as the many seafood items included that have low carbon footprints, these food items pull down the average of the entire meat
14
section giving the overall group a lower value after being multiplied by the CFG recommendations for servings.
4.2.1 Animal Agriculture
Agriculture, through meat production, is one of the main contributors of GHGs, having a large impact on climate change. Most studies attribute 10-35% of all global GHG emissions to animal agriculture (Schwarzer, 2013). The largest share of GHG emissions from animal agriculture comes from methane (CH4) and nitrous oxide (N2O). They are not only emitted in large quantities, but contribute much more potently to radiative forcing (Schwarzer, 2013). The main sources of CH4 are the enteric fermentation of ruminants and releases from stored manure, which also emits N2O (Schwarzer, 2013). The application of manure as well as N fertilizers to agricultural land increases emissions of N2O. N2O as well as CO2 are released during the production of chemical N fertilizers. Some CO2 is also produced on farms from fossil fuels, energy usage and the exhalation of animals (Schwarzer, 2013). Further, deforestation and conversion of grassland into animal agricultural land releases considerable quantities of CO2 and N2O in the atmosphere as the soil decomposes carbon-rich humus.
Livestock are also responsible for almost two-thirds (64%) of anthropogenic ammonia emissions, which contribute significantly to acid rain and acidification of ecosystems (Schwarzer, 2013). It emerges as one of the top two or three most significant contributors of climate change as it involves deforestation, desertification, overuse of freshwater, inefficient use of energy and more (Schwarzer, 2013). Referring to the model, 1 food guide serving of chicken meat (broiler), large-scale, confinement equates to 0.34 kg CO2e and 1 food guide serving of chicken meat (broiler), large-scale, free-range, equates to 0.52 kg CO2e. This value is already much higher than most vegetables and fruits. Recently, meat supply has grown in most of the world’s regions as a result of population and consumption increasing. Meat supply varies enormously from region to region. The USA leads by far with over 322 g of meat per person per day (120 kg per year)
15
(Schwarzer, 2013). With increasing consumption and supply, more resources are being used to be able to support the exponentially growing production. Figure 5 below shows a comparison between population and meat supply.
Figure 5. Growth of population and meat supply, indexed 1961¼100 (FAO, 2012a; UN, 2012).
4.3 Milk and Alternatives
Milk and alternatives is the third largest contributor to total emissions in the adult diet, based on the results gathered. Similar to grain products, this list was comparatively short (17), and many of the items contributed by CleanMetrics did not have information. In total, there are only 10 items in the list that have data. So, there is a much small sample size for this category to derive results from. With the items for which there is information, the carbon footprint values are quite high itself ranging from 0.15 to 0.45 so, with more food items included in the list, the average could change significantly and probably increase. Dairy consumption has increased globally from 32% from 1990 to 2005 and is expected to rise an additional 50% from 2005 levels by 2050, according to the United Nations Food and Agriculture Organization (Gardiner, 2015). Dairy farms are a source of GHG emissions, mainly from the enteric fermentation (methane) and manure
16
management (methane and nitrous oxide) (OECD, n.d.). The absolute level of GHGs from dairy farms in CO2e terms is the highest in the U.S, France and Germany, reflecting both greater cow numbers and the relatively higher emission rates per cow (OECD, n.d.). The lowest emission value in the model under milk and alternatives is 0.15 which is already quite high compared to food items in other categories. It is imperative to understand that dairy farming also contributes heavily to emissions and should be taken into consideration when amending the Guide.
4.4 Vegetables and Fruits
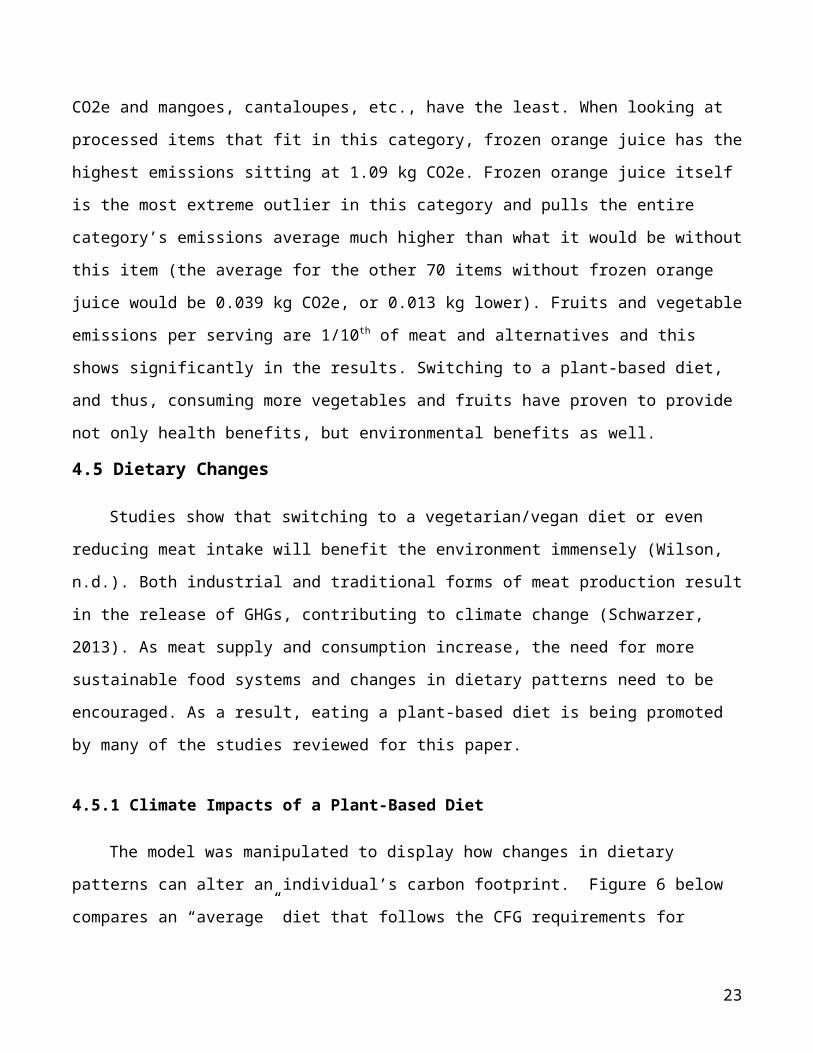
Vegetables and fruits have the least contribution to average emissions per serving (0.052 kg CO2e) and total emissions when compared with the other food groups. Looking at the model, it can be seen that the carbon footprints of vegetables and fruits range from 0.00-0.45 kg CO2e, with most lying in the 0-0.14 kg CO2e range. Out of all vegetables listed in the model, greenhouse lettuce has the highest production emissions of 0.45 kg CO2e and Chinese cabbage, loose-leaf lettuce and mushrooms have the least. Out of all fruits in the model, sweet cherries and figs have the highest emissions sitting at 0.14 kg CO2e and mangoes, cantaloupes, etc., have the least. When looking at processed items that fit in this category, frozen orange juice has the highest emissions sitting at 1.09 kg CO2e. Frozen orange juice itself is the most extreme outlier in this category and pulls the entire category’s emissions average much higher than what it would be without this item (the average for the other 70 items without frozen orange juice would be 0.039 kg CO2e, or 0.013 kg lower). Fruits and vegetable emissions per serving are 1/10th of meat and alternatives and this shows significantly in the results. Switching to a plant-based diet, and thus, consuming more vegetables and fruits have proven to provide not only health benefits, but environmental benefits as well. 4.5 Dietary Changes
Studies show that switching to a vegetarian/vegan diet or even reducing meat intake will benefit the environment immensely (Wilson, n.d.). Both industrial and
17
traditional forms of meat production result in the release of GHGs, contributing to climate change (Schwarzer, 2013). As meat supply and consumption increase, the need for more sustainable food systems and changes in dietary patterns need to be encouraged. As a result, eating a plant-based diet is being promoted by many of the studies reviewed for this paper.
4.5.1 Climate Impacts of a Plant-Based Diet
The model was manipulated to display how changes in dietary patterns can alter an individual’s carbon footprint. Figure 6 below compares an “average” diet that follows the CFG requirements for adults (aged 19-50) with six different scenarios for satisfying the meat and alternatives food group. These are: a diet that consumes only beef to meet their meat and alternatives target, a no-beef diet, a diet that receives protein from fish and alternatives, a diet that only consumes only 1 serving of meat daily, a diet that replaces meat entirely with vegetarian protein, and a vegan diet.
CFG Requirementss
CO2e Only
Beef
CO2e No Beef
CO2e Fish Protein
CO2e 1 meat
CO2e VegProt-Lacto
CO2e Vegan0.000
1.000
2.000
3.000
4.000
5.000
6.000
7.000
8.000
Comparison of Various Diets
MalesFemales
Diets
Carb
on F
ootp
rint (
CO2e
)
Figure 6. The carbon footprints of various diets (calculated for adults, aged 19-50).
18
Looking at figure 6, it is quite evident that different types of diets correspond with different levels of carbon footprints, directly showing that our diets have a large impact on the environment. The total daily carbon footprint for an individual following the CFG requirements with an average of all food items in each of the categories in the model, is 4.276 kg CO2e and 3.380 kg CO2e for males and females respectively.
The next diet calculated is of an individual who follows the CFG recommended daily serving requirements but only consumes beef meat to reach their meat and alternative target. As can be seen in figure 6, this diet has a drastically higher daily carbon footprint than any of the other diets. For males and females, the respective daily carbon footprints are 7.380 kg CO2e and 5.450 kg CO2e. This is 1.72 times higher than the average CFG diet for males and 1.6 times higher for females. This is because beef production contributes heavily to emissions. Beef is the second most popular animal category in the mean US diet, accounting for 7% of all consumed calories (Eshel et al., 2014). Beef production requires 28 times more land, 11 times more irrigation water, five times more GHGs and six times more reactive nitrogen than the average of other livestock categories (Eshel et al., 2014). The study states that it is clear that beef is by far the least environmentally efficient animal category. Beef production requires approximately 88% of all US land allocated to producing animal-based calories (Eshel et al., 2014). According to the data in the model from CleanMetrics, one serving of beef (75g) results in emissions of 1.5 kg CO2e. The 1.5 kg CO2e from a single serving of beef alone is three times the entire meat and alternatives average of 0.465 kg CO2e. The next diet graphed in figure 6, the no-beef diet, reduces emissions slightly from the average CFG diet that consumes beef along with other meats and seafood. This amounts to 4.181 kg CO2e for males and 3.317 kg CO2e for females. Canada produces approximately 2% of the world’s beef and is the 5th-largest global exporter of beef in the world, producing 1.41 million tonnes in 2014 (Legesse et al., 2015). Beef production contributes an estimated CA$33 billion annually in the sales of goods and services either directly or indirectly to the
19
Canadian economy (Legesse et al., 2015). Traditionally, economic returns have been the primary driver of decision processes in the beef industry, but, recently, the environmental footprint of beef production is under increasing scrutiny from industry groups, consumers, retailers, and non-governmental organizations (Legesse et al., 2015). This increased pressure from societal groups may in fact push Canadians to shift towards more sustainable diets. Reducing beef intake is vital to preserving our environment and natural resources.
The next diet demonstrated assumes an individual following the CFG recommended daily servings requirements but only getting their protein only from seafood and meat alternatives to satisfy the meat and alternative targets. Looking at figure 6, the carbon footprint of this diet has decreases a bit more. For males, this results to 4.078 kg CO2e and for females, 3.248 kg CO2e. The emissions from individual servings of seafood range from 0.05 kg CO2e to 1.67 kg CO2e and are relatively evenly distributed unlike meats which are more on the higher end. Individuals considering reducing animal meat intake may consider fish as a replacement. A study shows that lamb, beef, and veal have a significantly higher impact on climate change compared to certain fish due to their methane emissions (ESU-Services, n.d.). Figure 7 below shows a comparison of fish and meat.
20
Figure 7. Comparison of fish and meat (ESU-Services, n.d.).
Looking at the results of the study, certain types of fish are on the lower end of releasing emissions than certain animal meats. Looking at the data in the model, Arctic char has a carbon footprint of 1.67 kg CO2e per serving (75g) whereas farmed Atlantic cod has a footprint of 0.26 kg CO2e per serving (75g). The carbon footprints of fish in the model are widespread demonstrating that fish cannot be regarded generally as a more environmentally food item than meat, because the environmental impacts of different fish products vary (ESU-Services, n.d.). The environmental impacts of food consumption can be reduced considerably by decreasing meat intake all together or by replacing both fish and meat dishes with vegetarian or vegan alternatives.
Disregarding the CFG requirement of 2-3 servings of meat per day and reducing meat intake to just 1 serving per day decreases one’s carbon footprint even more. In doing so, the carbon footprint for males and females is now 3.664 kg CO2e and 3.064 kg CO2e respectively. This is 1.2 times less than the average requirement for males and 1.1 times less for females.
As per the results of this project and other studies reviewed for this project, a vegetarian or vegan diet is the best option to reduce one’s carbon footprint and contribute to environmental protection. Looking at figure 6, these two diets have the lowest carbon footprints compared to any other diets. A vegetarian diet replaces animal protein with vegetable protein but still includes dairy and eggs. While there are more items that can provide vegetarian protein, only a few are noted in this project due to a lack of information available. Following a vegetarian-protein diet, a male’s daily carbon footprint amounts to 3.067 kg CO2e and for females, 2.574 kg CO2e. This is 1.4 times less than following the average CFG diet for males and 1.3 times less for females. When following a vegan diet, the carbon footprint for males amounts to 2.853 kg CO2e and for females, 2.361 kg CO2e, 1.5 times less for males and 1.43 times less for females.
21
These scenarios show that simply reducing meat intake already decreases the carbon footprint significantly and thus, changes to the food guide should advise Canadians to reduce meat consumption and instead practice eating more plant-based diets. More education is required to teach citizens alternative options to obtain protein and nutrients from foods that are not meat or animal products (egg or milk). If the new food guide were to include sections advising Canadians on this, it has the potential to spark interest. If all Canadians reduced their meat intake, supply would decrease and consequently, so could emissions. These dietary changes not only benefit the environment, but also benefit health – which is the main focus Health Canada has with currently amending the food guide. 4.5.2 Health Benefits of a Plant-Based Diet
Research shows that plant-based diets are cost-effective, low-risk interventions that may lower body mass index, blood pressure, and cholesterol levels (Tuso et al., 2013). They may also reduce the number of medications needed to treat chronic diseases and lower ischemic heart disease mortality rates. A healthy, plant-based diet aims to maximize consumption of nutrient-dense plant foods while minimizing processed foods, oils, and animal foods (including dairy products and eggs) (Tuso et al., 2013). It encourages lots of vegetables (cooked or raw), fruits, beans, peas, lentils, soybeans, seeds, and nuts (in smaller amounts) and is generally low fat. Physicians should consider recommending plant-based diets to all their patients, especially those with high blood pressure, diabetes, cardiovascular disease, or obesity (Tuso, et al., 2013). In a 2006 study, after reviewing data from 87 published studies, it was reported in Nutrition Reviews that a vegan or vegetarian diet is highly effective for weight loss (Berkow & Barnard, 2006, as cited by Tuso et al., 2013). It was also found that vegetarian populations have lower rates of heart disease, high blood pressure, diabetes, and obesity. The authors further stated that a vegan diet caused more calories to be burned after meals, in contrast to non-vegan diets which may cause fewer calories to be burned because food is being stored as fat (Berkow & Barnard, 2006, as cited by Tuso et al 2013). Farmer et al suggests that vegetarian diets may be better for weight
22
management and may be more nutritious than diets that include meat (Farmer et al., 2011, as cited by Tuso et al., 2013). In this study, vegetarians were slimmer than their meat-eating counterparts. Vegetarians were also found to consume more magnesium, potassium, iron, thiamin, riboflavin, folate, and vitamins and less total fat. The authors conclude that vegetarian diets are nutrient dense and can be recommended for weight management without compromising diet quality (Farmer et al., 2011, as cited by Tuso et al., 2013). The Adventist Health Studies found that vegetarians have approximately half the risk of developing diabetes as non-vegetarians. It was reported that non-vegetarians were 74% more likely to develop diabetes over a 17-year period than vegetarians (Tuso et al., 2013). In 2009, a study involving more than 60,000 men and women found that the prevalence of diabetes in individuals on a vegan diet was 2.9%, compared with 7.6% in the non-vegetarians (Tonstad et al., 2009, as cited by Tuso et al., 2013). In 2010, the Dietary Guidelines Advisory Committee performed a literature review to identify articles examining the effect of dietary patterns on blood pressure in adults. Vegetarian diets were associated with lower systolic blood pressure and lower diastolic blood pressure (Tuso et al., 2013). A general worry for those seeking to switch to vegetarian or vegan diets is the lack of protein. However, generally, those on a plant-based diet are not at risk for protein deficiency (Tuso et al., 2013). Proteins are made up of amino acids, some of which, called essential amino acids, cannot be synthesized by the body and must be obtained from food. Essential amino acids are found in meat, dairy products, and eggs, as well as many plant-based foods, such as quinoa (Tuso et al., 2013). Essential amino acids can also be obtained by eating certain combinations of plant-based foods. For example, one could have brown rice with beans, and hummus with whole wheat pita. A well-balanced, plant-based diet will provide adequate amounts of essential amino acids and prevent protein deficiency (Tuso et al., 2013). As the goal of the CFG revision process is to improve the eating habits of Canadians and reduce risks of obesity and other health issues, it only makes sense that plant-based diets are heavily promoted within the Guide itself.
23
4.6 Assumptions and Limitations
4.6.1 CleanMetrics
CleanMetrics is an organization whose purpose is “to solve challenging technical problems in environmental performance and sustainability through software products and services based on rigorous, quantitative methods – including modelling, simulation, analysis and optimization technologies” (CleanMetrics, n.d.). CleanMetrics offers a full range of software and services to help the food and beverage industry become more efficient, sustainable, and profitable (CleanMetrics, n.d.). CleanMetrics created this free calculator out of the need for simplified food emissions data that the public can access for free. Users can understand the effect of a few variables in the food system that they control. The underlying data used in the calculator (known as life-cycle inventory data) come from their database, CarbonScopeData, and life-cycle assessment results are generated using their FoodCarbonScope software. Over 95% of the agricultural data included in the calculator is for North-American production. CarbonScopeData provides data on greenhouse gas emission (embodied carbon), primary energy use (embodied energy) and water use (embodied/virtual water) for a broad array of raw materials used in the economy, common industrial processes, agricultural processes and food products, energy sources, transport modes, temperature-controlled storage, and waste disposal (CleanMetrics, n.d.). The database contains LCI data for over 1600 materials, products and processes representing a broad range of industries and geographical locations compiled from highly credible raw data sources and research literature and processes by their in-house tools according to rigorous LCA standards. The methodology used to build the database is consistent with international standards (the ISO 14040, PAS 2050, GHG Protocol). FoodCarbonScope is a web-based LCA software tool for the modeling and analysis of life-cycle greenhouse gas emissions, energy use and water use in food and beverage products. CleanMetrics has looked at several sources such as the USDA, About Seafood, etc., to come up with roughly 31 food commodities that are commonly used in the U.S. For each of these, a typical North American production
24
system or an average of several North American production systems (in one or more agricultural regions) was used to calculate the production emissions (CleanMetrics, n.d.). Emissions data and results are consistent with current international standards – ISO 14040 series, PAS 2050 – or life cycle assessment and product carbon footprint analysis. Baseline emissions form agriculture, livestock and waste disposal are calculated using the IPCC Guidelines for National GHG inventories (CleanMetrics, n.d.).
CleanMetrics was the best calculator available to carry out this project however, there are still assumptions regarding the calculator’s validity and accuracy. The gathered results have the potential to be slightly off because the weights had to be rounded before being inputted into the calculator. Further, the food calculator assumes a U.S. context, while U.S. agricultural practices are not necessarily identical to Canadian ones. As a result, this research will not account for differences in types of machinery/equipment used during the production of the food items. Production emission results are based on the data provided by CleanMetrics. Food miles and wastage were not considered in this project, not only because this would have increased the complexity, but also because it seems the CleanMetrics team may de-value the importance of transportation in the overall footprint. A blog post titled “Do food miles matter?” on the CleanMetrics site (Venkat, 2009) asks if there is any value to emphasizing locally produced food? It answers that there may well be benefits such as taste, freshness and lower risk of disruption/contamination, etc., however, a lower carbon footprint is generally not one of the automatic benefits (Venkat, 2009). The author states that storage, and consumer practices such as refrigeration, cooking, and even driving to grocery stores far outweigh “food miles” (Venkat, 2009).
Another shortcoming is that this calculator takes an individualized, ingredient-based approach to GHG calculation and does not accurately reflect the composite, or processed food intake that is seen in most real-diets, a similar issue that arises in calorie-counting dieting calculators. One does not usually eat certain products
25
alone but rather mixed together with other items in a dish. Energy-dense, high-calorie oils and beverages are completely absent from the calculations. For example, the food guide tells us to eat bread however, we are putting things on the bread such as jam along with its calories and emissions but the food calculator by CleanMetrics along with other ones do not take this into account. Composite foods are under-calculated and so it makes it difficult to determine the true carbon footprint of our food choices. A calculator that can enshrine this along with details on individual food items would be a good calculator to use to understand the implications of our dietary choices. Nonetheless, even based on the numbers gathered in this project, it is clear that one can still model out and understand to a certain level the impact of different diets.
According to Kim and Neff (2009), carbon calculators in general have several weaknesses. Most calculators in the study suggest a general lack of consideration of diet-related emissions among carbon calculators and similar tools, under-representing the significance of diet in contributing to indirect GHG emissions (Kim & Neff, 2009). This is consistent with the relatively low coverage of food and agriculture in newspaper articles on climate change in the U.S. and perpetuate the misconception that the primary GHG emissions of concern are those resulting from household energy and vehicle use (Kim & Neff, 2009). Of the few calculators which encompassed this, most of them aggregated food consumption into broad dietary lifestyle categories. While this creates a simpler user-experience, like the one from CleanMetrics, it fails to capture key distinctions such as substantial differences in lifecycle emissions between poultry and beef (Kim & Neff, 2009). These challenges result from the repeated use of the same few available sources as well as using European data as proxies in LCAs. Despite its limitations, carbon calculators still provide an important public service in educating individuals and guiding them towards sustainable behaviours (Kim & Neff, 2009). This calculator could better educate users by adopting a broader scope that encompasses dietary behaviours. More rigorous methodologies are required to attain more specific measurements. It highlights the importance for additional U.S.-based research and LCA work, a
26
thorough verification of existing studies and greater transparency into the food industry (Kim & Neff, 2009).
4.6.2 Data Collection/Organization
A limitation is the accuracy and credibility of the information regarding the weight in grams of the food items. For the most part, one website3, was used more prevalently in order to be consistent. However, this was not possible for all food items. The use of different websites can result in inconsistencies in the weights thereby, altering the carbon footprint of the food items. Further, there are certain food items for which there is limited-to-no information available. For several food items, it had to be inferred what the serving size is as it was not provided on the Canadian government website. For example, there is no information provided on the serving size of palm fruit, so it had to be assumed that it was in the same range as most of the other fruits - 1 medium - which was used as a proxy. If this is incorrect, the results could be off. Some items are left blank in the model such as parsley and garlic because it was completely unsure what serving size to use as a proxy for them. Even if information was available on a food item’s serving size, sometimes there was no information available on its weight in grams such as rape seeds. There are also variations of certain food items that information was not available on. For example, there was information on what the weight in grams is of cabbage for ½ cup but not for Chinese cabbage. Since particular items did not show up, it is being assumed that the weights are similar.
What is more problematic, as mentioned earlier, are the higher-calorie, energy-dense items found in many meals and daily use items such as oils and beverages, as well as the absence of many processed food items, missing from the calculator. If this information could be made more available, the capacity and credibility of the model will increase as well. The Government of Canada should include more food items on their web page – such as the ones with lack of information in the model – to better educate Canadians on all types of foods. With 3 http://www.cookitsimply.com/
27
the guide currently being amended, this lack of information availability can be troublesome to Canadians who are looking to find nutritional and environmental details about certain food items. This model can be a hub for users to find a specific food item and understand what its associated carbon footprint is. Thus, more research should be conducted on the items that have missing information to understand the nutritional facts, weights, and carbon footprints of the items that are left blank in the model.
4.6.3 Time
Another limitation to this project was the amount of time available, as this project was conducted from May-July. Because of the short time frame, the scope was limited and only a simple model could be created. With more time, the project’s scope could have encapsulated more problems within the area of food sustainability and animal agriculture. This project can be enlarged such that one can collect primary data on their own to create a model that works with their own algorithm. Due to the lack of time, and relying on secondary data, the carbon footprint portion of the model could not be automated. A next step would be to automate this so that if an individual changes the serving size or weight, the carbon footprint will adjust accordingly. Currently, the carbon footprint is set at whichever serving size and weight is provided. Further steps can also include a comparison of Canada’s food guide footprint with that of another nation that refers to sustainability in their food guide and see how they compare.
5.0 ConclusionIt can be seen from the results that emissions from food production, animal
agriculture in particular, contributes greatly to climate change. The carbon footprint of meat & alternatives, while less than grain products in terms of contribution to total emissions, was higher when looked at average emissions per serving. As demonstrated by the various modelling different diets, reducing meat intake or even adopting a vegetarian or vegan diet reduces emissions
28
dramatically. Choosing vegetarian protein alternatives that provide the same nutrients as meat such as tofu, nuts, quinoa, hummus, etc., have lower production emissions and pose health benefits as well. Producing meat requires the use a lot of natural resources and energy. In order to mitigate the impacts of extremely high food emissions, it is vital that we, as a society, understand the implications of our food choices. This can be done by promoting both healthy and sustainable eating habits through our national food guide as it will reach millions of Canadians. Thus, it is important that Health Canada understand this pressing issue and consider incorporating sustainability in the food guide during the revision process.
29
6.0 Works Cited
Agriculture and Agri-Food Canada (AAFC). (2016). Greenhouse Gases. Retrieved 2 April 2017, from http://www.agr.gc.ca/eng/science-and-innovation/agricultural-practices/agriculture-and-climate/greenhouse-gases/?id=1329321969842
Aleksandrowicz, L., Green, R., Joy, E., Smith, P., & Haines, A. (2016). The Impacts of Dietary Change on Greenhouse Gas Emissions, Land Use, Water Use, and Health: A Systematic Review. PLOS ONE, 11(11), e0165797. http://dx.doi.org/10.1371/journal.pone.0165797
Carnegie Mellon University. (2017). Economic Input-Output Life Cycle Assessment. Retrieved 10 August 2017, from http://www.eiolca.net/
CleanMetrics. CleanMetrics. Retrieved 11 July 2017, from http://www.cleanmetrics.com/html/company.htm
David Suzuki Foundation. (n.d.). Food and Climate Change. Retrieved 2 April 2017, from http://www.davidsuzuki.org/what-you-can-do/food-and-our-planet/food-and-climate-change/
Eshel, G., Shepon, A., Makov, T., & Milo, R. (2014). Land, irrigation water, greenhouse gas, and reactive nitrogen burdens of meat, eggs, and dairy production in the United States. Proceedings Of The National Academy Of Sciences Of The United States Of America (PNAS), 111(33).
ESU-Services. (n.d.). Fish or Meat? Is this a relevant question from an environmental point of view? Schaffhausen, Switzerland.
Gardiner, B. (2015). How Growth in Dairy Is Affecting the Environment. The New York Times. Retrieved 12 August 2017, from https://www.nytimes.com/2015/05/04/business/energy-environment/how-growth-in-dairy-is-affecting-the-environment.html
Health Canada. (2017). Revision process for Canada's food guide. Retrieved 10 August 2017, from https://www.canada.ca/en/health-canada/services/canada-food-guides/revision-process.html
Kim, B., & Neff, R. (2009). Measurement and communication of greenhouse gas emissions from U.S. food consumption via carbon calculators. Ecological Economics, 69(1), 186-196. http://dx.doi.org/10.1016/j.ecolecon.2009.08.017Legesse, G., Beauchemin, K., Ominski, K., McGeough, E., Kroebel, R., & MacDonald, D. et al. (2015). Greenhouse gas emissions of Canadian beef production in 1981 as
30
compared with 2011. Animal Production Science, 56(3), 153. http://dx.doi.org/10.1071/an15386
Mortillaro, N. (2016). Canada’s Food Guide: What the government is changing to help Canadians eat better. Global News. Retrieved 2 April 2017, from http://globalnews.ca/news/3021864/canadas-food-guide-what-the-government-is-changing-to-help-canadians-eat-better/
OECD. (n.d.). Agriculture, Trade and the Environment: The Dairy Sector. Retrieved from https://www.oecd.org/tad/sustainable-agriculture/33798326.pdf
Reynolds, J. (n.d.). Canada needs healthy and sustainable dietary guidelines. Food Secure Canada. Retrieved 2 April 2017, from https://foodsecurecanada.org/resources-news/news-media/canada-needs-healthy-and-sustainable-dietary-guidelines
Scarborough, P., Appleby, P., Mizdrak, A., Briggs, A., Travis, R., Bradbury, K., & Key, T. (2014). Dietary greenhouse gas emissions of meat-eaters, fish-eaters, vegetarians and vegans in the UK. Climatic Change, 125(2), 179-192. http://dx.doi.org/10.1007/s10584-014-1169-1
Schwarzer, S. (2013). Growing greenhouse gas emissions due to meat production. Environmental Development, 5, 156-163. http://dx.doi.org/10.1016/j.envdev.2012.11.002
Statistics Canada. (2016). The rise of the dual-earner family with children. Retrieved 2 April 2017, from http://www.statcan.gc.ca/pub/11-630-x/11-630-x2016005-eng.htm
Tuso, P., Ismail, M., Ha, B., & Bartolotto, C. (2013). Nutritional Update for Physicians: Plant-Based Diets. The Permanente Journal, 17(2), 61-66. http://dx.doi.org/10.7812/tpp/12-085
Wilson, L. (n.d.). The carbon foodprint of 5 diets compared. Shrink that Footprint. Retrieved 2 April 2017, from http://shrinkthatfootprint.com/food-carbon-footprint-diet#djUaqipGHk3Js3ds.99