Page 1
1
ANTECEDENTS OF JOB EMBEDDEDNESS
by
Cezar Giosan
October, 2003
Submitted to the Graduate Faculty of Political and Social Science of the New School
University in partial fulfillment of the requirements for the degree of Doctor of
Philosophy.
Dissertation committee:
Dr. Nathan Kogan
Dr. Mary Watson
Dr. Nicholas Humphrey
Page 2
2
INTRODUCTION
Voluntary turnover seems a straightforward concept. It is when people voluntarily decide
to leave an organization. The most obvious dimension of voluntary turnover is
voluntariness and in this respect the concept is dichotomous (i.e. either voluntary or
involuntary). However, such an approach may be simplistic, in that there are instances of
quitting a job which have both voluntary and involuntary aspects. For instance, quitting
due to relocation of a spouse, or due to pregnancy, seem to have both of these aspects.
Because of such difficulties, some authors argued that turnover voluntariness should be
measured on a continuum, rather than on a dichotomous scale (Maertz & Campion,
1998).
The difficulties of defining voluntary turnover do not end with whether or not the
concept is dichotomous. There are also deficiencies in the number and scope of turnover
reasons recorded in personnel files and exit surveys. In certain cases, former employees
and their supervisors may report multiple reasons for leaving and the agreement on all
reasons among these two sources has been reported to be quite low (25%) even though
the agreement on at least one factor was higher (68%) (Campion, 1991).
Other problems in defining voluntary turnover may stem from whom you ask
about its occurrence: employees or employer. In general it makes more sense to analyze
employee perception, but even in such a case different individuals may hold variant ideas
about what constitutes a free-choice decision, so that we expect some variance in their
reports and some lack of agreement (Maertz & Campion, 1998).
To minimize the issues emerging from the difficulties with defining voluntary
versus involuntary turnover, one should make explicit the criteria that differentiate the
Page 3
3
two. Toward this end, I adopt Maertz and Campion’s (1998) definition, in which
voluntary turnover represents “instances wherein management agrees that the employee
had the physical opportunity to continue employment with the company, at the time of
termination”. In other words, voluntariness means that there was no barrier or
impediment (physical, like disability or pregnancy, or from management, like notice of
involuntary termination) for that person to have continued employment with that
particular organization (Maertz & Campion, 1998). Voluntary reasons include, for
instance, non-mandatory retirement, quitting for family relocation, quitting for a more
secure job, quitting for a better salary, or leaving for a bigger organization.
CONSEQUENCES OF TURNOVER
Why is a discussion about turnover important? Probably the most obvious reason is the
fact that turnover directly impacts the bottom line of any organization. The average
employee turnover rate for US businesses in 1999 was 14.4%, the highest level in almost
two decades. Voluntary turnover in the US has diminished in more recent years mostly
because of a shrinking economy, which reduced the number of alternatives and ease of
movement. Employee turnover is estimated to cost about $11 billion a year, emerging as
one of the most significant factors that impacts the bottom line. The “find them, lose
them, replace them” syndrome is particularly important for businesses because the most
talented and experienced people are those who are disproportionately most likely to leave
(Abbasi & Hollman, 2000). Employee turnover costs are sometimes hard to estimate
because usually turnover hits in more than one budget, and also because the indirect
expenses such as training time for the newcomers, are difficult to quantify. It is
Page 4
4
estimated, for instance, that the direct and indirect costs of replacing a senior Information
Technician Engineer who leaves within six months from joining a company can reach as
much as $100,000 (Brown, 2000). A middle-level manager replacement cost can reach
1.5 times the person’s annual salary and benefits (Gooley, 2001). Administrative costs
usually increase with increased turnover (Mirvis & Lawler, 1977) because of the
expenses associated with new direct hirings or with using staffing agencies.
Employee turnover has significant impact on organizational performance.
Marshall (2001) showed a strong correlation between employee retention and quality of
service rated by the customer, and other studies showed negative correlations between
organizational effectiveness and employee turnover. A study at Sears, for example,
showed that as voluntary turnover decreased, financial performance increased (Ulrich,
Halbrook, Meder, Stuchlik, & Thorpe (1991).
In short, the most direct consequences of turnover are the added staffing and
training costs, associated with personnel loss and sometimes decline in organizational
efficiency. Other consequences may be less tangible, yet very important, such as low
morale among the ones who stay, which may negatively affect job performance and
overall work satisfaction.
Of course, turnover does not have only negative consequences. In fact, some feel
that negative effects have been overemphasized (Dalton, Todor & Krackhardt, 1982).
Society can actually benefit from voluntary turnover because it generally permits job
movement. Voluntary turnover can improve person-job match. For instance, society
benefits from voluntary turnover when it occurs in the primary labor market, allowing
entrance to those in secondary labor markets (Muchinsky & Morrow, 1980). Other
instances of cases in which voluntary turnover can be actually beneficial are those where
a highly paid, long-tenured employee is replaced by a new hire. In such a case, an
Page 5
5
organization saves in salary costs (Campion, 1991). In other instances, an organization
can save if a poor performer quits, or through the creativity and freshness created by
bringing in “new blood” (Campion, 1991; Dalton, et al., 1982; Muchinsky & Morrow,
1980).
Research on what instances of turnover are beneficial to an organization is still
underdeveloped. The most comprehensive approach is that of Boudreau and Berger
(1985), whose organizational utility perspective considered the quantity of movers, the
quality of movers, and the costs to produce movement. Expanding the traditional utility
equations, they included not only the replacement employee, but also multiple hiring
cohorts, continuous retentions and repeated acquisitions. These equations use average
service values and costs to estimate utility under various rates, distributions and
conditions of turnover. Essentially, the authors conclude that employee turnover may
bring benefits to the organization when selection, training, and other replacement costs
are low.
In short, turnover can have both positive and negative consequences and whether
it impacts negatively or positively in an organization depends on its specific
circumstances and moment in time. The major question seems to be which employees
would organizations most want to prevent from quitting. The answer will most likely
come from studying turnover utility at the individual level, which would take into
account an individual’s performance, potential, compensation, et cetera, along with the
same variables for the replacement employee. Maertz and Campion (1998) point out that
after this question has been answered, two others equally important for management
emerge: Which types of voluntary turnover can be prevented by an organization? What
are the best methods to accomplish? One of the aims of the present study is to attempt an
answer to this latter question.
Page 6
6
Since turnover can have such a major effect on the bottom line, it is not
surprising that researchers have concentrated much effort on elucidating its causes and
determinants. I shall briefly present below a review of the major turnover models and
developments.
REVIEW OF VOLUNTARY TURNOVER MODELS AND DEVELOPMENTS
Most early turnover models can be linked to March and Simon’s (1958) concepts of
desirability of movement and perceived ease of movement, which are typically
operationalized as work attitudes and perceived alternative opportunities, respectively.
March and Simon (1958) describe perceived desirability of movement as being primarily
determined by job satisfaction, which is what it has evolved to mean in the turnover
research (Jackofsky & Peters, 1983; Lee, Mitchell, Wise, & Fireman, 1996).
March and Simon (1958) characterized job satisfaction as a multifaceted function
of several diverse factors, such as monetary rewards, type of supervision, and
participation in job assignment decisions. In the vast subsequent turnover research, job
satisfaction has been "understood to be one's affective attachment to the job viewed either
in its entirety (global satisfaction) or with regard to particular aspects (facet satisfaction;
e.g., supervision)" (Tett & Meyer, 1993: 261).
Job satisfaction plays a major role in virtually all turnover theories (Lee &
Maurer, 1999) and operates as the key psychological predictor in most turnover studies
(Dickter, Roznowski, & Harrison, 1996).
Numerous reviews have concluded that job satisfaction is negatively related to
voluntary turnover (e.g., Cotton & Tuttle, 1986; Mobley, Griffeth, Hand, & Meglino,
1979; Price, 1977; Tett & Meyer, 1993). Cotton and Tuttle's (1986) meta-analysis
Page 7
7
demonstrated that this relationship held for overall satisfaction as well as for specific job
satisfaction facets, and Tett and Meyer's (1993) meta-analysis indicated that overall job
satisfaction's prediction of voluntary turnover was equally strong for global and sum-of-
facet measures. Job satisfaction's correlation with turnover has been reported in meta-
analytic findings as -.24 (Tett & Meyer, 1993), -.28 (Steel & Ovalle, 1984), -.18 (Hom,
Caranikas-Walker, Prussia, & Griffeth., 1992), and -.19 (Griffeth, Hom & Gaertner,
2000).
In addition to job satisfaction, as March and Simon (1958) pointed out, there are
other predictor variables which have been tested in relationship with turnover. A glimpse
at the major turnover models developed in the literature (Mobley, 1977; Steers &
Mowday, 1981; Price & Mueller, 1981; Hom & Griffeth, 1995) reveals the inclusion of
two major categories of predictor variables: job or work attitudes (mainly understood in
terms of job satisfaction and organizational commitment) and ease of movement
(understood in terms of perceived alternatives and job search behaviors) (See Figure 1). I
briefly talked about job satisfaction, presenting how it correlates with turnover.
Organizational commitment, the second major predictor in the job or work attitudes
category has also been shown to negatively correlate with turnover (e.g., Jaros, 1997).
The psychological processes through which job dissatisfaction prompts voluntary
turnover have been researched at length in cognitively oriented models, with thoughts of
quitting, search intentions, and quit intentions emerging as common mediators (e.g.,
Bannister & Griffeth, 1986; Dalessio, Silverman, & Schuck, 1986; Hom et al., 1992;
Hom, Griffeth, & Sellaro, 1984; Hulin, Roznowski, & Hachiya., 1985; Mobley et al.,
1979). I will talk more about this in the following pages.
Page 8
8
FIGURE 1: Traditional Turnover Models
Desirability and ease of movement were thought to account for much variance in
turnover and, traditionally, leaving was explained as a decisional process following the
route of job dissatisfaction / alternatives search and comparison / decision to leave or to
stay (Mobley, 1977). These two factors - job alternatives and job satisfaction - combine
and predict the intent to leave, which is a precursor of actual leaving.
Apart from these two important factors that explain variance in turnover, studies
have documented other antecedent turnover precursors, which equate to distinct types of
psychological forces that are thought to motivate quitting. They can be summarized as in
Figure 2. I shall briefly discuss each of these factors.
Job Attitudes (Job satisfaction and
Organizational Commitment)
Ease of Movement (Perceived
alternatives and job search behaviors)
TURNOVER INTENT
TO
LEAVE
Page 9
9
FIGURE 2: Major antecedent forces affecting voluntary turnover intentions and decisions (Maertz &
Campion, 1998).
Of all factors that influence voluntary turnover decisions, intention to quit has
demonstrated the highest, most consistent bivariate relationship with turnover (r = 0.50)
(Steel & Ovalle, 1984). Other studies reported meta-analytic correlations between
multiple item measures of turnover intention and turnover of r = 0.65 (Tett & Meyer,
1993). Withdrawal cognitions are not only intentions to quit. They can also be thinking of
searching, thinking of quitting, and intention to search. These factors have yielded
positive correlations with turnover behaviors (rs = 0.30 – 0.50) (Hom et al., 1992). All
these factors have been recently thought of as parts of a general withdrawal cognition
‘syndrome’ (Hom & Griffeth, 1991) as illustrated in Figure 2. In short, turnover intention
is one of the best predictors and the proposed immediate precursor of quitting (Steel &
Ovalle, 1984).
Current work affect
(satisfaction)
Perception of job
alternatives
Future expected
utility of turnover
Constituent
attachments
Psychological
contract obligations
Moral attachment
Normative non-
work pressures
Withdrawal intentions /
cognitions.
(Intentions to quit, thoughts of
searching, thoughts of quitting,
intention to search)
Voluntary
turnover
Page 10
10
Let me briefly present how the concept of the general withdrawal syndrome has
developed historically. Fishbein and Azjen (1975) stated that general attitudes should
relate strongly to a class of behavioral responses, not to specific behaviors. Hulin (1991,
in press) proposed that empirical research on work attitudes should relate to a pattern or
syndrome of withdrawal, rather than to quitting or absenteeism behaviors alone. Aside
from absenteeism and quitting alone, this syndrome would include psychological
withdrawal such as daydreaming, shirking, behaviors to change job outcomes such as
stealing, moonlighting on the job, behaviors to change the work role itself such as
unionization, transfer attempts, retaliatory measures such as sabotage, violence, or other
cognitive adjustments. According to Rosse and Hulin, (1985), these behaviors stem from
relative dissatisfaction and fulfill the same basic purpose: adapting to a dissatisfying work
situation. The future use of these behaviors depends on their success in improving
relative satisfaction (Rosse & Hulin, 1985), and the initial choice of these behaviors
depends on a number of perceived opportunity constraints and personal factors (Rosse &
Miller, 1984).
The validity of the general withdrawal construct has been supported by several
studies, and refuted by others. Primarily there is the indirect evidence in the form of
significant shared variance among withdrawal behaviors (e.g., Mitra, Jenkins & Gupta,
1992). On the other pole, Steers and Mowday (1981), and Price and Mueller (1981) have
argued that alternative withdrawal behaviors are separate and distinct behaviors from
voluntary turnover and therefore should be studied separately.
Figure 2 reveals that the anticipation of satisfaction is a relevant determinant of
turnover, distinct from current affective responses based on past experiences (Forrest,
Cummings, & Johnson, 1977). Future prospects on the current job and those on an
alternative job help determine turnover intentions (Mobley et al., 1979). In other words,
Page 11
11
people will calculate the investment losses in their current membership and expected
future gains from an alternative and make the corresponding decision.
Of course, people are subjected not only to ‘internal’ influences; they are also
under normative pressures. People live in a social environment and they are subject to
social and normative pressures from their peers, friends, or family members. Prestholdt,
Lane, and Matthews (1987) found that by using normative measures, a higher portion of
variance in resignation than with attitude measures alone was explained. Normative
beliefs are perceived expectations of non-work referents regarding the employee’s
turnover behavior. They are psychological pressures to quit or stay, caused by significant
others, friends, assuming that the individual wants to meet their expectations.
While normative forces depend on beliefs about how others feel and would react
to one’s quitting, moral attachment, another factor thought to influence the decisions to
stay or leave, is an internalized individual value and as such it may be more stable across
situations. Moral commitment or attachment is a value of loyalty or general duty,
causing one to persist at an organization. Moral commitment has shown to be negatively
linked with turnover (Jaros, Jermier, Koehler & Sincich, 1993). Of course, in today’s
turbulent job markets, this may be increasingly rare, and perhaps it can be thought of as a
continuum, with the opposite end being the internalized value that changing jobs is a
virtue (Maertz & Campion, 1998).
The psychological antecedents briefly summarized above can each be linked to
behavioral intention to quit through the established models of individual behavior (i.e.
Fishbein & Azjen, 1975; Triandis, 1975). In the literature, however, there are other forces
relevant to turnover decisions, which have not been incorporated in multivariate turnover
models. They are psychological contracts and constituent attachments, the last two
factors illustrated in Figure 2.
Page 12
12
Psychological contracts are related to equity perceptions. Rousseau (1989) defines
psychological contracts as a set of individual beliefs about reciprocal obligations in an
employment relationship, not involving a third party observer. Robinson, Kraatz &
Rousseau (1994) argue that there are two major types of perceived reciprocal obligations
between employer and employee: 1) formalized, like salary, merit pay in exchange for
giving notice, accepting transfers or keeping company secrets and 2) less tangible, like
job security, training, in exchange for loyalty, overtime, or extra-role behaviors. Failures
to meet the employee’s expectation under the contract can constitute a violation of the
psychological contract, which, in turn, may lead to a decrease of the amount the
employee feels s/he owes to the organization. This, in turn, may induce an employee to
quit immediately or more readily in the future (Maertz & Campion, 1998). Psychological
contracts have not yet been incorporated in turnover models, and further research should
address this.
The last of the factors illustrated in Figure 2 represents constituent attachments.
The concept comes from the work of Reichers (1985) who argued that employees can
become committed not only to the organization as a whole, but also to constituents within
it, such as coworkers, supervisors, mentors, teams, unions. Such attachments act against
quitting, because people are more psychologically attached to the organization. While
voluntary turnover models do not typically consider the impact of one’s personal
relationships, research has shown that attachments to supervisors and coworkers are
empirically related to quitting (Becker, 1992). Working in teams, or with groups, or on
certain long-term projects, create certain types of commitments other than attraction one
has for his/her job. In practice, we see companies that use working in teams to induce
commitment (e.g. Cohen & Bailey, 1997).
Page 13
13
With the antecedent forces of turnover analyzed, research addressed causal
linkages among them. More exactly, researchers concentrated on examining the steps in
the turnover decision process. The developments under this paradigm are usually called
“process models”, with Mobley’s (1977) approach being the prototype. Mobley (1977)
based his model on the assumption that intent to quit or stay is the cognitive event
immediately preceding turnover behavior. He proposed intermediate linkages in the
voluntary turnover decision between dissatisfaction and intention to quit. Briefly, his
model asserts that following an 1) evaluation of the job, experienced dissatisfaction leads
to 2) withdrawal cognitions, which lead to 3) an evaluation of the utility of a job search.
A positive utility yields 4) an intent to search for a job followed by the 5) search itself.
Subsequently, an evaluation occurs of the alternative(s) found comparing it to the current
job. An unfavorable comparison leads to an intention to quit, then leading to voluntary
turnover. This model is logical and compelling, although Mobley recognized that quitting
may also occur in an impulsive manner, following an entirely different pathway than that
proposed in his model, but he does not elaborate on this. I will address this issue when I
discuss the unfolding model of turnover.
Later developments of Mobley’s (1977) model added new factors, such as
individual values, job perceptions, and labor market perceptions, which determine 1) the
expected utility of the current job 2) expected utility of alternatives, and 3) current job
satisfaction (Mobley et al, 1979). These three elements form withdrawal intentions,
presumably by way of linkages proposed by Mobley (1977).
Though interesting, this integrative model generally received less empirical
support than a reduced linkage model presented in Hom et al. (1992, p. 905), which
essentially links dissatisfaction to withdrawal cognitions, and then to turnover. The Hom
et al. (1992) model seems the most empirically defensible representation of the basic
Page 14
14
steps in the turnover decision process (Maertz & Campion, 1998). Despite these
advancements, there is still uncertainty in regard to which steps, if any, occur during
turnover decision processes. Empirical studies provided support to different variations in
the linkages proposed in different models, and this seems to suggest that a certain
psychological process does occur. More research needs to be done to directly assess these
steps, using different experimental procedures. The survey data used in past empirical
studies did not directly examine how the decision process occurs.
Other turnover models made incremental contributions beyond intermediate
causal linkages alone. For instance, Muchinsky and Morrow (1980) included in their
model individual factors, work related factors, and economic opportunity factors as
precursors to turnover. The authors de-emphasized the behavioral intention construct as
the single precursor to turnover, and stressed that alternative opportunities have the
strongest direct impact on turnover. They also suggested that individual and work-related
factors interact and have effects on turnover, mediated through opportunities. In their
support, Michaels and Spector (1982) posited that alternative opportunities have a direct
positive influence on turnover behavior, not mediated through satisfaction or intention.
Other authors also linked job alternatives to turnover intentions and job satisfaction. For
example, researchers have argued that low perceived alternatives block the enacting of
withdrawal intentions (Hom, Griffeth & Sellaro, 1984) and high unemployment
discourages dissatisfied employees from developing firm decisions to seek alternatives or
to resign (Hom et al., 1992, p. 893). Conversely, predictor relationships are stronger
when the perceived number or quality of alternatives is high, because attitudes and
intentions can be enacted more easily. If true, this perspective implies that people are
generally averse in turnover decisions. Trevor, (2001) found that job satisfaction appears
Page 15
15
to have a negative effect of greater magnitude when jobs are plentiful and his study was
the first published non-meta-analytic study to document this effect.
In short, several relationships among alternatives, affect, and turnover have
emerged in models, besides those based on Mobley (1977). Perceived alternatives may
act directly on turnover behavior, they may influence turnover through satisfaction, or
they may moderate the effects of affect or intentions on quitting.
All these developments, while interesting and very promising, leave many blanks
in the analysis of quitting decisions. Mobley’s (1977) model and variations were most
influential and most often studied. Despite these advancements, a somewhat simplistic
view of quitting was portrayed in most of these models. Traditional models have assumed
a step-by-step, rational decision process that has never been directly validated. Lee and
Mitchell (1994) state that “in short, over 17 years of research on traditional turnover
models suggests that many employees may leave organizations in ways not specified by
the traditional models” (pg. 56).
Since then, progress has been made in the analysis of moderators, other
determinants, and macro-factors in voluntary turnover research. Coherent theories
considering moderators and macro factors are few, and the existing models seem
generally to underestimate the complexity of turnover decisions which occur in different
populations of employees. Some of these factors are the effect of job interviews on
employee tenure, unemployment, organizational culture, national culture, job search and
the effect of personality traits on decisions to quit. I will briefly present below each of
these dimensions.
Personnel selection has been found to influence turnover and some researchers
studied whether job interviews could be predictors of turnover. A meta-analysis found
that interviews modestly predicted job tenure (McDaniel, Whetzel, Schmidt, & Maurer,
Page 16
16
1994). Schmidt and Rader (1999) however, documented that an empirically developed
structured telephone interview could accurately forecast tenure (.39).
Labor market, particularly unemployment, can impact predictive relationships
(Steel & Griffeth, 1989). The intentions-turnover relationship is weaker with scarce job
opportunities, as shown by Carsten and Spector (1987). It also appears that occupational
unemployment (within one’s job type) is the stronger moderator in general than other
unemployment indicators (such as perceived alternatives), which suggests that
opportunities within one’s job title are more relevant in turnover considerations than
aggregated rates across occupations (Hom et al., 1992). The smaller predictive
relationships for perceived alternatives could be explained by the fact that actual labor
market conditions do not transfer directly into employee perceptions of their personal
alternative opportunities (Gerhart, 1990).
Abelson and Beysinger (1984) called for a more organization-level perspective
on turnover. Prior to this approach, the majority of the models had been concerned with
the individual level. It is well known that organization-level variables have been
positively linked to turnover. Such variables are high centralization, high routinization,
low integration, low communication, and policy knowledge (Price & Mueller, 1981).
Other approaches that link organizational culture to turnover emphasized human
resources practices and strategies. It has been argued that these strategies create
organizational environments that can oppose or encourage voluntary turnover (Kerr &
Slocum, 1987). These authors argued that cultural values of team work, security and
respect for individuals would foster greater retention than values of initiative and
individual rewards. Sheridan (1992) showed that an organizational culture which
emphasized interpersonal relationships improved retention by an average of 14 months.
Page 17
17
Other studies showed that human resources management practices predict quit rates and
discharge (Shaw, Delery, Jenkins & Gupta, 1998).
National culture can also be a factor which influences turnover decisions.
Turnover models have been developed mostly in English speaking countries and can be
ethnocentric. Differences in values and social norms across cultures may influence
quitting in many ways. For instance, normative forces are more likely to be important for
turnover decisions in collectivist cultures (such as Japan) rather than in individualist
cultures (such as US). Or, some cultures may value loyalty to an organization more than
others (Randall, 1993). As society moves toward globalization, particular attention
should be placed on these aspects, and it should be recognized that turnover models
cannot be applied or transferred to other cultures without factoring in the cultural
variable.
Job search was introduced as a variable, or intermediate link, between
dissatisfaction and turnover, in early models (March & Simon, 1958; Mobley, 1977).
Some studies showed that job search was a better predictor of turnover than even
turnover intentions (Bretz, Boudreau & Judge, 1994). The reason I discuss job search at
the end of this paragraph is that some authors believe that it should be considered distinct
from turnover models. Bretz, et al., (1994) argued that job search should be considered
separately from turnover models alone, as there are other purposes for job search besides
turnover. Such purposes can be one’s desire to evaluate himself against the market, or to
collect bargaining information by finding out salary ranges. As such, job search is not
necessarily a predecessor to turnover. The authors also suggested that there are two types
of antecedents to job search: pull forces from outside the organization and push forces,
originating within the organization. Push forces were found most influential on search
motivation (Bretz, et al., 1994). The authors also found a negative correlation between
Page 18
18
job search and human capital, but a positive correlation between turnover and human
capital, which suggests that higher level employees may not need to engage in extensive
search in order to find an alternative or to quit, because informal information gathering
may take the place of formal search.
Historically, investigators used measures of job search emphasizing either general
effort in job search (e.g., Feather & O'Brien, 1986; Hom & Griffeth, 1991; Hom et al.,
1984) or specific job search behaviors (e.g., Dyer, 1973; Kanfer & Hulin, 1985;
Kopelman Rovenpor, & Millsap., 1992).
For example, Hom et al. (1984) asked individuals such questions as: how much
effort they expended in their job search, activeness (never defined) of search, and how
much time they spent looking for a job. General-effort job-search scales, containing items
measuring effort and time, may not be as effective in explaining subsequent turnover
behavior because a general-effort job-search measure does not test how an individual
searches (i.e., what that person specifically does or does not do).
Expanding on this, Blau (1993) hypothesized that job search take place in two
stages: preparatory and active. Preparatory stage represents the effort to gather job search
information, while active stage refers to various means of soliciting a job. Blau (1993)
created an overall search scale and supported a three-factor structure with preparatory
job-search behavior, active job-search behavior, and general-effort job search. He also
showed that active job search has the strongest relationship with voluntary turnover of the
three types, and that it has incremental predictive validity beyond work attitudes and
withdrawal cognitions. Blau’s (1993) study tested the usefulness of a new job-search
behavior measure to account for voluntary turnover beyond more frequently tested work-
attitude and withdrawal-cognition variables. Using two samples, 339 registered nurses
and 234 insurance company employees, Blau (1993) found that active job-search
Page 19
19
behavior had a stronger relationship to voluntary turnover than preparatory job-search
behavior or general-effort job search, and it accounted for significant additional turnover
variance beyond work-attitude and withdrawal-cognition variables.
The foregoing body of research placed less emphasis on personality traits or
individual characteristics. Indeed, we would expect that certain personality traits correlate
in one way or another with turnover and/or job search. For example, intelligence
(cognitive ability) should factor in one’s decisions to stay or leave an organization.
Cognitive ability has a rich heritage of research in psychology, but its most noteworthy
application to industrial-organizational psychology has been as a predictor of job
performance. General cognitive ability test scores are one of the most consistently
positive predictors of job performance (Schmidt, Ones, & Hunter, 1992), and they are
most predictive for complex jobs, such as those of executives (Hunter, 1986). (There is
evidence that these findings are not lost on employers, as the business press features
companies such as Microsoft that heavily weigh intelligence in their selection practices
(e.g., Seligman, 1997). In the light of these considerations, it seems reasonable to
consider cognitive ability to be an element of human capital, contributing to an
individual's "opportunity" to leave (Bretz et al., 1994). Further, those higher in cognitive
ability are likely to perceive more opportunities, perhaps leading to increased motivation
to search, as a way to seek out alternatives.
Indeed, though a relatively small number of studies specifically addressed the
relationships between certain personality traits and turnover propensities, it has been
shown that Cognitive Ability (operationalized through SAT scores), along with the Big-
Five personality dimensions of Agreeableness, Neuroticism, and Openness to Experience
related positively to job search, these effects remaining even in the presence of an array
of situational factors previously shown to affect search (Boudreau, Boswell, Judge, &
Page 20
20
Bretz Jr., 2001). The authors also found that the relationship between Extraversion and
job search was significant and positive in the presence of situational factors, particularly
job satisfaction.
The Unfolding Model
One of the latest developments in the area of turnover research is Lee and Mitchell’s
(1994) Unfolding Model. Lee and Mitchell (1994) introduced a new decision-making
perspective to the turnover research, utilizing multiple decision paths. As such, turnover
decisions may be automatic, script driven, and may be the product of any one of the
several decision strategies, most having different aims than expected utility
maximization. The authors also speak about the so called ‘shocks to the system’, events
that jar employees to deliberate judgments about their employment. Such shocks can
include spouse relocation, for example.
The paths proposed by Lee and Mitchell (1994) were generally found to exist. Lee
et al. (1996) used a qualitative interview methodology with nurses and found that, though
in general paths proposed by Lee and Mitchell (1994) received some empirical support,
there were several notable exceptions in that scripts, negative affect, and evaluation of the
alternatives seemed to be more prevalent than previously thought.
These developments in turnover research suggests that the decisions are
considerably more complex than indicated in previous models.
Page 21
21
Conclusions
This rich body of research has shed light on some of the issues surrounding turnover
decisions, but left many questions still unanswered. Recent meta-analyses have
supported many of the factors that were thought to account for variance in turnover.
Griffeth, Hom and Gaertner (2000), in their comprehensive meta-analytical study, have
shown that personal characteristics have modest predictive strength for turnover, which is
in accord with previous studies. There is virtually no correlation between cognitive
ability and turnover, contrasting with the past estimate that more intelligent employees
are less prone to quit. Interestingly, women’s quit rate has been found similar to that of
men’s. The authors point out that this conforms to a recent labor economic finding that
educated women actually resemble men in turnover rate and pattern (leaving to assume
another job, not to abandon the labor market, which is a route taken by less educated
female leavers (Royalty, 1998). Also, the meta-analysis found no correlation between
race and turnover, indicating that the widespread accounts that minorities are more likely
to quit are not well founded. In their analysis Griffeth, et al., (2000), found a negative
correlation between overall job satisfaction and turnover (-.19), which is in line with
previous findings.
The authors also found that the effect sizes for pay and pay related variables are
modest in light of their significance to compensation theorists and practitioners. This is
interesting and has immediate economic applications in that practitioners should first
look at less costly measures when trying to control turnover, as they may be as, if not
more, effective. Griffeth et al., (2000), argue that just organizational procedures have as
much if not more to do with encouraging employees to stay as fair pay amounts. In
support of this statement, one study showed that the perceived fairness of a merit-pay
Page 22
22
distribution committed employees to their firm more than did satisfaction with the
amount of the raise (Folger & Konovsky, 1989).
In line with past findings, Griffeth et al. (2000), also showed that the perceived
alternatives modestly predict turnover (.12), though one of the acknowledged
methodological issues in such studies is how perceived alternatives are operationalized.
As discussed earlier, Hulin (1991) advocated the conceptualization of a
withdrawal response. In line with this approach, Griffeth, et al. (2000) found some
predictive accuracy for lateness and absences, and, more importantly, the pattern of
findings corroborates a progression-of-withdrawal response in which disgruntled
employees progressively enact more extreme manifestations of job withdrawal over time
(Rosse, 1988). In this progression lateness represents the mildest form of workplace
withdrawal, while turnover the most extreme. Absences represent an intermediate
withdrawal. Also as a behavioral predictor, performance was found to negatively
correlate with turnover (-.15) suggesting that high performers are less likely to leave.
The latest meta-analysis of voluntary turnover shows that quit intentions remain
the best turnover predictor (.38), outpredicting the broad construct of withdrawal
cognitions. Recently, job search has been operationalized in more and more refined ways,
and, importantly, newer operationalizations of job search are yielding remarkable levels
of predictive efficacy – from .23 to .47. Previous studies assessed whether or not leavers
carried out a job search and how much effort they spent searching. These recent
developments in job search have considered the methods that leavers use to find other
jobs. For example, the Kopelman et al. (1992) Job Behavior Index assesses the various
ways job seekers locate alternatives (e.g. mailing resumes, contacting employment
agencies) while Blau’s (1994) scale taps “preparatory” and “active” job search.
Page 23
23
In short, the Griffeth et al. (2000) meta-analysis showed that proximal precursors
in the withdrawal process are among the best predictors of turnover. Such predictors
include job satisfaction, organizational commitment, job search, comparison of
alternatives, withdrawal cognitions, and quit intentions. The authors also demonstrated
small to moderate effect sizes for predictors which prevailing theories presume to be
more distal in the termination process (e.g. Mobley, 1977; Price & Mueller, 1986). Such
distal determinants are characteristics of the work environment (job content, stress, work
group cohesion, autonomy, leadership, and to a lesser extent distributive justice and
promotional chances). Other distal causes represent factors external to the firm such as
alternative job opportunities. Demographic attributes did not show any predictive value
on turnover, with the exception of company tenure and number of children.
Page 24
24
THE EMBEDDEDNESS MODEL
Although the above-mentioned studies have generally found significant correlations
between turnover and different attitudinal variables, the results are modest. According to
Hom and Griffeth (1995), attitudinal variables (satisfaction and commitment) account for
less than 5% of the variance in turnover. Moreover, the effects of perceived opportunities
on leaving are even weaker (Steel & Griffeth, 1989) but the effects of search intentions
appeared to be slightly stronger (Griffeth et al., 2000).
Since traditional models have found only modest correlations, a number of
researchers broke away from the traditional models, trying to identify other factors that
might be good turnover predictors. Work of Hulin (1991), emphasizing a general
withdrawal construct, is such an example. Other researchers investigated the effects of
personality on turnover. Barrick and Mount (1996) and Chan (1996), for example,
analyzed the effects on turnover of factors such as conscientiousness.
As described in the previous pages, the factors that were most often taken into
account when analyzing turnover were on-the-job factors (e.g., satisfaction,
commitment). However, it might be that factors other than job related also control a part
of the variance in turnover. Indeed, a body of empirical research suggests that off-the-job
factors are important. Non-work influences can be family attachments and/or conflicts
between work and family roles. It has been shown that non-work commitments like
hobbies, church, family, do influence job attitudes and attachment (Cohen, 1995). Other
factors such as having children and a spouse at home have been found as being better
predictors of leaving a job than organizational commitment (Lee & Maurer, 1999).
A very recent development in turnover research stems from Kurt Lewin’s (1951)
field theory, as well as from embedded figures theories (Witkin, Moore, Goodenough, &
Page 25
25
Cox, 1977). Embedded figures are immersed in their field; they are connected through
many links to elements within that space. They are hard to separate from the field and
become an intrinsic part of that environment; they are a part of the surroundings
(Mitchell, Holtom, Lee, Sablynski, & Erez, 2001). The rationale that led these researchers
to look into this new conceptualization is that in many cases people who leave are
relatively satisfied with their jobs, don’t search for jobs, and leave because of a
precipitating event (e.g. spouse relocates). This made the authors postulate that it is not
one or another factor that is ultimately responsible for turnover, but it is rather an overall
level of embeddedness with the environment, which may better predict intention to leave
and actual turnover. Thus, job embeddedness is a construct that focuses on people’s
attachments to their job and community.
According to Mitchell et al. (2001), the critical aspects of job embeddedness are
1) the extent to which people have links to other people or activities 2) the extent to
which their job and community are similar to or fit with the other aspects in their life
space and 3) the ease with which these links can be broken. These make three dimensions
(links, fit, and sacrifice), both on- and off-the job, which yields a 3x2 matrix (Figure 3).
Links Fit Sacrifice
On the job
Links with the organization.
Formal or informal connections
between the person and work
friends, work groups, etc. Social
integration (O’Reily et al. 1989).
Abelson, (1987).
Fit with the organization. Personal
values, career goals and plans for the
future must fit the corporate culture and
job demands, career paths. Chatman
(1991). Chan (1996), Villanova et al.
(1994).
What would the person sacrifice if
s/he left the organization. Perceived
costs of leaving the organization
(giving up colleagues, perks, projects)
(Shaw et al. 1998). Stock options or
benefit pensions (Gupta & Jenkins,
1980). Job stability and advancement,
security, accrued advantages.
Off the job
Links with the community
Abelson, (1987), Cohen (1995)
Fit with the community. Weather,
amenities, general culture of the location
of residence, outdoor activities, political
and religious climates, entertainment etc.
What would the person sacrifice if
s/he left the community. Schools
quality, safety of the neighborhood.
Most important when person
relocates.
FIGURE 3. Dimensions of embeddedness.
Page 26
26
Job embeddedness is viewed as an aggregate multidimensional construct formed of its six
components or dimensions (Law, Wong, & Mobley, 1998). The causal path goes from
the causal indicators (items in the survey) to determine the six dimensions, and from the
dimensions, the causal arrow goes out to determine the aggregate construct.
Conceptually, the indicators are causes of embeddedness, not reflections or effects of it
(MacCallum & Brown, 1993). For instance, being embedded does not cause one to go out
and develop links with other people (by getting married, et cetera). Rather, those
activities are the cause of embeddedness (Mitchell et al., 2001).
Since job embeddedness is not a unified construct, but a dimensional aggregate of
the on- and off-the-job forces that might keep someone on the job, it is not expected that
the dimensions be highly correlated with one another. In some cases they might (e.g. on-
the-job links and fit) but in general such correlations are not expected. For instance, there
is no reason to believe that on-the-job links will be related to off-the-job sacrifice, et
cetera.
Differential analysis
Embeddedness is just one among many turnover constructs developed in organizational
psychology literature. As discussed in the previous pages, the most widely cited
constructs are attitudinal variables, among which job satisfaction and organizational
commitment are most widely cited (Hom & Griffeth, 1995; Griffeth et al. 2000). Job
involvement is also often researched, but not nearly as much as job satisfaction and
organizational commitment.
While embeddedness overlaps with certain aspects of job satisfaction and
organizational commitment, as well as with some aspects from other turnover
Page 27
27
conceptualizations, it nevertheless has several sharp distinctions which makes it unique.
Let me briefly present them below.
Embeddedness and Job Satisfaction
The main difference between embeddedness and job satisfaction constructs is that the
first is both on-the-job and of-the-job, while the latter is only on-the-job. Moreover, the
main instruments developed in the literature (e.g. Job Descriptive Index, Minnesota
Satisfaction Questionnaire) include multiple dimensions that focus on one’s work
environment, supervision, pay, or co-workers. However, the sacrifice-organization is not
captured under these instruments, as it does not include items assessing one’s affective
reactions to work, supervision, or co-workers. (It does, however, include items on
compensation and benefits such as retirement or health care).
Embeddedness and Organizational Commitment
Organizational commitment has generated a multitude of construct definitions. Allen &
Meyer (1990) use a three-dimensional model (normative, affective, and continuance
commitment), which is most current and widely used. While embeddedness concerns
both on the job and off the job factors, it follows that half of it is simply not covered by
organizational commitment, which concerns only organizational issues. Affective
commitment is conceptually different from job embeddedness. Affective commitment
reflects one’s liking of the job, whereas job embeddedness captures, along with these
emotional factors, others, which are non-affective, such as the existence of a niche in the
organization that matches one’s talents. Moreover, the embeddedness construct is not
driven by a sense of obligation, as is the case of normative commitment in the
organizational commitment construct. Job embeddedness does have, however, more
Page 28
28
similarities with the third dimension – continuance commitment - proposed by Allen &
Meyer (1990). At a general level, items proposed by Allen & Meyers (1990) to assess
continuance commitment are similar to sacrifice-organization. However, while Allen and
Meyers (1990) include in this dimension items that assess perceived lack of alternatives,
sacrifice-organization lacks such items (they are included as a separate sub-construct),
and, moreover, the measures are more specific, addressing particular issues.
Other constructs that may overlap with embeddedness
Since attitudinal constructs are most widely used in the literature, I contrasted the
embeddedness construct with them first. However, there are other constructs developed
in the literature, which may overlap with parts of job embeddedness. Mobley’s (1977)
early turnover model included the costs of quitting, which may be “loss of seniority,
vested benefits, and the like” (p. 238). In general, the research on costs of quitting
includes three general items along with measures of the costs of searching. Thus, this
construct is more general than the embeddedness construct in that it does not assess
specific things to be given up and, also, includes search which, in the embeddedness
model, forms a separate cluster or sub-construct.
The same claim can be made about another turnover construct, namely, Farrell
and Rusbult’s (1981) and Rusbult and Farrell’s (1983) ideas of job investment.
Specifically, they developed a four-dimension commitment model of predicting turnover
(job rewards, job costs, alternative quality, and job investments). Job investments include
factors that are intrinsic to the job like years of service or non-portable training (Rusbult
& Farrell, 1983, p. 431) or resources that are external but nevertheless tied to the job, like
housing arrangements, or friends at work. They constructed items to target these specific
contributors to commitment with one item targeting losses incurred as a result of leaving
Page 29
29
(All things considered, to what extent are there activities/events/persons/objects
associated with your job that you would lose if you were to leave?).
The sacrifice-community and links-community dimensions are very similar with
the idea of losing things by leaving. However, the authors also include an item targeting
job investment (How much does your investment in this job compare with what most
people have invested in their jobs?), which appears to invoke equity or fairness, which
are absent from the sacrifice-organization measure. These considerations make the job
investment construct more general, while embeddedness is more specific, as it targets
specific factors one would give up by leaving.
Other constructs that bear resemblance with some aspects of job embeddedness
are the ideas of person-organization fit (Schneider, 1987; Chatman, 1989; Kristof, 1996,
Saks & Ashforth, 1997; Werbel & Gilliland, 1999) and organizational identity (Whetten
& Godfrey 1998). The job embeddedness fit-organization dimension incorporates a
number of separate fit ideas from the above-mentioned literature. For example, it is asked
how well one perceives s/he fits with their co-workers, group, job, company or culture.
But one difference is important: The job embeddedness construct asks about a general or
overall fit, and this emerged as a necessity from the fact that there is confusion in the
literature on the bases of fit (e.g., personality, values, needs, goals; Kristof, 1996). In this
respect, the embeddedness construct is more inclusive than separate fit constructs in the
literature (Mitchell et al, 2001). The fit-organization dimension appears to have some
similarity with organizational identity, although a clear contrast and comparison are hard
to make due to the fact that there is little agreement on the definition of the organizational
identity construct. Mitchell et al. (2001) argue that the job embeddedness fit-organization
dimension is fundamentally different from organizational identity in that fit is assessing
the degree of similarity on a few specific dimensions. Other authors have much more
Page 30
30
inclusive definitions, such as Ashforth (1998), who argues that fit involves the fusion of
self and the organization.
Other constructs have some similarity with the links-community dimension of the
job embeddedness construct. Among these, Price and Mueller’s (1981) theory that
kinship responsibilities may limit one’s ease of movement. This variable is postulated by
the authors as reflecting “obligations to relatives in the community” and uses items which
target one’s marital status, number of children, or number of relatives in the community.
Other studies also pointed to family connections as important especially in the case of
expatriates leaving job assignments (Shaffer & Harrison, 1998). Some authors suggested
that relocation is gravely affected if a spouse or a significant family member does not
want to move (Miller, 1976; Spitz, 1986; Turban, Campion, & Eyring, 1992). This
kinship factor is very similar with the link-community dimension in the job
embeddedness construct, but job embeddedness is broader in meaning. Link-community
does not only focus on kinship, but also on other links with the community that may
inhibit moving, such as home ownership, close friends living nearby, or community-
organization links.
Yet other constructs that seem to bear some resemblance with job embeddedness
are those emerging from the work of Fishbein (1967) and Ajzen and Fishbein (1977).
Their attitude model suggests that behavior is affected by what others think you should
do in a particular situation. The underlying idea is that people are socially pressured to
comply with these expectations. This idea has materialized in a series of instruments in
which the respondent responds to questions with respect to various reference groups such
as friends, family, employer (Newman, 1974; Hom, et al, 1984).
However, the link-community dimension of the job embeddedness model is
different from these constructs in significant ways, because it refers to links, other than
Page 31
31
people, such as owning a home. Link-community refers only to off-the-job links, whereas
subjective norm only refers to people who can be both on- or off-the-job. Lastly, the link-
community dimension assesses links, not whether family or friends want one to quit
his/her job.
Embeddedness as a Turnover Predictor
Job embeddedness has been shown to predict voluntary turnover beyond job satisfaction
and organizational commitment, which are commonly employed when addressing this
phenomenon. Using a sample of retail employees and another sample of hospital
employees, Mitchell et al. (2001) showed that aggregated job embeddedness correlated
with intention to leave and predicted subsequent voluntary turnover. Also, job
embeddedness significantly predicted subsequent voluntary turnover after controlling for
gender, job satisfaction, organizational commitment, job search and perceived
alternatives. Job embeddedness was reliably measured as an aggregated score across
items for fit in the organization, fit in the community, links to the organization, links to
the community, sacrifice in leaving the organization and sacrifice in leaving the
community.
More specifically, Mitchell et al (2001) tested whether job embeddedness had any
relationship with employee intent to leave and subsequent voluntary turnover and they
also tested whether job embeddedness improves the prediction of voluntary turnover
above and beyond that predicted by job satisfaction, organizational commitment,
perceived alternatives, and job search.
The general research strategy employed by Mitchell et al. (2001) was to assess
personal characteristics, job satisfaction, organizational commitment, job embeddedness,
perceived alternatives and intent to leave at time one and actual turnover at time two.
Page 32
32
The two samples analyzed were a grocery store chain (177 respondents) and a
community-based hospital (208 respondents). Both functioned in a very tight labor
market (unemployment well below 5%).
Personal characteristics were collected using a simple fill-in-the-blank
questionnaire, and targeted age, gender, marital status, job level, and seniority with the
job, organization, and industry. Job embeddedness was measured using a questionnaire
that the authors developed themselves, and which contained slightly modified items from
traditional attitudinal measures, as well as unique items developed by the authors. Job
satisfaction was measured using Spector’s (1997) Job Satisfaction Survey in one sample,
and a three-item cluster of items in the second sample. Spector’s (1997) Job Satisfaction
Survey is a 36-item measure of employee job satisfaction applicable specifically to
service-oriented organizations. Overall job satisfaction was assessed through an averaged
composite of all 36 items, and for the facets of job satisfaction, Spector’s subscales were
used. The three-item cluster contained the following items: “All in all, I am satisfied
with my job”. “In general, I don’t like my job “ (reverse scored). And “In general, I like
working here”. Organizational commitment was measured using Meyer and Allen’s
(1997) three-dimensional model, with an averaged composite of all items being used. For
the three dimensions, Meyer and Allen’s subscales were used. The job alternatives
measure adapted two items from the Lee and Mowday (1987) study, and the items were:
“What is the probability that you can find an acceptable alternative to your job?” and “If
you search for an alternative job within a year, what are the chances you can find an
acceptable job?”
The job search behavior index measured actual search activity and used the ten-
item scale of Kopelman, et al. (1992), and includes questions such as “During the past
year have you 1) revised your resume 2) sent copies of your resume to a prospective
Page 33
33
employer, 3) read the classified advertisements in the newspaper, 4) gone on a job
interview and 5) talked to friends or relatives about getting a new job?
The intention to leave measure was adopted from Hom et al. (1984), and
contained three items: “Do you intend to leave the organization in the next 12 months?”,
“How strongly do you feel about leaving the organization within the next 12 months?”
and “How likely is it that you will leave the organization in the next 12 months?”. The
authors used an averaged composite in the analysis.
Voluntary turnover data were collected from the organizations. Voluntary
turnover was defined as in Maertz & Campion (1998): “instances wherein management
agrees that the employee had the physical opportunity to continue employment with the
company at the time of termination.” Follow-ups with people who left the organization
confirmed that they voluntarily decided to leave.
All of the hypotheses tested by Mitchell et al. (2001) were confirmed. In terms of
convergent validity analysis, the authors showed that embeddedness was significantly
correlated (p < .01) with job satisfaction and organizational commitment in both samples
(r grocery =. 43 and r hospital = .57 for job satisfaction, and r grocery = .44 and r hospital = .54 for
organizational commitment). Furthermore, fit in the organization dimension, which was
hypothesized to be most closely related to these affective measures was significantly
correlated (p < .01) with job satisfaction and organizational commitment (r job satisfaction
grocery / hospital = .52, and .72 and r organizational commitment grocery / hospital =. 58 and .52).
Moreover, as stated, the non-affective dimensions of embeddedness appear only
weakly correlated to the traditional measures of employee attachment. Links to the
organization, for example, was not significantly correlated with job satisfaction (r = 0.03
and .10).
Page 34
34
In terms of the correlations that exist between job embeddedness and turnover the
hypotheses were also confirmed. Embeddedness correlated significantly (p < .01) and
negatively with the intention to leave (r grocery = -.41 and r hospital = -.47). Also, the authors
showed that embeddedness improved the prediction of voluntary turnover beyond that
predicted by job satisfaction and organizational commitment (grocery / hospital
improvement of fit chi-square = 2.58 p<.05/ 5.29 p<.01, Wald = 2.54 p<.05/ 4.95 p<.01,
pseudo partial r = - .08 / -.14) and that predicted by job search and perceived alternatives
(grocery/ hospital improvement of fit chi-square = 6.18 p<.01/ 7.36 p<.01, Wald = 5.65
p< .01/ 7.36 p<.01, pseudo partial r = - .20 / -.18). Moreover, the authors showed that
embeddedness improved the prediction of voluntary turnover above and beyond that
predicted by job satisfaction, organizational commitment (perceived desirability of
movement), perceived alternatives and job search (perceived ease of movement) taken
together (grocery/ hospital improvement of fit chi-square = 2.37 p<.06 / 5.67 p<.01, Wald
= 2.31 p< .06 / 5.20 p<.01, pseudo partial r = - .06 / -.16). .
In other words, job embeddedness predicts turnover over and beyond a
combination of desirability of movement measures and perceived ease of movement
measures, thus assessing new and meaningful variance in turnover in excess of that
predicted by the major variables included in almost all the major models of turnover
(Mitchell et al., 2001).
One of the most important aspects that embeddedness acknowledges is the fact
that off-the-job and non-affective factors can influence turnover. The embeddedness
construct adds understanding to the extensive list of work and non-work factors that
creates forces for staying in a job (Mitchell et al., 2001).
This study has been complemented by a follow-up replication and extension. Lee
et al., (under review) replicated the Mitchell et al. (2001) empirical finding that job
Page 35
35
embeddedness predicts subsequent turnover. Using a different sample from a well known
financial corporation (sample size: 829 employees), the authors showed that: 1) the
correlation between job embeddedness and turnover was negative and statistically
significant, though small in magnitude (r = -.13, p < .01). 2) Job embeddedness
significantly correlated with the intention to leave (r = -.51, p <. 001). Also, as in the
other study, job embeddedness was negatively associated with voluntary turnover over
and above job satisfaction, organizational commitment, job search and perceived job
alternatives.
But the authors not only replicated the previous study. They also expanded it,
analyzing the correlations between embeddedness and several facets of the general
withdrawal construct. This construct, advocated by Hulin and associates (forthcoming),
broadens the theory and research on turnover. The general withdrawal construct has
many facets: it is made up of various withdrawal cognitions such as perceived job
alternatives, intention to search, intention to leave, absenteeism, or job performance.
Inspired by this new approach, Lee at al. (2002) found an incremental effect of job
embeddedness on voluntary absenteeism, organizational citizenship and job performance
over and above that of job satisfaction and organizational commitment.
Voluntary absenteeism is seen as an alternate form of leaving organizations.
Conceptually, the more an individual is socially enmeshed (or job embedded) in the
organization, the less likely he or she should be voluntarily absent. It has been shown that
voluntary absences have a corrected weighted average correlation of .20 to .33,
depending on which artifacts are corrected, with voluntary turnover (Griffeth et al.,
2000).
Organizational citizenship behaviors are part of a larger family of “extra-role
behaviors” (Van Dyne, Cummings & McLean-Parks, 1995). Most often, organizational
Page 36
36
citizenship is seen as an employee’s actions that help others better perform their jobs
(e.g., training, advising or encouraging co-workers) and as enhancing organizational
effectiveness (e.g., incurring individual opportunity costs for one’s own job performance
by helping others enhance their performance and thereby overall organizational
functioning (Mitchell et al. 2001).
Job performance has not been traditionally conceptually linked with withdrawal
constructs (e.g., March & Simon’s, 1958, influential ideas about the separation of the
decision to participate from the decision to perform). However, recent theorizing
questioned this separation (e.g. Hulin, forthcoming, Trevor, 2001). In their
comprehensive review, for example, Griffeth et al. (2000) report a corrected weighted
average correlation of -.15 between job performance and voluntary turnover.
Page 37
37
RESEARCH QUESTIONS
The following research question will be addressed in this study: What are some possible
antecedents of embeddedness?
Preliminary considerations
As described in the pages above, the job embeddedness model evolved through testing
correlations with turnover (both intentions and actual), job performance, voluntary
absenteeism, and organizational citizenship. Job embeddedness was shown to correlate
with all these factors, thus increasing our understanding of the concept. Thus far,
research has essentially concentrated on analyzing the outcomes of job embeddedness
and to my knowledge no study has addressed the problem of the antecedents of
embeddedness. Studying antecedents of embeddedness I believe would be a real
contribution to this model, as it would expand our understanding of the concept in the
other direction. Thus, it would confer closure and completeness to an already very
promising development. In practical terms, identifying the antecedents of embeddedness
could potentially facilitate decisions in personnel selection. If a measurable factor (e.g.,
certain personality traits or attitudes about work) is shown to correlate with
embeddedness, then that factor could be used in the selection process.
What exactly causes someone to be embedded? What are the antecedents of
embeddedness? As Lee et al. (2002) pointed out, job embeddedness is theorized as an
aggregate multidimensional construct formed from its six dimensions with its indicators
(items) acting as causes and not reflections of it. The items in the job embeddedness
questionnaire measure the causal indicators of the six sub-dimensions for job
embeddedness. More specifically, a latent factor is not theorized to drive its indicators. It
Page 38
38
is not expected, for example, that job embeddedness will cause one to enjoy a commute,
join more work teams or interact more with co-workers. Rather, these feelings and
behaviors cause a person to become embedded. In terms of a path diagram, the causal
arrow goes out from the causal indicators (items) to determine the six dimensions; and
from the dimensions, the arrows go out to determine the aggregate construct.
But what is behind the causal indicators? What drives someone, for instance, to
enter more easily into teams and make connections, which, in turn, will increase their
embeddedness? Or, what causes one to become involved in the extra work of community
activities that would make relocation harder?
My task in the following pages is to describe some of the possible antecedents of
embeddedness, describe how I tested them, and draw an empirically-based diagram
linking them to the embeddedness dimensions.
Defining the subject matter
Before beginning to describe the antecedents, I should mention that theoretically there
may be many plausible contenders. Individual differences/personality traits may have
relationships with embeddedness; people’s perceptions about their skills or about the
nature of their jobs/work environment may influence how embedded they are/become,
certain demographics may enhance relationships with embeddedness. I would call all of
these individual factors, because they relate, in one form or another, to the organizational
actor, his modes of perception, his traits, and/or his personal circumstances.
On the other hand, there may also be organizational influences on embeddedness.
Such influences could be, for instance, work-family balance programs, socialization,
formal organizational training, certain human resources policies, etcetera. I would call
these organizational factors, because they relate, in one way or another, to the modalities
Page 39
39
in which an organization manages its taskforce. Of course, a precise distinction between
‘individual factors’ and ‘organizational factors’ cannot be drawn, as some factors can be
viewed as both (e.g. socialization has both organizational and individual components).
Empirically, the difference between the two resides in the difference between the
modalities for testing them. Testing organizational antecedents of embeddedness would
require finding ways to operationalize various human-resource programs and policies
from various companies and testing embeddedness in samples of employees of those
companies. The practical difficulties of conducting such a study should not be
underestimated.
Because of these difficulties, in the following pages I will propose only potential
antecedents that relate to the individual factors. As you will see, testing “individual”
antecedents of embeddedness will require a different methodological approach than
testing organizational antecedents. A large sample of people should be tested on various
demographic/personality/perceptual dimensions, and these then empirically related to
embeddedness. More detailed explanations on the methodology of the study will be given
in the following pages.
In the light of these considerations, I theoretically expect that some significant
variance in embeddedness will be unaccounted for by the proposed antecedents. We can
merely speculate that this variance may be accounted for by ‘organizational antecedents
of embeddedness’, for I have not been able to operationalize them in the present study.
ANTECEDENTS OF EMBEDDEDNESS AND PREDICTIONS
It is useful to group the possible antecedents of embeddedness in several categories:
demographic variables, dispositions, work perceptions, and biological factors.
Page 40
40
Demographic variables
In this category I include age, marital status, number of children, and tenure (organization
tenure and community tenure). It has been shown that people who are older, are married,
have more tenure and / or children in care are more likely to stay (Abelson, 1987). My
goal is to link these variables with embeddedness, and, to this end, I hypothesize that age
and tenure correlate with embeddedness. I also hypothesize that marital status and
number of children correlate with embeddedness. Embeddedness is a multidimensional
construct and tenure is a part of two of its dimensions (link-community and link-
organization). Because of these reasons, I will only refer to tenure as an antecedent of
some of the embeddedness dimensions that do not already contain it. The benefit of
including tenure among the antecedents of embeddedness dimensions that do not already
contain it is that the embeddedness dimensions are considered more or less independent,
and it is important to know what predicts each of these dimensions.
1. Age: Age has been shown to moderate the effects of some organizational factors on the
decisions to leave or stay with an organization. Using a sample of over 3,000 technical
professionals from 6 large companies, Finegold, Mohrman, & Spreitzer, (2002) found
that in comparison to those under 30, satisfaction with job security is more strongly
related to the commitment of more senior workers (ages 31-45 and those over age 45)
and to their desire to remain with their companies. The same study found that for the
under-30’s, satisfaction with opportunities to develop technical skills and pay linked to
individual performance has a stronger negative relationship with willingness to change
companies than for those over 45. Although indirectly this study addresses turnover, it
does not tell us much about the precise relationships between age and turnover.
Page 41
41
Age is a serious contender for an antecedent of embeddedness. Arguably, there
will be a relationship between age and embeddedness in that younger people may be less
likely to be highly embedded. Conceivably, older people have had substantial thoughts
about past and current fit, links and sacrifice. In contrast, a 20-year-old (high school
graduate but college dropout, or the about-to-graduate student looking for a full-time job
in a tight market, or the graduate student who has a full-time “survival” job) would have
had only minimal thoughts about fit, links and sacrifice (Mitchell et al., 2001). The role
of age in job embeddedness appears important to a better understanding of the construct.
As such, it merits theoretical and empirical consideration. My prediction is that older
people will display higher levels of embeddedness than younger people on links-
community and links-organization dimensions. Older people may have children attending
schools in the neighborhood, they may be school board members, they may be friends
with their children’s friends’ parents, or they may be active in various clubs (e.g., golf,
chess, etc.). They also may have higher-level positions in organizations, along with a
greater number of people that they supervise. All these strengthen and increase the
number of attachments with the community and the organization. My first hypothesis,
therefore, is:
Hypothesis 1: Age positively correlates with embeddedness.
Hypothesis 1A: Age positively correlates with links-community.
Hypothesis 1B: Age positively correlates with links-organization.
2. Time: While age may be a contender for embeddedness, there may be cases in which,
although a person is not young any longer, s/he has recently relocated. As such, her/his
links with the community may not be well consolidated. Consequently, this person would
Page 42
42
not be highly embedded. Such a person may become more embedded as time goes by
through initiating new contacts, or establishing new friends. Time spent in the
community, rather than age per se, may therefore be a better contender for an antecedent
of embeddedness in such a case. Therefore, my second hypothesis is:
Hypothesis 2: Community tenure predicts embeddedness beyond age per se.
Hypothesis 2A: Community tenure positively correlates with sacrifice-community.
Hypothesis 2B: Community tenure positively correlates with fit-community.
3. Strength of attachment: Some family variables are included in virtually all turnover
models, but there is no agreement on what family characteristics are most relevant to
quitting and how they might operate. Mobley et al (1979) assert that family
responsibilities affect individual values, which, in turn, affect intentions to search and to
quit. Steers and Mowday (1981) theorize that “non-work influences” interact with job
attitudes to affect intention to leave. Hom and Griffeth (1995) argue that conflicts with
work and extraorganizational loyalties affect organizational commitment, which is
antecedent to withdrawal cognitions and expected utility of withdrawal. In general, three
family structure characteristics have been more frequently studied in the organizational
psychology literature: marital status, number of children and whether or not the spouse is
employed (Lee & Maurer, 1999). Drawing from the sociological literature, Lee and
Maurer (1999) argue that family structure directs the members’ allocation of resources
(time, money and effort) of its members; family structure can affect individual behavior
via its social control of members (Thornton, 1991) and its direction of members’ time and
energy (Downey, 1995). Becker’s (1991) human capital theory specifically argues that
because of limitations in one’s time and energy, employees must economize between
Page 43
43
work and family. Family structure is suggested to affect voluntary turnover by increasing
social controls (pressures) in the allocation of time and energy devoted toward (or away
from) the job (or family). It has been shown that having a spouse, having an employed
spouse, and an increased number of children at home, strengthen the effect of intention to
leave on subsequent and actual leaving (Lee & Maurer, 1999).
People who are married are more likely to have integrated better in their
communities. The likelihood that married couples develop friendships may be higher than
in the case of singles, because in a couple both partners may bring in new acquaintances.
In time, some of these will become common attachments. Some authors even suggested
that relocation is gravely affected if a spouse or a significant family member does not
want to move (Miller, 1976; Spitz, 1986; Turban, Campion, & Eyring, 1992).
Consequently, I expect that strength of the attachment to a significant other correlates
with embeddedness. Specifically, I predict that:
Hypothesis 3: Strength of attachment positively correlates with embeddedness.
Hypothesis 3A: Strength of attachment positively correlates with fit-community.
Hypothesis 3B: Strength of attachment positively correlates with sacrifice-
community.
At the same time, being strongly attached (e.g., married) should decrease an individual’s
tendency to seek new friendships, because of the household commitments and less
available time to spare outside the relationship. As most people spend a significant
amount of their time at work, which is usually one of the main places to develop new
friendships, I expect that strength of attachment acts against links-organization, precisely
because people will be less actively seeking the company of other people.
Page 44
44
Hypothesis 3C: Strength of attachment correlates negatively with links-
organization.
4. Number of children in care: Independently of one’s marital status, I believe that the
sheer number of children and their ages are factors that influence a person’s level of
embeddedness within their community. People who have school age children may attend
school board meetings, they may have developed relationships with neighbors who also
have children, or they may have purposely chosen to live in a particular neighborhood
because of schools’ quality, etcetera. Consequently, I expect such people to become more
embedded in their communities, especially on the links-community dimension. My
specific hypothesis is:
Hypothesis 4: Increased number of children in care positively correlates with
embeddedness.
Hypothesis 4A: Increased number of children in care positively correlates with
links-community.
Personality/Individual differences
In this category I include some of the Big Five traits and motivation. Some of the Big
Five traits have been linked with turnover in previous studies (e.g., Barrick & Mount,
1991).
Page 45
45
5. Big Five: It may be that some people become more embedded because they have
certain personality traits that make them enter more easily in work teams or in long-term
on-the-job and/or off-the-job partnerships. A propensity to join teams or to seek mentors
may make these people become more embedded. In contrast, people who enter with
difficulty in new relationships, or have difficulty in maintaining or nurturing
business/personal relationships may be deficient on the links-community and links-
organization dimensions. My argument is that personality is likely an antecedent to
embeddedness.
In recent years it has been argued that all personality traits can be reduced to five
basic factors. The Big Five traits include extraversion, agreeableness, conscientiousness,
emotional stability, and openness to experience. The Big Five are broad, global traits that
are thought to be associated with behaviors at work (Nelson & Quick, 2003). The Big
Five factors, according to Costa and McCrae (1992) (See also Salgado, 1997) are:
Extraversion - the person is gregarious, assertive, and sociable (as opposed to
reserved, timid, and quiet).
Agreeableness - the person is cooperative, warm, and agreeable (rather than cold,
disagreeable, and antagonistic).
Conscientiousness - the person is hardworking, organized, and dependable (as
opposed to lazy, disorganized, and unreliable).
Emotional stability - the person is calm, self-confident, and cool (as opposed to
insecure, anxious, and depressed).
Openness to experience - the person is creative, curious, and cultured (rather
than practical with narrow interests).
Page 46
46
There have been only a few studies that directly addressed the link between personality
and turnover (Griffeth et al., 2000) and no study linking personality and embeddedness. It
has been shown that several of the “Big Five” personality factors, measured by the NEO
Personality Inventory – conscientiousness, agreeableness, and openness to experience –
can predict turnover or tenure (Barrick & Mount, 1991). Another study found that some
of the Big Five personality dimensions can exhibit predictive validity for long-haul truck
drivers. (Conscientiousness ([rho] = -.26 and -.26 for two samples) and emotional
stability ([rho] = -.23 and -.21 for two samples) were valid predictors of voluntary
turnover.) In short, conscientious and emotionally stable truckers are less likely to leave.
The uncorrected correlation between those two personality traits and turnover (measured
six months after personality testing) was about -.20 (Barrick & Mount, 1996). These
findings suggest that individuals with high turnover propensities can be identified prior to
organizational entry. Other studies have linked Big Five factors to job search behaviors
in that agreeableness, emotional stability, and openness to experience related positively to
job search, these effects remaining even in the presence of an array of situational factors
previously shown to affect search (Boudreau, Boswell, Judge, & Bretz Jr., 2001). These
authors also found that the relationship between extraversion and job search was
significant and positive in the presence of situational factors, particularly job satisfaction.
In linking personality with embeddedness, I argue that extraversion,
agreeableness and conscientiousness of the Big Five factors correlate with
embeddedness. People who are agreeable and extraverted enter more easily in
relationships, they make friends easier, which, in turn, enriches the net which surrounds
them and should make breaking the attachments more difficult. Of course, the opposing
argument can be made, that is, extraverted and agreeable people may actually become
better networked, which, in turn, may increase the probability of receiving unsolicited job
Page 47
47
offers. Consequently, extraverted and agreeable people may also acclimate more easily to
new places, thus lowering the psychological costs associated with moving/turnover. In
other words, a negative correlation between these factors and sacrifice-organization may
be observed. Consequently, such people may actually display higher levels of turnover,
despite scoring more highly on embeddedness dimensions.
In the same line of arguments, people who are conscientious perform their jobs
better, which usually leads to increased recognition from the organization (both formal,
e.g., salary, and informal, e.g. praise), which, in turn, should lead to increased sense of fit
with the organization. Such people should become more embedded in their organization,
which will negatively affect their decisions to leave.
In short, my hypotheses are that conscientiousness, agreeableness and
extraversion positively correlate with embeddedness.
Specifically, my hypotheses are:
Hypothesis 5. Agreeableness, Extraversion and Conscientiousness are predictors of
embeddedness.
Hypothesis 5A. Agreeableness positively correlates with sacrifice-organization.
Hypothesis 5B. Agreeableness positively correlates with sacrifice-community.
Hypothesis 5C. Conscientiousness positively correlates with fit-organization.
Hypothesis 5D. Extraversion positively correlates with links-organization.
6. Motivation: Some people seem to be driven by a passionate interest in their work, a
deep level of enjoyment and involvement in what they do. This is what psychologists
have, for several decades, called intrinsic motivation: the motivation to engage in work
primarily of its own sake, because the work itself is interesting, engaging, or in some way
Page 48
48
satisfying. The opposite of intrinsic motivation is extrinsic motivation, where people
seem to be motivated more by external inducements in their work. Three recent research
programs (Harter, 1981; deCharms, 1968; Deci & Ryan, 1985b) have treated intrinsic-
extrinsic motivational orientations as variables that are, to some extent, traitlike, that is,
as enduring individual-differences characteristics that are relatively stable across time
and across situations.
The nature of the relationship between intrinsic and extrinsic motivation is not as
straightforward as it might appear at a first glance. The common implication in
contemporary theories is that the two work in opposition. For example, Lepper and
Greene’s initial theorizing (1978) proposed that individuals’ intrinsic motivation will
decrease to the extent that their extrinsic motivation increases, a position implicitly held
by other theorists.
Recent research, however, suggests that under some circumstances, intrinsic and
extrinsic motivation need not work in opposition (Deci & Ryan, 1985a). Amabile, Hill,
Hennessey, & Tighe (1994) provide some suggestive evidence of additive effects of the
two types of motivation. Children whose intrinsic motivation toward schoolwork was
bolstered by training subsequently showed higher levels of creativity under external
reward conditions, in contrast to nontrained children, who showed lower levels of
creativity under reward (Amabile et al., 1994; Hennessey, Amabile, & Martinage, 1989).
Amabile et al (1994) developed an instrument (Work Preference Inventory) to
assess intrinsic and extrinsic motivation applicable both to students and employed adults.
The Work Preference Inventory was designed as a direct, explicit assessment of
individual differences in the degree to which adults perceive themselves to be
intrinsically and extrinsically motivated toward what they do. The scales were created to
Page 49
49
be scored independently, guided by the underlying assumption that intrinsic and extrinsic
motives might coexist.
Items for the Work Preference Inventory were written so as to capture the major
elements of both intrinsic and extrinsic motivation. For intrinsic motivation the
components are: 1) self-determination (mastery orientation and preference for challenge)
2) competence (mastery orientation and preference for challenge) 3) task involvement
(task absorption and flow) 4) curiosity (preference for complexity) and 5) interest
(enjoyment and fun). For extrinsic motivation the components are: 1) evaluation concerns
2) recognition concerns 3) competition concerns 4) a focus on money or other tangible
incentives 5) a focus on dictates of others.
Amabile et al (1994) showed that there was little support for the assumption that
intrinsic and extrinsic motivation are polar opposites, with people falling into one discrete
category or the other. Indeed, individuals can simultaneously hold strong intrinsic and
extrinsic orientation, and intrinsic and extrinsic motivational orientations could be well
understood as two unipolar constructs. Based on these considerations, Amabile et al
(1994) suggest that individuals can be divided into four types: dually motivated,
intrinsically motivated, extrinsically motivated, and non-motivated.
I believe that intrinsic and extrinsic motivational dispositions can be related to
embeddedness. Since intrinsically motivated people extract their passion for work from
within, it is likely that they will experience a greater fit with the than extrinsically
motivated individuals, all else being equal. Also, since their satisfaction is primarily
generated by internal motivations, leaving the company would not incur high perceived
sacrifices even if they are to give up some accrued benefits. On the other hand, perceived
sacrifices will likely be high in individuals who extract satisfaction from external
rewards. As such, I posit that intrinsic motivation will positively correlate with fit-
Page 50
50
organization, while extrinsic motivation will positively correlate with sacrifice-
organization when the person is relatively satisfied with their benefits.
Specifically, my hypotheses are:
Hypothesis 6. Motivation correlates with embeddedness
Hypothesis 6A: Intrinsic motivation correlates positively with fit-
organization
Hypothesis 6B: Extrinsic motivation correlates positively with sacrifice-
organization.
Perceptions about work
Predictably, certain work experiences will have an influence on the level of
embeddedness of a person in an organization. Some of the work experiences discussed in
the analyses of the antecedents of organizational commitment are perceived
organizational support, perceived role ambiguity, leadership and justice (Meyer, Stanley,
Herscovitch, & Topolnytsky, 2002). I see some of these also as possible antecedents of
embeddedness:
7. Role ambiguity: Role ambiguity, according to Kahn, Wolfe, Quinn, Snoek, and
Rosenthal (1964), is the lack of clear, consistent information regarding the actions
required in a particular position. Role ambiguity, which is sometimes referred to by the
contrasting term, role clarity, is considered to have important consequences for the
performance and success of groups in business and industry (Rizzo, House, & Lirtzman,
1970) and has been linked to related variables such as cohesion (Grand & Carton, 1982)
and role-efficacy (Bray, 1998) in sport teams.
Page 51
51
Beard (1999) observed that role ambiguity is a cause of many negative or
detrimental consequences for the individual and the organization, including job
dissatisfaction, stress, and propensity to leave the organization. These consequences have
been confirmed through various studies (e.g., Hammer & Tosi, 1974) and meta-analyses
(e.g., Jackson & Schuler, 1985). More recently, Fried and Tiegs (1995) reported that role
ambiguity is also directly associated with how supervisors perform (i.e., over-inflating
their rating of employees).
I believe that role ambiguity can be linked to embeddedness, more specifically to
fit-organization. A perceived high role ambiguity will directly affect the perception of fit
with the organization. Therefore, I see role ambiguity as a precursor of this specific
dimension of embeddedness.
Hypothesis 7: Role ambiguity negatively correlates with embeddedness.
Hypothesis 7A: Role ambiguity negatively correlates with fit-organization.
8. Perceived [organizational and supervisor] support:
Organizational support theory (Eisenberger, Cummings, Armeli, & Lynch, 1997;
Eisenberger, Huntington, Hutchison, & Sowa, 1986; Shore & Shore, 1995) supposes that
to meet socioemotional needs and to determine the organization's readiness to reward
increased work effort, employees develop global beliefs concerning the extent to which
the organization values their contributions and cares about their well-being (perceived
organizational support, or POS).
In various studies, employees showed a consistent pattern of agreement with
various statements concerning the extent to which the organization appreciated their
contributions and would treat them favorably or unfavorably in differing circumstances
Page 52
52
(Eisenberger, Fasolo & Davis-LaMastro, 1990; Eisenberger et al., 1986; Shore & Tetrick,
1991; Shore & Wayne, 1993). Employees evidently believe that an organization has a
general positive or negative orientation toward them that encompasses both recognition
of their contributions and concern for their welfare.
Just as employees form global perceptions concerning their valuation by the
organization, they develop general views concerning the degree to which supervisors
value their contributions and care about their well-being. This evolved to be known as
perceived supervisor support, or PSS (Kottke & Sharafinski, 1988).
Perceived organizational support has been shown to reduce absenteeism
(Eisenberger et al, 1986). Also, perceived supervisor support was found to positively
relate to temporal change in perceived organizational support, suggesting that perceived
supervisor support leads to perceived organizational support (Eisenberger et al., 2002).
Also, the PSS-POS relationship increased with supervisor status in the organization.
Evidence is consistent with the view that perceived organizational support completely
mediated a negative relationship between perceived supervisor support and employee
turnover. These studies suggest that supervisors, to the extent that they are identified with
the organization, contribute to perceived organizational support and, ultimately, to job
retention (Eisenberger et al., 2002).
Perceived organizational support and perceived supervisor support would likely
influence the sacrifice-organization and fit-organization dimensions of embeddedness.
Increased organizational and supervisor support may make it harder for people to give
their actual work circumstances up and leave, because of the perceived increased
sacrifices that they would have to make.
I see the causal link going from these work experiences (role ambiguity/confusion
and organizational/supervisor support) to determine/effect embeddedness, not vice versa.
Page 53
53
I don’t see embeddedness causing increased perceived role ambiguity and decreased
perceived organizational support. On the contrary, I see these factors as antecedents -
coming into play after the organizational entry - which will affect specific dimensions of
embeddedness.
My specific hypotheses are:
Hypothesis 8: Perceived support positively correlates with embeddedness.
Hypothesis 8A: Perceived support positively correlates with sacrifice-
organization.
Hypothesis 8B: Perceived support positively correlates with fit-organization.
Under the perceptions about work category I also include alternatives (opportunities),
investments (in the actual job/organization), and transferability of education/skills.
Transferability of skills and education have been shown to correlate with continuance
commitment (ρ’s = -.22 and -.31) (Meyer et al., 2002). Similarly, alternatives (number
and quality) were found to negatively correlate with continuance commitment in meta-
analyses of organizational commitment (Meyer et al, 2002).
9. Alternatives: The perceived number, quality, and availability of alternatives are
factors that have been shown to have effects on turnover (both actual and intentions). It
was shown, for instance, that intentions-turnover relationships are weaker with scarce job
opportunities (Carsten & Spector, 1987). Other researchers have argued that low
perceived alternatives block the enacting of withdrawal intentions (Hom, Griffeth &
Sellaro, 1984) and high unemployment discourages dissatisfied employees from
developing firm decisions to seek alternatives or to resign (Hom et al., 1992, p. 893).
Page 54
54
I believe that the existence of alternatives should affect the way in which someone
perceives the value of her/his actual job and corresponding sacrifices that s/he would
have to make by quitting. A high number of comparable alternatives should have direct
negative effects on fit-organization and sacrifice-organization dimensions of
embeddedness. A small number of such alternatives should act in the direction of
embeddedness, by making people value their jobs more highly. Consequently, I expect
alternatives to negatively correlate with embeddedness.
My specific hypotheses, therefore, are:
Hypothesis 9. Alternatives correlate with embeddedness.
Hypothesis 9A. Alternatives negatively correlate with sacrifice-organization.
Hypothesis 9B. Alternatives negatively correlate with fit-organization.
10. Investments: Similarly, one’s investments in a job should have direct effects on
embeddedness, particularly fit-organization. Long [non-paid] extra-hours, voluntary
involvement in non-mandatory work-related activities and other non-portable,
idiosyncratic credits, not necessarily directly related to the actual job, should increase the
perceived organizational fit probably through the mediation of organizational
commitment.
Specifically, my hypothesis is:
Hypothesis 10. Job investments correlate with embeddedness.
Hypothesis 10A. Job investments positively correlate with fit-organization.
Page 55
55
11. Skills/education transferability: In the same line of arguments, transferability of
skills/education should have a direct impact on sacrifice-organization. Presumably, it will
be harder for people whose skills/education are not easily transferable to change their
current work situation with another. At the same time, however, an organization that
provides people with opportunities to develop skills that are marketable should be more
valued. Specific training and organizational programs targeted at specific professional
development that make people more competent in doing their jobs, increasing the
likelihood of finding a job elsewhere, should make people value the organization more
highly. Accordingly, my hypothesis is:
Hypothesis 11. Skills/Education transferability correlates with embeddedness.
Hypothesis 11A. Skills/Education transferability correlates positively with
sacrifice-organization.
12. Mating opportunities. Another factor that should play a role in embeddedness stems
from evolutionary psychology. Evolution has endowed us with mechanisms geared at
gene reproduction and fit maximization. Under the premises of evolutionary psychology,
much of our behavior is explained as attempts to maximize gene reproduction or increase
the likelihood of survival of both the actor and its offspring. Fight for status, fight for
promotions or for salary increases, or tendencies to spend unreasonable amounts of
money on expensive items just for the sake of displaying them (to signify status) can all
be viewed as attempts to increase the likelihood that one will find a good mate, which, in
turn will increase the likelihood of efficient gene transmission (Buss, 1999).
In the light of these considerations, I expect that situations or conditions that are
perceived to offer good mating opportunities would be preferred over those that do not.
Page 56
56
People who perceive that the environment in which they live offers such opportunities
will find it harder to separate from it. In other words, they will become embedded in it. I
therefore expect a correlation between perceived mating opportunities and
embeddedness. Specifically, my hypotheses are:
Hypothesis 12. Perceived number of mating opportunities correlates with embeddedness.
Hypothesis 12A. Perceived number of mating opportunities in the community
positively correlates with fit-community.
Hypothesis 12B. Perceived number of mating opportunities in the community
positively correlates with sacrifice-community.
Hypothesis 12C. Perceived number of mating opportunities in the organization
positively correlates with fit-organization.
Page 57
57
STUDY ONE
METHODOLOGY
One important issue in testing models like the one I am proposing is the direction of
causality. Eventual correlations that may appear between the proposed antecedents and
embeddedness may not necessarily mean that the direction of causality is from those
antecedents to embeddedness. In some cases, perhaps the direction of causality is from
some dimensions of embeddedness to some of the alleged antecedents. In other cases,
perhaps it may be that the correlations are the expression of a latent factor that influences
both of the variables. These are important issues that need to be addressed in the
methodology.
To minimize the difficulties of interpreting the correlations, one possible way to
execute this study is to do it in two phases: Administering the antecedents scales at time
one and the embeddedness survey at time two. Though such an approach does not
guarantee that the eventual correlations will represent the predicted direction, it however
strengthens such an argument.
Doing the study in such a paradigm raises, however, important practical obstacles.
The common empirical approach in the organizational psychology literature is to survey
employees working for the same organization. Thus, any potential confound given by
differences in the organizational culture that may affect people’s answers is minimized.
The model that I am testing makes such an approach difficult. If I were to survey the
same people in an organization at two different times, I would have to link their answers
Page 58
58
at the first questionnaire (the antecedents survey) to their answers to the second
questionnaire (the embeddedness survey) and I would have to solicit the information
necessary to link the two instruments (e.g. social security number, or name, or work
id/email) directly from the respondents. This would imply that I would collect personal
information that could identify the person who gave those answers. Since the
questionnaire asks several sensitive questions (e.g. about the perception about one’s
supervisor, etc) the issues of confidentiality become an important problem. My concern is
that if I use such an approach people might not be honest in their answers, or there will be
a large number of non-responses to the second questionnaire. In both such cases people’s
compliance and the validity of the results could be compromised. Such concerns are not
new in the literature.
Because of the above reasons in Study one I chose a different method: To
eliminate the problem of confidentiality and response rate, I opted to survey people
working for various organizations at two different times.
The procedure was as follows: undergraduate students working full-time, seeking
degrees in management and taking evening classes at a business college on the East Coast
had the option of choosing to administer a number of surveys as part of an introductory
psychology course optional requirement. The students who opted for this were given the
antecedents survey, along with instructions to administer it to five people at their
workplace. They were also advised that they would have to administer another survey to
the same people after a month. I put a particular effort in having them administer the
survey to people working in transferable positions (e.g., administration and management),
to minimize the potential risk of the nature of the job emerging as a confound. This first
survey went with the consent forms and also collected the names and contact details of
the respondents. The consent forms and the additional instructions, which emphasized the
Page 59
59
confidentiality of the responses, as well as the fact that the survey represented a course
requirement of a colleague of the respondents, and not a study done by a third party in
their company, I believe greatly decreased the perception of any potential danger or threat
in the completion of the survey. Indeed, with one exception, all the students reported
having no problems having their coworkers filling out the survey. On occasion, I was
even asked to get in direct touch with some of the respondents who were curious about
the aggregated results of the study.
After approximately a month, the students who participated in this project were
given the embeddedness survey and instructed to administer it to the same people who
had signed the consent forms and agreed to complete the antecedents survey. I collected
182 surveys and discarded ten because of missing data or because the embeddedness
survey was not returned. In total, I collected 172 valid surveys over a period of eight
weeks. The total completion time of both questionnaires was approximately 30 minutes –
approximately 20 minutes for the first part, and 10 minutes for the second part (see
Appendix 1 for the instrument and scales).
The surveys contained the following:
1. Questions targeting demographic variables
2. The Big Five Inventory (BFI) (John, Donahue, & Kentle, 1991). I chose BFI
over the NEO-PI inventory because (of):
1) Economical reasons (the overall questionnaire would become too
long if I used the long multi-faceted version)
2) Peer-reviewed empirical studies addressing the links between the
Big Five and various outcomes (e.g. job performance, turnover), in
general were not concerned with the facets of the Big Five (e.g.
Barrick & Mount, 1991).
Page 60
60
3. Work preference inventory (WPI) (Amabile et al., 1994), to assess intrinsic and
extrinsic motivation.
4. Role ambiguity was captured by using a six-item scale developed by Rizzo et al.,
(1970).
5. Perceived organizational support was assessed using three items from the
Survey of Perceived Organizational Support developed by Eisenberger et al.
(1986). This strategy was employed by Eisenberger et al (2002) in their analysis
of the relationship between perceived organizational support and perceived
supervisor support. To assess employees' perception that the organization valued
their contribution and cared about their well-being, the authors selected three
high-loading items from the SPOS (Items 1, 4, and 9; Eisenberger et al., 1986)
with factor loadings, respectively, of .71, .74, and .83. The measurement scale
was of the Likert-type scale (1 = strongly disagree; 5 = strongly agree). These
items were also used in the present study.
6. Perceived supervisor support. To assess employees' perception that their
supervisor values their contribution and cares about their well-being, I used the
SPOS in the same manner as Kottke and Sharafinski (1988), Hutchison (1997a,
1997b), Rhoades, Eisenberger, & Armeli (2001), and Eisenberger et al. (2002),
replacing the word organization with the term supervisor. The three adapted items
from the SPOS are Items 10, 27, and 35 (Eisenberger et al., 1986) selected on the
basis of their high loadings (respectively, .72, .76, and .80). The measurement
scale was of the Likert-type (1 = strongly disagree; 5 = strongly agree).
7. Skills/education transferability was measured by adapting some items used by
Facteau, Dobbins, Russell, Ladd, & Kudisch (1995) and Tesluk, Farr, Mathieu, &
Vance (1995) and adding a few more items. The items were: I can easily use the
Page 61
61
knowledge that I have gained while working for this company in another work
setting / My actual job performance has improved due to the skills I learned in
this job / The skills that I have accumulated while working for this company
greatly increased my chances of getting a comparable job elsewhere / My resume
looks better now, after all the training I have received while in this job.
8. Job investment was assessed adapting the following item: “How much does your
investment in this job compare with what most people have invested in their
jobs?” This is an item from Farrell and Rusbult’s (1981) and Rusbult and Farrell’s
(1983) four-dimension commitment model of predicting turnover. Job
investments include factors that are intrinsic to the job like years of service or
non-portable training (Rusbult & Farrell, 1983, p. 431). I also included four more
items: I have spent many unpaid extra hours at work / I have voluntarily engaged
in many organization-related activities that are not a formal part of my job (e.g.
committee memberships, event planning) / The effort that I have put into my job
has helped me to become competent in this line of work / I use my free time to
read work-related materials that contribute to my competence on the job.
9. Perceived number of alternatives was measured using a five-item scale
employed by Mitchell et al. (2001) and adapted from Lee and Mowday (1987).
The items were: What is the probability that you can find an acceptable
alternative to your job? / If you search for an alternative job within a year, what
are the chances you can find an acceptable job? / If you have received a job offer
in the past year, to what extent did you consider accepting it? / If you received a
job offer today, to what extent would you consider accepting it? / Have you
considered quitting your job to pursue non-work options?
Page 62
62
10. Perceptions of mating opportunities was collected using two items which were
tested in a pilot study. The items were: It would be easy for me to date someone
working for this company, should I desire so / I could easily find a date in the
community I live in, should I desire so.
11. Job embeddedness was tested using a slightly modified version of the Mitchell et
al (2001) embeddedness survey that contained a more fine-grained demographic
section. A few items have been added and other items have been excluded from
the Mitchell et al (2001) initial version.
12. Two additional measures were included for exploratory purposes. They were: a)
Intention to leave which was assessed using a three-item scale adapted from Hom
et al (1984) and used by Mitchell et al (2001) as a part of the questionnaire they
employed to test the embeddedness construct and b) Job search behavior index
which is a measure designed to assess actual search activity. The Kopelman et al.
(1992) ten-item scale was used for this purpose.
Demographics: A total of 172 questionnaires was collected, 37.8% (65) males,
61.6% (106) females. Thirty percent (50) identified as White, 29.2% (49) identified as
Hispanics, 38.1% (64) identified as Blacks, 2.4% (4) identified as Asians, and 0.6% (1)
identified as other race.
Thirty-four percent (58) of the respondents were married, 37.2% (64) were single,
12.2% (21) were divorced, 12.2.% (21) were not married but attached, 1.7% (3) were not
divorced but separated, and .6% (1) did not provide marital status info.
Analysis: I first calculated the means of the items comprising the Big Five
factors, the intrinsic and extrinsic motivation factors, as well as the items comprising the
six embeddedness dimensions. I also calculated the means of the items comprising the
Page 63
63
secondary scales of intrinsic and extrinsic motivation (enjoyment and challenge for
intrinsic motivation, outward and compensation for extrinsic motivation). Links-
community and links-organization dimensions of embeddedness consisted of two types of
items: 1) items assessed on a Likert scale and 2) items that were not assessed on a Likert
scale. The items that were not assessed on a Likert scale were marital status, spouse
employment status, number of children, time the person lived in the community, home
ownership, time the person worked in the respective industry, for the respective
organization, and in the respective position.
Marital status was changed from Mitchell et al. (2001) into a more fine-grained
assessment of the strength of the attachment with a significant other. Thus, the strength of
the attachment to a significant other was coded in the following manner: 1) married, 2)
not married but attached, 3) not divorced but separated, 4) divorced, 5) never
married/single. Thus, the strength of the attachment to a significant other decreases from
1 to 5. In the calculations, these values were reversed to be in line with the Likert scale
used in the embeddedness survey and considered a continuous variable. Number of
children was calculated by taking into account all the children under the age of 18.
For the other items not coded on a Likert scale, as well as for age, I calculated the
standard scores (z-scores) and then I integrated them in the corresponding dimensions or
antecedent clusters. Finally I calculated embeddedness as a mean of its dimensions. For
convenience purposes I will refer to all the z-scores by their initial name (e.g., I will refer
to “z-age” as “age”). The correlation matrix for all the variables is presented in Appendix
2.
Page 64
64
RESULTS
Overall regression
An overall multiple regression was performed first: The overall embeddedness score was
regressed on all the proposed antecedents (age, number of children, traits, motivation,
role ambiguity, organizational support, skills transferability, investments, alternatives,
and mating).
The regression coefficient was highly significant (F = 6.22, p < 0.000) and the
predictors accounted for 46% of the variance in embeddedness (R square = .461). Age
(beta = .17, t = 2.35, p < .02), number of children (beta = .15, t = 2.35, p < .02),
supervisor support (beta = .18, t = 2.17, p < .03), job investments (beta = .17, t = 2.37, p <
.01), skills transferability (beta = .15, t = 1.87, p < .06), perceived number of alternatives
(beta = -.17, t = -2.35, p < .02), and mating in community (beta = .24, t = 3.52, p < .001)
had all significant or marginally significant (skills transferability) correlations in the
predicted direction with the overall embeddedness score. The other proposed antecedents
did not reach significance levels in this preliminary overall analysis (see Appendix 1-
S1).
The results of this overall regression are promising. First, all the predictors
combined account for approximately 50% of the variance in embeddedness. As
mentioned earlier, this study addresses only the antecedents that pertain to the individual
(demographics, traits, work perceptions, mating), not to the organization (e.g., HR.
policies, training availabilities, spoken organizational culture). A complementary study
that would address these other possible antecedents might tap into the unaccounted 50%
of the variance. Second, the analysis revealed that each cluster of antecedents
Page 65
65
(demographics, traits, work perceptions and biologic factors) contributed to the variance.
This is an important indication that embeddedness is caused/enhanced by a variety of
factors, which was one of the underlying assumptions of this study. Third, the predictions
in the present study are more specific, in that embeddedness antecedents are linked to
specific dimensions of embeddedness, which in turn are linked to the overall
embeddedness. Therefore a more fine-grained analysis, regressing each embeddedness
dimension to its theorized antecedents should reveal yet stronger and more meaningful
correlations.
This is the object of the considerations in the following pages.
Regression of overall embeddedness on clusters of antecedents
The next step in the analysis was to regress the overall embeddedness score on each
cluster of antecedents (demographics, traits, perceptions about work, and mating factors).
Regression of overall embeddedness on the demographic cluster
The demographic cluster used in these computations consisted of age and number of
children. A variable cannot be both predictor of, and part of, the variable the antecedent
predicts, so I deliberately excluded strength of attachment, time in the community and
time in the organization from the demographic cluster, as they are already components of
specific embeddedness dimensions (links-community and links-organization). As shown
below, these variables were included only as predictors of those dimensions that do not
already contain them.
Regression on the demographic cluster was significant and revealed that this
cluster accounts for 10% of the variance (R square = .099, F = 8.91, p < .000), with both
number of children (beta = .22, t = 3.00, p < .003), and age (beta = .21, t = 2.81, p < .006)
Page 66
66
highly correlating with overall embeddedness (see Appendix 2-S1). These findings could
be summarized as follows: the older a person and the higher the number of children in
care, the more highly is the person embedded.
Regression of overall embeddedness on the trait cluster
The trait cluster consisted of motivation (intrinsic and extrinsic) and the Big Five factors.
Regression of embeddedness on these factors was highly significant (F = 2.75, p < .005)
and revealed that this cluster accounts for 13% of the variance in overall embeddedness
(R square = .134). Conscientiousness (beta = .24, t = 2.51, p < .01) and marginally
agreeableness (beta = .15, t = 1.80, p < .07) showed positive correlations with overall
embeddedness, while, interestingly, enjoyment (beta = -.18, t = -2.03, p < .04) showed a
negative correlation (see Appendix 3-S1). Aside from enjoyment, intrinsic and extrinsic
motivations do not seem to contribute significantly to the overall embeddedness.
Conscientiousness and agreeableness significantly correlated with overall embeddedness.
People who are dependable and conscientious, as well as people who are agreeable seem
to become more highly embedded in their environment. This is in accord with my
predictions. An interesting result was obtained for enjoyment. It seems that the more
enjoyment one extracts from various activities, the less embedded one becomes. This
result perhaps can be attributed to the fact that enjoyment is actually a subscale of
intrinsic motivation, which is work-related, and as such it should not be included in the
analysis of the influence of personality traits on overall embeddedness. A competing
explanation could be the fact that people who extract much enjoyment from their work
may feel a lesser urge to socialize and seek friendships, precisely because their social
needs are already fulfilled through their job. Consequently, they will be less embedded.
Page 67
67
Regression of overall embeddedness on the perceptions about work cluster
The perceptions about work cluster consisted of role ambiguity, organizational and
supervisor support, skills transferability, job investments, and perceived number of
alternatives. Regression of overall embeddedness on these factors was highly significant
accounting for 29% of the overall embeddedness (R square = .286, F = 10.42, p < .000).
Organizational support (beta = .17, t = 2.04, p < .04), job investments (beta = .21, t =
2.91, p < .004) and perceived number of alternatives (beta = -.25, t = -3.75, p < .000)
correlated significantly and in the predicted direction with overall embeddedness (see
Appendix 4-S1).
Greater perceived organizational support and job investments seem to act by
embedding the individual in his/her environment, while greater perceived number of
alternatives seems to act against embeddedness. Indeed, the extra effort one puts in
his/her job, as well as the extra investment an organization puts in its taskforce should act
in the direction of embeddedness, as predicted, and this is precisely what emerged in the
analyses. Similarly, as predicted, the perceived number of alternatives should act against
embeddedness: a person who finds it easy to switch jobs should feel less embedded.
Regression of overall embeddedness on the mating cluster
The mating cluster consisted of two items – one targeting one’s likelihood to find a mate
in the organization, and one targeting one’s likelihood to find a mate in the community n
which s/he lives. This cluster accounted for 5% in overall embeddedness (R square =
.051, F = 4.39, p < .01) with mating in community correlating significantly with overall
embeddedness (beta = .24, t = 2.95, p < .004) (see Appendix 5-S1).
Page 68
68
People who perceive that they can easily find a mate in the community they live
in seem to become more embedded. It seems that this perception makes it harder for
people to break the links and give up their present circumstances.
Comments
Although these results are promising, a more fine-grained analysis needs to be made.
Thus far, overall embeddedness was regressed on all the factors altogether, and overall
embeddedness on clusters of antecedents. Many of the theorized antecedents correlated
with embeddedness in the predicted direction. These antecedents are: number of children,
age, agreeableness, conscientiousness, organizational support, supervisor support, job
investments, alternatives, skills transferability, enjoyment, and mating in community.
Both of the demographic factors theorized to be antecedents of embeddedness correlated
with overall embeddedness. Three of the Big Five factors correlated with overall
embeddedness, and five out of six of the perceptions-about-work factors correlated with
overall embeddedness. Extraversion, one of the Big Five factors theorized to correlate
with embeddedness did not reach significance in this sample, and role ambiguity, a factor
from the perceptions-about-work cluster also did not reach significance in this sample.
Neither intrinsic nor extrinsic motivation reached significance levels when correlated
with overall embeddedness, with the interesting exception of enjoyment, which yielded a
negative correlation with overall embeddedness. The mating cluster did reach
significance levels, though it accounted for a relatively small portion of the variance in
overall embeddedness.
The next logical step in the analyses is to regress each embeddedness dimension
on each cluster of antecedents. In the following pages I will describe the results of the
regressions of links-community, fit-community, sacrifice-community, links-organization,
Page 69
69
fit-organization, and sacrifice-organization on demographics, traits, perceptions about
work, and mating.
Links-Community
Regression of links-community on the demographic cluster revealed that this cluster
accounts for 17% of the variance (R square = .167, F = 16.24, p < .000). This cluster
included number of children and age. The other variables in the theorized demographic
cluster are already a part of links-community. They will serve as antecedents of other
embeddedness dimensions, described below. Both age (beta = .29, t = 4.04, p < .000) and
number of children (beta = .27, t = 3.81, p < .000) correlated highly significantly with
links-community (see Appendix 6-S1).
The results of this regression suggest that increased number of children in care
and increased age have a positive influence on the number of links between a person and
his/her community. Increased age and increased number of children make an individual
more embedded in the community in which s/he lives.
Regression of links-community on traits did not reveal any significant correlations.
This cluster was theorized to consist of Big Five factors and Motivation. Only the Big
Five factors were included in this analysis, as [intrinsic and extrinsic] motivation relates
to work perceptions and behaviors. Based on the findings one can argue that the links-
community dimension of embeddedness seems not to be significantly affected by
dispositions (see Appendix 7-S1).
Regression of links-community on the mating cluster (represented only by mating in
community) did not reveal any significant correlations (see Appendix 8-S1).
Page 70
70
Fit-Community
Regression of fit-community on the demographic cluster revealed that this cluster
accounts for 10% of the variance in fit-community (R square = .096, F = 4.14, p < .003),
with strength of attachment correlating highly with fit-community (beta = .26, t = 3.14, p
< .002) (see Appendix 9-S1). People who reported the strongest attachment with a
significant other (married) were more likely to report an increased level of fit with their
communities. This is in accord with the predictions: as theorized in the previous pages,
the number of attachments between a person and his/her community is likely to increase
when there are two people in the household, as each of them brings in friends and
expands the community network through club memberships or other affiliations. As such,
the level of fit with the community should increase.
Regression of fit-community on the trait cluster (only the Big Five factors) revealed
that this cluster accounts for 8% of the variance (R square = .08, F = 2.85, p < .01). Of
the Big Five, conscientiousness correlated highly with fit-community (beta = .21, t =
2.34, p < .02) (see Appendix 10-S1). People who are conscientious – efficient,
organized, dutiful, achievement striving, deliberate and disciplined – apparently have a
higher level of fit with their surroundings. Indeed, such people may be more proactive in
their involvement in their communities, and may head voluntary committees. This should
lead to an increased level of fit with the respective environment.
Regression of fit-community on the mating cluster (only represented by mating in
community) revealed that this cluster accounts for 6% of the variance in fit-community
Page 71
71
(R square = .056, F = 9.89, p < .002) (see Appendix 11-S1). Mating in community
correlated highly significantly with fit-community (beta = .23, t = 3.14, p < .002). These
results suggest that the higher the perceived number of mating opportunities one has in
the community in which one lives, the higher the level of perceived fit with the
community. Indeed, insights from evolutionary psychology suggest that one of the
strongest motivations of human behavior consists of finding a suitable mate. A person
who finds himself/herself in an environment that seems to provide such opportunities
should find the respective environment better fitted to his/her needs, and this is precisely
what emerged in the analyses.
Sacrifice-Community
Regression of sacrifice-community on the demographic cluster (age, time in the
community, number of children and strength of attachment) accounted for 9% of the
variance in sacrifice community (R square = .094, F = 4.06, p < .004). Time in the
community (beta = .16, t = 1.94, p < .05) and strength of attachment (beta = .20, t = 2.44,
p < .01) correlated significantly with sacrifice-community (see Appendix 12-S1). These
results suggest that the more time one has spent in a community and the stronger the
attachment to a significant other, the harder it will be for the person to break the net and
leave the community and the greater the sacrifices perceived in the event of leaving.
Regression of sacrifice-community on the trait cluster (only represented by the Big
Five) showed that this cluster accounts for 12% in the variance in sacrifice-organization
(R square = .115, F = 4.23, p < .001). Agreeableness (beta = .24, t = 2.83, p < .005),
conscientiousness (beta = .19, t = 2.15, p < .03), and neuroticism (beta = .16, t = 1.99, p <
.04) correlated significantly with sacrifice-community (see Appendix 13-S1).
Page 72
72
Agreeable individuals enter into relationships more easily: they make friends
more easily, and these may be hard to give up. A positive correlation was predicted
between agreeableness and sacrifice-community and this is precisely what emerged in the
analyses. Conscientiousness has also shown an empirical positive correlation with
sacrifice-organization. One possible explanation is that conscientious individuals are
more involved in their community, and may be members of various community-service
organizations. Giving up all these investments would be harder for them.
Regression of sacrifice-community on the mating cluster (only represented by ‘mating
community’ in this case) showed that mating in community accounts for 10% of the
variance (R square = .095, F = 17.42, p < .000, beta = .30, t = 4.17, p < .000) (see
Appendix 14-S1). This result is particularly interesting as this cluster consisted of only
two items, one tapping into its relationships with the organization, another tapping into its
relationships with the community. Ten percent of the variance in sacrifice-community in
this sample was accounted for by the perceived number of mating
alternatives/opportunities in that community. In other words, the results suggest that
increased likelihood of finding a partner in the community increases the level of
perceived sacrifices one has to make if one were to leave the respective community.
Links-Organization
Regression of links-organization on the demographic cluster revealed that this cluster
accounts for 34% (R square = .336, F = 26.42, p < .000) of the variance in links-
organization (see Appendix 15-S1). Only age, strength of attachment, and number of
children were included in this regression, as time in industry, time in organization, and
time in the current position are already theorized to be a part of links-organization in
Page 73
73
Mitchell et al. (2001). Age (beta = .56, t = 8.53, p < .000) does seem to have a very strong
effect on the number of links between a person and his/her organization. The older a
person is, the more links he seems to have developed with various organizational-related
factors. Indeed, as theorized, older people would have had more opportunities to develop
contacts with coworkers in business relationships, thereby increasing their embeddedness
level. These results are in accord with predictions.
Regression of links-organization on the trait cluster (Big Five and Intrinsic/Extrinsic
motivation subscales) showed that this cluster accounts for 15% (R square = .147, F =
3.05, p < .002) of the variance in links-organization. Interestingly, enjoyment showed a
significant negative correlation with links-organization (beta = -.29, t = -3.23, p < .001).
Extraversion (beta = .17, t = 2.15, p < .03) and conscientiousness (beta = .21, t = 2.29, p
< .02) correlated significantly with links-organization (see Appendix 16-S1). That
extraversion positively correlates with links-organization is in accord with prediction.
Extraverted individuals may enter more easily into relationships; they make friends more
easily and are better networked. Similarly, conscientious individuals are efficient,
organized, dutiful, achievement striving, deliberate and disciplined and as such they may
be more rapidly promoted to supervisory positions, which, in turn, leads to increased
number of links between the person and various organizational attributes (co-workers,
subordinates, top management, etcetera). The empirical negative correlation between
enjoyment and links-organization is surprising and would suggest that the more
enjoyment one extracts from his/her job, the less the likelihood that the person will
develop links with various organizational aspects. A possible explanation of this finding,
which could be the object of future empirical investigation, could be the fact that
intrinsically motivated people (enjoyment is a part of intrinsic motivation in Amabile et
Page 74
74
al.’s [1994] theorizing) may simply not need too much social support to feel good. They
are already extracting personal satisfaction from their work. One can speculate that as
such, they may not require friendships and relationships to compensate for any deficit in
job satisfaction that may be experienced by extrinsically motivated individuals.
Consequently the intrinsically motivated may have a reduced number of organizational
links. They are deeply involved in their work and spend less time in social activities (e.g.,
smoking outside, after-work Fridays), which would create opportunities for better
networking. As a consequence, their embeddedness level is reduced. These conjectures
could be the object of future investigations.
Regression of links-organization on the perceptions-about-work cluster. Regression
was performed for links-organization and the perceptions-about-work cluster. This cluster
accounted for 17% (R square = .172, F = 5.39, p < .000) of the variance in links-
organization with job investments (beta = .30, t = 3.77, p < .000), skills transferability
(beta = -.20, -2.39, p < .01) and perceived number of alternatives (beta = -.27, t = -3.64,
p< .000) correlating highly significantly with links-organization. Job investments
correlate positively with links-organization, while skills transferability and perceived
number of alternatives showed negative correlations (see Appendix 17-S1).
Job investments measures the level of involvement of a person in his/her job,
operationalized by the unpaid extra time spent at work and other non-transferable,
idiosyncratic behaviors. People who display such behaviors are indeed more likely to
enter in contact with more people in the organization, which increases the number of
links/attachments between the person and the organization. Skills transferability showed
a negative correlation: one possible explanation could be the fact that because these
people know that their skills are transferable, they may not be as interested in networking
Page 75
75
with others or may not be willing to involve themselves in their job more than necessary.
Skills transferability translates to more job opportunities, so that the need to enrich the
organizational network (possibly to increase job security) becomes less imperative.
Regression of links-organization on the mating cluster did not show any significant
values (see Appendix 18-S1).
FIT-ORGANIZATION
Regression of fit-organization on demographics (represented by age, time in
organization and strength of attachment) did not show significant correlations. While age
did account for 33% of the variance in links-organization, age per se seems not to be a
predictor of fit-organization. Regression of fit-organization on time in the organization
also did not show any significant correlations. It seems that time in the organization, like
age, has no influence on the perceived level of fit with the organization. Strength of
attachment did yield a significant correlation (beta = .19, t = 2.40, p < .01), although the
regression model failed to reach significance levels (see Appendix 19-S1).
Regression of fit-organization on the trait cluster (both Big Five and
Intrinsic/Extrinsic motivation) revealed that this cluster accounts for 15% of the variance
(R square = .148, F = 3.05, p < .002). The outward dimension of extrinsic motivation
(beta = .22, t = 2.61, p < .01) and conscientiousness (beta = .22, t = 2.36, p < .01) are
highly correlated with fit-organization, while enjoyment marginally (beta = -.15, t = -
1.77, p < .07) and openness (beta = -.19, t = -2.17, p < .03) manifested negative
correlations with fit-organization (see Appendix 20-S1).
Page 76
76
The outward dimension of extrinsic motivation describes people who tend to be
motivated by recognition, who are sensitive to others’ opinions of their work and ideas.
They tend to judge their success relative to other people and those with high scores tend
to work with clear goals and procedures (Amabile et al., 1994). One would expect a
positive correlation for this factor with fit-organization. Indeed, working with clear goals
and having established procedures should positively influence the perception of fit with
the organization and this is what emerged in the analyses.
Conscientiousness – which describes people who are organized, dutiful,
achievement striving, deliberate – is a quality valued by any organization. Such people
are dependable and reliable: As such, they are entrusted with more responsibility, which
should increase the level of fit with the organization. A positive correlation between
consciousness and fit-organization was predicted and this is precisely what emerged in
the analyses.
Of interest is the negative correlation of openness with fit-organization. Openness
describes individuals who are curious, have ideas, are imaginative and artistic, show wide
interests, are excitable and unconventional. They are the “explorer” type, always seeking
adventure or new experiences. One possible explanation for this finding is the fact that
this sample consisted mostly of people working in administration, in small to mid-size
law firms or consulting companies. It is hard to imagine an administrative position that
would meet the needs of a person who scores highly on the openness dimension of the
Big Five. A positive correlation would be expected from a sample of artists, musicians, or
field anthropologists, for instance. On the other hand a positive correlation might be
expected in a sample where job transfers within the organization are relatively easy to
make.
Page 77
77
Regression of fit-organization on the perceptions-about-work cluster (ambiguity,
organizational and supervisor support, job investments, skills transferability, and
perceived number of alternatives) revealed that this cluster accounts for a sizable 47% of
the variance (R square = .472, F = 23.25, p < .000). Organizational support (beta = .46, t
= 6.15, p < .000), job investments (beta = .14, t = 2.19, p < .02), and perceived number of
alternatives (beta = -.23, t = -3.93, p < .000) correlated highly and in the predicted
direction (negative for the perceived number of alternatives) with fit-organization (see
Appendix 21-S1). More organizational support and greater job investments do seem to
relate to a higher level of fit with the organization. In contrast, a larger perceived number
of alternatives acts against fit-organization. People who perceive that they can easily
change their current position are less likely to report a high level of fit with the
organization to which they belong.
Regression of fit-organization on the mating cluster produced a marginal effect (R
square = .01, F = 3.07, p < .08), with mating in organization correlating marginally with
fit-organization (beta = .13, t = 1.75, p < .08) (see Appendix 22-S1).
SACRIFICE-ORGANIZATION
Regression of sacrifice-organization on the demographic cluster did not reveal any
significant correlations. Time in the organization, number of children, and strength of
attachment do not relate to the perceived sacrifice of leaving the organization (see
Appendix 23-S1).
Regression of sacrifice-organization on the trait cluster (both the Big Five and
Motivation) also did not reach significance levels. Personality traits or intrinsic/extrinsic
Page 78
78
motivation do not account for significant variance in sacrifice-organization, but
agreeableness did show a significant positive correlation with sacrifice-organization
(beta = .19, t = 2.18, p < .03, see Appendix 24-S1). Agreeable individuals seem to have
greater difficulty giving up the organization they work for. Based on the results from this
sample, however, the effect of agreeableness as an antecedent of sacrifice-organization is
unclear.
Regression of sacrifice-organization on the perceptions-about-work cluster (role
ambiguity, organizational support, supervisor support, job investments, skills
transferability, perceived number of alternatives) showed that this cluster accounts for
45% of the variance (R square = .445, F = 20.85, p < .000). Organizational support (beta
= .38, t = 4.95, p < 000), supervisor support (beta = .20, t = 2.73, p < .007), and skills
transferability (beta = .16, t = 2.35, p < .02), showed all positive significant correlations
in the predicted direction with sacrifice-organization while perceived number of
alternatives strongly correlated negatively (beta = -.29, t = -4.85, p < .000) with sacrifice-
organization (see Appendix 25-S1). The perceived sacrifice in the event of leaving is
greater when there is more support and skills transferability, and lower when the number
of alternatives is larger. The positive correlation between skills transferability and
sacrifice-organization is of a special interest. Earlier, a negative correlation between skills
transferability and links-organization was explained as a tendency of people to be less
involved in the organization if they know they can find a comparable job elsewhere. The
positive correlation between skills transferability and sacrifice-organization suggests that
although such people may be less inclined to develop relationships within the
organization, they nonetheless value the organization for the opportunities it offers to
make them more marketable.
Page 79
79
Regression of sacrifice-organization on the mating cluster did not reveal any
significant correlations. Increased number of mating opportunities within the organization
does not seem to affect the sacrifice-organization dimension of embeddedness (see
Appendix 26-S1).
Page 80
80
STUDY TWO
The method that I employed in study one has one potentially major flaw, namely the fact
that the participants did not work for the same organization. I argued that this should not
constitute a significant issue, as I am essentially correlating personality traits and
perceptions about work with embeddedness. However, to further strengthen my
arguments, study one was replicated with people working for the same organization.
This sample consisted of people working for a well-known higher education
institution on the East Coast. This institution employs both faculty (instructors) and
administrative staff. I deliberately chose to survey only the administrative staff in this
institution, for such people have transferable skills and they spend 35-40 hrs/week at the
workplace. Faculty constitutes a separate group with unique characteristics, and any
findings from studying such a group are hard to generalize outside academia.
A total of 502 surveys were mailed to the entire staff of this institution. The
envelope contained the survey and a stamped return envelope, along with instructions and
consent forms. A particular effort was put to stressing the confidentiality of the
responses. The major methodological difference between this sample and the previous
one was that this sample received just one survey containing both the antecedents and the
embeddedness questionnaire. In other words, they completed all the scales at one time,
with no pause between the completion of the antecedents scales and embeddedness
scales.
Within three weeks after the mailing, participants received a reminder email about
the survey, and after two more weeks they received another reminder.
Page 81
81
A total of 130 questionnaires was returned, representing approximately a 25%
response rate. One questionnaire was discarded because one page was missing. A total of
129 valid questionnaires was included in the analysis. The questionnaire was identical to
that administered in study one with the exception of the addition of two more items for
control purposes. The items were: Are you taking classes at this institution? / Are you a
Union member? (See Appendix 3 for the complete instrument).
Demographics: A total of 129 questionnaires was included in the analyses:
29.9% (38) of the respondents were males, 70.1% (89) were females. Seventy three
percent (94) identified themselves as White, 7.8% (10) identified as Hispanics, 8.6% (11)
identified as Blacks, 9.4% (12) identified as Asians, and 0.8% (1) identified as other race.
Forty-two percent (52) of the respondents were married, 29.6% (37) were never
married, 5.6% (7) were divorced, 20% (25) were attached, while 3.2% were not divorced
but separated.
The correlation matrix between all the variables is presented in Appendix 4.
Page 82
82
RESULTS
Overall regression
Following the same procedure as in study one, an overall regression of the embeddedness
score on all the antecedents was first performed. The regression was highly significant (F
= 7.62, p < .000) with the antecedents accounting for 59% in the variance in
embeddedness (R square = .587). This regression showed that compensation (beta = -.29,
t = -3.85, p < .000), marginally extraversion (beta = .14, t = 1.87, p <. 06), agreeableness
(beta = .32, t = 3.25, p < .002), neuroticism (beta = .18, t = 2.07, p < .041), supervisor
support (beta = .30, t = 2.78, p < .006), job investments (beta = .22, t = 2.74, p < .007),
perceived number of alternatives (beta = -.30, t = -3.34, p < .001) and mating in
organization (beta = .24, t = 3.21, p < .002), correlated significantly with overall
embeddedness (see Appendix 1-S2). Compensation showed an interesting negative
correlation with embeddedness, suggesting that the more value one places on extrinsic
rewards, the less embedded is the person in his or her environment.
Regression of overall embeddedness on clusters of antecedents
Regression of overall embeddedness on the demographic variables (age and number
of children) was highly significant (F = 8.37, p < .000) accounting for 12% of the
variance (R square = .120). Age correlated highly significantly with overall
embeddedness (beta = .34, t = 3.97, p < .000, see Appendix 2-S2).
Regression of overall embeddedness on traits was significant (F = 3.98, p < .000),
accounting for 23% of the variance in overall embeddedness (R square = .232).
Compensation (beta = -.21, t = -2.46, p < .015), agreeableness (beta = .30, t = 3.02, p <
Page 83
83
.003), challenge (beta = .19, t = 2.07, p < .04), and marginally outward (beta = .16, t =
1.83, p < .06) correlated significantly with overall embeddedness (see Appendix 3-S2).
Regression of overall embeddedness on the perceptions-about-work cluster was
highly significant (F = 10.50, p < .000) and accounted for 34% of the variance (R square
= .341). Supervisor support (beta = .41, t = 3.47, p < .001), marginally job investments
(beta = .14, t = 1.87, p < .06) and job alternatives (beta = -.15, t = -1.95, p < .05)
correlated significantly with embeddedness (see Appendix 4-S2). Not surprisingly,
increased number of alternatives correlated negatively with overall embeddedness.
Supervisor support and job investments both correlated positively with overall
embeddedness. Interestingly, organizational support did not show significant correlations
in this sample, as it did in the previous sample. Rather, supervisor support showed
significant correlations with overall embeddedness. These results could be attributed to
the difference in the size of the organizations the two samples worked for. Sample two
participants work for a large organization, containing many divisions and different
organizational subcultures and values. It makes sense that these people will see the
organization as something more abstract and far away, and would place more value on
the relationships with their immediate supervisors. In sample one, participants usually
worked for small organizations (law firms or consulting firms) where everybody knew
each other. In this case, organizational support (or lack thereof) will be more visible in
people’s eyes. These are empirical questions that merit further investigation.
Regression of overall embeddedness on the mating cluster revealed that this cluster
accounts for 10% of the variance (R square = .10, F = 7.10, p < .001). Both mating in
community (beta = .18, t =2.19, p < .03) and mating in organization (beta = .23, t = 2.76,
Page 84
84
p < .007) correlated significantly in the predicted direction with overall embeddedness
(see Appendix 5-S2). A larger perceived number of mating opportunities does seem to
make a person more embedded in his or her environment. Again, this result is hardly
surprising if judged in the framework of evolutionary psychology. Indeed, survival and
reproduction are the main motivational factors in the animal (and human) kingdom. Any
environment that offers greater chances of survival (factor not explored in this study) and
increased chances of successful genes transmission should be more highly valued and
harder to give up, and this is precisely what emerged in these analyses.
Regression of embeddedness dimensions on antecedents clusters
Following the same procedure as in study one, regression analyses were performed for
each embeddedness dimension (links-community, fit-community, sacrifice-community,
links-organization, fit-organization, and sacrifice-organization) on each antecedent
cluster.
Links-Community
Regression of links-community on the demographic cluster accounted for 24% of the
variance (R square = .239, F = 19.32, p < .000). Both number of children (beta = .31, t =
3.93, p < .000) and age (beta = .31, t = 3.91, p < .000) correlated highly significantly with
links-community (see Appendix 6-S2). The higher the number of children in care and the
older a person is, the greater and stronger the number of links between the person and his
or her environment a result that emerged in sample one, as well.
Page 85
85
Regression of links-community on traits did not yield significant values. Indeed, it
seems that the Big Five factors do not account for significant variance in links-
community (see Appendix 7-S2).
Regression of links-community on the mating cluster (represented only by mating in
community item) also did not yield any significant correlations. The perception of
increased mating opportunities within one’s community seems not to affect the number of
links between the person and community (see Appendix 8-S2).
Fit-Community
Regression of fit-community on the demographic cluster yielded significant values,
accounting for 9% of the variance (R square = .089, F = 2.95, p < .02). Time in the
community (beta = -.29, t = -2.87, p < .005) showed an interesting negative significant
correlation with fit-community (see Appendix 9-S2 a), which counter-intuitively
suggests that the more time one spends in the community, the lesser the level of fit with
the community. An exploratory item (“I am a real New Yorker”), which correlated
positively with time in the community, showed no correlation with fit-community. This
suggests that in this sample the effect of time is unclear, but does tend to be negative.
More research needs to be done on samples that live in expensive big cities where living
comes sometimes with big challenges (see Appendix 9-S2 b).
Regression of fit-community on traits (represented by the Big Five only) marginally
reached significance, accounting for 8% of the variance in fit-community (R square =
.079, F = 2.11, p < .06) (see Appendix 10-S2). Extraversion (beta = .20, t = 2.02, p <
.04), agreeableness (beta = .20, t = 1.99, p < .04), and conscientiousness (beta = -.27, t =
Page 86
86
-2.41, p < .01) showed significant correlations with fit-community. Conscientiousness
showed an interesting negative correlation with fit-community. It suggests that the
perception of fit with the community decreases as conscientiousness increases. This
makes sense if, in big cities, the efforts of any one individual are not likely to be
acknowledged by the community and the individual consequently feels that his or her
efforts are undervalued or neglected. This presupposition merits further investigation.
Regression of fit-community on the mating cluster marginally fell short of significance
(R square = .02, F = 2.93, p < .08), with mating in community correlating marginally
with fit-community (beta - .153, t = 1.71, p < .08, see Appendix 11-S2).
Sacrifice-Community
Regression of sacrifice-community on the demographic cluster (strength of
attachment, age, number of children, time in the community) failed to reach significance
(see Appendix 12-S2).
Regression of sacrifice-community on the trait cluster also did not reveal any
significant values (see Appendix 13-S2).
Regression of sacrifice-community on the mating cluster fell just short of significance
(R square = .02, F = 3.46, p < .06), with mating in community correlating marginally
with sacrifice-community (beta = .16, t = 1.86, p < .06, see Appendix 14-S2).
Page 87
87
Links-Organization
Regression of links-organization on the demographic cluster (represented by age and
strength of attachment) was highly significant, accounting for 38% of the variance in
links-organization (R square = .379, F = 24.81, p < .000). Age (beta = .66, t = 8.50, p <
000) and strength of attachment (beta = -.16, t = -2.12, p < .035) correlated significantly
with links-organization (see Appendix 15-S2). Strength of attachment showed negative
correlation, suggesting that the more satisfied one is in his/her personal relationships, the
less likely one is to actively seek links with the organization.
Regression of links-organization on traits (represented by Big Five and motivation)
was significant accounting for 17% of the variance (R square = .173, F = 2.75, p < .006.
Compensation was the only factor to reach significance in this regression (beta = -.22, t =
-2.49, p < .01, see Appendix 16-S2).
Regression of links-organization on the perceptions-about-work cluster did not reach
significance (see Appendix 17-S2)
Regression of links-organization on the mating cluster did yield significant values,
with this factor accounting for 5% in the variance in links-organization (R square = .054,
F = 7.00, p < .009, beta = .23, t = 2.64, p < .009, see Appendix 18-S2). A greater number
of mating opportunities in the organization is associated with a larger number of
organizational links.
Page 88
88
Fit-Organization
Regression of fit-organization on the demographic cluster (represented by age, time in
organization, and strength of attachment) was highly significant accounting for 16% of
the variance in fit-organization (R square = .163, F = 7.83, p < .000). Age (beta = .31, t =
2.88, p < .005) and strength of attachment (beta = .20, t = 2.23, p < .02) correlated
significantly with fit-organization (see Appendix 19-S2).
Regression of fit-organization on the trait cluster was highly significant, accounting
for 31% in the variance in fit-organization (R square = .312, F = 6.00, p < .000).
Marginally challenge (beta = .16, t = 1.77, p < .07) and compensation (beta = -.15, t = -
1.81, p < .07) and highly significantly agreeableness (beta = .25, t = 2.74, p < .007)
correlated with fit-organization (see Appendix 20-S2). People working in roles that are
challenging, or who value work that is challenging are reporting increased levels of fit
with the organization, perhaps because it provides them with opportunities to feed this
need. Also, agreeable individuals are reporting increased levels of organizational fit. Such
people are better networked and have more friends at work, which should increase the
perception of the organization as a second home. This should increase the level of fit and
this is precisely what emerged in the analyses. In contrast, people who value extrinsic
rewards seem to report decreased levels of organizational fit. The more value one places
on monetary rewards, the lower the level of fit with the organization.
Regression of fit-organization on the perceptions-about-work cluster (role ambiguity,
organizational support, supervisor support, skills transferability, perceived number of
alternatives, job investments) was significant, accounting for 36% of the variance in fit-
organization (R square = .358, F = 11.34, p < .000). Supervisor support (beta = .36, t =
Page 89
89
3.15, p < .002), and job investments (beta = .18, t = 2.42, p < .01) correlated significantly
with fit-organization. Perceived number of alternatives showed a marginal negative
correlation with fit-organization (beta = -.134, t = -1.70, p < .09, see Appendix 21-S2).
Indeed, greater perception of supervisor support should relate to a higher level of
organizational fit, as the person feels that his/her needs are addressed by the organization.
Similarly, the more investments one puts in his/her job, the higher the reported level of fit
with the organization. In contrast, the prediction that a larger number of possible job
alternatives should act against fit-organization was actually confirmed in the analyses,
albeit marginally.
Regression of fit-organization on the mating cluster yielded significant values (F =
12.66, p < .001), accounting for 9% in the variance in fit-organization (R square = .093).
Mating in organization factor correlated significantly with fit-organization (beta = .30, t =
3.55, p < .001, see Appendix 22-S2), suggesting that the greater the number of mating
opportunities one finds in the organization, the higher the level of fit with the
organization that the person experiences.
Sacrifice-Organization
Regression of sacrifice-organization on the demographic cluster (strength of
attachment, age, and time in the organization) did not reveal any significant correlation
between the factors and sacrifice-organization, although the regression was significant (F
= 2.9, p < .03). It seems that these factors have only a minimal influence on the sacrifice-
organization dimension of embeddedness (see Appendix 23-S2).
Page 90
90
Regression of sacrifice-organization on the trait cluster (Big Five and Motivation)
was highly significant accounting for 25% of the variance in sacrifice organization (R
square = .25, F = 4.40, p < .000). The outward dimension of extrinsic motivation (beta =
.17, t = 1.94, p < .05), compensation (beta = -.17, t = -2.07, p < .04), agreeableness (beta
= .21, t = 2.12, p < .035) and neuroticism (beta = -.32, t = -3.35, p < .001) showed
significant correlations with sacrifice organization (see Appendix 24-S2). Indeed, as
predicted, agreeable people should experience increased levels of embeddedness, by
virtue of their ability to develop relationships and enrich the network of friends.
Consequently, the sacrifices that they would have to make if they decided to leave the
organization would be perceived as being higher.
Regression of sacrifice-organization on the perceptions-about-work cluster (role
ambiguity, perceived number of alternatives, job investments, organizational support,
skill transferability, supervisor support) revealed that this cluster accounted for a
substantial 51% in the variance (R square = .513, F = 21.40, p < .000). Supervisor
support (beta = .48, t = 4.81, p < .000), skills transferability (beta = .19, t = 2.34, p < .02)
and perceived number of alternatives (beta = -.17, t = -2.54, p < .01) correlated
significantly with sacrifice-organization (see Appendix 25-S1). That more perceived
alternatives correlates negatively with sacrifice-organization comes as no surprise. People
who perceive that they have many career opportunities are less likely to value the
organization as highly as someone who perceives that the likelihood of getting another
job elsewhere is low. Supervisor support also showed a highly significant correlation
with sacrifice-organization, but organizational support did not show such a correlation. It
seems that in this sample people are much more sensitive to their supervisors’ behaviors
than to the overall support provided by the organization. This is perhaps because sample
Page 91
91
two individuals work for a large organization, where organizational micro-levels (e.g.
departments or organizational units) are more important to the individual than the
organization as a whole.
Regression of sacrifice-organization on the mating cluster was highly significant (F =
6.38, p < .01), accounting for 5% in the variance (R square = .049). Mating in
organization accounted for 5% of the variance in sacrifice-organization (R square = .049,
beta = .22, t = 2.53, p < .01, see Appendix 26-S2) suggesting that people find it hard to
leave an organization that seems to provide opportunities for finding suitable mates.
Page 92
92
DISCUSSION
The bottom line
The overall regression of embeddedness on all the antecedents reached significant values
in both samples. Some of the antecedents reached significance levels in both samples,
and other reached significance levels in just one sample (see Figure 4).
Significant antecedents in the overall regression Sample one (46%) Sample two (59%)
All
antecedents
Age * ns
Time in the community Not included Not included
Time in the organization Not included Not included
Number of children * ns
Strength of attachment Not included Not included
Agreeableness ns **
Conscientiousness ns ns
Extraversion ns marginal
Openness ns ns
Neuroticism marginal *
Intrinsic Motivation Enjoyment ns ns
Challenge ns ns
Extrinsic Motivation Outward ns ns
Compensation ns ** (-)
Role ambiguity ns ns
Support Organizational support ns ns
Supervisor support * **
Skills transferability marginal ns
Job investments ** **
Perceived number of alternatives * (-) **(-)
Mating in community ** ns
Mating in organization ns *
FIGURE 4: Significant antecedents in the overall regression. Marginal: p < .10; *: p < .05, **: p< .01; (-):
negative correlation. Percentages represent how much of the variance is accounted for by the antecedents.
Similarities and differences between the samples:
Page 93
93
A quick glimpse at Figure 4 reveals the following facts:
Age and number of children correlated highly significantly with overall
embeddedness in sample one, but showed no significant correlations in sample two.
Agreeableness and marginally extraversion reached significance in sample two,
but not in sample one, while neuroticism reached significance (marginal in sample one)
in both samples.
Job investments, supervisor support and perceived number of alternatives are
significant predictors of embeddedness in both samples.
The mating factor (mating opportunities) is also a significant contributor to the
variance, though in sample one mating in community showed significant correlations,
while in sample two mating in organization showed significant correlations.
Motivation seems not to have a significant influence on overall embeddedness
except for compensation which yielded a negative correlation in sample two.
Role ambiguity and skills transferability seem not to be significant contributors to
the variance in either sample, though skills transferability reached marginal significance
in sample one.
Comparison between the samples in regression of overall embeddedness on clusters
of antecedents
Regression of overall embeddedness on clusters of antecedents revealed the following
similarities and differences between the samples (see Figure 5):
Page 94
94
Regression of overall embeddedness on clusters of
antecedents
Sample one Sample two
Demographics
Age **
10%
**
12%
Time in the community Not
included
Not
included
Time in the organization Not
included
Not
included
Number of children ** ns
Strength of attachment Not
included
Not
included
Big Five
Agreeableness marginal
13%
**
23%
Conscientiousness ** ns
Extraversion ns ns
Openness ns ns
Neuroticism ns ns
Motivation
Intrinsic
Motivation
Enjoyment * (-) ns
Challenge ns *
Extrinsic
Motivation
Outward ns marginal
Compensation ns ** (-)
Work perceptions
Role ambiguity ns
29%
ns
34%
Support Organizational support * ns
Supervisor support ns **
Skills transferability ns ns
Job investments ** marginal
Perceived number of alternatives ** (-) * (-)
Mating Mating in community **
5% *
10% Mating in organization ns **
FIGURE 5: Regression of overall embeddedness on clusters of antecedents. Marginal: p < .10; *: p < .05,
**: p< .01; (-): negative correlation. Percentages represent how much of the variance is accounted for by
the antecedents.
From Figure 5 it can be observed that age, agreeableness, support, job investments,
perceived number of alternatives, and mating in community are significant predictors in
both samples. In addition, number of children, conscientiousness, enjoyment, and
organizational support are also significant predictors in sample one, while challenge
orientation, compensation, supervisor support, and mating in organization are also
predictors in sample two.
Page 95
95
Comparison between the samples in regressions of embeddedness dimensions on
clusters of antecedents
Links-community
Regression of links community on demographics revealed the following similarities
between the samples (see Figure 6):
Regression of links-community on antecedents Sample one Sample two
Demographics
Age *** 17%
*** 24%
Number of children *** ***
FIGURE 6: Significant antecedents in the regressions of links-community on antecedents clusters. ***: p<
.001; (-): negative correlation. Percentages represent how much of the variance is accounted for by the
antecedents.
Both age and number of children correlate highly significantly with links-community in
both samples. This cluster accounts for important variance in both samples (17% in
sample one, 24% in sample two). Age and number of children in care do seem to be
important predictors of links-community, as theorized.
Fit-community
Regressions of fit-community on the antecedents revealed the following differences
between the samples (see Figure 7).
Regression of fit-community on antecedents Sample one Sample two
Page 96
96
Demographics Strength of attachment **
10% ns
8% Time in community ns ** (-)
Traits (Big Five only)
Conscientiousness *
8%
** (-)
8% Agreeableness ns *
Extraversion ns *
Mating Mating in community ** 6% marginal
FIGURE 7: significant antecedents in the regression of fit-community on antecedents. Marginal: p <
.10;*: p < .05; **: p< .01; **; (-): negative correlation. Percentages represent how much of the variance is
accounted for by the antecedents.
As can be observed from Figure 7, strength of attachment is a predictor in sample one but
not in sample two. Also, time in the community showed a negative correlation in sample
two, but no correlation in sample one. It seems that time leaves fit-community unaffected
in sample one, which consisted of people mostly living outside New York City, but
negatively affects fit-community in sample two, which consists of people mostly living in
New York City. In sample one, conscientiousness emerged as a significant factor in the
regression of fit-community on traits, while in sample two conscientiousness showed
negative correlation with fit-community. As I speculated in the previous pages, this is
perhaps because the increased efforts one puts in bettering the community are harder to
be recognized in a big city. In contrast, in small communities, such effort may be more
rapidly acknowledged, thereby enhancing the level of fit-community. Along with
conscientiousness, agreeableness and extraversion also reached significance in sample
two, suggesting that people who are outgoing and pleasant are more likely to experience
increased levels of fit with a large community. Also, perceived number of mating
opportunities accounted for significant variance in sample one, and marginally
approached significance in sample two, suggesting that in both samples mating
opportunities provided by the community factor into one’s perception of fit with the
community.
Page 97
97
Sacrifice-community
A comparison of the regressions of sacrifice-community on the demographic cluster
between the two samples revealed the following differences and similarities (see Figure
8):
Regression of sacrifice-community on antecedents
clusters Sample one Sample two
Demographics
Time *
9%
ns 7%
(marginal,
p < .085)
Strength of attachment ** ns
Number of children ns * (-)
Traits
Agreeableness **
12%
ns
0% Conscientiousness * ns
Neuroticism * ns
Mating Mating in community *** 10% marginal 3%
FIGURE 8: significant values of regression of sacrifice-community on antecedents. Marginal: p < .10; *: p
< .05; **: p< .01; **: p < .001; (-): negative correlation. Percentages represent how much of the variance is
accounted for by the antecedents.
From Figure 8 it can be seen that strength of attachment, time spent in the community,
agreeableness, conscientiousness, and neuroticism of the Big Five accounted for
significant variance in sample one. None of these antecedents reached significance in
sample two. Mating opportunities within the community factor accounted for significant
variance in sacrifice-community in sample one and was marginally significant in sample
two.
Links-organization
The next step in the presentation of the results is to show how the organizational
dimensions of embeddedness compare across the two samples when regressed on the
Page 98
98
antecedents. Regression of links-organization on the antecedent clusters revealed the
following differences and similarities between the samples (see Figure 9):
Regression of links-organization on clusters of antecedents Sample one Sample two
Demographics Age ***
33% ***
38% Strength of attachment ns *(-)
Traits
Extraversion *
15%
ns
17%
Conscientiousness * ns
Compensation ns ** (-)
Motivation Intrinsic Enjoyment ** (-)
ns
(showed
negative
tendency)
Work perceptions
Job investments ***
17%
ns
0% Skills transferability ** (-) ns
Perceived number of alternatives *** (-) ns
Mating Mating in organization ns 0% *** 5%
FIGURE 9: Significant values of regressions of links-organization on antecedents. *: p < .05, **: p< .01,
**: p < .001. (-): negative correlation. Percentages represent how much of the variance is accounted for by
the antecedents.
It appears that age has a very important impact on links-organization in both samples.
Also, extraversion and conscientiousness have positive impact on links-organization in
sample one, but not in sample two. Compensation was the only trait to yield significant
values in sample two. One possible explanation could be the fact that sample two worked
for a large organization, where these traits might not translate so rapidly into relationships
enhancing links-organization. Since a large part of one’s job is performed within a
relatively small department, few connections would be made outside. In contrast, sample
one generally worked for small organizations, which may make these traits more
successful in increasing the number of links within the respective organization.
Also, some of the work perceptions showed significant relationships in sample
one, but failed to reach significance in sample two. One explanation could be the fact that
Page 99
99
organization size mediates the effect of work perceptions on links-organization. These
hypotheses merit further investigation.
Fit-organization
Regression of fit-organization on the antecedents clusters revealed the following
differences and similarities between the samples (see Figure 10)
Regression of fit-organization on clusters of
antecedents Sample one Sample two
Demographics Age ns
4% **
16% Strength of attachment ** *
Traits
Agreeableness ns
15%
**
31%
Conscientiousness ** *
Openness ** (-) ns
Motivation
Extrinsic Outward ** ns
Intrinsic Challenge ns marginal
Work perceptions
Support
Supervisor support ns
47%
**
36%
Organizational
support *** ns
Job investments * **
Alternatives *** (-) marginal
(-)
Mating factors Mating in organization marginal 2% ** 9%
FIGURE 10: Significant values of regressions of fit-organization on antecedents. Marginal: p < .10; *: p <
.05; **: p< .01; **: p < .001; (-): negative correlation. Percentages represent how much of the variance is
accounted for by the antecedents.
From Figure 10 it can be observed that age plays a significant role in sample two but not
in sample one. Strength of attachment plays a significant role in both samples. Also,
conscientiousness plays an important role in both samples, while agreeableness appears
highly significant in sample two. Work perceptions showed significant correlations,
accounting for significant variance in both samples (47% and 36%, respectively). The
only difference in the perceptions about work cluster was that in sample one
Page 100
100
organizational support showed significant correlations, while, in sample two, supervisor
support showed significant correlations. This is an interesting difference. It can be
attributed to the fact that although sample two consisted of people working for the same
organization, they worked for very different divisions with different cultures and
perceptions. It makes sense that organizational micro-level support would be more
salient, rather than overall organizational support. Sample one, on the other hand,
consisted of people working for smaller organizations where people may tend to value
the overall support more, precisely because supervisor support may be negligible (people
report to only one or a few people). A large percentage of people in sample one reported
working for law firms or consulting firms, and very few reported working for very large
organizations. This is why, perhaps, correlations between organizational support and fit-
organization emerged in sample one, and correlations between supervisor support and fit-
organization emerged in sample two.
Perceived number of alternatives emerged as a significant factor in sample one,
and also yielded a marginal effect in sample two. Perceived mating opportunities were in
the predicted direction in both samples significant in sample two, suggesting that this is
an important factor that is generalizable.
Sacrifice-organization
Comparisons of regressions of sacrifice-organization on the antecedents clusters revealed
the following similarities and differences between the samples (see Figure 11).
Page 101
101
Regression of sacrifice-organization on clusters of antecedents Sample one Sample
two
Traits
Big Five
Agreeableness *
6%
(F=1.13
ns)
*
25%
Neuroticism ns **
(-)
Motivation Extrinsic
Outward ns *
Compensation ns *
(-)
Work
perceptions
Skills transferability *
45%
**
51%
Supervisor support *** **
*
Organizational support *** ns
Perceived number of alternatives *** (-) **
(-)
FIGURE 11: Significant values of regressions of sacrifice-organization on antecedents. *: p < .05; **: p<
.01; ***; p < .001; (-): negative correlation. Percentages represent how much of the variance is accounted
for by the antecedents.
Agreeableness showed significant correlations on both samples, and neuroticism showed
a negative correlation in sample two. The perceptions about work cluster correlated
significantly with sacrifice in both samples, with the exception of organizational support,
which did not reach significance in sample two. Skills transferability, supervisor support,
and perceived number of alternatives reached significance in both samples.
Page 102
102
DISCUSSION
The goal of this study was to identify some antecedents of embeddedness. As explained
in the previous sections, I only tried to identify antecedents that related to the individual
and which could be tested through self-reports. I deliberately excluded from these
considerations antecedents that would relate purely to organizations, such as human
resources policies, training systems, technology and access to information, career plans,
compensation, succession plans, etcetera. These organizational factors certainly have an
impact on embeddedness. Succession plans, for instance, which are commonly used by
some companies for certain positions, should have an impact on sacrifice-organization, or
even on fit-organization. A person who is under a succession plan should have an
increased sense of job security along with a clearer view of his/her role in the
organization, which would positively affect the sacrifice-organization and fit-
organization dimensions of embeddedness. A study investigating the role of such
organizational factors in embeddedness would complement this study and add important
knowledge to this topic.
The present study investigated only ‘individual factors’. Individual factors relate
in one way or another to the organizational actor, his/her modes of perceptions and
his/her feelings about various organizational issues. Assessment of these factors utilized
self-reports along with some organizational data collected from the institutions that were
investigated.
The results of these two studies are promising. Most importantly, there is a
reasonable similarity between the two samples in the relationships between antecedents
and various embeddedness dimensions. In the next few paragraphs each of the
Page 103
103
hypotheses will be considered from the perspective of their confirmation or non-
confirmation.
Demographic factors
Age correlated significantly with links-community and accounted for important variance
in links-community in both samples. As predicted in Hypothesis 1A, age should correlate
with links-community because older people would have had more time to integrate better
in their communities, increasing the number of attachments between themselves and
various factors in their respective communities. This prediction was confirmed by the
analyses.
Age was also a predictor of links-organization in both samples. Indeed,
Hypothesis 1B stated that age will be an antecedent of links-organization because older
people would have had more opportunities (time) to create attachments with various
organizational factors. This prediction was confirmed in the analyses.
Number of children was hypothesized to correlate with links-community.
Hypothesis 4A stated that increased number of children should correlate with links-
community because of various activities that relate to children care such as schooling, car
pooling, new friendships with children’s friends’ parents, etcetera. This prediction was
confirmed in the analyses of both samples.
Community tenure was hypothesized to predict embeddedness (Hypothesis 2).
Interestingly, time correlated negatively with fit-community in sample two (Hypothesis
2B predicted a positive correlation), suggesting that over time living in big cities may
actually accentuate the level of misfit with the community, and, in accord with
Hypothesis 2A, showed a positive correlation with sacrifice-community in sample one,
suggesting that various attachments consolidated in time are hard to give up. However,
Page 104
104
given the fact that the correlations did not replicate across the two samples, the effect of
time on embeddedness remains unclear. Further empirical investigation needs to be done
to clarify the role of time on overall embeddedness.
Strength of attachment was hypothesized to correlate with fit-community and
sacrifice-community (Hypotheses 3A and 3B, respectively), as well as with links-
organization (Hypotheses 3C). Though the correlations did not replicate across the two
samples, hypotheses 3A and 3B were confirmed in sample one and hypothesis 3C was
confirmed in sample two. Hypothesis 3C argued that strength of attachment should
negatively correlate with links-organization, because people who are already in a
relationship may be less inclined to spend time with co-workers and actively seeking
friendships (e.g., happy Fridays); this should act against links-organization. This
hypothesis was confirmed in sample two but not in sample one.
Traits and Motivation
Agreeableness emerged as a factor correlating with sacrifice-organization in both
samples. As predicted in Hypothesis 5A agreeable individuals who make friends easily
should find it harder to give all these up and leave. Consequently they should perceive the
sacrifices incurred by leaving as higher. This prediction was confirmed in the analyses.
Hypothesis 5B (‘agreeableness also will also correlate positively with sacrifice-
community’) yielded significant values only in sample one.
Conscientiousness from the Big Five factors yielded significant correlations with
fit-organization in both samples. As predicted, (Hypothesis 5C), conscientious people are
more likely to become involved in various organizational tasks and perform the job at a
high level. Such people apparently have an increased level of fit with the environment
they spend most of their time in.
Page 105
105
Hypothesis 5D predicted that extraversion would correlate with links-
organization. This effect was observed in sample one, but not in sample two. The effect
of extraversion on links-organization is thus unclear, although the trend is in the
anticipated direction.
I had also hypothesized that intrinsic and extrinsic motivations are antecedents of
embeddedness. They are conceptualized as dispositions, affecting the ways in which an
individual is motivated by work. Hypothesis 6A and 6B stated that intrinsic motivation
should correlate with fit-organization, while extrinsic motivation should correlate with
sacrifice organization. These hypotheses were not confirmed in the analyses. Intrinsic and
extrinsic motivations did not yield significant correlations with fit-organization and
sacrifice-organization, but subscales of intrinsic and extrinsic motivation did yield some
significant correlations. Thus, in sample two the compensation subscale of extrinsic
motivation correlated negatively with sacrifice-organization, and the outward subscale of
extrinsic motivation correlated positively with sacrifice organization. Based on these
findings, the effects of intrinsic and extrinsic motivation on embeddedness seem to be
unclear and more research needs to be done to find the roles of these motivations in
embeddedness.
Perceptions about work cluster
Support (organizational support in sample one and supervisor support in sample two)
showed the predicted correlations with fit-organization, consistent with Hypothesis 8B.
People who perceive that their organization supports them should be more likely to
subjectively experience increased levels of fit with the organization and this prediction
was confirmed in the analyses. The fact that organizational support yielded significant
values in sample one and supervisor support yielded significant values in sample two can
Page 106
106
be attributed to the fact that sample two worked for a large departmentalized institution,
in which much more work relationships are taking place within one’s department. Sample
one, in contrast, generally worked for small to medium size companies, where people
generally report to the general manager / CEO who represents the organization as a
whole.
Support (supervisor support) also showed the predicted positive correlations with
sacrifice-organization in both samples. People who perceive that their supervisor is
attentive to their needs and their work satisfaction should find it harder to break the net
and leave (Hypothesis 8A), and this prediction was also confirmed.
Skills transferability showed the predicted correlations with sacrifice-
organization in both samples. Perceiving that the organization is providing one with the
opportunity of developing transferable skills should enhance the value of that
organization (Hypothesis 11A). This prediction was confirmed.
Perceived number of alternatives correlated negatively with fit-organization, as
predicted (Hypothesis 9B). People who have many opportunities to switch jobs should
find it easier to break the net that enmeshes them and leave. This prediction was
confirmed.
Also as predicted, perceived number of alternatives correlated negatively with
sacrifice-organization in both samples. The more job alternatives one has, the less likely
the person will experience a high level of sacrifice-organization (Hypothesis 9A).
Arguably, certain things are less valuable for a person if they are relatively easily
replaceable. This is probably the psychological mechanism at work here.
Job investments correlated with fit-organization in both samples. The more effort
one puts in his/her job, the more likely the person will experience high levels of
embeddedness, in the form of a better fit with the organization (Hypothesis 10A). This
Page 107
107
prediction was confirmed in the analyses, suggesting that the effort one puts in his/her job
is a precursor of fit-organization.
Role ambiguity (Hypothesis 7A) was another antecedent hypothesized to correlate
with embeddedness (more precisely with fit-organization). Role ambiguity showed no
significant correlations in either sample, suggesting that it is not an antecedent of
embeddedness.
Mating
One of the more intriguing findings in this study are the interesting correlations (albeit
predicted) between people’s perceptions of their mating opportunities and embeddedness.
Mating in community correlated significantly with fit-community in both samples.
More mating opportunities relate to an enhanced level of fit with that particular
environment (Hypothesis 12A), a prediction that was confirmed. More mating
opportunities should also be associated with greater perceived sacrifices in the event of
separating from that particular environment (Hypothesis 12B). Indeed, mating in
community emerged as an antecedent of sacrifice-community in both samples, confirming
this hypothesis.
Directly related to the above, mating in organization emerged as an antecedent of
fit-organization in both samples. People who perceive that they have opportunities to find
a mate in the organization they work for experience a higher level of fit with that
organization (Hypothesis 12C). This prediction was also confirmed in the analyses of
both samples.
Page 108
108
CONCLUSIONS, LIMITATIONS AND IMPLICATIONS
Conclusions
The similarities between the samples are informative. When such similarities are found
across different samples, an argument toward generalizability can be made. Based on the
results so far, one can argue that age, number of children, conscientiousness,
agreeableness, job investments, support, skills transferability, perceived number of
alternatives, and perceived mating opportunities in both community and organization are
antecedents of job embeddedness. They were all shown to account for important variation
and to correlate in the predicted direction with various dimensions of job embeddedness
in both samples. Figure 12, which contains only the antecedents found significant in both
samples, illustrates this more clearly.
Notably absent from the empirically derived diagram in Figure 12 is time. Time
has not yielded significant values in both samples for the predicted variables. Time did
correlate with sacrifice-community in sample one, but failed to reach significance in
sample two, and showed a negative correlation with fit-community in sample two. Age
displayed a much stronger effect on embeddedness than time, which suggests that rather
than the time spent in a community, the maturity of a person makes a difference in
embeddedness. Indeed, in hindsight, one can think that even if a person has spent 10
years in an environment, if s/he is still young (e.g., 30 years old) the person would have
the psychological readiness, for example, to relocate from one coast to the other without
incurring high psychological costs. In contrast, a person who is relatively older may find
it harder to manifest such psychological readiness. These assumptions are empirical
questions that merit further investigation.
Page 109
109
Also, extraversion failed to make the list in this diagram. Extraversion was
theorized to correlate with links-organization. Extraversion did correlate significantly
with links-organization in sample one (p < .05), but failed to reach significance in sample
two. Conceivably, extraversion may not necessarily translate into a richer net of
friendships, in the manner of agreeableness. An extraverted individual may actually be
disliked by people. Hence, the relationship between extraversion and embeddedness may
be mediated by agreeableness.
Notably present in the diagram is the mating variable, which yielded strong
correlations and accounted for significant variance in embeddedness in both samples.
One of the weaknesses of this study is an under-emphasis on this variable, which clearly
merits further investigation. Included initially as an exploratory variable which might
well correlate with embeddedness, a pilot study revealed the predicted correlations
between mating and embeddedness. Further research should aim at developing a more
comprehensive ‘biological’ scale, which might target basic evolutionary needs such as
mating and survival and how an organization addresses them. Developing such a scale
may be challenging because some of the items that clearly relate to survival are also
items used in other organizational measures (e.g., salary level), so the possibility of an
overlap may be present. Other items, however, such as an organization’s ability to ensure
the safety of its people when serious events occur (e.g., terrorist attacks) will be less
likely to overlap with other measures, so this avenue clearly has a lot of research
potential. Moreover, including evolutionary-derived concepts in organizational
psychology would bridge a gap between two otherwise unrelated fields, which should
contribute to a more complete understanding of organizational behavior.
Page 110
110
FIGURE 12: Empirically derived antecedents of embeddedness. The continuous line represents
correlations found across both samples. The dotted lines represent highly significant correlations in sample
one (the larger sample), which did not replicate in sample two. Marginal correlations (p < .10) in one
sample and significant in the other sample were considered replications.
Age
Agreeableness
Fit-Organization
Sacrifice-
Organization
Strength of attachment
No of children
Links-
Organization
Sacrifice-
Community
Fit-Community
Links-
Community
Investments
Alternatives
Support
Mating (in community and
organization)
-
Conscient.
+
Skills/Education transferability
Enjoyment (negative)
Page 111
111
Limitations
Although the results of this study are promising, some caveats are in order. A limitation
of this study is that data in the second sample were collected at a single point in time,
thus raising questions about the direction of causality. Furthermore, collecting the data at
two different times does not guarantee the direction of causality either, although it
strengthens such an argument.
Demographics, traits, work perceptions and mating opportunities predict
embeddedness, but one cannot rule out the possibility that embeddedness may affect
some of these variables, especially in the work perceptions cluster. Study one addressed
this deficit in study one, where the endogenous and exogenous variables were
administered at different moments in time. Although the results in sample one strongly
suggest that causality goes from the proposed antecedents to the embeddedness
dimension, longitudinal studies are needed for more rigorous tests of causal direction.
Another deficit of these two studies is that data were obtained only through self-
reports, which may raise questions about the accuracy and objectivity of the responses.
The objectivity of the responses may be affected or influenced by self-enhancement
biases therefore there is a need for studies that collect data from both the actors and
organization insiders. The magnitude of the correlations between variables is unlikely to
be affected by such a bias, but a replication collecting data from various sources would
strengthen the results of this study.
Related to this, another potential issue with the administration of self-reports is
the single-source bias. Single source bias is the tendency to respond in consistent ways
across measures and it is most problematic when the measures lend themselves to
Page 112
112
implicit theories (Morrison, 2002). In these studies the effect of single-source bias should
not be significant, as it is unlikely that people developed implicit theories about
embeddedness, which is a very new construct.
Another potential issue with single-source bias emerges when variables are
measured on similar scales. Although some of the scales used in the present survey were
similar across measures, others were markedly dissimilar (e.g., the scales for intrinsic /
extrinsic motivation, or the scales for the perceived number of alternatives). The
instrument administered to the participants had multiple types of questions and used
various types of scales; therefore, the similarity of the scales should not constitute an
issue.
Another limitation concerns the sample size in both studies. Complex models like
the present one are difficult to test with small samples. Multiple regression models were
used to test how much variance could be accounted for by the antecedents for each of the
dependent variables. However, it would have been more informative to test the entire
model at once, not parts of it at a time, and for this one would have had to use structural
equation modeling. This was not possible in these studies, because a model of the
complexity I proposed would require a sample size of 1000-1200 subjects to make the
structural equation modeling approach feasible.
Yet another limitation of these studies is the operationalization of the mating
variable proposed as an antecedent to embeddedness. Initially introduced for exploratory
purposes the dimension was retained and included in the final model because of the
significant correlations it yielded in a pilot study. This variable was operationalized
through two items, one targeting perceived mating opportunities within the organization,
another targeting perceived mating opportunities within the community. Scales
containing just one or two items are subject to criticism in the literature. A follow up
Page 113
113
study should aim at operationalizing mating by including a reasonable number of items
generated in the paradigm of evolutionary psychology. The fact that this factor yielded
significant correlations despite the very small number of items is encouraging and reveals
the potential benefits of applying insights from evolutionary psychology to organizational
psychology.
Another limitation of this study is the response rate in sample two. Sample one
had a virtually 100% response rate, while sample two yielded 25% response rate. Not
surprisingly, more significant correlations were generated by sample one. One
explanation is the fact that sample one was more heterogeneous than sample two.
Respondents in the sample two could have been more homogeneous, which would reduce
variability and magnitude of the correlations. Follow up studies should aim at
administering the survey to much larger samples and come with the necessary resources
to ensure high response rates. This would address any inconsistencies found in the two
groups (e.g., variables that correlated with embeddedness in one group but did not
correlate with embeddedness in the other group).
Yet another limitation of these studies is the fact that both samples were located in
North America, which raises questions about cross-cultural generalizability. I have tried
to minimize this issue by administering the instrument to two very different populations,
and sample one in particular was very ethnically heterogeneous. However, cross-cultural
generalizability still remains an issue, and follow up studies should test the
embeddedness construct, and the antecedents, in other cultures.
Despite these caveats, these two studies clearly show that there are many factors
that have an important impact on embeddedness. Despite the sample sizes, significant
correlations were obtained between various proposed antecedents and embeddedness in
both samples. The fact that these correlations were obtained in two very different samples
Page 114
114
is an argument toward generalizability. When two different groups answer similarly to a
set of questions, the argument that their responses are not greatly influenced by their
group membership can be made.
Implications for further research
In the previous studies that addressed embeddedness, the effects of race and gender have
not been documented, or have tested negative. As gender and race have sometimes
important roles in work/family attitudes, it is important to analyze whether these
variables play any roles in the two samples that have been under investigation in the
present study.
As described earlier, sample one was very heterogeneous (see Figure 13): race
distribution was roughly the same between Whites, Blacks, and Hispanics. Sample two,
on the other hand, was much more homogeneous, consisting mostly of Whites (see
Figure 14).
Race
2.3%
.6%
2.3%
37.2%
28.5%
29.1%
Missing
Other (specify)
Asian
Hispanic
Black
White
Figure 13. Race distribution in sample one
Page 115
115
Race
.8%
9.6%
8.0%
8.8%
72.8%
Other (specify)
Asian
Hispanic
Black
White
Figure 14. Race distribution in sample two.
An exploratory analysis of variance was performed for both samples. In neither sample
gender yielded significant correlations with overall embeddedness (see Appendix 4A and
4B). However, in both samples race correlated significantly with overall embeddedness
(F = 2.61, p < .03, df = 4 for sample one, F = 8.28, p < .000, df = 4 for sample two,
respectively) (see Appendix 4A and Appendix 4B, respectively). Asians reported the
highest level of embeddedness in sample one, closely followed by Whites (see Figure
15). In sample two, Whites reported the highest embeddedness level, closely followed by
Asians. In both samples Hispanics and Blacks reported lower levels of embeddedness
that Whites and Hispanics.
These findings are interesting and may constitute an avenue for further research.
There are a few possible explanations for the effects of race on embeddedness. One
possible explanation is that social networks differ as a function of race (and gender).
Perhaps the characteristics of these social networks make a group more likely to
experience higher embeddedness levels. Another possible explanation is that perhaps a
factor, which was not explored in this study, influences both embeddedness and race,
and, as a consequence, race appears related to embeddedness, while in fact the effect
should be attributed to this factor. One possible such factor is salary: There are well-
known differences in salary levels by race (with Whites and Asians typically earning
more than Hispanics and Blacks), and one might speculate that salary correlates with
embeddedness. Another possible such factor is job status. Whites and Asians typically
Page 116
116
have higher-level jobs (which usually correlate with higher salaries) then the other major
race categories. Higher-level jobs usually come with increased responsibilities, more
influence, and greater number of work contacts. All these should correlate with
embeddedness. All these are speculations that merit further investigation, but clearly the
effect of race on embeddedness should be analyzed in the context of some other
organizational and social factors that might influence embeddedness.
Practical implications of these studies
The present study has taken a recent development in turnover research – embeddedness –
and analyzed it in the light of its possible antecedents. Embeddedness is primarily a
construct that taps into the likelihood of leaving/staying with an organization, and higher
embeddedness levels were shown to correlate with lower voluntary turnover levels. In the
previous pages a comprehensive literature review of voluntary turnover was presented,
along with a description of the embeddedness construct and an analysis of its antecedents.
Embeddedness can be increased through a series of organizational measures, such
as instituting a mentorship system, or increasing the number of work teams an individual
participates in. Since embeddedness is directly related to actual turnover, implementing
measures that increase embeddedness will have a negative effect on turnover.
The present study makes a step further in the voluntary turnover research, in that
it illustrates the factors that may lead to higher levels of embeddedness. Some of these
factors constitute stable personality traits which can be assessed prior to the
organizational entry. Others are factors which can be manipulated after the organizational
entry. In practical terms, actual turnover can be affected by personnel selection
procedures that put into the equation variables that have been shown to predict
embeddedness.
Page 117
117
A quick glimpse at Figure 12 reveals that, in practice, people likely to become
embedded are those who score highly on agreeableness and conscientiousness, as well as
those who perceive that the organization supports them, and those who believe that their
skills are transferable. The Big Five traits can be assessed prior to the organizational
entry, using short self-reports such as the BFI. Selecting people who score highly on
agreeableness and conscientiousness may be one method of selecting people likely to
become embedded. After the organizational entry, one possible way to increase
embeddedness is by increasing organizational and supervisor. Figure 12 also suggests
that training people to become highly specialized in a transferable domain (which works
by increasing sacrifice-organization) may be another method to increase embeddedness.
Yet another method implied in Figure 12 is selection of people who perceive that they
don’t have many job alternatives.
Of course, a legitimate question arises: is reducing voluntary turnover beneficial
in all cases? Should an organization aim at zero voluntary turnover? The answer to both
questions is no. Voluntary turnover can be beneficial in certain instances. For example,
voluntary turnover allows those in secondary job markets to penetrate in primary
markets. Also, voluntary turnover can be beneficial for the organizational bottom line, for
instance when seniors are replaced with younger, motivated, and less expensive,
employees. From this perspective, an organization should not aim at trying to reduce
voluntary turnover to zero. Instead, it should aim at retaining its most highly valued
employees.
Knowing how to manipulate various dimensions of embeddedness, as well
knowing how to select from among job candidates those who are more likely to become
embedded in the organization is one way to ensure that key employees won’t leave when
the organization needs them most.
Page 118
118
REFERENCES
Abbasi, S. M. & Hollman, K. W. (2000). Turnover: The real bottom line. Public Personnel
Management Washington. 29, 333-342.
Abelson, M. A. (1987). Examination of avoidable and unavoidable turnover. Journal of Applied
Psychology, 72, 382-386.
Abelson, M. A. & Baysinger, B. D. (1984). Optimal and dysfunctional turnover: Toward an
organizational level model. Academy of Management Journal, 9, 331-3341.
Ajzen I., & Fishbein, M. (1977). Attitude-behavior relations: A theoretical analysis and review of
empirical research. Psychological Bulletin, 84, 888-918.
Allen, N. J., & Meyer, J. P. (1990). The measurement and antecedents of affective, continuance,
and normative commitment to the organization. Journal of Occupational Psychology, 63, 1-18.
Amabile, T. M., Hill, Karl, G., Hennessey, B. A. & Tighe, E. M. (1994). The work preference
inventory: Assessing intrinsic and extrinsic motivational orientations. Journal of Personality and Social
Psychology, 66, 950-967.
Ashforth, B. E. (1998). Epilogue: What does the concept of identity add to organization science.
In D. A. W a P. C. Godfrey (Ed.), Identity in Organizations: Building theory through conversations (pp.
273 –294). Thousand Oaks, CA: Sage.
Bannister, B. D., & Griffeth, R. W. (1986). Applying a causal analytic framework to the Mobley,
Horner, and Hollingsworth (1978) turnover model: A useful reexamination. Journal of Management, 12,
433-443.
Barrick, M. R., & Mount, M. K. (1991). The big five personality dimensions and job performance:
A meta-analysis. Personnel Psychology, 44, 1-26.
Barrick, M. R., & Mount, M. K. (1996). Effects of impression management and self-deception on
the predictive validity of personality constructs. Journal of Applied Psychology, 81, 261-272.
Beard, F. K. (1999). Client role ambiguity and satisfaction in client-ad agency relationships.
Journal of Advertising Research, 39, 69-78.
Becker, G. S. (1991). A treatise on family. Cambridge, MA: Harvard University Press.
Becker, T. E. (1992). Foci and bases of commitment: Are they distinctions worth making?
Academy of Management Journal, 35, 232-244.
Blau, G. (1993). Further exploring the relationship between job search and voluntary individual
turnover. Personnel Psychology, 46, 313-330.
Blau, G. (1994). Testing a two-dimensional measure of job search behavior. Organizational
Behavior and Human Decision Processes, 59, 288-312.
Blegen, M. A., Mueller, C. W., & Price, J. L. (1988). Measurement of kinship responsibility for
organizational research. Journal of Applied Psychology, 73, 402 – 409.
Page 119
119
Boudreau, J. W. & Berger, C. J. (1985). Decision –theoretical utility analysis applied to employee
separations and acquisitions. Journal of Applied Psychology, 70, 581-612.
Boudreau, J. W., Boswell, W. R., Judge, T. A. & Bretz Jr., R. D. (2001). Personality and cognitive
ability as predictors of job search among employed managers. Personnel Psychology, 54, 25-50.
Bray, S. R. (1998). Role efficacy within interdependent teams: Measurement development and
tests of theory. Unpublished doctoral dissertation, University of Waterloo, Waterloo, Ontario, Canada.
Bretz, R. D., Boudreau, J. W. & Judge, T. A. (1994). Job search behavior of employed managers.
Personnel Psychology, 47, 275-301.
Brown, J. (2000). Employee turnover costs billions annually. Computing Canada Willowdale. 26,
25.
Buss, D. (1999). Evolutionary psychology: The new science of the mind. Needham Heights, MA
02494: Allyn & Bacon.
Campion, M.A. (1991). The meaning and measurement of turnover: A comparison of alternative
measures and recommendations. Journal of Applied Psychology, 76, 199-212.
Carsten, J.M., & Spector, P. E. (1987). Unemployment, job satisfaction, and employee turnover: A
meta-analytic test of the Muchinsky model. Journal of Applied Psychology, 72, 374-381.
Chan, D. (1996). Cognitive misfit of problem-solving style at work. A facet of person-
organization fit. Organizational Behavior and Human Decision Processes, 68, 194-207.
Chatman, J. A. (1989). Improving interactional organizational research: A model of person-
organization fit. Academy of Management Review, 14, 333-349.
Chatman, J. A. (1991). Matching people and organization: Selection and socialization in public
accounting firms. Administrative Science Quarterly, 36, 459-484.
Cohen S. G. & Bailey, D. E. (1997). What makes teams work: Group effectiveness research from
the shop floor to the executive suite. Journal of Management, 23, 239-290.
Cohen, A (1995). An examination of the relationships between work commitment and nonwork
domains. Human Relations, 48, 239-263.
Costa, P. T., & McCrae, R. R. (1992). The NEO-PI Personality Inventory. Odessa, Fla:
Psychological Assessment Resources.
Cotton, J. L., & Tuttle, J. M. (1986). Employee turnover: A meta-analysis and review with
implications for research. Academy of Management Review,11, 55-70.
Dalessio, A., Silverman, W. H., & Schuck, J. R. (1986). Paths to turnover: A re-analysis and
review of existing data on the Mobley, Homer, and Hollingsworth turnover model. Human Relations, 39,
245-263.
Dalton, D. R., Todor, W. D. & Krackhardt, D. M. (1982). Turnover overstated: The functional
taxonomy. Academy of Management Journal, 7, 117-123.
deCharms, R. (1968). Personal causation: The internal affective determinants of behavior. San
Diego, CA: Academic Press.
Deci, E. L., & Ryan, R. M. (1985a). Intrinsic motivation and self-determination in human
behavior. New York: Plenum Press.
Page 120
120
Deci, E. L., & Ryan, R. M. (1985b). The General Causality Orientation Scale: Self-determination
in personality. Journal of Research in Personality, 19, 109-134.
Dickter, D. N., Roznowski, M., & Harrison, D. A. (1996). Temporal tempering: An event history
analysis of the process of voluntary turnovers. Journal of Applied Psychology, 81: 705-716.
Downey, D. B. (1995). When bigger is not better: Family size, parental resources, and children’s
educational performance. American Sociological Review, 60, 746-761.
Dyer L. (1973). Job search success of middle-aged managers and engineers. Industrial and Labor
Relations Review, 26, 969-979.
Eisenberger, R., Cummings, J., Armeli, S., & Lynch, P. (1997). Perceived organizational support,
discretionary treatment, and job satisfaction. Journal of Applied Psychology, 82, 812-820.
Eisenberger, R., Fasolo, P., & Davis-LaMastro, V. (1990). Perceived Organizational support and
employee diligence, commitment, and innovation. Journal of Applied Psychology, 75, 51-59.
Eisenberger, R., Huntington, R., Hutchinson, S. & Sowa, D. (1986). Perceived organizational
support. Journal of Applied Psychology, 71, 500-507.
Eisenberger, R., Stinglhamber, F., Vandenberghe, C., Sucharski, I. & Rhoades, L. (2002).
Perceived supervisor support: contributions to perceived organizational support and employee retention.
Journal of Applied Psychology, 87, 565-573.
Facteau, J. D., Dobbins, G. H., Russell, J.E.A., Ladd, R. T. & Kudisch, J. D. (1995). The influence
of general perceptions in the training environment or pretraining motivation and perceived training transfer,
Journal of Management, 21, 1-25.
Farrell, D., & Rusbult, C. E. (1981). Exchange variables as predictors of job satisfaction, job
commitment, and turnover. The impact of rewards, costs, alternatives, and investments. Organizational
Behavior and Human Performance, 28, 78-95.
Feather N, O'Brien G. (1986). A longitudinal study of the effects of employment and
unemployment on school leavers. Journal of Occupational Psychology, 59, 121-144.
Finegold, D., Mohrman, S. & Spreitzer,G. M. (2002). Age effects on the predictors of technical
workers' commitment and willingness to turnover. Journal of Organizational Behavior. 23, 655-674
Fishbein, M. & Azjen, I. (1975). Belief, attitude, intention, and behavior. Reading, MA: Addison-
Wesley.
Fishbein, M. (1967). Attitude and the prediction of behavior. In M. Fishbein (Ed.), Readings in
attitude theory and measurement. New York: Wiley.
Folger, R., & Konovsky, M. A. (1989). Effects of procedural and distributive justice on reactions
to pay-rise decisions. Academy of Management Journal, 32, 115-130.
Forrest, C. R., Cummings, L. L. & Johnson, A. C. (1977). Organizational participation: A critique
and model. Academy of Management Review, 2, 586-601.
Fried, Y., & Tiegs, R. B. (1995). Supervisors' role conflict and role ambiguity differential relations
with performance ratings of subordinates and the moderating effect of screening ability. Journal of Applied
Psychology, 80, 282-291.
Page 121
121
Gerhart, B. (1990). Voluntary turnover and alternative job opportunities. Journal of Applied
Psychology, 75, 467-476.
Gooley, T.B. (2001). How to keep good people. Logistics Management and Distribution Report
Radnor, 40, 55-60.
Grand, R. R., & Carton, A. V. (1982). Development of a team climate questionnaire. In
Proceedings of the Annual Conference of the Canadian Society for Psychomotor Learning and Sport
Psychology, Edmonton, Alberta (pp. 217-229).
Griffeth , R. W., Hom, P. W., & Gaertner, S. (2000). A meta-analysis of antecedents and
correlates of employee turnover: Update, moderator tests, and research implications for the millennium.
Journal of Management, 26, 463-488.
Gupta, N. & Jenkins, G. D. (1980). The structure of withdrawal: Relationships among
estrangement, tardiness, absenteeism, and turnover. Springfield, VA: National Technical Information
Service.
Hammer, W. C., & Tosi, H. L. (1974). Relationship of role conflict and role ambiguity to job
involvement measures. Journal of Applied Psychology, 59, 497-499.
Harter, S. (1981). A new self-report scale of intrinsic versus extrinsic orientation in the classroom:
Motivational and informational components. Developmental Psychology, 17, 300-312.
Hennessey, B. A., Amabile, T. M. & Martinage, M. (1989). Immunizing children against the
negative effects of reward. Contemporary Educational Psychology, 14, 212-227.
Hom, P. W. & Griffeth, R. W. (1991). Structural equations modeling test of a turnover theory:
Cross-sectional and longitudinal analysis. Journal of Applied Psychology, 76, 350-366.
Hom, P. W., & Griffeth, R. W. (1995). Employee turnover. Cincinnati, OH: South-Western
College Publishing.
Hom, P. W., Caranikas-Walker, F., Prussia, G. E., & Griffeth, R. W. (1992). A meta-analytical
structural equations analysis of a model of employee turnover. Journal of Applied Psychology, 77, 890-
909.
Hom, P. W., Griffeth, R. W., & Sellaro, C. L. (1984). The validity of Mobley’s 1977 model of
employee turnover. Organizational Behavior and Human Performance, 34, 141 – 174.
Hulin, C. L. (in press). Lessons from industrial and organizational psychology. In J. Brett & F.
Drasgow (Eds.), The psychology of work: theoretically based empirical evidence. Mahwah, NJ: Lawrence
Erlbaum Associates.
Hulin, C. L. (1991). Adaption, persistence, and commitment in organizations. In M. Dunnete & L.
Hough (Eds), Handbook of Industrial and Organizational Psychology. (2nd edn, pp. 445-507). Palo Alto,
CA: Consulting Psychologists Press.
Hulin, C. L., Roznowski, M., & Hachiya, D. (1985). Alternative opportunities and withdrawal
decisions: Empirical and theoretical discrepancies and an integration. Psychological Bulletin, 97, 233-250.
Hunter JE. (1986). Cognitive ability, cognitive aptitudes, job knowledge, and job performance.
Journal of Vocational Behavior 29, 340-362.
Page 122
122
Hutchison, S. (1997a). A path model of perceived organizational support. Journal of Social
Behavior and Personality, 12, 159-174.
Hutchison, S. (1997b). Perceived organizational support: Further evidence of construct validity.
Educational and Psychological Measurement, 57, 1025-1034.
Jackofsky, E. F., & Peters, L. H. (1983). The hypothesized effects of ability in the turnover
process. Academy of Management Review, 8: 46-49.
Jackson, S. E., & Schuler, R. S. (1985). A meta-analysis and conceptual critique of research on
role ambiguity and role conflict in work settings. Organizational Behavior and Human Decision Processes,
36, 16-78.
Jaros, S. J. (1997). An assessment of Meyer and Allen’s (1991) three component model of
organizational commitment and turnover intentions. Journal of Vocational Behavior, 51, 319-337.
Jaros, S. J., Jermier, J. M., Koehler, J. W. & Sincich, T. (1993). Effects of continuance, affective,
and moral commitment on the withdrawal process. Academy of Management Journal, 5, 951-995.
John, O. P., Donahue, E. M., & Kentle, R. L. (1991). The Big Five Inventory – Versions 4a and
54. Berkeley, CA: University of California, Berkeley, Institute of Personality and Social Research.
Kahn, R. L., Wolfe, D. M., Quinn, R. P, Snoek, J. D., & Rosenthal, R. A. (1964). Organizational
stress: Studies in role conflict and ambiguity. New York: John Wiley.
Kanfer R, & Hulin C. (1985). Individual differences in successful job searches following layoff.
Personnel Psychology, 38, 835-847.
Kerr, J. & Slocum, J. W. (1987). Managing corporate culture through reward system. Academy of
Management Executive, 1, 99-108.
Kopelman, R. E., Rovenpor, J. L., & Millsap, R. E. (1992). Rationale and construct validity
evidence for the Job Search Behavior Index: Because intentions (and New Year’s resolutions) often come
to naught. Journal of Vocational Behavior, 40, 269-287.
Kottke, J. L., & Sharafinski, C. E. (1988). Measuring perceived supervisory and organizational
support. Educational and Psychological Measurement, 48, 1075-1079.
Kristof, A. L. (1996). Person –organization fit: An integrative review of its conceptualizations,
measurement, and implications. Personnel Psychology, 49, 1-49.
Law, K.S., Wong, C.S. & Mobley, W.H. 1998. Toward a taxonomy of multidimensional
constructs. Academy of Management Review, 23, 741-755.
Lee, T. L., Mitchell, T. R., Wise, L., & Fireman, S. (1996). An unfolding model of voluntary
employee turnover. Academy of Management Journal, 39, 5-36.
Lee, T. W. & Maurer, S. D. (1999). The effects of family structure on organizational commitment,
intention to leave and voluntary turnover. Journal of Managerial Issues, 4, 493-513.
Lee, T. W. & Mitchell, T. R. (1994). An alternative approach: The unfolding model of voluntary
employee turnover. Academy of Management Review, 19, 51-89.
Lee, T. W., & Maurer, S. (1999). The effects of family structure on organizational commitment,
intention to leave and voluntary turnover. Journal of Managerial Issues, 11, 493-513.
Page 123
123
Lee, T. W., & Mowday, R. T. (1987). Voluntary leaving an organization: An empirical
investigation of Steers and Mowday’s model of turnover. Academy of Management Journal, 30, 721-743.
Lee, T. W., Mitchell, T. R., Holtom, B. C., McDaniel, L. S., & Hill, J. W. (1999). Theoretical
development and extension of the unfolding model of voluntary turnover. Academy of Management
Journal, 42, 450-462.
Lee, W. T., Mitchell, T. R., Sablynski, C. J., Burton, J. P., & Holtom, B. C. (2002). Job
embeddedness: A replication and extension. Under review, Academy of Management Journal.
Lepper, M., & Greene, D. (1978). Overjustification research and beyond: Toward a means-ends
analysis of intrinsic and extrinsic motivation. In M. Lepper & D. Greene (Eds.), The hidden costs of reward
(pp. 109-148). Hillsdale, NJ: Erlbaum.
Lewin, K. (1951). Field theory in social sciences. New York: Harper.
MacCallum, R. C., & Browne, M. W. (1993). The use of causal indicators in covariance structure
models: Some practical issues. Psychological Bulletin, 114, 533-541.
Maertz, C. P., & Campion, M. A. (1998). 25 years of voluntary turnover research: A review and
critique. International Review of Industrial and Organizational Psychology, 13, 49 – 81.
March, J.G. & Simon, H.A. (1958). Organizations. New York: Wiley.
Marshall, J. (2001). Employee retention linked to better customer service. Financial Executive.
Morristown 17, 11-12.
McDaniel, M. A., Whetzel, D. L., Schmidt, F. L., & Maurer, S. D. (1994). The validity of
employment interviews: A comprehensive review and Meta-analysis. Journal of Applied Psychology, 79,
599-616.
Meyer, J.P, Stanley, D. J., Herscovitch, L. & Topolnytsky, L. (2002). Affective, continuance, and
normative commitment to the organization: a meta-analysis of antecedents, correlates, and consequences.
Journal of Vocational Behavior, 61, 20-52.
Meyer, J.P., & Allen, N. J. (1997). Commitment in the workplace. Thousand Oaks, CA: Sage
Publications, Inc.
Michaels, C. E. & Spector, P. E. (1982). Causes of employee turnover: A test of the Mobley,
Griffeth, Hand and Meglino model. Journal of Applied Psychology, 67, 53-59.
Miller, S. J. (1976). Family life cycle, extended family orientations, and aspirations as factors in
the propensity to migrate. The Sociological Quarterly, 17, 323-335.
Mirvis, P. H. & Lawler, E. E. (1977). Measuring the functional impact of employee attitudes.
Journal of Applied Psychology, 62, 1-8.
Mitchell, T.R., Holtom, B.C., Lee, T.W., Sablynski, C.J. & Erez, M. (2001). Why people stay:
Using job embeddedness to predict voluntary turnover. Academy of Management Journal, 44.
Mitra, A., Jenkins, G. D. & Gupta, N. (1992). A meta-analytic review of the relationship between
absence and turnover. Journal of Applied Psychology, 77, 879-889.
Mobley, W. H. (1977). Intermediate linkages in the relationship between job satisfaction and
employee turnover. Journal of Applied Psychology, 62, 237-240.
Page 124
124
Mobley, W. H., Griffeth, R., Hand, H. & Meglino, B. (1979). Review and conceptual analysis of
the employee turnover process. Psychological Bulletin, 86, 493-522.
Morrison, E. W. (2002). Newcomers’ relationships: The role of social network ties during
socialization. Academy of Management Journal, 45, 1149-1160.
Muchinsky, P. M. & Morrow, P. (1980). A multidisciplinary model of voluntary employee
turnover. Journal of Vocational Behavior, 14, 43-77.
Nelson, D. L., & Quick, J. C. (2003). Organizational behavior: foundations, realities, and
challenges. Fourth edition. South-Western: Ohio.
Newman, J. (1974). Predicting absenteeism and turnover: A field comparison of Fishbein’s model
and traditional job attitude measures. Journal of Applied Psychology, 59, 610-615.
O’Reily, C. A., Caldwell, D. F., & Barnett, W. P. (1989). Work group demography, social
integration and turnover. Administrative Science Quarterly, 34, 21-37.
Prestholdt, P. H., Lane, I. M. & Matthews, R. C. (1987). Nurse turnover as reasoned action:
Development of a process model. Journal of Applied Psychology. 72, 221-227.
Price, J.L., & Mueller, C. W. (1981). Professional Turnover. Bridgeport, CT: Luce
Randall, D. (1993). Cross-cultural research on organizational commitment. A review and
application of Hofstede’s value survey module. Journal of Business Research, 26, 91-110.
Reichers, A. (1985). A review and reconceptualizaton of organizational commitment. Academy of
Management Review, 10, 465-476.
Rhoades, L., Eisenberger, R., & Armeli, S. (2001). Affective commitment to the organization: The
contribution of perceived organizational support. Journal of Applied Psychology, 86, 825-836.
Rizzo, J. R., House, R. J., & Lirtzman, S. 1. (1970). Role conflict and ambiguity in complex
organizations. Administrative Science Quarterly, 15, 150-163.
Robinson, S. L., Kraatz, M. S. & Rousseau, D. M. (1994). Changing obligations and the
psychological contract: A longitudinal study. Academy of Management Journal, 37, 137-152.
Rosse, J. G. & Hulin, C. L. (1985). Adaption to work: An analysis of employee health, withdrawal
and change. Organizational Behavior and Human Decision Processes, 36, 324-347.
Rosse, J. G. & Miller, H. (1984). An adaption cycle interpretation of absence and withdrawal. In
P. Goodman & R. S. Atkin (Eds), Absenteeism: new approaches to understanding, measuring, and
managing employee absence (pp. 194-228). San Francisco: Jossey-Bass.
Rosse, J. G. (1988). Relations among lateness, absence, and turnover: Is there a progression of
withdrawal? Human Relations, 41, 517-531.
Rousseau, D. M. (1989). Psychological and implied contracts in organizations. Employee Rights
and Responsibilities Journal, 2, 121-139.
Royalty, A. B. (1998). Job-to-job and job-to-unemployment turnover by gender and educational
level. Journal of Labor Economics, 16, 392-443.
Rusbult, C. E. & Farrell, D. (1983). A longitudinal test of the investment model: The impact on
job satisfaction, job commitment and turnover of variations in rewards, costs, alternatives and investments.
Journal of Applied Psychology, 68, 429-438.
Page 125
125
Saks, A. M., & Ashforth, B. E. (1997). A longitudinal investigation of the relationships between
job information sources, applicant perceptions of fit, and work outcomes. Personnel Psychology, 50, 395-
426.
Salgado, J. F. (1997). The Five Factor model of personality and job performance in the European
community. Journal of Applied Psychology, 82, 30-43.
Schmidt, F. L., Ones, D. S., Hunter, J.E. (1992). Personnel selection. Annual Review of
Psychology; 43, 627-670.
Schmidt, F. L. & Rader, M. (1999). Exploring the boundary conditions for interview validity:
Meta-analytic validity findings for a new interview type. Personnel Psychology, 52, 445-464.
Schneider, B. (1987). The people make the place. Personnel Psychology, 40, 437-443.
Seligman D. (1997). Brains in the office. Fortune, 135 - 138.
Shaffer, M. A., & Harrison, D. A. (1998). Expatriates’ psychological withdrawal from
international assignments: Work, non-work, and family influences. Personnel Psychology, 51, 87-118.
Shaw, J.D., Delery, J. E., Jenkins, G. D., & Gupta, N. (1998). An organization-level analysis of
voluntary and involuntary turnover. Academy of Management Journal, 41, 511-525.
Sheridan, J. E. (1992). Organizational culture and employee retention. Academy of Management
Journal, 35, 1036-1056.
Shore, L. M., & Shore, T. H. (1995). Perceived organizational support and organizational justice.
In R. S. Cropanzano & K. M. Kacmar (Eds.), Organizational politics, justice, and support: Managing the
social climate of the workplace (pp. 149-164). Westport, CT: Quorum.
Shore, L. M., & Tetrick, L. E. (1991). A construct validity study of the survey of perceived
organizational support. Journal of Applied Psychology, 76, 637-643.
Shore, L. M., & Wayne, S. J. (1993). Commitment and employee behavior: Comparison of
affective commitment and continuance commitment with perceived organizational support. Journal of
Applied Psychology, 78, 774-780.
Spector, P. E. (1997). Job satisfaction. Thousand Oaks, CA: Sage Publications, Inc.
Spitz, G. (1986). Family migration largely unresponsive to wife’s employment: (across age
groups). Sociology and Social Research, 70, 231-234.
Steel, R. P. & Griffeth, R. W. (1989). The elusive relationship between perceived employment
opportunity and turnover behavior. A methodological or conceptual artifact. Journal of Applied
Psychology, 74, 846-854.
Steel, R. P. & Ovalle, N. (1984). A review and meta-analysis of research on the relationship
between behavioral intentions and employee turnover. Journal of Applied Psychology, 69, 673-686.
Steers, R. M., & Mowday, R. T (1981). Employee turnover and postdecision accommodation
processes. In L. Cummings & L. Staw (Eds.) Research in Organizational Behavior, 3, 235-281.
Tesluk, P.E., Farr, J. L. Mathieu, J. E. and Vance, R. J. (1995). Generalization of employee
Involvement training to the job setting: Individual and situational effects. Personnel Psychology, 48, 607-
632.
Page 126
126
Tett, R. P. & Meyer, J. P. (1993). Job satisfaction, organizational commitment, turnover intention,
and turnover: Path analyses based on meta-analytical findings. Personnel Psychology, 46, 259-293.
Thornton, A. (1991). Influence of the marital history of parents on the marital and cohabitational
experiences of children. American Journal of Sociology, 96, 868-894.
Trevor, C. O. (2001). Interactions among actual ease-of-movement determinants and job
satisfaction in the prediction of voluntary turnover. Academy of Management Journal, 44, 621-638.
Triandis, H. C. (1975). Culture training, cognitive complexity, and interpersonal attitudes. In R.
Brislin, S. Bochner & W. Lonner (Eds), Cross-cultural perspectives on learning (pp. 39-77). Beverly Hills,
CA and New York: Sage and Wiley/Halsted.
Turban, D. B., Campion, J. E., & Eyring, A. R. (1992). Factors relating to relocation decisions of
research and development employees. Journal of Vocational Behavior, 41, 183 – 199.
Ulrich, D., Halbrook, R., Meder, D., Stuchlik, M., & Thorpe, S. (1991). Employee and customer
attachment. Synergies for competitive advantage. Human Resource Planning 14, 89-103.
Van Dyne, L., Cummings, L.L. & McLean-Parks, J. (1995). Extra-role behaviors: In pursuit of
construct and definitional clarity (a bridge over muddied waters). Research in Organizational Behavior, 17,
215-285.
Villanova, P., Bernardin, H., Johnson, D., & Dahmus, S. (1994). The validity of a measure of job
compatibility in the prediction of job performance and turnover of motion picture theater personnel.
Personnel Psychology, 47, 73-90.
Werbel, J. D., & Gilliland, S. W. (1999). The use of person-environment fit in the selection
process. In G. Ferris (Ed.), Research in personnel and human resources management (Vol. 17). Greenwich,
CT: JAI Press.
Whetten, D. A., & Godfrey, P. C. (1998). Identity in organizations: Building theory through
conversations. Thousand Oaks, CA: Sage.
Witkin, H. A., Moore, C. A., Goodenough, D. R. & Cox, P. W.(1977). Field-Dependent and Field-
Independent Cognitive Styles and their Educational Research. Review of Educational Research, 47, 1-64
Page 127
127
APPENDICES
THANK YOU FOR ACCEPTING TO PARTICIPATE IN THIS STUDY!
This study addresses the relationships between various attitudes toward/perceptions about work and
oneself.
You will have to fill out a questionnaire which is split in two parts: the first part is being administered now;
the second part will be administered to you after three-four weeks.
Your answers will remain only in my possession and are completely confidential. You will not be
identified in any way. We are asking you for personal identification with the sole reason of being able to
contact you after several weeks with the second part of the questionnaire.
The survey takes approx 30-40 minutes to complete in total. The first part of it takes approx 15-20 minutes
to complete, the second part takes approx 10 minutes to complete. Please be honest in your answers, as they
will greatly help us understand the complex relationships between various factors that influence us at work.
PLEASE PRINT
Your name: __________________________________________________________________
Your email address: ___________________________________________________________
Your phone number: __________________________________________________________
Your job title: _______________________________________________________________
Do you have a full-time job (defined as working at least 35hrs/week for the same organization)?
Yes No
PLEASE TELL US THE NAME OF THE PERSON WHO REFERRED YOU TO US:
_________________________________________________
Please circle or write the response that best represents
you
Page 128
128
Biographical and Demographic Data
1. What is your gender? Male Female
2. Marital status (circle one): Married Never married
(Single)
Divorced Not
married but
attached
Not
divorced
but
separated
Other
(specify)
3. If you are married or cohabitating, does your
spouse/partner work outside the home?
Full-time
Part-time No N/A
4. Please tell us your race (circle one) White Black Hispanic Asian Other
(Specify)
5. What was your age at your last birthday?
_______
6. Please tell us the ages of your children, if you
have any.
_______
_______
_______
_________
__
7. How long have you lived in your community?
(years)
_______
8. Do you own the home you live in? (mortgaged or
outright)
Yes No
9. How many organizations do you belong to in the
community? (PTA, Little League, church, Boy or
Girl Scouts, etcetera)
None
1 2 3 3 +
10. How long have you worked in the industry your
are now? (years)
_______
11. How long have you worked for your
organization? (years)
_______
12. How long have you been in your present
position? (years)
_______
13. How many coworkers are highly dependent on
you?
None 1-2 3-5 6-10 10 +
14. How many work teams are you on? None 1-2 3-5 6-10 10 +
15. How many work committees are you on? None 1-2 3-5 6-10 10 +
16. What is the highest level of education you
achieved?
Some high school
High
school
Some
college
BA/BS Advanced
degree
Page 129
129
BFI Here are a number of characteristics that may or
may not apply to you. For example, do you agree
that you are someone who likes to spend time with
others? Please mark the answer that best represents
you.
I SEE MYSELF AS SOMEONE WHO:
Strongly
Disagree
Disagree
Neither Agree nor
Disagree
Agree
Strongly
Agree
1. Is talkative
2. Tends to find fault with others
3. Does a thorough job
4. Is depressed, blue
5. Is original, comes up with new ideas
6. Is reserved
7. Is helpful and unselfish with others
8. Can be somewhat careless
9. Is relaxed, handles stress well
10. Is curious about many different things
11. Is full of energy
12. Starts quarrels with others
13. Is a reliable worker
14. Can be tense
15. Is ingenious, a deep thinker
16. Generates a lot of enthusiasm
17. Has a forgiving nature
18. Tends to be disorganized
19. Worries a lot
20. Has an active imagination
21. Tends to be quiet
22. Is generally trusting
23. Tends to be lazy
24. Is emotionally stable, not easily upset
25. Is inventive
26. Has an assertive personality
Page 130
130
27. Can be cold and aloof
I SEE MYSELF AS SOMEONE WHO: Strongly
Disagree
Disagree Neither Agree nor
Disagree
Agree Strongly
Agree
28. Perseveres until the task is finished
29. Can be moody
30. Values artistic, aesthetic experience
31. Is sometimes shy, inhibited
32. Is considerate and kind to almost everyone
33. Does things efficiently
34. Remains calm in tense situations
35. Prefers work that is routine
36. Is outgoing, sociable
37. Is sometimes rude to others
38. Makes plans and follows through with them
39. Gets nervous easily
40. Likes to reflect, play with ideas
41. Has few artistic interests
42. Likes to cooperate with others
43. Is easily distracted
44. Is sophisticated in art, music, or literature
WPI Think of your job and please mark the answer that
represents you best
Never or
almost never
true of me
Sometimes
true of me
Often true of
me
Always or
almost
always true
of me
1. I am not that concerned about what other people think of my
work
2. I prefer having someone set clear goals for me in my work
3. The more difficult the problem the more I enjoy trying to
solve it
4. I am keenly aware of the income goals I have for myself
5. I want my work to provide me with opportunities for
increasing my knowledge and skills.
6. To me, success means doing better than other people
7. I prefer to figure out things for myself
8. No matter what the outcome of a project, I am satisfied if I
feel I gained a new experience
Page 131
131
9. I enjoy relatively simple, straightforward tasks
……Continued from the previous page
Never or
almost never
true of me
Sometimes
true of me
Often true of
me
Always or
almost
always true
of me
10. I am keenly aware of the promotion goals I have for myself
11. Curiosity is the driving force behind much of what I do
12. I’m less concerned with what work I do than what I get for
it
13. I enjoy tackling problems that are completely new to me
14. I prefer work I know I can do well over work that stretches
my abilities
15. I’m concerned about how other people are going to react to
my ideas
16. I seldom think about salary and promotions
17. I’m more comfortable when I can set my own goals
18. I believe that there is no point in doing a good job if
nobody else knows about it
19. I am strongly motivated by the money I can earn
20. It is important for me to be able to do what I most enjoy
21. I prefer working on projects with clearly specified
procedures
22. As long as I can do what I enjoy, I’m not that concerned
about exactly what I’m paid
23. I enjoy doing work that is so absorbing that I forget about
everything else
24. I am strongly motivated by the recognition I can earn from
other people
25. I have to feel that I’m earning something for what I do
26. I enjoy trying to solve complex problems
27. It is important for me to have an outlet for self-expression
28. I want to find out how good I really can be at my work
29. I want other people to find out how good I really can be at
my work
30. What matters most to me is enjoying what I do
RA JI ST - Think of your job and please mark the answer
that best represents how you feel
Strongly
Disagree
Disagree Neither Agree
nor Disagree
Agree Strongly
Agree
1. I know exactly what is expected of me.
2. I know that I have divided my time properly.
Page 132
132
3. Explanation is clear of what has to be done.
4. I feel certain about how much authority I have.
…. Continued from the previous page Strongly
Disagree
Disagree Neither Agree
nor Disagree
Agree Strongly
Agree
5. I know what my responsibilities are.
6. Clear, planned goals and objectives exist for my job.
7. I have invested in this job more than what most people have
invested in their jobs
8. I have spent many unpaid extra hours at work.
9. I have voluntarily engaged in many organization-related
activities that are not a formal part of my job (e.g. committee
memberships, event planning)
10. The effort that I have put into my job has helped me to
become competent in this line of work.
11. I use my free time to read work-related materials that
contribute to my competence on the job.
12. I can easily use the knowledge that I have gained while
working for this company in another work setting.
13. My actual job performance has improved due to the skills I
learned in this job.
14. The skills that I have accumulated while working for this
company greatly increased my chances of getting a comparable
job elsewhere
15. My resume looks better now, after all the training I have
received while in this job.
OS PS
Please check the box that best represents how you feel
Strongly
Disagree
Disagree Neither
Agree nor
Disagree
Agree Strongly
Agree
1. The organization values my contribution to its well-being.
2. The organization strongly considers my goals and values.
3. The organization really cares about my well-being.
4. My supervisor is willing to extend himself in order to help
me perform my job to the best of my ability.
5. My supervisor takes pride in my accomplishments at work.
6. My supervisor tries to make my job as interesting as
possible.
THANK YOU FOR COMPLETING THIS FIRST PART OF THE QUESTIONNAIRE. YOUR
ANSWERS ARE GREATLY APPRECIATED. THE SECOND PART WILL FOLLOW IN A FEW
WEEKS - IF YOU HAVE ANY QUESTIONS CONTACT CEZAR GIOSAN: [email protected]
or 718-205-1841.
Page 133
133
THIS IS THE SECOND PART OF A QUESTIONNAIRE THAT YOU FILLED OUT A FEW WEEKS
AGO. THANK YOU AGAIN FOR AGREEING TO PARTICIPATE IN THIS STUDY.
TO BE ABLE TO CORRELATE YOUR ANSWERS IN PART ONE AND PART TWO OF THIS
SURVEY PLEASE TELL US:
YOUR NAME: ________________________________________
DO YOU HAVE THE SAME JOB THAT YOU HAD WHEN YOU COMPLETED THE FIRST PART
OF THIS SURVEY? YES NO (Please explain): ____________________________________________
Page 134
134
JE
Please check the box that best represents how you feel
Strongly
Disagree
Disagree
Neither Agree
nor Disagree
Agree
Strongly
Agree
1. I really love the place where I live.
2. This community is a good match for me.
3. I think of the community where I live as home.
4. The area where I live offers the leisure activities that I like
(sports, outdoors, cultural, arts).
5. My family roots are in this community.
6. I am active in a church in the community.
7. I am active in one or more community organizations (not
churches)
8. My coworkers are similar to me.
9. My job utilizes my skills and talents well.
10. I feel like I am a good match for the organization I work for.
11. My values are compatible with the organization’s values.
12. I fit with the organization’s culture.
13. My supervisors are similar to me in many ways.
14. The values of the top management team here match my own
values.
15. I fit with the culture established and maintained by the top
management of this organization.
16. My personality matches the personality or image of this
organization.
17. My knowledge, skills, and abilities match the requirements
of this job.
18. This job is a good match for me.
19. It would be easy for me to date someone working for this
company, should I desire so.
20. My goals are compatible with those of this organization.
21. I feel that people at work respect me a great deal.
22. I would sacrifice a lot if I left this job.
Page 135
135
Strongly
Disagree
Disagree Neither Agree
nor Disagree
Agree Strongly
Agree
23. My promotional opportunities are excellent here.
24. The benefits are good on this job.
25. It would be hard to leave my job because I have such a great
boss.
26. Leaving this community would be very hard.
27. If I were to leave the community, I would miss my non-
work friends.
28. Having to give up my house to relocate would be very
difficult.
29. If I were to leave the community, I would miss my daily
routine.
30. If I were to leave the community, I would miss my
neighborhood.
31. I could easily find a date in the community I live, should I
desire so.
JSBI
During the past year have you:
Yes
No
1. Read a book about getting a new job?
2. Revised your resume?
3. Sent copies of your resume to a prospective employer?
4. Contacted an employment agency or executive search firm to obtain a job with another organization?
5. Read the classified/help wanted advertisements in the newspaper?
6. Gone on a job interview?
7. Talked to friends or relatives about getting a new job?
8. Sought to transfer to a new job within your organization?
9. Talked to co-workers about getting a new job in another organization?
10. Made any telephone inquiries (or sent emails) to prospective employers?
Page 136
136
IL
Please circle the answer or check the box that best
represents how you feel
Very Unlikely Unlikely Neither
Likely
nor
Unlikely
Likely Very
Likely
1. Do you intend to leave the organization in the next 12
months?
2. How likely is it that you will leave the organization in the
next 12 months?
3. How strongly do you feel about leaving the organization
within the next 12 months? Not at all
strongly
Not
strongly
Neutral Strongly Very
strongly
JA
Please circle the response that best represents how you
feel
1. What is the probability that you can find an acceptable
alternative to your job?
no
chance
25%
chance
50% chance 75%
chance
100%
chance
2. If you search for an alternative job within a year, what are
the chances you can find an acceptable job?
no
chance
25%
chance
50% chance 75%
chance
100%
chance
3. If you have received a job offer in the past year, to what
extent did you consider accepting it?
did not
consider
casually between
casually and
extensively
extensively very
extensively
4. If you received a job offer today, to what extent would
you consider accepting it?
would
not
consider
casually between
casually and
extensively
extensively very
extensively
5. Have you considered quitting your job to pursue non-work
options?
did not
consider
casually between
casually and
extensively
extensively very
extensively
THANK YOU FOR COMPLETING THIS LAST PART OF THE QUESTIONNAIRE. YOUR
ANSWERS ARE GREATLY APPRECIATED - IF YOU HAVE ANY QUESTIONS CONTACT CEZAR
GIOSAN: [email protected] or 718-205-1841.
Appendix 1: Antecedents and the Embeddedness Survey (Study one).
Page 137
137
Correlations
1 .329** .316** .128 .282** .105 .215** -.044 .328** .211** .097 .071 .214** .223** .207** -.045 .011
. .000 .000 .095 .000 .173 .005 .571 .000 .006 .212 .361 .005 .004 .008 .565 .892
171 171 171 170 171 171 171 171 171 169 168 168 167 167 165 168 167
.329** 1 -.226** .103 .165* .184* .398** -.231** .488** .023 -.007 -.007 .140 .018 .179* .070 .112
.000 . .003 .181 .031 .016 .000 .002 .000 .766 .927 .929 .071 .822 .022 .370 .148
171 171 171 170 171 171 171 171 171 169 168 168 167 167 165 168 167
.316** -.226** 1 .186* .104 -.059 -.132 .156* -.111 .150 .095 .009 .250** .263** -.027 .060 .025
.000 .003 . .015 .176 .441 .085 .042 .147 .052 .220 .906 .001 .001 .730 .441 .748
171 171 171 170 171 171 171 171 171 169 168 168 167 167 165 168 167
.128 .103 .186* 1 .048 -.149 .050 -.003 .088 -.060 -.095 -.160* .117 .185* .132 .045 .031
.095 .181 .015 . .533 .053 .516 .965 .256 .441 .223 .039 .132 .017 .092 .567 .694
170 170 170 170 170 170 170 170 170 168 167 167 167 166 164 167 166
.282** .165* .104 .048 1 .116 .349** -.164* .232** .271** .126 .095 .157* .119 .099 -.005 -.040
.000 .031 .176 .533 . .130 .000 .031 .002 .000 .104 .222 .042 .125 .208 .953 .610
171 171 171 170 172 172 172 172 172 169 168 168 167 167 165 168 167
.105 .184* -.059 -.149 .116 1 .440** -.349** .150* .119 .189* .281** .081 .151 .023 .022 .010
.173 .016 .441 .053 .130 . .000 .000 .049 .125 .014 .000 .300 .051 .771 .774 .895
171 171 171 170 172 172 172 172 172 169 168 168 167 167 165 168 167
.215** .398** -.132 .050 .349** .440** 1 -.307** .318** .279** .090 .110 .177* .206** -.036 .061 .032
.005 .000 .085 .516 .000 .000 . .000 .000 .000 .244 .157 .022 .008 .643 .432 .680
171 171 171 170 172 172 172 172 172 169 168 168 167 167 165 168 167
-.044 -.231** .156* -.003 -.164* -.349** -.307** 1 -.186* -.171* -.088 -.216** -.087 -.010 -.167* -.031 -.132
.571 .002 .042 .965 .031 .000 .000 . .015 .026 .256 .005 .265 .896 .032 .689 .089
171 171 171 170 172 172 172 172 172 169 168 168 167 167 165 168 167
.328** .488** -.111 .088 .232** .150* .318** -.186* 1 .117 -.015 -.026 .087 .096 .146 .128 .022
.000 .000 .147 .256 .002 .049 .000 .015 . .130 .848 .739 .265 .217 .062 .099 .775
171 171 171 170 172 172 172 172 172 169 168 168 167 167 165 168 167
.211** .023 .150 -.060 .271** .119 .279** -.171* .117 1 .219** .241** .134 .261** -.059 -.036 -.022
.006 .766 .052 .441 .000 .125 .000 .026 .130 . .004 .002 .084 .001 .454 .648 .774
169 169 169 168 169 169 169 169 169 169 168 168 167 167 165 168 167
.097 -.007 .095 -.095 .126 .189* .090 -.088 -.015 .219** 1 .575** .269** .384** -.148 .019 .092
.212 .927 .220 .223 .104 .014 .244 .256 .848 .004 . .000 .000 .000 .059 .807 .237
168 168 168 167 168 168 168 168 168 168 168 168 167 167 164 167 166
.071 -.007 .009 -.160* .095 .281** .110 -.216** -.026 .241** .575** 1 .186* .289** -.090 -.089 .050
.361 .929 .906 .039 .222 .000 .157 .005 .739 .002 .000 . .016 .000 .254 .255 .522
168 168 168 167 168 168 168 168 168 168 168 168 167 167 164 167 166
.214** .140 .250** .117 .157* .081 .177* -.087 .087 .134 .269** .186* 1 .386** -.062 .091 .143
.005 .071 .001 .132 .042 .300 .022 .265 .265 .084 .000 .016 . .000 .434 .246 .068
167 167 167 167 167 167 167 167 167 167 167 167 167 166 163 166 165
.223** .018 .263** .185* .119 .151 .206** -.010 .096 .261** .384** .289** .386** 1 -.009 .070 .034
.004 .822 .001 .017 .125 .051 .008 .896 .217 .001 .000 .000 .000 . .907 .369 .662
167 167 167 166 167 167 167 167 167 167 167 167 166 167 163 166 165
.207** .179* -.027 .132 .099 .023 -.036 -.167* .146 -.059 -.148 -.090 -.062 -.009 1 .085 .055
.008 .022 .730 .092 .208 .771 .643 .032 .062 .454 .059 .254 .434 .907 . .281 .484
165 165 165 164 165 165 165 165 165 165 164 164 163 163 165 164 163
-.045 .070 .060 .045 -.005 .022 .061 -.031 .128 -.036 .019 -.089 .091 .070 .085 1 .366**
.565 .370 .441 .567 .953 .774 .432 .689 .099 .648 .807 .255 .246 .369 .281 . .000
168 168 168 167 168 168 168 168 168 168 167 167 166 166 164 168 167
.011 .112 .025 .031 -.040 .010 .032 -.132 .022 -.022 .092 .050 .143 .034 .055 .366** 1
.892 .148 .748 .694 .610 .895 .680 .089 .775 .774 .237 .522 .068 .662 .484 .000 .
167 167 167 166 167 167 167 167 167 167 166 166 165 165 163 167 167
Pearson
Correla tion
Sig. (2 -tailed)
N
Pearson
Correla tion
Sig. (2 -tailed)
N
Pearson
Correla tion
Sig. (2 -tailed)
N
Pearson
Correla tion
Sig. (2 -tailed)
N
Pearson
Correla tion
Sig. (2 -tailed)
N
Pearson
Correla tion
Sig. (2 -tailed)
N
Pearson
Correla tion
Sig. (2 -tailed)
N
Pearson
Correla tion
Sig. (2 -tailed)
N
Pearson
Correla tion
Sig. (2 -tailed)
N
Pearson
Correla tion
Sig. (2 -tailed)
N
Pearson
Correla tion
Sig. (2 -tailed)
N
Pearson
Correla tion
Sig. (2 -tailed)
N
Pearson
Correla tion
Sig. (2 -tailed)
N
Pearson
Correla tion
Sig. (2 -tailed)
N
Pearson
Correla tion
Sig. (2 -tailed)
N
Pearson
Correla tion
Sig. (2 -tailed)
N
Pearson
Correla tion
Sig. (2 -tailed)
N
Enjoyment
Challenge
Outward
Compensation
Extraversion
Agreeableness
Consci entiousness
Neurotic
Openness
Role ambigui ty
Organizationa l
support
Supervisor support
Job investments
Skil ls transferabil i ty
Alterna tives
Mating in comm unity
Mating in o rganization
EnjoymentChallengeOutwardCompensationExtraversionAgreeablenessConsci entiousnessNeurotic OpennessRole ambigui ty
Organizationa l
supportSupervisor supportJob investmentsSkil ls transferabil i tyAlterna tivesMating in comm unity
Mating in
organiza tion
Correla tion is signi fican t at the 0.01 level (2-tailed).**.
Correla tion is signi fican t at the 0.05 level (2-tailed).*.
Appendix 2: correlation matrix between traits, motivation, work perceptions, and
biological factors (Study one)
Page 138
138
Correlations
1 .387** .077 -.120 .153 .024 .130 -.068 .442** -.090 .094 .110 .160 .042 .065 .145 .029
. .000 .386 .175 .082 .787 .140 .442 .000 .310 .287 .214 .070 .640 .461 .106 .748
129 129 129 129 129 129 129 129 129 129 129 129 129 129 129 125 125
.387** 1 -.200* -.129 .178* .009 .081 -.247** .364** .001 .129 .153 .242** -.024 -.194* -.087 .162
.000 . .023 .147 .044 .917 .362 .005 .000 .991 .145 .084 .006 .791 .027 .334 .071
129 129 129 129 129 129 129 129 129 129 129 129 129 129 129 125 125
.077 -.200* 1 .292** -.076 -.203* -.092 .177* -.065 .069 -.040 .032 .091 .070 .093 -.064 .114
.386 .023 . .001 .393 .021 .299 .045 .466 .440 .653 .722 .305 .432 .293 .476 .205
129 129 129 129 129 129 129 129 129 129 129 129 129 129 129 125 125
-.120 -.129 .292** 1 .100 -.088 -.007 -.104 -.111 .184* -.028 -.022 .296** .202* .024 .033 .134
.175 .147 .001 . .257 .321 .936 .242 .212 .037 .755 .803 .001 .022 .787 .715 .136
129 129 129 129 129 129 129 129 129 129 129 129 129 129 129 125 125
.153 .178* -.076 .100 1 .268** .412** -.445** .297** .216* .159 .150 .161 .089 -.043 -.095 .069
.082 .044 .393 .257 . .002 .000 .000 .001 .014 .072 .089 .068 .319 .625 .292 .445
129 129 129 129 129 129 129 129 129 129 129 129 129 129 129 125 125
.024 .009 -.203* -.088 .268** 1 .547** -.315** .268** .117 .186* .094 .019 .269** .063 .098 .064
.787 .917 .021 .321 .002 . .000 .000 .002 .185 .035 .287 .830 .002 .481 .279 .475
129 129 129 129 129 129 129 129 129 129 129 129 129 129 129 125 125
.130 .081 -.092 -.007 .412** .547** 1 -.364** .404** .111 .073 -.005 .254** .023 -.070 -.085 .104
.140 .362 .299 .936 .000 .000 . .000 .000 .211 .409 .951 .004 .794 .433 .345 .246
129 129 129 129 129 129 129 129 129 129 129 129 129 129 129 125 125
-.068 -.247** .177* -.104 -.445** -.315** -.364** 1 -.243** -.269** -.277** -.224* -.182* -.218* .276** .110 -.180*
.442 .005 .045 .242 .000 .000 .000 . .005 .002 .002 .011 .039 .013 .002 .223 .044
129 129 129 129 129 129 129 129 129 129 129 129 129 129 129 125 125
.442** .364** -.065 -.111 .297** .268** .404** -.243** 1 .016 -.035 .030 .059 -.047 .169 .060 .351**
.000 .000 .466 .212 .001 .002 .000 .005 . .856 .697 .735 .506 .600 .056 .506 .000
129 129 129 129 129 129 129 129 129 129 129 129 129 129 129 125 125
-.090 .001 .069 .184* .216* .117 .111 -.269** .016 1 .636** .594** .046 .617** -.306** .178* .149
.310 .991 .440 .037 .014 .185 .211 .002 .856 . .000 .000 .602 .000 .000 .047 .098
129 129 129 129 129 129 129 129 129 129 129 129 129 129 129 125 125
.094 .129 -.040 -.028 .159 .186* .073 -.277** -.035 .636** 1 .764** .040 .472** -.378** .201* .025
.287 .145 .653 .755 .072 .035 .409 .002 .697 .000 . .000 .650 .000 .000 .025 .781
129 129 129 129 129 129 129 129 129 129 129 129 129 129 129 125 125
.110 .153 .032 -.022 .150 .094 -.005 -.224* .030 .594** .764** 1 -.059 .411** -.309** .199* .112
.214 .084 .722 .803 .089 .287 .951 .011 .735 .000 .000 . .509 .000 .000 .026 .214
129 129 129 129 129 129 129 129 129 129 129 129 129 129 129 125 125
.160 .242** .091 .296** .161 .019 .254** -.182* .059 .046 .040 -.059 1 .184* -.012 -.008 .027
.070 .006 .305 .001 .068 .830 .004 .039 .506 .602 .650 .509 . .037 .890 .926 .768
129 129 129 129 129 129 129 129 129 129 129 129 129 129 129 125 125
.042 -.024 .070 .202* .089 .269** .023 -.218* -.047 .617** .472** .411** .184* 1 -.190* .299** .082
.640 .791 .432 .022 .319 .002 .794 .013 .600 .000 .000 .000 .037 . .031 .001 .364
129 129 129 129 129 129 129 129 129 129 129 129 129 129 129 125 125
.065 -.194* .093 .024 -.043 .063 -.070 .276** .169 -.306** -.378** -.309** -.012 -.190* 1 .130 .060
.461 .027 .293 .787 .625 .481 .433 .002 .056 .000 .000 .000 .890 .031 . .149 .503
129 129 129 129 129 129 129 129 129 129 129 129 129 129 129 125 125
.145 -.087 -.064 .033 -.095 .098 -.085 .110 .060 .178* .201* .199* -.008 .299** .130 1 .130
.106 .334 .476 .715 .292 .279 .345 .223 .506 .047 .025 .026 .926 .001 .149 . .150
125 125 125 125 125 125 125 125 125 125 125 125 125 125 125 125 125
.029 .162 .114 .134 .069 .064 .104 -.180* .351** .149 .025 .112 .027 .082 .060 .130 1
.748 .071 .205 .136 .445 .475 .246 .044 .000 .098 .781 .214 .768 .364 .503 .150 .
125 125 125 125 125 125 125 125 125 125 125 125 125 125 125 125 125
Pearson
Correla tion
Sig. (2 -tailed)
N
Pearson
Correla tion
Sig. (2 -tailed)
N
Pearson
Correla tion
Sig. (2 -tailed)
N
Pearson
Correla tion
Sig. (2 -tailed)
N
Pearson
Correla tion
Sig. (2 -tailed)
N
Pearson
Correla tion
Sig. (2 -tailed)
N
Pearson
Correla tion
Sig. (2 -tailed)
N
Pearson
Correla tion
Sig. (2 -tailed)
N
Pearson
Correla tion
Sig. (2 -tailed)
N
Pearson
Correla tion
Sig. (2 -tailed)
N
Pearson
Correla tion
Sig. (2 -tailed)
N
Pearson
Correla tion
Sig. (2 -tailed)
N
Pearson
Correla tion
Sig. (2 -tailed)
N
Pearson
Correla tion
Sig. (2 -tailed)
N
Pearson
Correla tion
Sig. (2 -tailed)
N
Pearson
Correla tion
Sig. (2 -tailed)
N
Pearson
Correla tion
Sig. (2 -tailed)
N
Enjoyment
Challenge
Outward
Compensation
Extraversion
Agreeableness
Consci entiousness
Neuroticism
Openness
Role ambigui ty
Organizationa l
support
Supervisor support
Job investments
Skil ls transferabil i ty
Alterna tives
Mating in comm unity
Mating in o rganization
EnjoymentChallengeOutwardCompensationExtraversionAgreeablenessConsci entiousnessNeuroticismOpennessRole ambigui ty
Organizationa l
supportSupervisor supportJob investmentsSkil ls transferabil i tyAlterna tivesMating in comm unity
Mating in
organiza tion
Correla tion is signi fican t at the 0.01 level (2-tailed).**.
Correla tion is signi fican t at the 0.05 level (2-tailed).*.
Appendix 3: Correlation matrix between traits, motivation, work perceptions and
biological factors (sample two)
Page 143
143
Appendix 4. Antecedents and Embeddedness Survey (Study two)
Page 144
144
SAMPLE ONE
Model Summary
.679a .461 .387 .37215
Model
1
R R SquareAdjustedR Square
Std. Error ofthe Estimate
Predictors : (Constant), Mating in community,Extraversion, Compensation, Number of children(z),Neurotic, Organizational support, Age (z), Challenge,Role ambiguity, Job investments, Mating inorganization, Agreeableness, Alternatives, Outward,Openness, Enjoyment, Skills transferability, Supervisorsupport, Conscientiousness
a.
ANOVAb
16.375 19 .862 6.223 .000a
19.113 138 .138
35.488 157
Regression
Residual
Total
Model1
Sum ofSquares df Mean Square F Sig.
Predictors : (Constant), Mating in community, Extraversion, Compensation, Numberof children(z), Neurotic, Organizational support, Age (z), Challenge, Role ambiguity,Job investments, Mating in organization, Agreeableness, Alternatives, Outward,Openness, Enjoyment, Skills transferability, Supervisor support, Conscientiousness
a.
Dependent Variable: Overall embeddednessb.
Page 145
145
Coefficients a
.858 .538 1.594 .113
7.30E-02 .031 .154 2.352 .020
8.38E-02 .036 .176 2.351 .020
-.135 .089 -.120 -1.511 .133
8.98E-02 .071 .104 1.263 .209
1.63E-03 .079 .002 .021 .984
-8.7E-02 .063 -.096 -1.387 .168
7.60E-03 .053 .010 .142 .887
9.23E-02 .071 .100 1.308 .193
9.14E-02 .081 .096 1.124 .263
.105 .059 .130 1.775 .078
-3.2E-02 .080 -.030 -.399 .690
-3.4E-02 .056 -.043 -.606 .545
7.26E-02 .045 .134 1.626 .106
8.82E-02 .040 .180 2.179 .031
.122 .051 .177 2.371 .019
.110 .059 .152 1.871 .064
-9.5E-02 .041 -.170 -2.351 .020
-3.5E-02 .028 -.087 -1.244 .216
9.46E-02 .027 .245 3.520 .001
(Constant)
Number of children(z)
Age (z)
Enjoyment
Challenge
Outward
Compensation
Extraversion
Agreeableness
Conscientiousness
Neurotic
Openness
Role ambiguity
Organizational support
Supervisor support
Job investments
Skills transferability
Alternatives
Mating in organization
Mating in community
Model
1
B Std. Error
UnstandardizedCoefficients
Beta
StandardizedCoefficients
t Sig.
Dependent Variable: Overall embeddednessa.
Appendix 1-S1. Regression of overall embeddedness on all antecedents
Model Summary
.315a .099 .088 .45403
Model
1
R R SquareAdjustedR Square
Std. Error ofthe Estimate
Predictors : (Constant), Age (z), Number of children(z)a.
ANOVAb
3.675 2 1.837 8.913 .000a
33.396 162 .206
37.070 164
Regression
Residual
Total
Model
1
Sum ofSquares df Mean Square F Sig.
Predictors : (Constant), Age (z), Number of children(z)a.
Dependent Variable: Overall embeddednessb.
Page 146
146
Coefficients a
2.551 .035 73.691 .000
.107 .035 .224 3.007 .003
9.98E-02 .035 .210 2.812 .006
(Constant)
Number of children(z)
Age (z)
Model
1
B Std. Error
UnstandardizedCoefficients
Beta
StandardizedCoefficients
t Sig.
Dependent Variable: Overall embeddednessa.
Appendix 2-S1. Regression of overall embeddedness on demographics
Model Summary
.366a .134 .085 .45468
Model1
R R SquareAdjustedR Square
Std. Error ofthe Estimate
Predictors : (Constant), Openness, Compensation,Neurotic, Outward, Extraversion, Agreeableness,Enjoyment, Conscientiousness, Challenge
a.
ANOVAb
5.123 9 .569 2.754 .005a
33.077 160 .207
38.200 169
Regression
Residual
Total
Model
1
Sum ofSquares df Mean Square F Sig.
Predictors : (Constant), Openness, Compensation, Neurotic, Outward, Extraversion,Agreeableness, Enjoyment, Conscientiousness, Challenge
a.
Dependent Variable: Overall embeddednessb.
Coefficients a
1.224 .568 2.155 .033
-.206 .101 -.183 -2.037 .043
8.38E-02 .081 .097 1.028 .305
.111 .087 .110 1.266 .207
-.113 .070 -.125 -1.615 .108
2.98E-02 .061 .040 .487 .627
.145 .080 .157 1.807 .073
.225 .090 .235 2.510 .013
.105 .066 .130 1.594 .113
-1.7E-02 .092 -.016 -.184 .855
(Constant)
Enjoyment
Challenge
Outward
Compensation
Extraversion
Agreeableness
Conscientiousness
Neurotic
Openness
Model
1
B Std. Error
UnstandardizedCoefficients
Beta
StandardizedCoefficients
t Sig.
Dependent Variable: Overall embeddednessa.
Appendix 3-S1. Regression of overall embeddedness on traits
Page 147
147
Model Summary
.535a .286 .259 .40931
Model
1
R R SquareAdjustedR Square
Std. Error ofthe Estimate
Predictors : (Constant), Alternatives, Skillstransferability, Role ambiguity, Supervisor support, Jobinvestments, Organizational support
a.
ANOVAb
10.483 6 1.747 10.428 .000a
26.135 156 .168
36.618 162
Regression
Residual
Total
Model
1
Sum ofSquares df Mean Square F Sig.
Predictors : (Constant), Alternatives, Skills transferability, Role ambiguity,Supervisor support, Job investments, Organizational support
a.
Dependent Variable: Overall embeddednessb.
Coefficients a
1.734 .297 5.836 .000
-2.4E-02 .056 -.031 -.434 .665
9.68E-02 .047 .179 2.046 .042
6.33E-02 .041 .129 1.545 .124
.149 .051 .216 2.919 .004
7.24E-02 .057 .099 1.261 .209
-.144 .039 -.257 -3.750 .000
(Constant)
Role ambiguity
Organizational support
Supervisor support
Job investments
Skills transferability
Alternatives
Model
1
B Std. Error
UnstandardizedCoefficients
Beta
StandardizedCoefficients
t Sig.
Dependent Variable: Overall embeddednessa.
Appendix 4-S1. Regression of overall embeddedness on work perceptions
Model Summary
.226a .051 .039 .46599
Model
1
R R SquareAdjustedR Square
Std. Error ofthe Estimate
Predictors : (Constant), Mating in community, Mating inorganization
a.
ANOVAb
1.910 2 .955 4.398 .014a
35.612 164 .217
37.522 166
Regression
Residual
Total
Model
1
Sum ofSquares df Mean Square F Sig.
Predictors : (Constant), Mating in community, Mating in organizationa.
Dependent Variable: Overall embeddednessb.
Page 148
148
Coefficients a
2.347 .102 23.109 .000
-2.8E-02 .033 -.068 -.837 .404
9.32E-02 .032 .241 2.954 .004
(Constant)
Mating in organization
Mating in community
Model1
B Std. Error
UnstandardizedCoefficients
Beta
StandardizedCoefficients
t Sig.
Dependent Variable: Overall embeddednessa.
Appendix 5-S1. Regression of overall embeddedness on biologic factors
Model Summary
.409a .167 .157 .46697
Model
1
R R SquareAdjustedR Square
Std. Error ofthe Estimate
Predictors : (Constant), Age (z), Number of children(z)a.
ANOVAb
7.085 2 3.542 16.245 .000a
35.325 162 .218
42.410 164
Regression
Residual
Total
Model
1
Sum ofSquares df Mean Square F Sig.
Predictors : (Constant), Age (z), Number of children(z)a.
Dependent Variable: Links-communityb.
Coefficients a
1.473 .036 41.378 .000
.139 .037 .274 3.810 .000
.148 .037 .291 4.047 .000
(Constant)
Number of children(z)
Age (z)
Model
1
B Std. Error
UnstandardizedCoefficients
Beta
StandardizedCoefficients
t Sig.
Dependent Variable: Links-communitya.
Appendix 6-S1. Regression of links-community on demographics
Model Summary
.132a .017 -.012 .51163
Model
1
R R SquareAdjustedR Square
Std. Error ofthe Estimate
Predictors : (Constant), Openness, Agreeableness,Extraversion, Neurotic, Conscientiousness
a.
Page 149
149
ANOVAb
.766 5 .153 .586 .711a
43.454 166 .262
44.220 171
Regression
Residual
Total
Model
1
Sum ofSquares df Mean Square F Sig.
Predictors : (Constant), Openness, Agreeableness, Extravers ion, Neurotic,Conscientiousness
a.
Dependent Variable: Links-communityb.
Coefficients a
.708 .571 1.241 .216
-2.2E-02 .066 -.027 -.325 .746
1.23E-02 .088 .012 .140 .889
.128 .096 .125 1.330 .185
5.23E-02 .073 .060 .717 .474
3.86E-02 .092 .034 .419 .676
(Constant)
Extraversion
Agreeableness
Conscientiousness
Neurotic
Openness
Model
1
B Std. Error
UnstandardizedCoefficients
Beta
StandardizedCoefficients
t Sig.
Dependent Variable: Links-communitya.
Appendix 7-S1. Regression of links-community on traits
Model Summary
.034a .001 -.005 .50975
Model
1
R R SquareAdjustedR Square
Std. Error ofthe Estimate
Predictors : (Constant), Mating in communitya.
ANOVAb
.051 1 .051 .196 .658a
43.135 166 .260
43.186 167
Regression
Residual
Total
Model
1
Sum ofSquares df Mean Square F Sig.
Predictors : (Constant), Mating in communitya.
Dependent Variable: Links-communityb.
Coefficients a
1.432 .100 14.288 .000
1.42E-02 .032 .034 .443 .658
(Constant)
Mating in community
Model
1
B Std. Error
UnstandardizedCoefficients
Beta
StandardizedCoefficients
t Sig.
Dependent Variable: Links-communitya.
Appendix 8-S1. Regression of links-community on the biologic factor
Page 150
150
Model Summary
.310a .096 .073 .83253
Model
1
R R SquareAdjustedR Square
Std. Error ofthe Estimate
Predictors: (Constant), Number of children(z), Age (z),Strength of attachment, Time in the community (z)
a.
ANOVAb
11.480 4 2.870 4.141 .003a
108.123 156 .693
119.603 160
Regression
Residual
Total
Model
1
Sum ofSquares df Mean Square F Sig.
Predictors : (Constant), Number of children(z), Age (z), Strength of attachment, Timein the community (z)
a.
Dependent Variable: Fit-communityb.
Coefficients a
3.060 .134 22.887 .000
5.60E-02 .074 .065 .755 .451
-1.3E-02 .073 -.015 -.176 .861
.126 .040 .260 3.146 .002
6.17E-02 .070 .071 .885 .377
(Constant)
Age (z)
Time in the community (z)
Strength of attachment
Number of children(z)
Model
1
B Std. Error
UnstandardizedCoefficients
Beta
StandardizedCoefficients
t Sig.
Dependent Variable: Fit-communitya.
Appendix 9-S1. Regression of fit-community on demographics
Model Summary
.284a .080 .052 .84168
Model
1
R R SquareAdjustedR Square
Std. Error ofthe Estimate
Predictors : (Constant), Openness, Agreeableness,Extraversion, Neurotic, Conscientiousness
a.
ANOVAb
10.109 5 2.022 2.854 .017a
115.475 163 .708
125.583 168
Regression
Residual
Total
Model
1
Sum ofSquares df Mean Square F Sig.
Predictors : (Constant), Openness, Agreeableness, Extravers ion, Neurotic,Conscientiousness
a.
Dependent Variable: Fit-communityb.
Page 151
151
Coefficients a
.491 .948 .518 .605
3.94E-02 .110 .029 .357 .722
.212 .146 .126 1.452 .148
.375 .160 .216 2.349 .020
.165 .121 .112 1.361 .175
1.81E-02 .153 .009 .118 .906
(Constant)
Extraversion
Agreeableness
Conscientiousness
Neurotic
Openness
Model
1
B Std. Error
UnstandardizedCoefficients
Beta
StandardizedCoefficients
t Sig.
Dependent Variable: Fit-communitya.
Appendix 10-S1. Regression of fit-community on traits
Model Summary
.237a .056 .051 .84245
Model
1
R R SquareAdjustedR Square
Std. Error ofthe Estimate
Predictors : (Constant), Mating in communitya.
ANOVAb
7.021 1 7.021 9.892 .002a
117.815 166 .710
124.836 167
Regression
Residual
Total
Model
1
Sum ofSquares df Mean Square F Sig.
Predictors : (Constant), Mating in communitya.
Dependent Variable: Fit-communityb.
Coefficients a
2.950 .166 17.806 .000
.166 .053 .237 3.145 .002
(Constant)
Mating in community
Model
1
B Std. Error
UnstandardizedCoefficients
Beta
StandardizedCoefficients
t Sig.
Dependent Variable: Fit-communitya.
Appendix 11-S1. Regression of fit-community on the biologic factor
Model Summary
.307a .094 .071 .79567
Model
1
R R SquareAdjustedR Square
Std. Error ofthe Estimate
Predictors : (Constant), Strength of attachment, Time inthe community (z), Number of children(z), Age (z)
a.
Page 152
152
ANOVAb
10.300 4 2.575 4.068 .004a
98.762 156 .633
109.062 160
Regression
Residual
Total
Model
1
Sum ofSquares df Mean Square F Sig.
Predictors : (Constant), Strength of attachment, Time in the community (z), Numberof children(z), Age (z)
a.
Dependent Variable: Sacrifice-communityb.
Coefficients a
2.750 .128 21.522 .000
7.62E-02 .067 .092 1.144 .254
3.81E-02 .071 .046 .538 .591
.136 .070 .164 1.942 .054
9.38E-02 .038 .203 2.447 .016
(Constant)
Number of children(z)
Age (z)
Time in the community (z)
Strength of attachment
Model
1
B Std. Error
UnstandardizedCoefficients
Beta
StandardizedCoefficients
t Sig.
Dependent Variable: Sacrifice-communitya.
Appendix 12-S1. Regression of sacrifice-community on demographics
Model Summary
.339a .115 .088 .78858
Model
1
R R SquareAdjustedR Square
Std. Error ofthe Estimate
Predictors : (Constant), Openness, Agreeableness,Extraversion, Neurotic, Conscientiousness
a.
ANOVAb
13.152 5 2.630 4.230 .001a
101.363 163 .622
114.515 168
Regression
Residual
Total
Model
1
Sum ofSquares df Mean Square F Sig.
Predictors : (Constant), Openness, Agreeableness, Extravers ion, Neurotic,Conscientiousness
a.
Dependent Variable: Sacrifice-communityb.
Page 153
153
Coefficients a
-6.9E-03 .888 -.008 .994
-.138 .103 -.106 -1.336 .184
.388 .137 .241 2.834 .005
.322 .150 .194 2.151 .033
.226 .113 .160 1.991 .048
3.58E-02 .143 .020 .250 .803
(Constant)
Extraversion
Agreeableness
Conscientiousness
Neurotic
Openness
Model
1
B Std. Error
UnstandardizedCoefficients
Beta
StandardizedCoefficients
t Sig.
Dependent Variable: Sacrifice-communitya.
Appendix 13-S1. Regression of sacrifice-community on traits
Model Summary
.308a .095 .090 .78777
Model
1
R R SquareAdjustedR Square
Std. Error ofthe Estimate
Predictors : (Constant), Mating in communitya.
ANOVAb
10.816 1 10.816 17.428 .000a
103.018 166 .621
113.833 167
Regression
Residual
Total
Model
1
Sum ofSquares df Mean Square F Sig.
Predictors : (Constant), Mating in communitya.
Dependent Variable: Sacrifice-communityb.
Coefficients a
2.430 .155 15.683 .000
.207 .049 .308 4.175 .000
(Constant)
Mating in community
Model
1
B Std. Error
UnstandardizedCoefficients
Beta
StandardizedCoefficients
t Sig.
Dependent Variable: Sacrifice-communitya.
Appendix 14-S1. Regression of sacrifice-community on the biologic factor
Model Summary
.579a .336 .323 .44971
Model
1
R R SquareAdjustedR Square
Std. Error ofthe Estimate
Predictors: (Constant), Strength of at tachment, Age(z), Number of children(z)
a.
Page 154
154
ANOVAb
16.034 3 5.345 26.428 .000a
31.751 157 .202
47.785 160
Regression
Residual
Total
Model
1
Sum ofSquares df Mean Square F Sig.
Predictors : (Constant), Strength of attachment, Age (z), Number of children(z)a.
Dependent Variable: Links-organizationb.
Coefficients a
.974 .071 13.618 .000
.309 .036 .565 8.538 .000
2.91E-02 .038 .053 .773 .441
1.20E-02 .021 .039 .561 .576
(Constant)
Age (z)
Number of children(z)
Strength of attachment
Model
1
B Std. Error
UnstandardizedCoefficients
Beta
StandardizedCoefficients
t Sig.
Dependent Variable: Links-organizationa.
Appendix 15-S1. Regression of links-organization on demographics
Model Summary
.384a .147 .099 .51875
Model1
R R SquareAdjustedR Square
Std. Error ofthe Estimate
Predictors : (Constant), Openness, Compensation,Neurotic, Outward, Extraversion, Agreeableness,Enjoyment, Conscientiousness, Challenge
a.
ANOVAb
7.387 9 .821 3.050 .002a
42.787 159 .269
50.174 168
Regression
Residual
Total
Model
1
Sum ofSquares df Mean Square F Sig.
Predictors : (Constant), Openness, Compensation, Neurotic, Outward, Extraversion,Agreeableness, Enjoyment, Conscientiousness, Challenge
a.
Dependent Variable: Links-organizationb.
Page 155
155
Coefficients a
.710 .650 1.092 .276
-.374 .116 -.290 -3.239 .001
-.103 .093 -.103 -1.101 .273
9.69E-02 .100 .083 .968 .335
-.102 .080 -.098 -1.269 .206
.151 .070 .176 2.158 .032
-2.9E-02 .092 -.027 -.315 .754
.235 .103 .214 2.290 .023
-3.6E-02 .076 -.038 -.472 .638
.147 .106 .122 1.390 .166
(Constant)
Enjoyment
Challenge
Outward
Compensation
Extraversion
Agreeableness
Conscientiousness
Neurotic
Openness
Model
1
B Std. Error
UnstandardizedCoefficients
Beta
StandardizedCoefficients
t Sig.
Dependent Variable: Links-organizationa.
Appendix 16-S1. Regression of links-organization on traits and motivation
Model Summary
.414a .172 .140 .50682
Model1
R R SquareAdjustedR Square
Std. Error ofthe Estimate
Predictors : (Constant), Alternatives, Skillstransferability, Role ambiguity, Supervisor support, Jobinvestments, Organizational support
a.
ANOVAb
8.310 6 1.385 5.392 .000a
40.072 156 .257
48.382 162
Regression
Residual
Total
Model
1
Sum ofSquares df Mean Square F Sig.
Predictors : (Constant), Alternatives, Skills transferability, Role ambiguity,Supervisor support, Job investments, Organizational support
a.
Dependent Variable: Links-organizationb.
Coefficients a
1.290 .368 3.506 .001
7.68E-02 .069 .085 1.109 .269
-6.3E-02 .059 -.102 -1.080 .282
2.69E-03 .051 .005 .053 .958
.238 .063 .301 3.773 .000
-.170 .071 -.204 -2.395 .018
-.174 .048 -.269 -3.641 .000
(Constant)
Role ambiguity
Organizational support
Supervisor support
Job investments
Skills transferability
Alternatives
Model
1
B Std. Error
UnstandardizedCoefficients
Beta
StandardizedCoefficients
t Sig.
Dependent Variable: Links-organizationa.
Page 156
156
Appendix 17-S1. Regression of links-organization on work perceptions
Model Summary
.111a .012 .006 .54478
Model
1
R R SquareAdjustedR Square
Std. Error ofthe Estimate
Predictors : (Constant), Mating in organizationa.
ANOVAb
.605 1 .605 2.037 .155a
48.674 164 .297
49.278 165
Regression
Residual
Total
Model
1
Sum ofSquares df Mean Square F Sig.
Predictors : (Constant), Mating in organizationa.
Dependent Variable: Links-organizationb.
Coefficientsa
1.128 .094 12.055 .000
-5.1E-02 .036 -.111 -1.427 .155
(Constant)
Mating in organization
Model
1
B Std. Error
UnstandardizedCoefficients
Beta
StandardizedCoefficients
t Sig.
Dependent Variable: Links-organizationa.
Appendix 18-S1. Regression of links-organization on the biologic factor
Model Summary
.195a .038 .019 .68937
Model
1
R R SquareAdjustedR Square
Std. Error ofthe Estimate
Predictors: (Constant), Strength of at tachment, Time inthe organization (z), Age (z)
a.
ANOVAb
2.879 3 .960 2.019 .114a
72.711 153 .475
75.590 156
Regression
Residual
Total
Model
1
Sum ofSquares df Mean Square F Sig.
Predictors : (Constant), Strength of attachment, Time in the organization (z), Age (z)a.
Dependent Variable: Fit-organizationb.
Page 157
157
Coefficients a
3.035 .107 28.465 .000
-3.1E-02 .066 -.045 -.473 .637
3.25E-02 .065 .047 .501 .617
7.56E-02 .031 .194 2.405 .017
(Constant)
Age (z)
Time in theorganization (z)
Strength of attachment
Model
1
B Std. Error
UnstandardizedCoefficients
Beta
StandardizedCoefficients
t Sig.
Dependent Variable: Fit-organizationa.
Appendix 19-S1. Regression of fit-organization on demographics
Model Summary
.385a .148 .100 .66054
Model
1
R R SquareAdjustedR Square
Std. Error ofthe Estimate
Predictors : (Constant), Openness, Compensation,Neurotic, Outward, Extraversion, Agreeableness,Enjoyment, Conscientiousness, Challenge
a.
ANOVAb
11.983 9 1.331 3.052 .002a
68.937 158 .436
80.920 167
Regression
Residual
Total
Model
1
Sum ofSquares df Mean Square F Sig.
Predictors : (Constant), Openness, Compensation, Neurotic, Outward, Extraversion,Agreeableness, Enjoyment, Conscientiousness, Challenge
a.
Dependent Variable: Fit-organizationb.
Coefficients a
2.036 .830 2.452 .015
-.261 .148 -.159 -1.771 .079
.125 .119 .098 1.049 .296
.334 .128 .226 2.613 .010
-.126 .102 -.095 -1.235 .219
5.98E-02 .089 .055 .668 .505
.190 .118 .140 1.617 .108
.309 .131 .221 2.362 .019
5.67E-02 .097 .048 .587 .558
-.293 .135 -.191 -2.176 .031
(Constant)
Enjoyment
Challenge
Outward
Compensation
Extraversion
Agreeableness
Conscientiousness
Neurotic
Openness
Model
1
B Std. Error
UnstandardizedCoefficients
Beta
StandardizedCoefficients
t Sig.
Dependent Variable: Fit-organizationa.
Appendix 20-S1. Regression of fit-organization on traits
Page 158
158
Model Summary
.687a .472 .452 .51539
Model1
R R SquareAdjustedR Square
Std. Error ofthe Estimate
Predictors : (Constant), Alternatives, Skillstransferability, Role ambiguity, Supervisor support, Jobinvestments, Organizational support
a.
ANOVAb
37.060 6 6.177 23.253 .000a
41.438 156 .266
78.497 162
Regression
Residual
Total
Model
1
Sum ofSquares df Mean Square F Sig.
Predictors : (Constant), Alternatives, Skills transferability, Role ambiguity,Supervisor support, Job investments, Organizational support
a.
Dependent Variable: Fit-organizationb.
Coefficients a
1.868 .374 4.994 .000
-.103 .070 -.090 -1.466 .145
.367 .060 .462 6.156 .000
7.92E-02 .052 .111 1.535 .127
.141 .064 .140 2.199 .029
9.84E-02 .072 .092 1.362 .175
-.191 .049 -.232 -3.939 .000
(Constant)
Role ambiguity
Organizational support
Supervisor support
Job investments
Skills transferability
Alternatives
Model
1
B Std. Error
UnstandardizedCoefficients
Beta
StandardizedCoefficients
t Sig.
Dependent Variable: Fit-organizationa.
Appendix 21-S1. Regression fit-organization on work perceptions
Model Summary
.135a .018 .012 .69180
Model
1
R R SquareAdjustedR Square
Std. Error ofthe Estimate
Predictors : (Constant), Mating in organizationa.
ANOVAb
1.470 1 1.470 3.071 .082a
78.966 165 .479
80.436 166
Regression
Residual
Total
Model
1
Sum ofSquares df Mean Square F Sig.
Predictors : (Constant), Mating in organizationa.
Dependent Variable: Fit-organizationb.
Page 159
159
Coefficientsa
3.071 .118 25.924 .000
7.99E-02 .046 .135 1.752 .082
(Constant)
Mating in organization
Model
1
B Std. Error
UnstandardizedCoefficients
Beta
StandardizedCoefficients
t Sig.
Dependent Variable: Fit-organizationa.
Appendix 22-S1. Regression of fit-organization on the biologic factor
Model Summary
.176a .031 .012 .68661
Model
1
R R SquareAdjustedR Square
Std. Error ofthe Estimate
Predictors: (Constant), Time in the organization (z),Strength of attachment, Age (z)
a.
ANOVAb
2.294 3 .765 1.622 .187a
72.128 153 .471
74.422 156
Regression
Residual
Total
Model
1
Sum ofSquares df Mean Square F Sig.
Predictors : (Constant), Time in the organization (z), Strength of attachment, Age (z)a.
Dependent Variable: Sacrifice-organizationb.
Coefficients a
3.140 .106 29.569 .000
3.91E-02 .031 .101 1.249 .214
-.118 .065 -.171 -1.812 .072
9.92E-02 .065 .144 1.537 .126
(Constant)
Strength of attachment
Age (z)
Time in theorganization (z)
Model
1
B Std. Error
UnstandardizedCoefficients
Beta
StandardizedCoefficients
t Sig.
Dependent Variable: Sacrifice-organizationa.
Appendix 23-S1. Regression of sacrifice-organization on demographics
Model Summary
.246a .060 .007 .68829
Model1
R R SquareAdjustedR Square
Std. Error ofthe Estimate
Predictors : (Constant), Openness, Compensation,Neurotic, Outward, Extraversion, Agreeableness,Enjoyment, Conscientiousness, Challenge
a.
Page 160
160
ANOVAb
4.818 9 .535 1.130 .345a
74.852 158 .474
79.670 167
Regression
Residual
Total
Model
1
Sum ofSquares df Mean Square F Sig.
Predictors : (Constant), Openness, Compensation, Neurotic, Outward, Extraversion,Agreeableness, Enjoyment, Conscientiousness, Challenge
a.
Dependent Variable: Sacrifice-organizationb.
Coefficients a
2.073 .865 2.396 .018
-.151 .154 -.092 -.981 .328
.102 .124 .081 .821 .413
.136 .133 .093 1.023 .308
-3.8E-02 .107 -.029 -.360 .719
4.36E-02 .093 .040 .468 .640
.268 .122 .199 2.185 .030
3.00E-02 .137 .022 .220 .826
.151 .101 .128 1.498 .136
-.152 .140 -.100 -1.084 .280
(Constant)
Enjoyment
Challenge
Outward
Compensation
Extraversion
Agreeableness
Conscientiousness
Neurotic
Openness
Model
1
B Std. Error
UnstandardizedCoefficients
Beta
StandardizedCoefficients
t Sig.
Dependent Variable: Sacrifice-organizationa.
Appendix 24-S1. Regression of sacrifice-organization on traits
Model Summary
.667a .445 .424 .52434
Model
1
R R SquareAdjustedR Square
Std. Error ofthe Estimate
Predictors : (Constant), Alternatives, Skillstransferability, Role ambiguity, Supervisor support, Jobinvestments, Organizational support
a.
ANOVAb
34.395 6 5.732 20.850 .000a
42.890 156 .275
77.285 162
Regression
Residual
Total
Model
1
Sum ofSquares df Mean Square F Sig.
Predictors : (Constant), Alternatives, Skills transferability, Role ambiguity,Supervisor support, Job investments, Organizational support
a.
Dependent Variable: Sacrifice-organizationb.
Page 161
161
Coefficients a
2.431 .381 6.387 .000
-.107 .072 -.094 -1.487 .139
.300 .061 .382 4.954 .000
.143 .053 .202 2.733 .007
-8.1E-02 .065 -.081 -1.234 .219
.173 .074 .164 2.354 .020
-.239 .049 -.293 -4.852 .000
(Constant)
Role ambiguity
Organizational support
Supervisor support
Job investments
Skills transferability
Alternatives
Model
1
B Std. Error
UnstandardizedCoefficients
Beta
StandardizedCoefficients
t Sig.
Dependent Variable: Sacrifice-organizationa.
Appendix 25-S1. Regression of sacrifice-organization on work perceptions
Model Summary
.071a .005 -.001 .69103
Model
1
R R SquareAdjustedR Square
Std. Error ofthe Estimate
Predictors : (Constant), Mating in organizationa.
ANOVAb
.403 1 .403 .844 .360a
78.790 165 .478
79.193 166
Regression
Residual
Total
Model
1
Sum ofSquares df Mean Square F Sig.
Predictors : (Constant), Mating in organizationa.
Dependent Variable: Sacrifice-organizationb.
Coefficients a
3.157 .118 26.683 .000
4.18E-02 .046 .071 .918 .360
(Constant)
Mating in organization
Model
1
B Std. Error
UnstandardizedCoefficients
Beta
StandardizedCoefficients
t Sig.
Dependent Variable: Sacrifice-organizationa.
Appendix 26-S1. Regression of sacrifice-organization on the biologic factor
Page 162
162
SAMPLE TWO
ANOVAb
14.812 19 .780 7.625 .000a
10.429 102 .102
25.241 121
Regression
Residual
Total
Model1
Sum ofSquares df Mean Square F Sig.
Predictors : (Constant), Mating in community, Job investments, Openness, Outward,Number of children (z), Role ambiguity, Agreeableness, Alternatives, Mating inorganization, Extravers ion, Compensation, Enjoyment, Challenge, Age (z),Neuroticism, Supervisor support, Skills transferabili ty, Conscientiousness,Organizational support
a.
Dependent Variable: Overal embeddednessb.
Coefficients a
9.77E-02 .566 .173 .863
-4.0E-02 .034 -.087 -1.169 .245
2.60E-03 .040 .006 .065 .948
9.78E-02 .109 .076 .897 .372
3.77E-02 .076 .042 .496 .621
9.45E-02 .087 .081 1.084 .281
-.179 .046 -.299 -3.853 .000
9.21E-02 .049 .146 1.871 .064
.288 .089 .320 3.252 .002
-5.7E-02 .090 -.061 -.627 .532
.131 .063 .180 2.073 .041
-7.1E-03 .077 -.009 -.091 .927
5.97E-02 .051 .127 1.179 .241
-4.3E-02 .048 -.102 -.891 .375
.117 .042 .305 2.787 .006
.135 .049 .228 2.744 .007
3.10E-02 .050 .059 .624 .534
-.184 .055 -.304 -3.345 .001
8.57E-02 .027 .249 3.217 .002
3.66E-02 .025 .109 1.438 .154
(Constant)
Number of children (z)
Age (z)
Enjoyment
Challenge
Outward
Compensation
Extraversion
Agreeableness
Conscientiousness
Neuroticism
Openness
Role ambiguity
Organizational support
Supervisor support
Job investments
Skills transferability
Alternatives
Mating in organization
Mating in community
Model
1
B Std. Error
UnstandardizedCoefficients
Beta
StandardizedCoefficients
t Sig.
Dependent Variable: Overal embeddednessa.
Appendix 1-S1. Regression of overall embeddedness on all antecedents
Model Summary
.346a .120 .105 .43197
Model
1
R R SquareAdjustedR Square
Std. Error ofthe Estimate
Predictors : (Constant), Age (z), Number of children (z)a.
Page 163
163
ANOVAb
3.124 2 1.562 8.371 .000a
22.951 123 .187
26.075 125
Regression
Residual
Total
Model
1
Sum ofSquares df Mean Square F Sig.
Predictors : (Constant), Age (z), Number of children (z)a.
Dependent Variable: Overal embeddednessb.
Coefficients a
2.677 .038 70.375 .000
-7.0E-02 .039 -.153 -1.767 .080
.157 .039 .343 3.973 .000
(Constant)
Number of children (z)
Age (z)
Model
1
B Std. Error
UnstandardizedCoefficients
Beta
StandardizedCoefficients
t Sig.
Dependent Variable: Overal embeddednessa.
Appendix 2-S2. Regression of overall embeddedness on demographics
Model Summary
.481a .232 .174 .41519
Model
1
R R SquareAdjustedR Square
Std. Error ofthe Estimate
Predictors : (Constant), Openness, Outward,Neuroticism, Compensation, Agreeableness,Challenge, Extraversion, Enjoyment,Conscientiousness
a.
ANOVAb
6.187 9 .687 3.988 .000a
20.514 119 .172
26.701 128
Regression
Residual
Total
Model
1
Sum ofSquares df Mean Square F Sig.
Predictors : (Constant), Openness, Outward, Neuroticism, Compensation,Agreeableness, Challenge, Extraversion, Enjoyment, Conscientiousness
a.
Dependent Variable: Overal embeddednessb.
Page 164
164
Coefficients a
.636 .675 .941 .348
.109 .124 .084 .878 .382
.178 .086 .198 2.076 .040
.193 .105 .165 1.839 .068
-.129 .052 -.216 -2.464 .015
8.72E-02 .060 .138 1.444 .151
.272 .090 .302 3.028 .003
-2.0E-02 .100 -.022 -.203 .839
-3.2E-02 .070 -.045 -.462 .645
-3.7E-02 .082 -.046 -.451 .653
(Constant)
Enjoyment
Challenge
Outward
Compensation
Extraversion
Agreeableness
Conscientiousness
Neuroticism
Openness
Model
1
B Std. Error
UnstandardizedCoefficients
Beta
StandardizedCoefficients
t Sig.
Dependent Variable: Overal embeddednessa.
Appendix 3-S2. Regression of overall embeddedness on traits
Model Summary
.584a .341 .308 .37990
Model1
R R SquareAdjustedR Square
Std. Error ofthe Estimate
Predictors : (Constant), Alternatives, Job investments,Skills transferability, Supervisor support, Roleambiguity, Organizational support
a.
ANOVAb
9.094 6 1.516 10.502 .000a
17.607 122 .144
26.701 128
Regression
Residual
Total
Model
1
Sum ofSquares df Mean Square F Sig.
Predictors : (Constant), Alternatives, Job investments, Skills transferability,Supervisor support, Role ambiguity, Organizational support
a.
Dependent Variable: Overal embeddednessb.
Coefficients a
1.770 .286 6.179 .000
7.94E-03 .052 .017 .153 .878
-7.3E-04 .052 -.002 -.014 .989
.158 .045 .410 3.472 .001
8.38E-02 .045 .142 1.872 .064
7.36E-02 .050 .141 1.466 .145
-9.4E-02 .048 -.156 -1.959 .052
(Constant)
Role ambiguity
Organizational support
Supervisor support
Job investments
Skills transferability
Alternatives
Model
1
B Std. Error
UnstandardizedCoefficients
Beta
StandardizedCoefficients
t Sig.
Dependent Variable: Overal embeddednessa.
Appendix 4-S2. Regression of overall embeddedness on work perceptions
Page 165
165
Model Summary
.323a .104 .090 .43577
Model
1
R R SquareAdjustedR Square
Std. Error ofthe Estimate
Predictors : (Constant), Mating in community, Mating inorganization
a.
ANOVAb
2.699 2 1.350 7.108 .001a
23.167 122 .190
25.867 124
Regression
Residual
Total
Model
1
Sum ofSquares df Mean Square F Sig.
Predictors : (Constant), Mating in community, Mating in organizationa.
Dependent Variable: Overal embeddednessb.
Coefficients a
2.308 .106 21.723 .000
8.22E-02 .030 .238 2.760 .007
6.37E-02 .029 .189 2.190 .030
(Constant)
Mating in organization
Mating in community
Model
1
B Std. Error
UnstandardizedCoefficients
Beta
StandardizedCoefficients
t Sig.
Dependent Variable: Overal embeddednessa.
Appendix 5-S2. Regression of overall embeddedness on the biologic factor
Model Summary
.489a .239 .227 .44981
Model
1
R R SquareAdjustedR Square
Std. Error ofthe Estimate
Predictors : (Constant), Age (z), Number of children (z)a.
ANOVAb
7.822 2 3.911 19.329 .000a
24.886 123 .202
32.708 125
Regression
Residual
Total
Model
1
Sum ofSquares df Mean Square F Sig.
Predictors : (Constant), Age (z), Number of children (z)a.
Dependent Variable: Links-communityb.
Page 166
166
Coefficients a
1.452 .040 36.667 .000
.162 .041 .316 3.937 .000
.161 .041 .314 3.910 .000
(Constant)
Number of children (z)
Age (z)
Model
1
B Std. Error
UnstandardizedCoefficients
Beta
StandardizedCoefficients
t Sig.
Dependent Variable: Links-communitya.
Appendix 6-S2. Regression of links-community on demographics
Model Summary
.227a .052 .013 .50814
Model
1
R R SquareAdjustedR Square
Std. Error ofthe Estimate
Predictors: (Constant), Openness, Neuroticism,Agreeableness, Extravers ion, Conscientiousness
a.
ANOVAb
1.733 5 .347 1.342 .251a
31.760 123 .258
33.493 128
Regression
Residual
Total
Model
1
Sum ofSquares df Mean Square F Sig.
Predictors : (Constant), Openness, Neuroticism, Agreeableness, Extraversion,Conscientiousness
a.
Dependent Variable: Links-communityb.
Coefficients a
1.000 .636 1.573 .118
1.72E-02 .073 .024 .235 .815
.263 .107 .261 2.457 .015
-.121 .121 -.116 -1.000 .319
-1.8E-02 .083 -.022 -.220 .826
-2.0E-02 .089 -.022 -.230 .819
(Constant)
Extraversion
Agreeableness
Conscientiousness
Neuroticism
Openness
Model
1
B Std. Error
UnstandardizedCoefficients
Beta
StandardizedCoefficients
t Sig.
Dependent Variable: Links-communitya.
Appendix 7-S2. Regression of links-community on traits
Model Summary
.137a .019 .011 .50877
Model
1
R R SquareAdjustedR Square
Std. Error ofthe Estimate
Predictors : (Constant), Mating in communitya.
Page 167
167
ANOVAb
.608 1 .608 2.347 .128a
31.838 123 .259
32.446 124
Regression
Residual
Total
Model
1
Sum ofSquares df Mean Square F Sig.
Predictors : (Constant), Mating in communitya.
Dependent Variable: Links-communityb.
Coefficients a
1.313 .102 12.934 .000
5.16E-02 .034 .137 1.532 .128
(Constant)
Mating in community
Model
1
B Std. Error
UnstandardizedCoefficients
Beta
StandardizedCoefficients
t Sig.
Dependent Variable: Links-communitya.
Appendix 8-S2. Regression of links-community on the biologic factor
Model Summary
.298a .089 .059 .89793
Model
1
R R SquareAdjustedR Square
Std. Error ofthe Estimate
Predictors: (Constant), Number of children (z), Time inthe community (z), Strength of at tachment, Age (z)
a.
ANOVAb
9.534 4 2.383 2.956 .023a
97.560 121 .806
107.094 125
Regression
Residual
Total
Model
1
Sum ofSquares df Mean Square F Sig.
Predictors : (Constant), Number of children (z), Time in the community (z), Strengthof attachment, Age (z)
a.
Dependent Variable: Fit-communityb.
Coefficients a
3.886 .192 20.188 .000
9.89E-02 .103 .107 .961 .339
-.276 .096 -.298 -2.878 .005
5.03E-03 .052 .009 .097 .923
-.144 .084 -.156 -1.715 .089
(Constant)
Age (z)
Time in the community (z)
Strength of attachment
Number of children (z)
Model
1
B Std. Error
UnstandardizedCoefficients
Beta
StandardizedCoefficients
t Sig.
Dependent Variable: Fit-communitya.
Appendix 9-S2a. Regression of fit-community on demographics
Page 168
168
Correlations
1 .219* .544** -.250**
. .012 .000 .004
129 129 126 129
.219* 1 .107 .116
.012 . .231 .190
129 129 126 129
.544** .107 1 -.083
.000 .231 . .355
126 126 126 126
-.250** .116 -.083 1
.004 .190 .355 .
129 129 126 129
Pearson Correlation
Sig. (2-tailed)
N
Pearson Correlation
Sig. (2-tailed)
N
Pearson Correlation
Sig. (2-tailed)
N
Pearson Correlation
Sig. (2-tailed)
N
Time in the community (z)
I am a real New Yorker
Age (z)
Fit-community
Time in thecommunity (z)
I am a realNew Yorker Age (z) Fit-community
Correlation is significant at the 0.05 level (2-tai led).*.
Correlation is significant at the 0.01 level (2-tai led).**.
Appendix 9-S2b. Correlations between fit-community, time-community, age, and item “I am a real
New Yorker”
Model Summary
.281a .079 .042 .90611
Model
1
R R SquareAdjustedR Square
Std. Error ofthe Estimate
Predictors : (Constant), Openness, Neuroticism,Agreeableness, Extraversion, Conscientiousness
a.
ANOVAb
8.676 5 1.735 2.114 .068a
100.987 123 .821
109.664 128
Regression
Residual
Total
Model
1
Sum ofSquares df Mean Square F Sig.
Predictors : (Constant), Openness, Neuroticism, Agreeableness, Extraversion,Conscientiousness
a.
Dependent Variable: Fit-communityb.
Page 169
169
Coefficients a
3.011 1.133 2.657 .009
.264 .131 .207 2.022 .045
.381 .191 .209 1.994 .048
-.521 .216 -.275 -2.411 .017
.212 .148 .144 1.440 .152
1.32E-02 .158 .008 .083 .934
(Constant)
Extraversion
Agreeableness
Conscientiousness
Neuroticism
Openness
Model
1
B Std. Error
UnstandardizedCoefficients
Beta
StandardizedCoefficients
t Sig.
Dependent Variable: Fit-communitya.
Appendix 10-S2. Regression of fit-community on traits
Model Summary
.153a .023 .015 .91847
Model
1
R R SquareAdjustedR Square
Std. Error ofthe Estimate
Predictors : (Constant), Mating in communitya.
ANOVAb
2.476 1 2.476 2.935 .089a
103.761 123 .844
106.237 124
Regression
Residual
Total
Model
1
Sum ofSquares df Mean Square F Sig.
Predictors : (Constant), Mating in communitya.
Dependent Variable: Fit-communityb.
Coefficients a
3.622 .183 19.765 .000
.104 .061 .153 1.713 .089
(Constant)
Mating in community
Model
1
B Std. Error
UnstandardizedCoefficients
Beta
StandardizedCoefficients
t Sig.
Dependent Variable: Fit-communitya.
Appendix 11-S2. Regression of fit-community on the biologic factor
Model Summary
.255a .065 .034 .93457
Model
1
R R SquareAdjustedR Square
Std. Error ofthe Estimate
Predictors : (Constant), Strength of attachment, Time inthe community (z), Number of children (z), Age (z)
a.
Page 170
170
ANOVAb
7.342 4 1.836 2.102 .085a
105.685 121 .873
113.027 125
Regression
Residual
Total
Model
1
Sum ofSquares df Mean Square F Sig.
Predictors : (Constant), Strength of attachment, Time in the community (z), Numberof children (z), Age (z)
a.
Dependent Variable: Sacrifice-communityb.
Coefficients a
3.424 .200 17.089 .000
-.202 .087 -.213 -2.316 .022
-.120 .107 -.126 -1.116 .267
.102 .100 .108 1.025 .307
1.24E-03 .054 .002 .023 .982
(Constant)
Number of children (z)
Age (z)
Time in the community (z)
Strength of attachment
Model
1
B Std. Error
UnstandardizedCoefficients
Beta
StandardizedCoefficients
t Sig.
Dependent Variable: Sacrifice-communitya.
Appendix 12-S2. Regression of sacrifice-community on demographics
Model Summary
.177a .031 -.008 .95474
Model
1
R R SquareAdjustedR Square
Std. Error ofthe Estimate
Predictors : (Constant), Openness, Neuroticism,Agreeableness, Extraversion, Conscientiousness
a.
ANOVAb
3.622 5 .724 .795 .555a
112.118 123 .912
115.740 128
Regression
Residual
Total
Model
1
Sum ofSquares df Mean Square F Sig.
Predictors : (Constant), Openness, Neuroticism, Agreeableness, Extraversion,Conscientiousness
a.
Dependent Variable: Sacrifice-communityb.
Page 171
171
Coefficients a
2.720 1.194 2.278 .024
.110 .138 .084 .798 .426
-5.1E-04 .201 .000 -.003 .998
-4.5E-02 .228 -.023 -.198 .843
.273 .155 .181 1.759 .081
-5.7E-02 .167 -.034 -.343 .732
(Constant)
Extraversion
Agreeableness
Conscientiousness
Neuroticism
Openness
Model
1
B Std. Error
UnstandardizedCoefficients
Beta
StandardizedCoefficients
t Sig.
Dependent Variable: Sacrifice-communitya.
Appendix 13-S2. Regression of sacrifice-community on traits
Model Summary
.165a .027 .019 .94160
Model
1
R R SquareAdjustedR Square
Std. Error ofthe Estimate
Predictors : (Constant), Mating in communitya.
ANOVAb
3.069 1 3.069 3.462 .065a
109.053 123 .887
112.123 124
Regression
Residual
Total
Model
1
Sum ofSquares df Mean Square F Sig.
Predictors : (Constant), Mating in communitya.
Dependent Variable: Sacrifice-communityb.
Coefficients a
3.115 .188 16.581 .000
.116 .062 .165 1.861 .065
(Constant)
Mating in community
Model
1
B Std. Error
UnstandardizedCoefficients
Beta
StandardizedCoefficients
t Sig.
Dependent Variable: Sacrifice-communitya.
Appendix 14-S2. Regression of sacrifice-community on the biologic factor
Model Summary
.616a .379 .364 .56010
Model
1
R R SquareAdjustedR Square
Std. Error ofthe Estimate
Predictors: (Constant), Strength of at tachment,Number of children (z), Age (z)
a.
Page 172
172
ANOVAb
23.353 3 7.784 24.813 .000a
38.273 122 .314
61.626 125
Regression
Residual
Total
Model
1
Sum ofSquares df Mean Square F Sig.
Predictors : (Constant), Strength of attachment, Number of children (z), Age (z)a.
Dependent Variable: Links-organizationb.
Coefficients a
.947 .120 7.884 .000
.468 .055 .666 8.501 .000
-1.3E-02 .052 -.018 -.243 .808
-6.9E-02 .032 -.169 -2.127 .035
(Constant)
Age (z)
Number of children (z)
Strength of attachment
Model
1
B Std. Error
UnstandardizedCoefficients
Beta
StandardizedCoefficients
t Sig.
Dependent Variable: Links-organizationa.
Appendix 15-S2. Regression of links-organization on demographics
Model Summary
.416a .173 .110 .66237
Model
1
R R SquareAdjustedR Square
Std. Error ofthe Estimate
Predictors : (Constant), Openness, Outward,Neuroticism, Compensation, Agreeableness,Challenge, Extraversion, Enjoyment,Conscientiousness
a.
ANOVAb
10.895 9 1.211 2.759 .006a
52.210 119 .439
63.105 128
Regression
Residual
Total
Model
1
Sum ofSquares df Mean Square F Sig.
Predictors : (Constant), Openness, Outward, Neuroticism, Compensation,Agreeableness, Challenge, Extraversion, Enjoyment, Conscientiousness
a.
Dependent Variable: Links-organizationb.
Page 173
173
Coefficients a
-.810 1.077 -.752 .454
-2.4E-02 .197 -.012 -.120 .905
4.17E-02 .137 .030 .305 .761
.101 .168 .056 .602 .548
-.208 .083 -.226 -2.493 .014
.105 .096 .108 1.089 .278
4.40E-02 .144 .032 .306 .760
.181 .159 .126 1.142 .256
-9.8E-02 .112 -.087 -.871 .385
.183 .131 .147 1.395 .166
(Constant)
Enjoyment
Challenge
Outward
Compensation
Extraversion
Agreeableness
Conscientiousness
Neuroticism
Openness
Model
1
B Std. Error
UnstandardizedCoefficients
Beta
StandardizedCoefficients
t Sig.
Dependent Variable: Links-organizationa.
Appendix 16-S2. Regression of links-organization on traits
Model Summary
.272a .074 .028 .69211
Model1
R R SquareAdjustedR Square
Std. Error ofthe Estimate
Predictors : (Constant), Alternatives, Job investments,Skills transferability, Supervisor support, Roleambiguity, Organizational support
a.
ANOVAb
4.664 6 .777 1.623 .146a
58.441 122 .479
63.105 128
Regression
Residual
Total
Model
1
Sum ofSquares df Mean Square F Sig.
Predictors : (Constant), Alternatives, Job investments, Skills transferability,Supervisor support, Role ambiguity, Organizational support
a.
Dependent Variable: Links-organizationb.
Page 174
174
Coefficients a
1.116 .522 2.140 .034
.122 .094 .170 1.297 .197
-2.5E-02 .096 -.039 -.261 .795
-6.4E-02 .083 -.108 -.770 .443
.105 .082 .115 1.282 .202
-7.1E-02 .091 -.088 -.774 .440
-.203 .088 -.219 -2.314 .022
(Constant)
Role ambiguity
Organizational support
Supervisor support
Job investments
Skills transferability
Alternatives
Model
1
B Std. Error
UnstandardizedCoefficients
Beta
StandardizedCoefficients
t Sig.
Dependent Variable: Links-organizationa.
Appendix 17-S2. Regression of links-organization on work perceptions
Model Summary
.232a .054 .046 .68574
Model
1
R R SquareAdjustedR Square
Std. Error ofthe Estimate
Predictors : (Constant), Mating in organizationa.
ANOVAb
3.293 1 3.293 7.004 .009a
57.840 123 .470
61.133 124
Regression
Residual
Total
Model
1
Sum ofSquares df Mean Square F Sig.
Predictors : (Constant), Mating in organizationa.
Dependent Variable: Links-organizationb.
Coefficientsa
.420 .127 3.306 .001
.123 .046 .232 2.646 .009
(Constant)
Mating in organization
Model
1
B Std. Error
UnstandardizedCoefficients
Beta
StandardizedCoefficients
t Sig.
Dependent Variable: Links-organizationa.
Appendix 18-S2. Regression of links-organization on the biologic factor
Model Summary
.403a .163 .142 .73178
Model
1
R R SquareAdjustedR Square
Std. Error ofthe Estimate
Predictors: (Constant), Strength of at tachment, Time inthe organization (z), Age (z)
a.
Page 175
175
ANOVAb
12.590 3 4.197 7.837 .000a
64.795 121 .535
77.385 124
Regression
Residual
Total
Model
1
Sum ofSquares df Mean Square F Sig.
Predictors : (Constant), Strength of attachment, Time in the organization (z), Age (z)a.
Dependent Variable: Fit-organizationb.
Coefficients a
3.102 .155 19.985 .000
.245 .085 .310 2.889 .005
-6.8E-02 .078 -.086 -.867 .387
9.37E-02 .042 .204 2.237 .027
(Constant)
Age (z)
Time in theorganization (z)
Strength of attachment
Model
1
B Std. Error
UnstandardizedCoefficients
Beta
StandardizedCoefficients
t Sig.
Dependent Variable: Fit-organizationa.
Appendix 19-S2. Regression of fit-organization on demographics
Model Summary
.559a .312 .260 .67938
Model
1
R R SquareAdjustedR Square
Std. Error ofthe Estimate
Predictors : (Constant), Openness, Outward,Neuroticism, Compensation, Agreeableness,Challenge, Extraversion, Enjoyment,Conscientiousness
a.
ANOVAb
24.956 9 2.773 6.008 .000a
54.925 119 .462
79.882 128
Regression
Residual
Total
Model
1
Sum ofSquares df Mean Square F Sig.
Predictors : (Constant), Openness, Outward, Neuroticism, Compensation,Agreeableness, Challenge, Extraversion, Enjoyment, Conscientiousness
a.
Dependent Variable: Fit-organizationb.
Page 176
176
Coefficients a
.251 1.105 .228 .820
7.68E-02 .202 .034 .380 .705
.249 .140 .160 1.776 .078
-9.8E-02 .172 -.048 -.567 .572
-.155 .086 -.150 -1.815 .072
-4.1E-03 .099 -.004 -.042 .967
.404 .147 .259 2.742 .007
.233 .163 .144 1.434 .154
-.114 .115 -.091 -.994 .322
.136 .135 .097 1.010 .315
(Constant)
Enjoyment
Challenge
Outward
Compensation
Extraversion
Agreeableness
Conscientiousness
Neuroticism
Openness
Model
1
B Std. Error
UnstandardizedCoefficients
Beta
StandardizedCoefficients
t Sig.
Dependent Variable: Fit-organizationa.
Appendix 20-S2. Regression of fit-organization on traits
Model Summary
.598a .358 .326 .64832
Model1
R R SquareAdjustedR Square
Std. Error ofthe Estimate
Predictors : (Constant), Alternatives, Job investments,Skills transferability, Supervisor support, Roleambiguity, Organizational support
a.
ANOVAb
28.603 6 4.767 11.342 .000a
51.279 122 .420
79.882 128
Regression
Residual
Total
Model
1
Sum ofSquares df Mean Square F Sig.
Predictors : (Constant), Alternatives, Job investments, Skills transferability,Supervisor support, Role ambiguity, Organizational support
a.
Dependent Variable: Fit-organizationb.
Coefficients a
1.615 .489 3.304 .001
1.34E-02 .088 .016 .151 .880
5.48E-02 .089 .076 .612 .542
.245 .078 .368 3.158 .002
.185 .076 .181 2.421 .017
.115 .086 .127 1.339 .183
-.140 .082 -.134 -1.706 .091
(Constant)
Role ambiguity
Organizational support
Supervisor support
Job investments
Skills transferability
Alternatives
Model
1
B Std. Error
UnstandardizedCoefficients
Beta
StandardizedCoefficients
t Sig.
Dependent Variable: Fit-organizationa.
Appendix 21-S2. Regression of fit-organization on work perceptions
Page 177
177
Model Summary
.306a .093 .086 .75525
Model
1
R R SquareAdjustedR Square
Std. Error ofthe Estimate
Predictors : (Constant), Mating in organizationa.
ANOVAb
7.226 1 7.226 12.667 .001a
70.160 123 .570
77.385 124
Regression
Residual
Total
Model
1
Sum ofSquares df Mean Square F Sig.
Predictors : (Constant), Mating in organizationa.
Dependent Variable: Fit-organizationb.
Coefficientsa
2.982 .140 21.328 .000
.182 .051 .306 3.559 .001
(Constant)
Mating in organization
Model
1
B Std. Error
UnstandardizedCoefficients
Beta
StandardizedCoefficients
t Sig.
Dependent Variable: Fit-organizationa.
Appendix 22-S2. Regression of fit-organization on the biologic factor
Model Summary
.259a .067 .044 .85077
Model
1
R R SquareAdjustedR Square
Std. Error ofthe Estimate
Predictors: (Constant), Time in the organization (z),Strength of attachment, Age (z)
a.
ANOVAb
6.298 3 2.099 2.900 .038a
87.580 121 .724
93.878 124
Regression
Residual
Total
Model
1
Sum ofSquares df Mean Square F Sig.
Predictors : (Constant), Time in the organization (z), Strength of attachment, Age (z)a.
Dependent Variable: Sacrifice-organizationb.
Page 178
178
Coefficients a
2.878 .180 15.949 .000
7.91E-02 .049 .157 1.624 .107
.160 .098 .183 1.622 .107
-.105 .091 -.121 -1.155 .250
(Constant)
Strength of attachment
Age (z)
Time in theorganization (z)
Model
1
B Std. Error
UnstandardizedCoefficients
Beta
StandardizedCoefficients
t Sig.
Dependent Variable: Sacrifice-organizationa.
Appendix 23-S2. Regression of sacrifice-organization on demographics
Model Summary
.500a .250 .193 .78155
Model
1
R R SquareAdjustedR Square
Std. Error ofthe Estimate
Predictors : (Constant), Openness, Outward,Neuroticism, Compensation, Agreeableness,Challenge, Extraversion, Enjoyment,Conscientiousness
a.
ANOVAb
24.218 9 2.691 4.405 .000a
72.688 119 .611
96.906 128
Regression
Residual
Total
Model
1
Sum ofSquares df Mean Square F Sig.
Predictors : (Constant), Openness, Outward, Neuroticism, Compensation,Agreeableness, Challenge, Extraversion, Enjoyment, Conscientiousness
a.
Dependent Variable: Sacrifice-organizationb.
Coefficients a
1.722 1.271 1.355 .178
8.64E-03 .233 .004 .037 .970
.158 .162 .092 .978 .330
.385 .198 .172 1.944 .054
-.204 .098 -.179 -2.071 .041
5.25E-02 .114 .044 .462 .645
.360 .169 .210 2.127 .035
.105 .187 .059 .558 .578
-.443 .132 -.320 -3.352 .001
-6.0E-02 .155 -.039 -.387 .699
(Constant)
Enjoyment
Challenge
Outward
Compensation
Extraversion
Agreeableness
Conscientiousness
Neuroticism
Openness
Model
1
B Std. Error
UnstandardizedCoefficients
Beta
StandardizedCoefficients
t Sig.
Dependent Variable: Sacrifice-organizationa.
Appendix 24-S2. Regression of sacrifice-organization on traits
Page 179
179
Model Summary
.716a .513 .489 .62205
Model
1
R R SquareAdjustedR Square
Std. Error ofthe Estimate
Predictors : (Constant), Alternatives, Job investments,Skills transferability, Supervisor support, Roleambiguity, Organizational support
a.
ANOVAb
49.699 6 8.283 21.407 .000a
47.207 122 .387
96.906 128
Regression
Residual
Total
Model
1
Sum ofSquares df Mean Square F Sig.
Predictors : (Constant), Alternatives, Job investments, Skills transferability,Supervisor support, Role ambiguity, Organizational support
a.
Dependent Variable: Sacrifice-organizationb.
Coefficients a
1.227 .469 2.616 .010
-8.5E-03 .085 -.010 -.101 .920
4.59E-02 .086 .057 .534 .594
.358 .074 .488 4.811 .000
9.51E-02 .073 .085 1.297 .197
.193 .082 .194 2.346 .021
-.200 .079 -.174 -2.540 .012
(Constant)
Role ambiguity
Organizational support
Supervisor support
Job investments
Skills transferability
Alternatives
Model
1
B Std. Error
UnstandardizedCoefficients
Beta
StandardizedCoefficients
t Sig.
Dependent Variable: Sacrifice-organizationa.
Appendix 25-S2. Regression of sacrifice-organization on work perceptions
Model Summary
.222a .049 .042 .85179
Model
1
R R SquareAdjustedR Square
Std. Error ofthe Estimate
Predictors : (Constant), Mating in organizationa.
ANOVAb
4.635 1 4.635 6.389 .013a
89.242 123 .726
93.878 124
Regression
Residual
Total
Model
1
Sum ofSquares df Mean Square F Sig.
Predictors : (Constant), Mating in organizationa.
Dependent Variable: Sacrifice-organizationb.
Page 180
180
Coefficients a
2.796 .158 17.729 .000
.146 .058 .222 2.528 .013
(Constant)
Mating in organization
Model
1
B Std. Error
UnstandardizedCoefficients
Beta
StandardizedCoefficients
t Sig.
Dependent Variable: Sacrifice-organizationa.
Appendix 26-S2. Regression of sacrifice-organization on the biologic factor
Race
50 29.1 29.8 29.8
49 28.5 29.2 58.9
64 37.2 38.1 97.0
4 2.3 2.4 99.4
1 .6 .6 100.0
168 97.7 100.0
4 2.3
172 100.0
White
Black
Hispanic
As ian
Other (specify)
Total
Valid
SystemMissing
Total
Frequency Percent Valid Percent
Cumulative
Percent
Univariate Analysis of Variance (sample one)
Between-Subjects Factors
63
105
White 50
Black 49
Hispanic 64
As ian 4
Other
(specify)1
1
2
Gender
1
2
3
4
5
Race
Value Label N
Page 181
181
Tests of Between-Subjects Effects
Dependent Variable: Overall embeddedness
2.916a 8 .364 1.691 .104
171.784 1 171.784 797.172 .000
.128 1 .128 .593 .442
2.252 4 .563 2.612 .037
.312 3 .104 .483 .695
34.263 159 .215
1127.112 168
37.179 167
Source
Corrected Model
Intercept
GENDER
RACE
GENDER * RACE
Error
Total
Corrected Total
Type III Sum
of Squares df Mean Square F Sig.
R Squared = .078 (Adjusted R Squared = .032)a.
Profile Plots (sample one)
Estimated Marginal Means of Overall embeddedness
Race
Other (specify)AsianHispanicBlackWhite
Est
imat
ed M
argi
nal M
eans
3.0
2.8
2.6
2.4
2.2
2.0
Appendix 4A. Effects of race and gender on overall embeddedness (sample one)
Sample two
Page 182
182
Race
91 72.8 72.8 72.8
11 8.8 8.8 81.6
10 8.0 8.0 89.6
12 9.6 9.6 99.2
1 .8 .8 100.0
125 100.0 100.0
White
Black
Hispanic
As ian
Other (specify)
Total
Valid
Frequency Percent Valid Percent
Cumulative
Percent
Univariate Analysis of Variance (sample two)
Between-Subjects Factors
Male 38
Female 85
White 89
Black 11
Hispanic 10
As ian 12
Other
(specify)1
1
2
Gender
1
2
3
4
5
Race
Value Label N
Tests of Between-Subjects Effects
Dependent Variable: Overall embeddedness
6.093a 7 .870 5.348 .000
104.920 1 104.920 644.578 .000
.568 1 .568 3.488 .064
5.391 4 1.348 8.280 .000
.276 2 .138 .848 .431
18.719 115 .163
897.793 123
24.812 122
Source
Corrected Model
Intercept
GENDER
RACE
GENDER * RACE
Error
Total
Corrected Total
Type III Sum
of Squares df Mean Square F Sig.
R Squared = .246 (Adjusted R Squared = .200)a.
Profile Plots
Page 183
183
Estimated Marginal Means of Overall embeddedness
Race
Other (specify)AsianHispanicBlackWhite
Est
imat
ed M
argi
nal M
eans
3.0
2.5
2.0
1.5
1.0
Appendix 4B. Effects of race and gender on overall embeddedness (sample two)

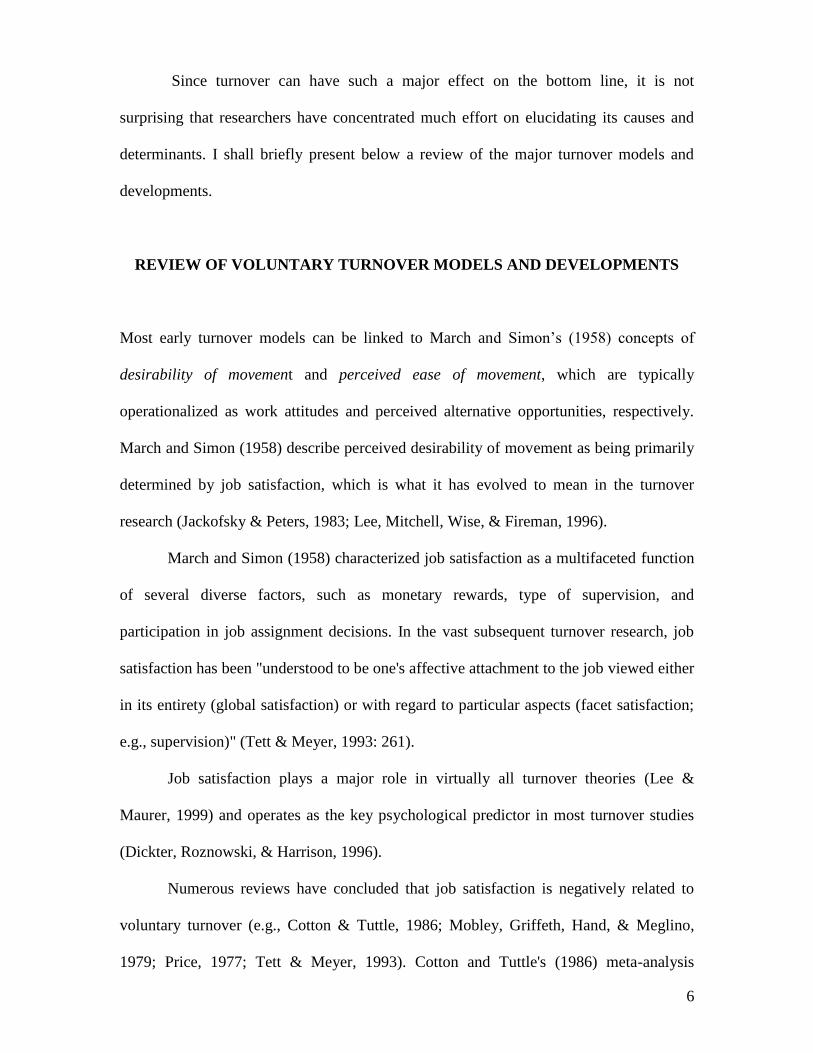
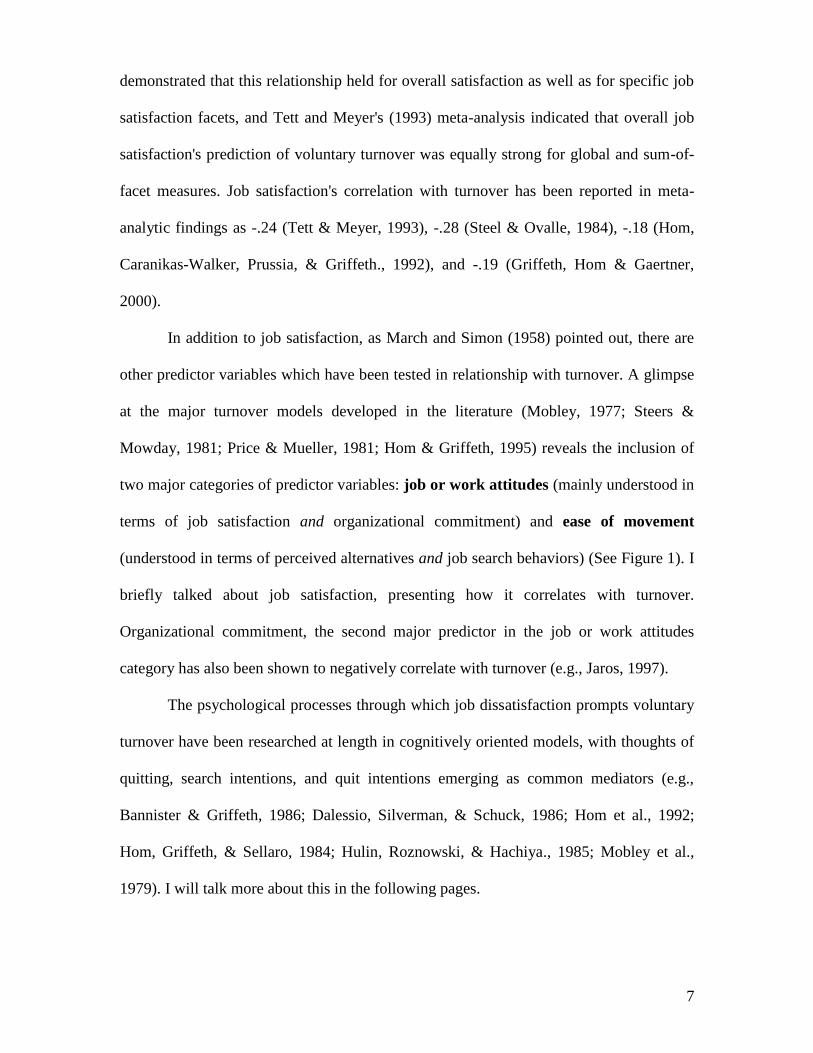
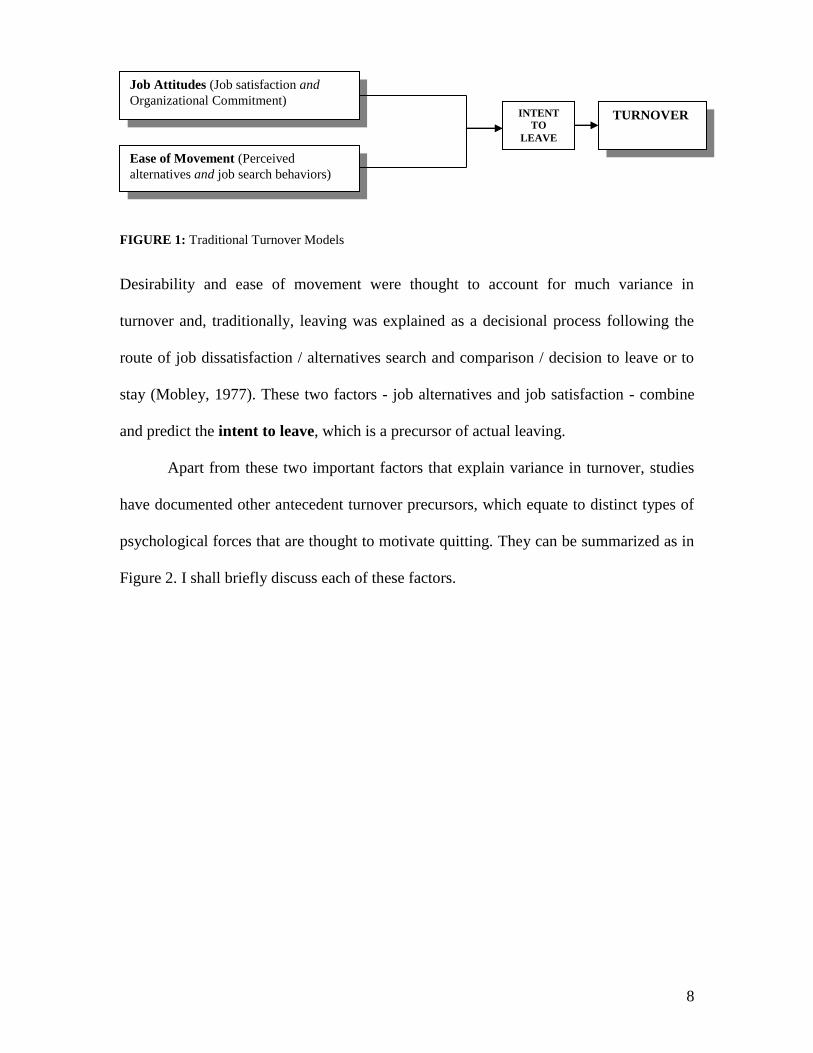


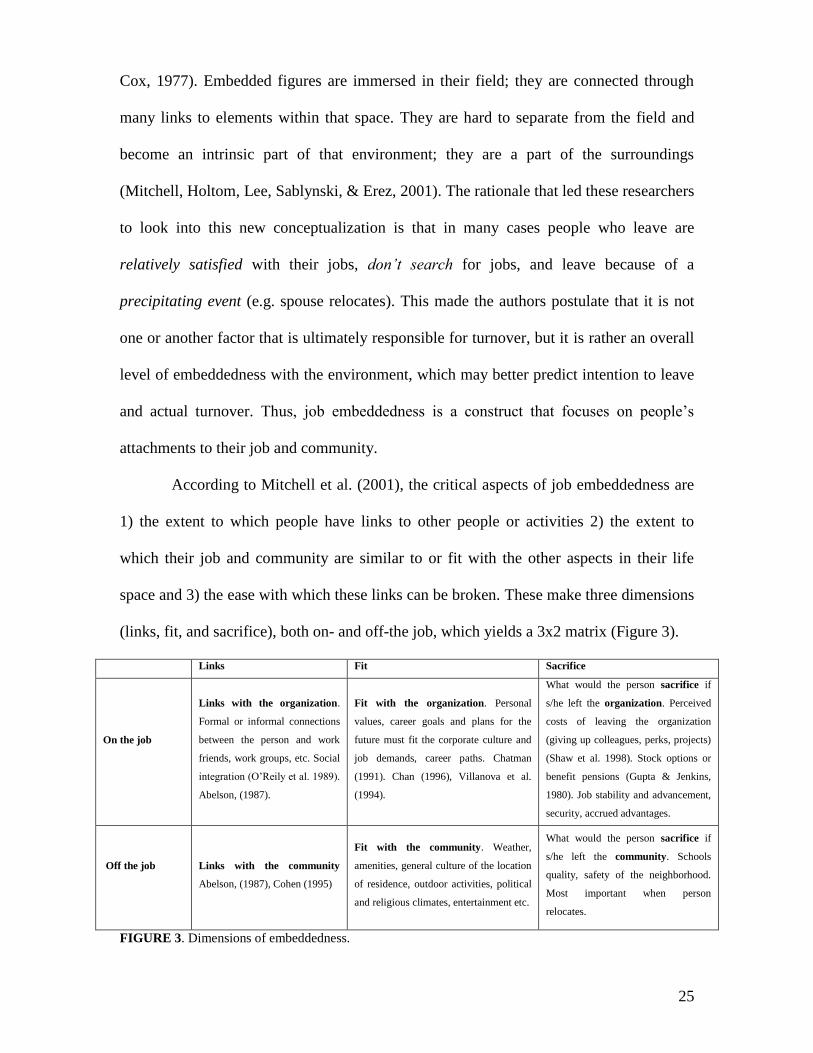


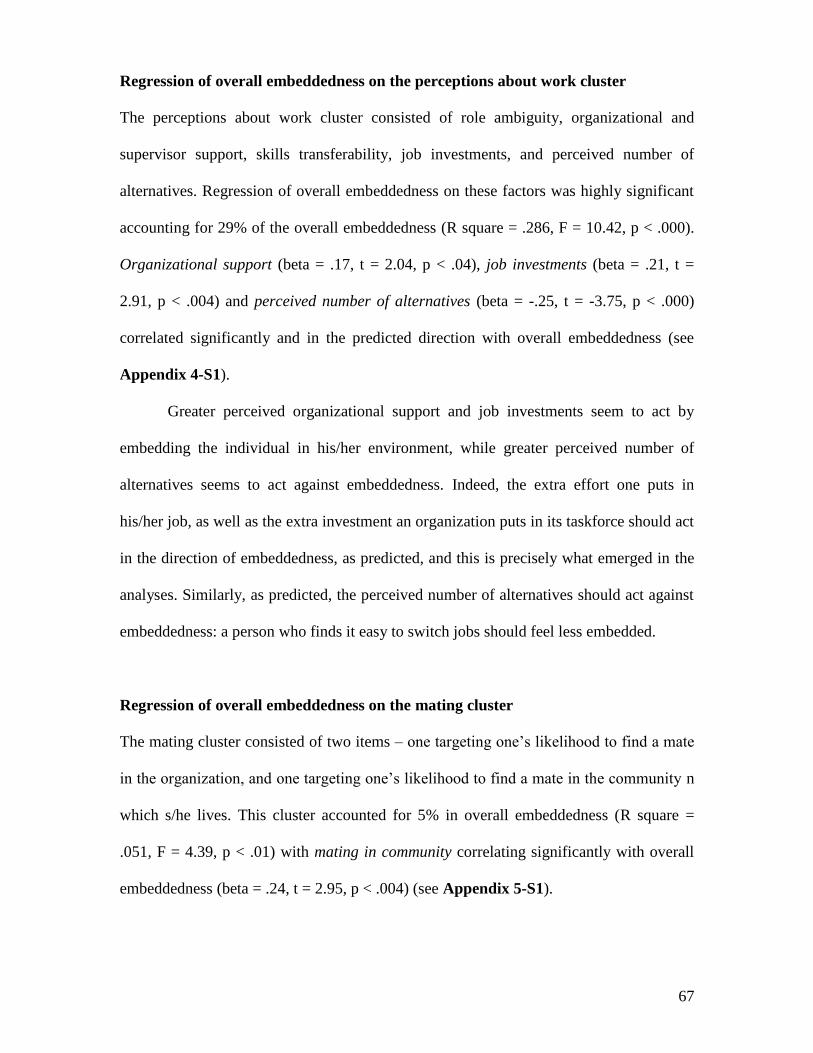

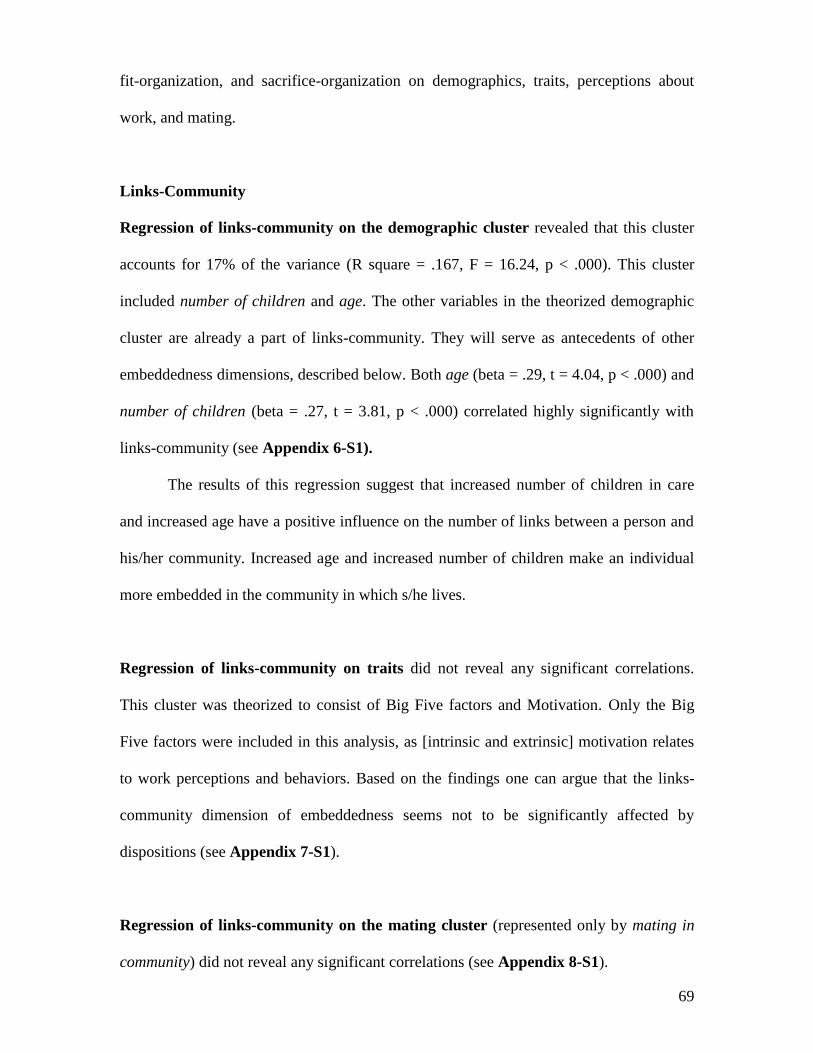

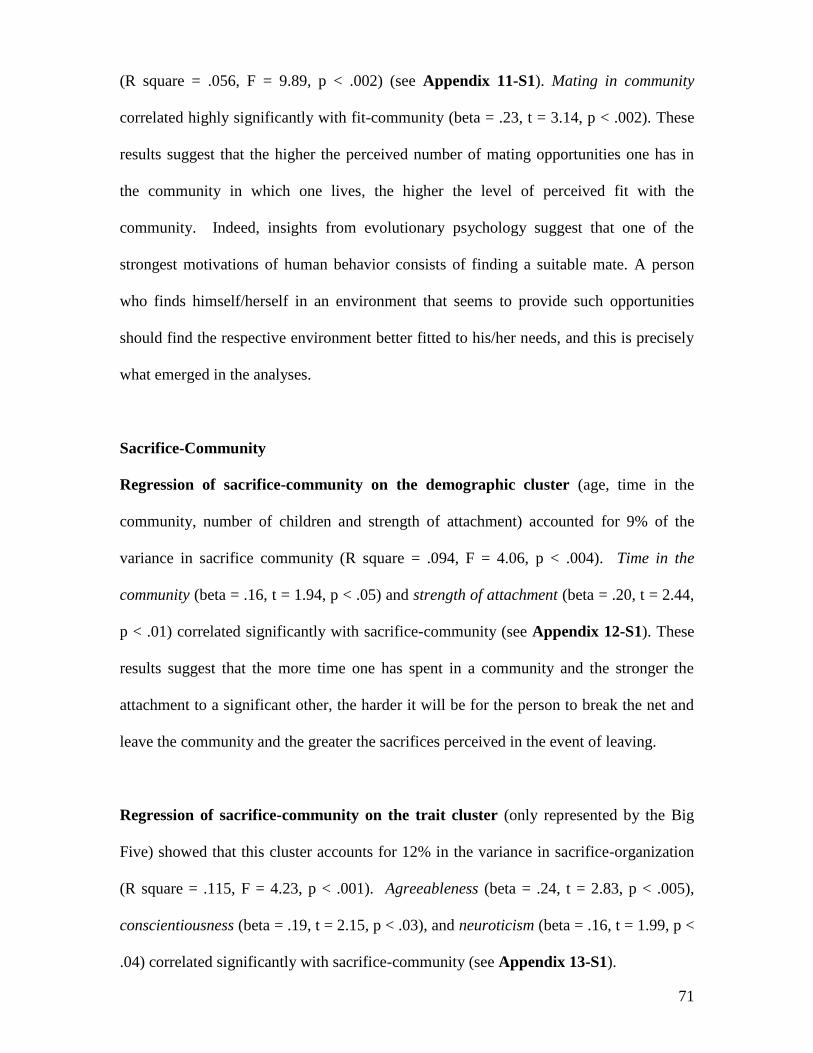


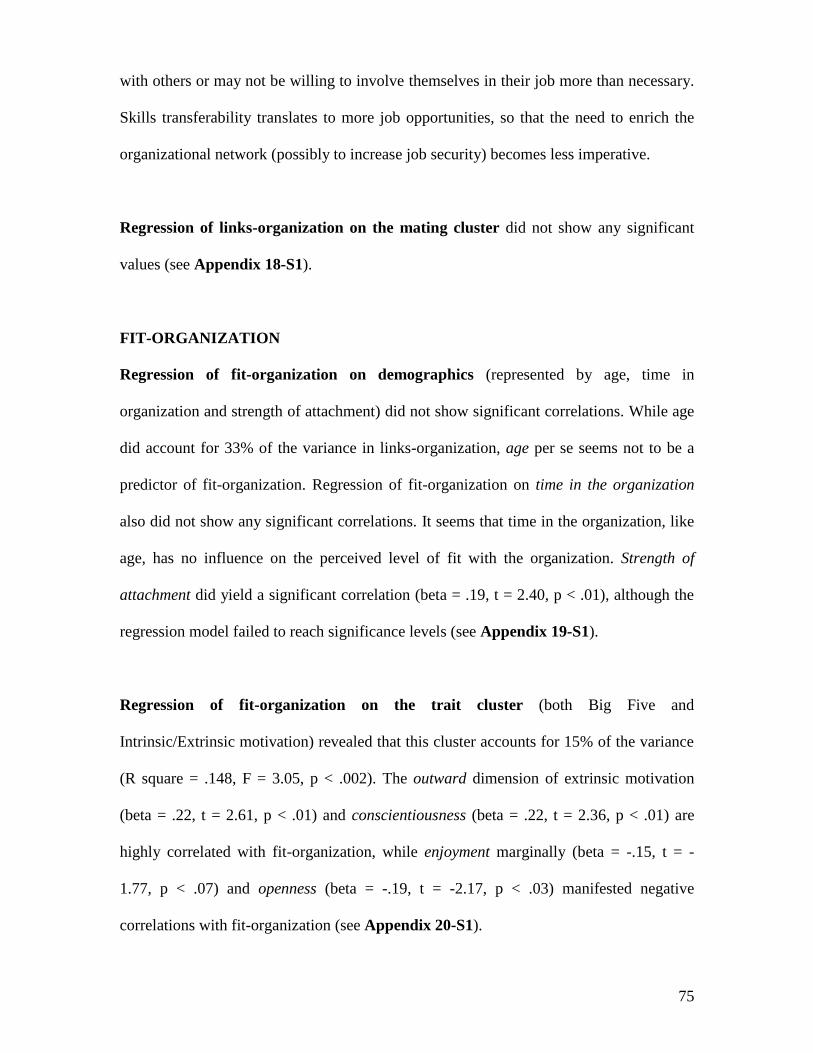
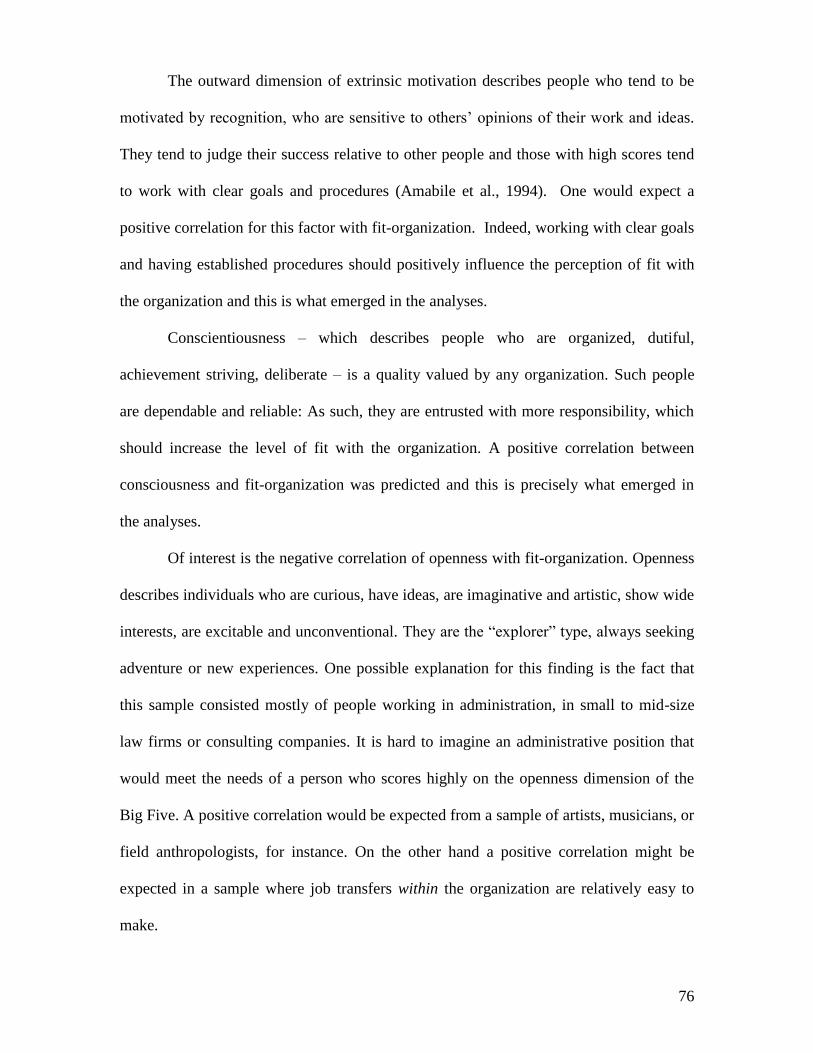


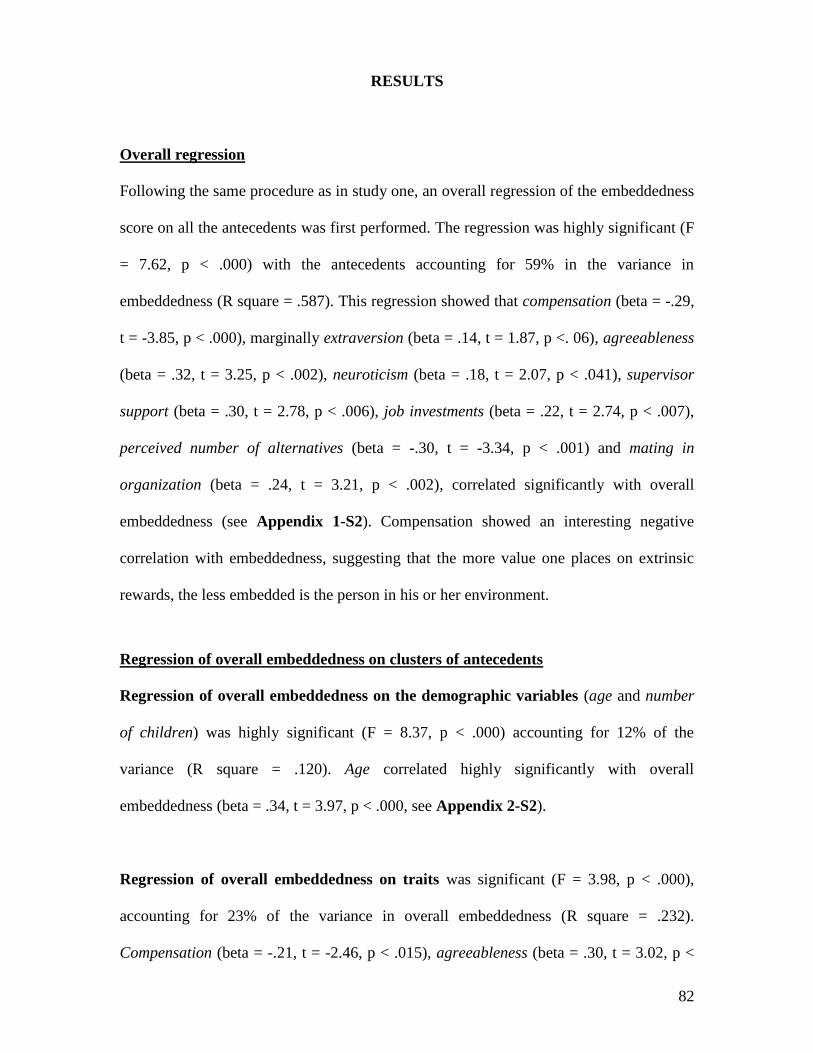


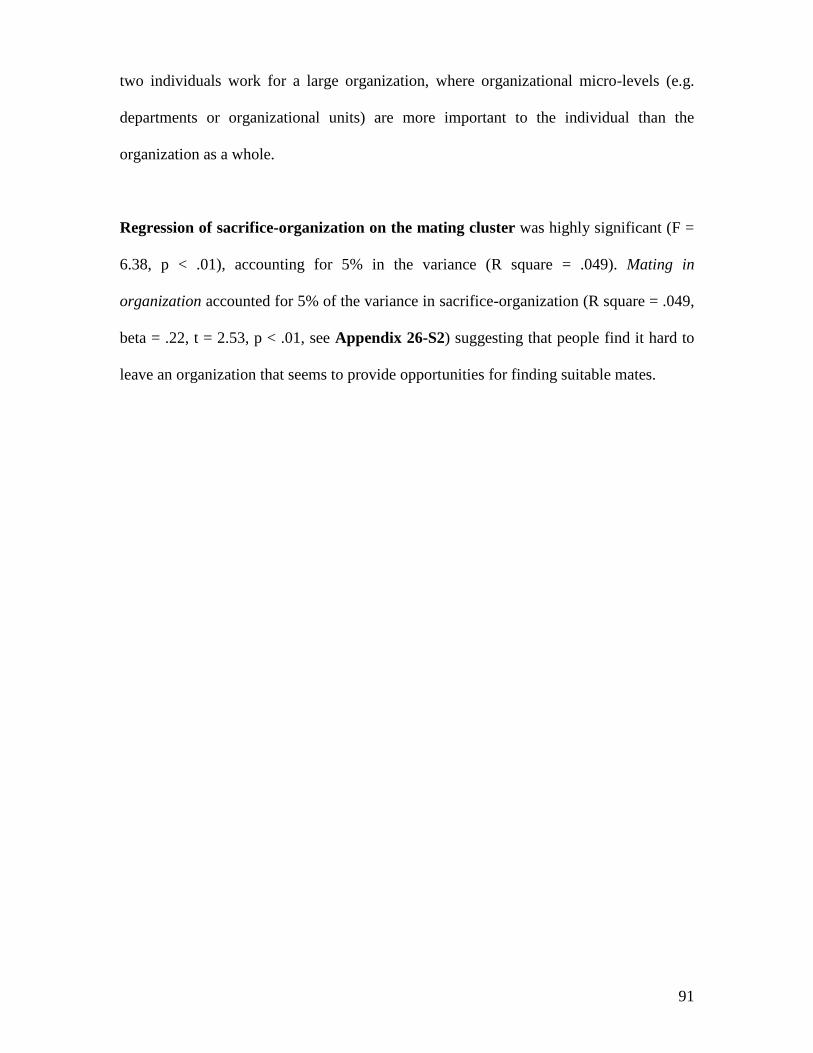
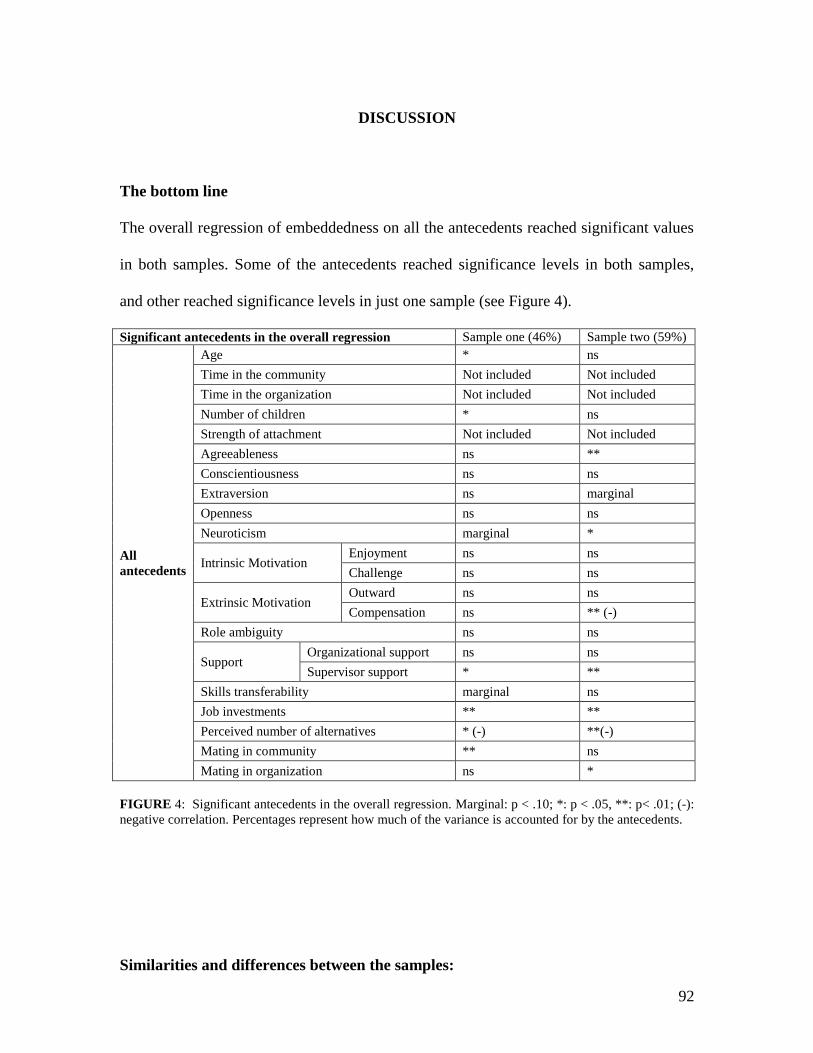


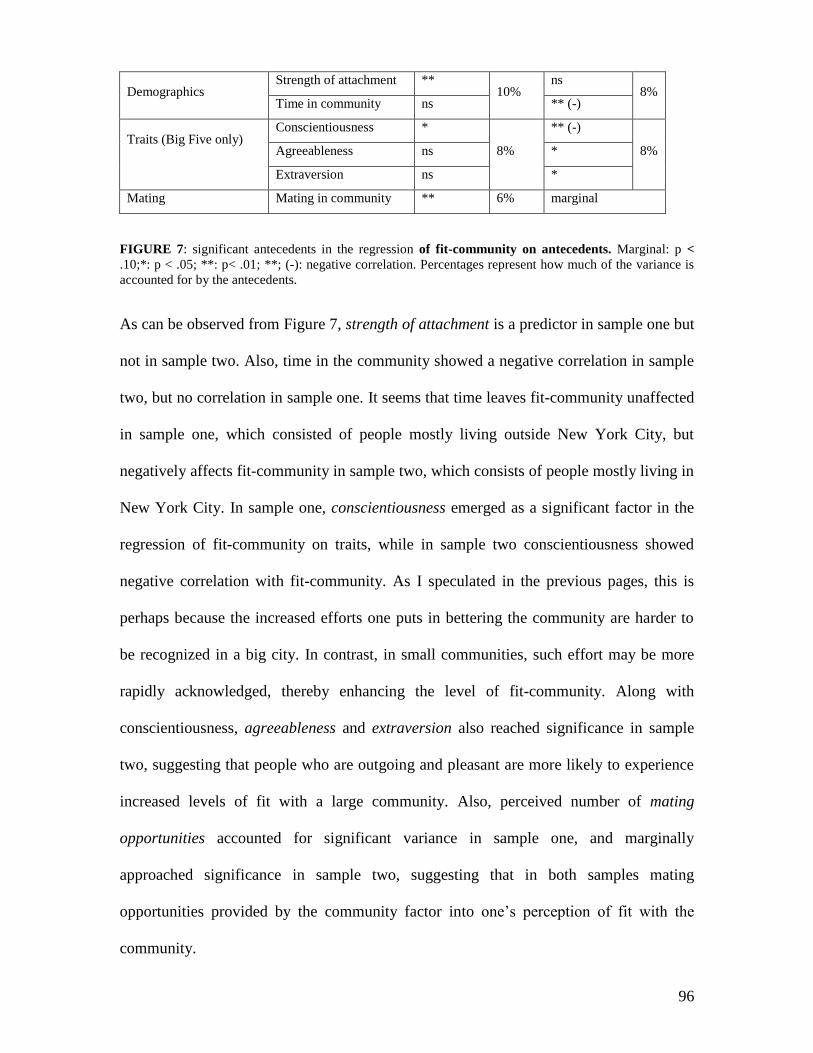

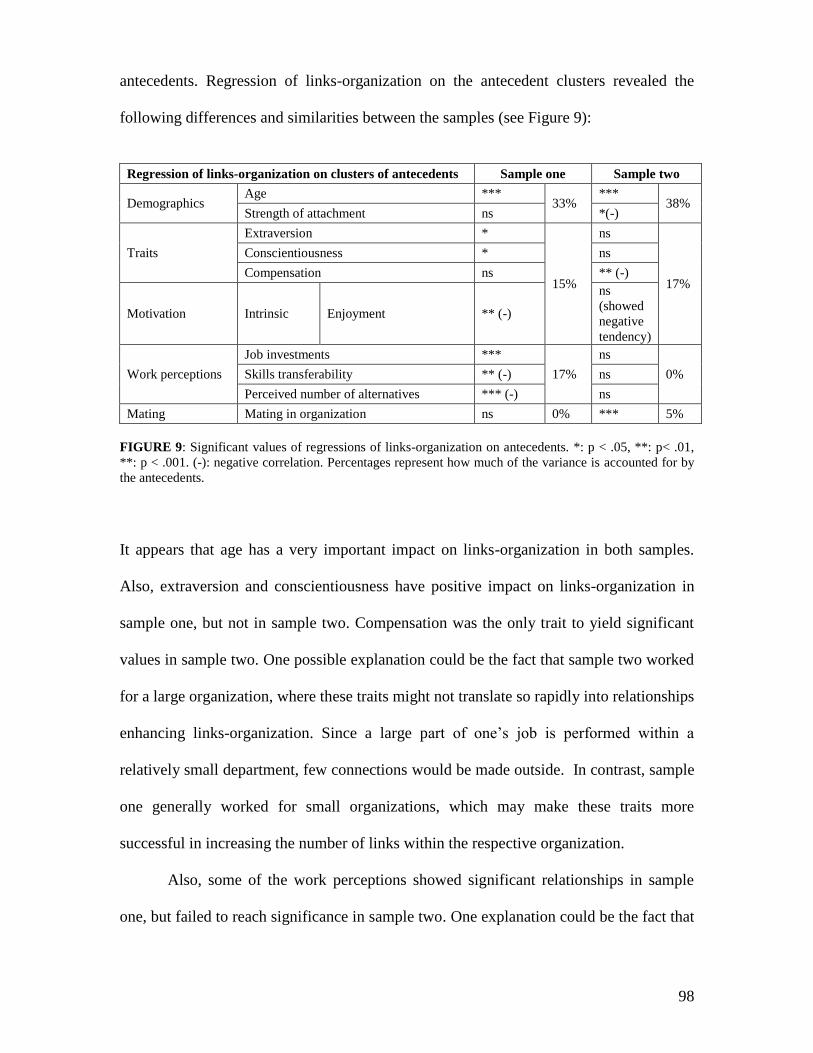
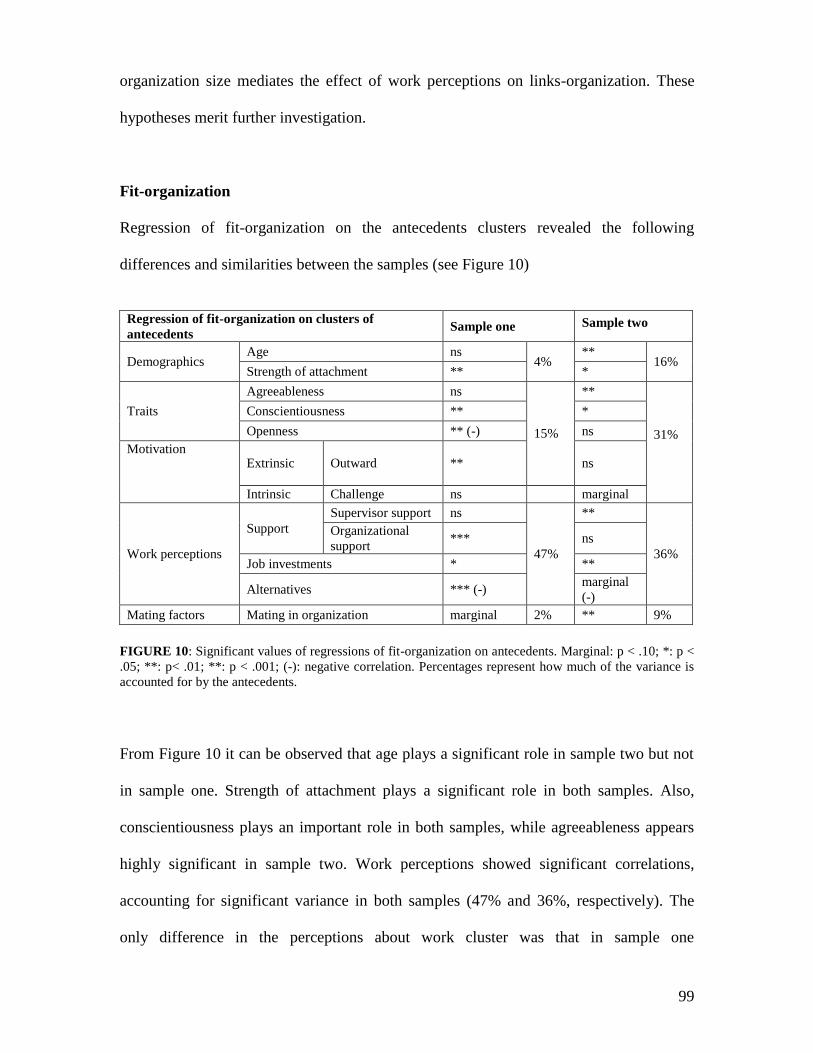
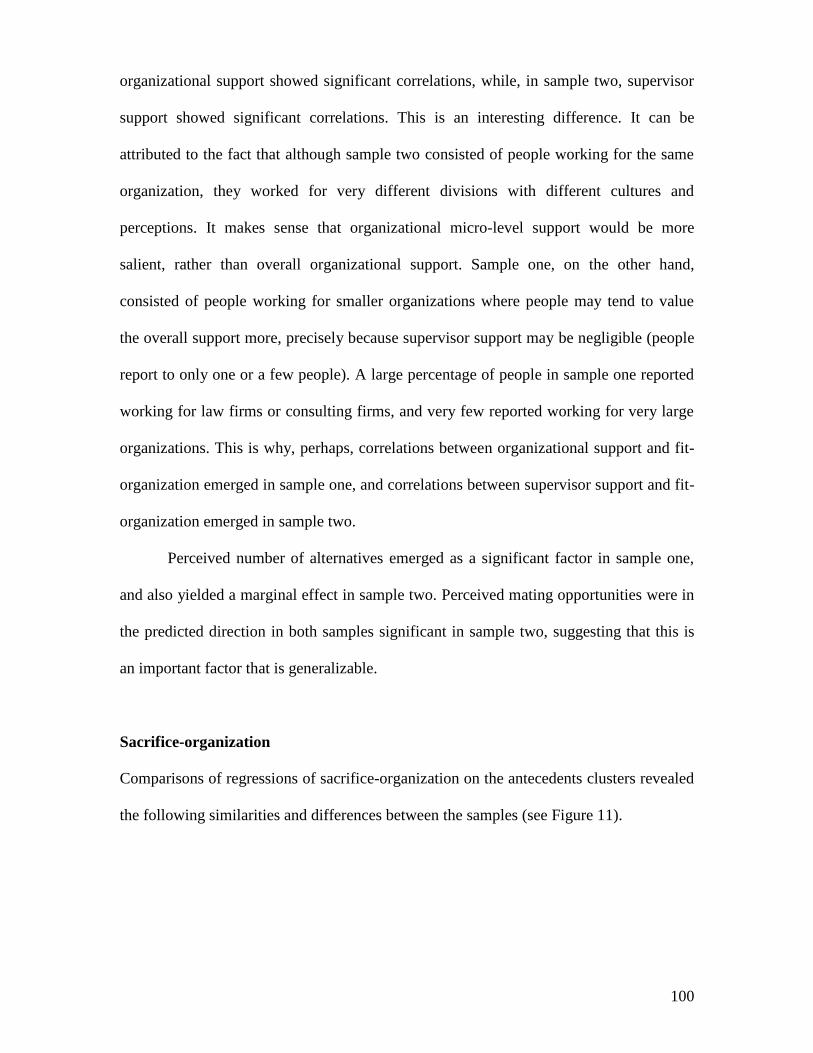


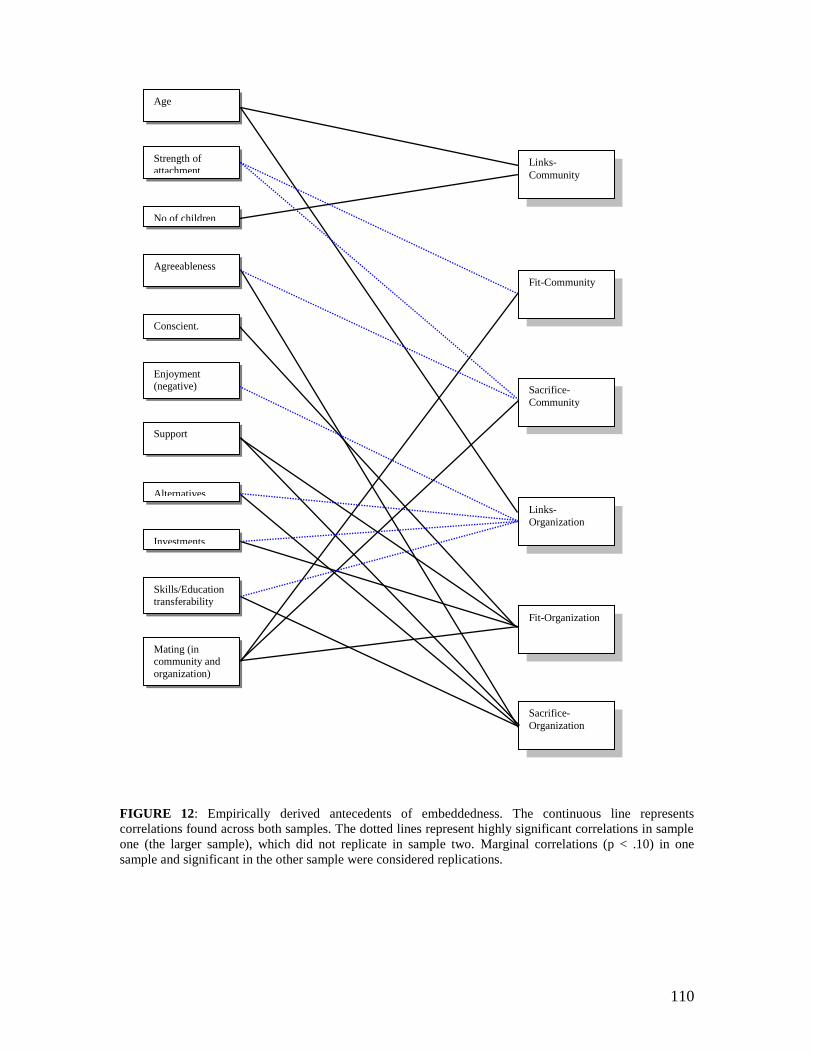


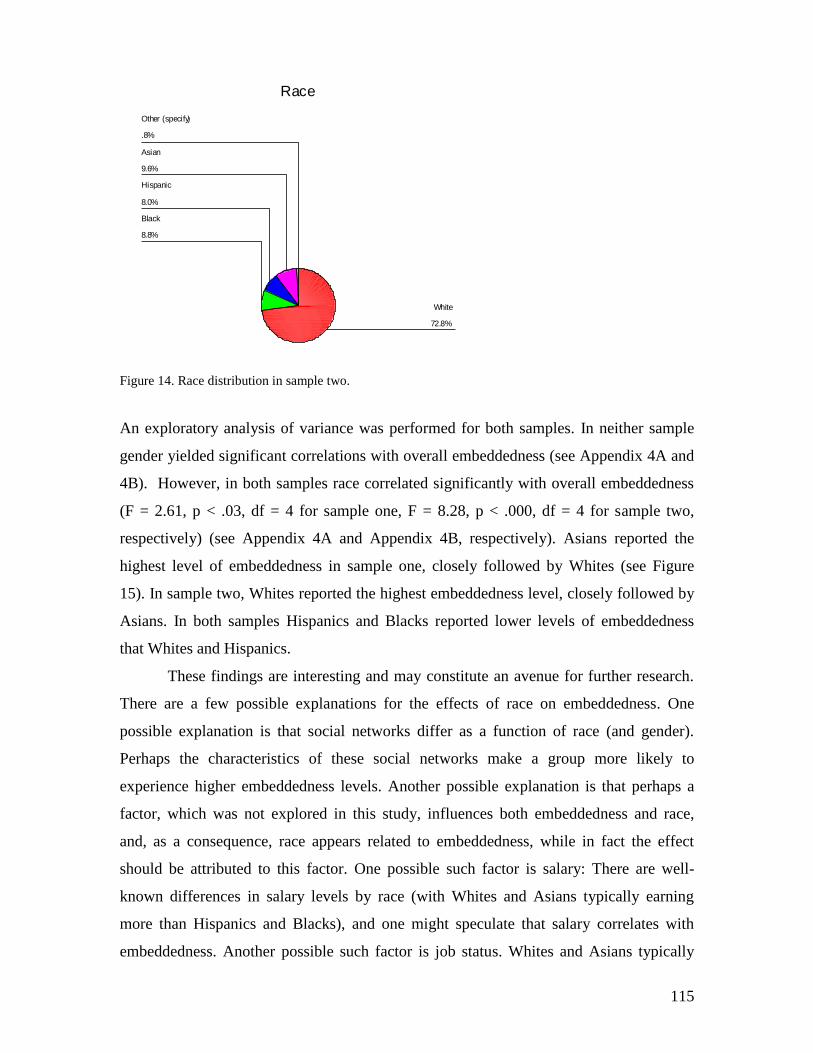


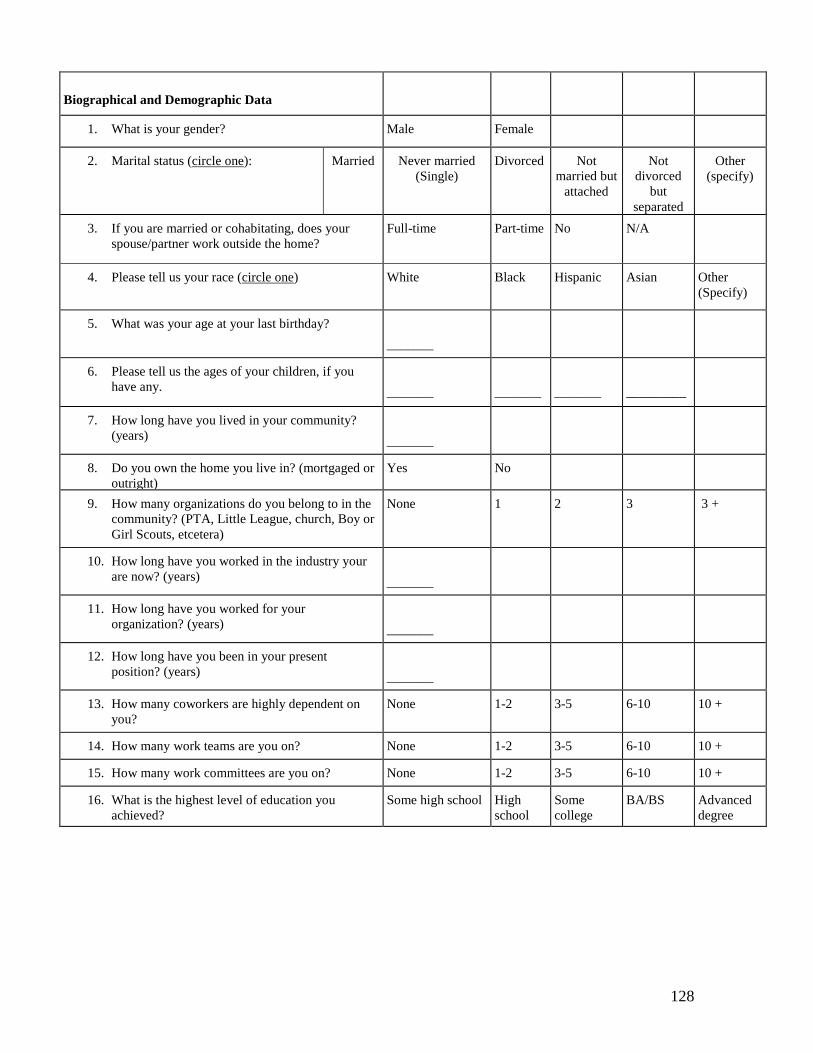
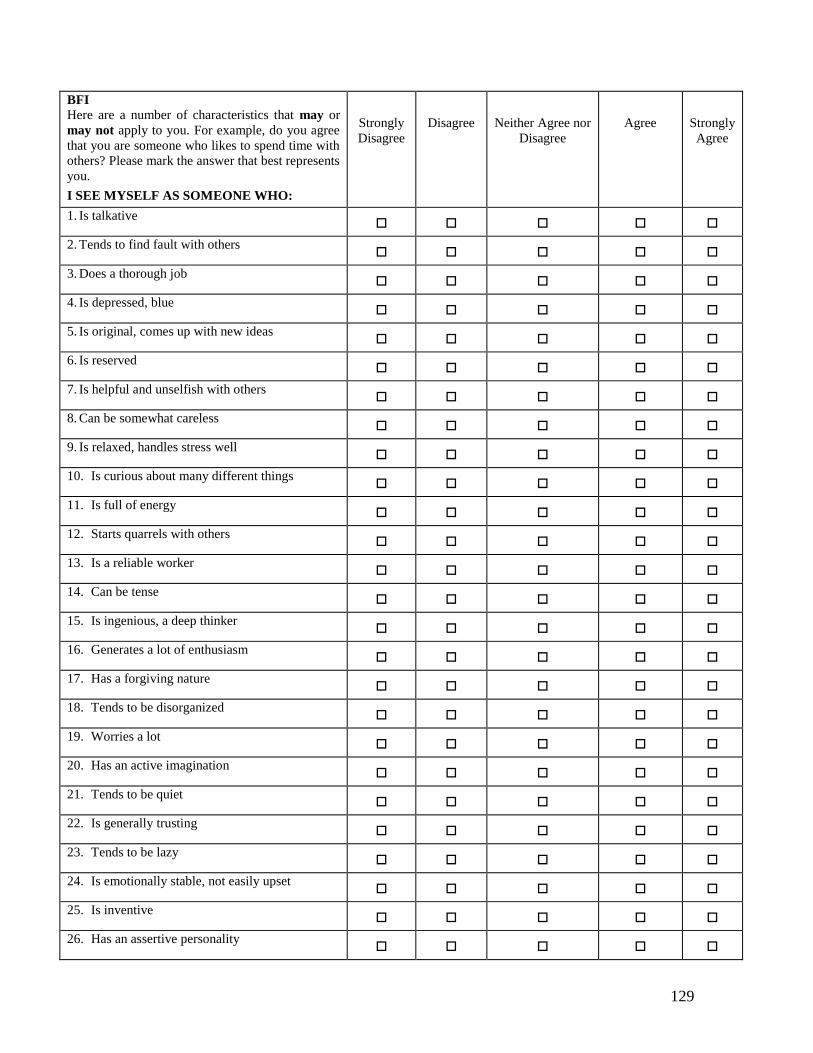


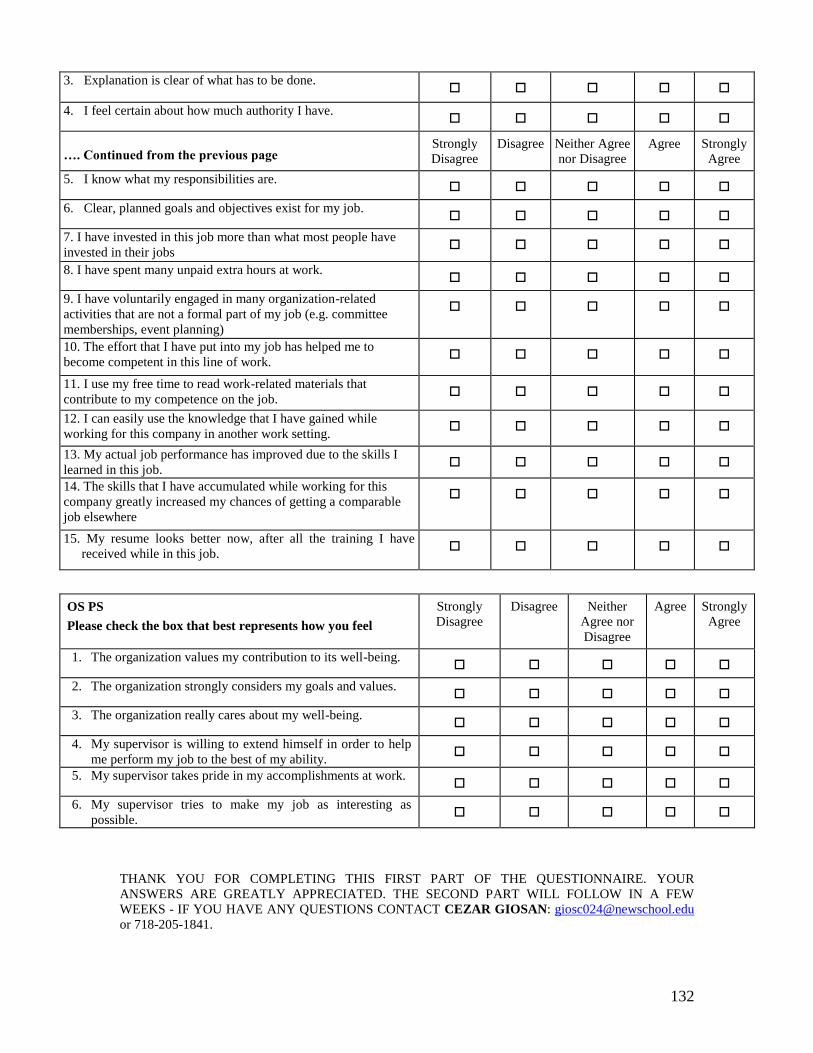

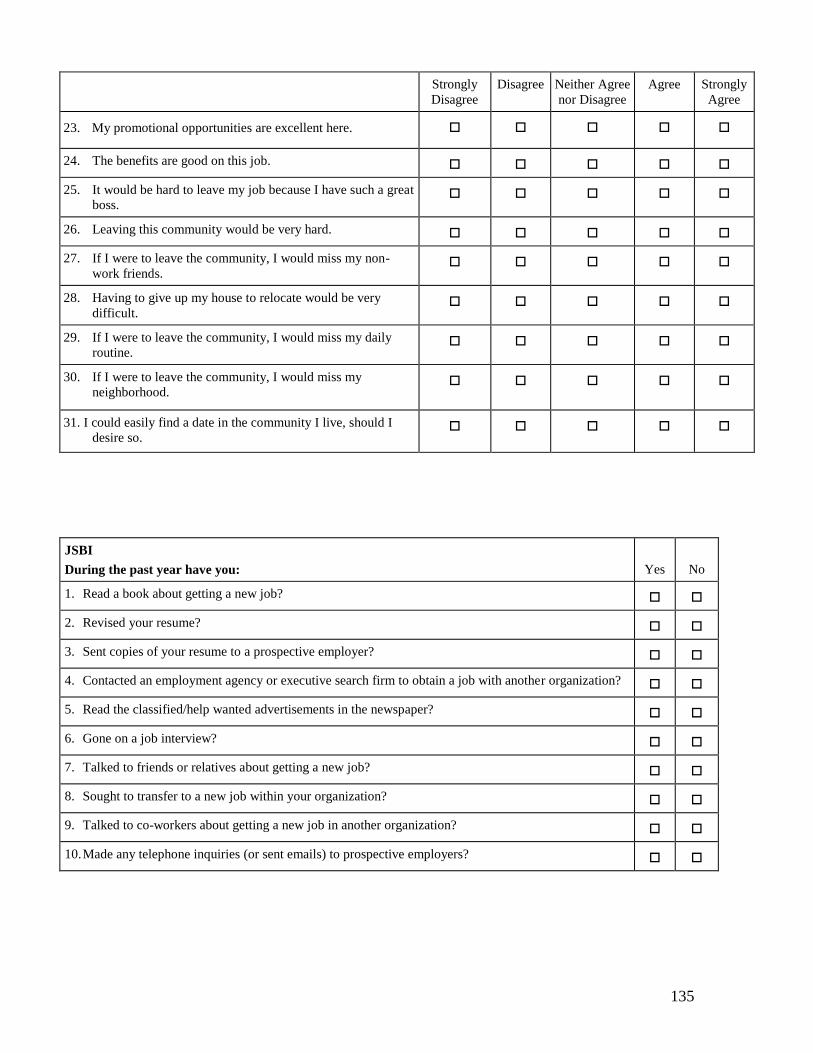

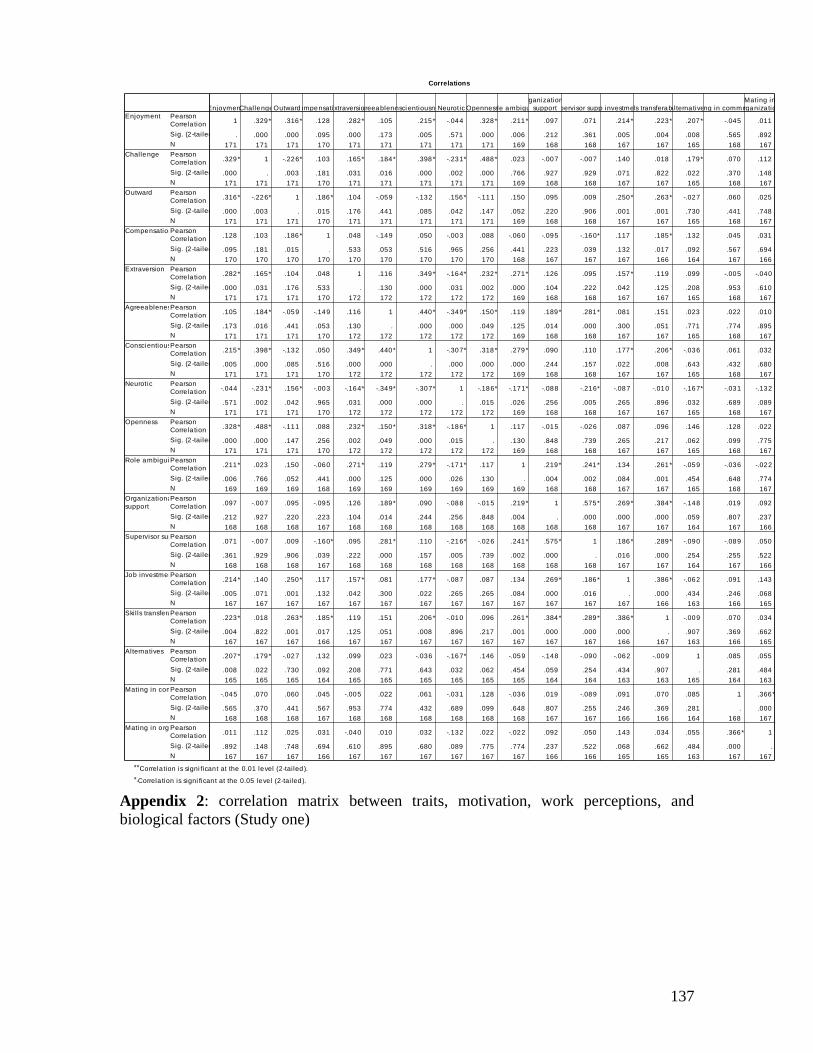

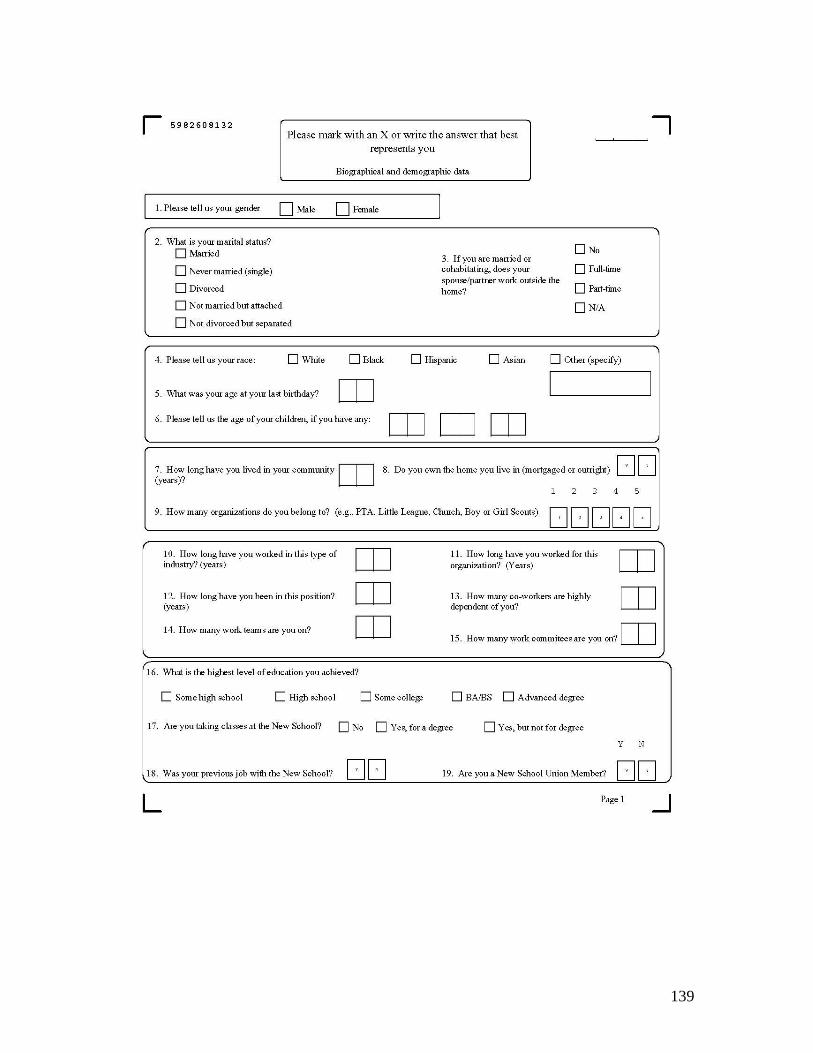
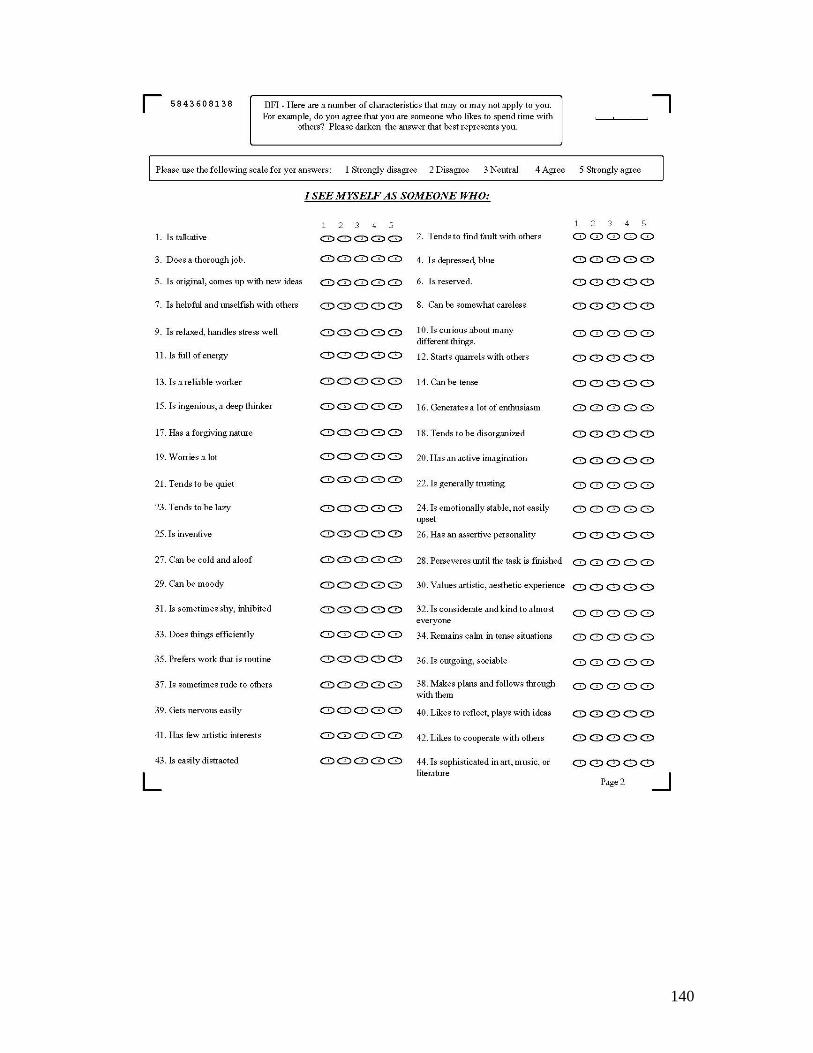

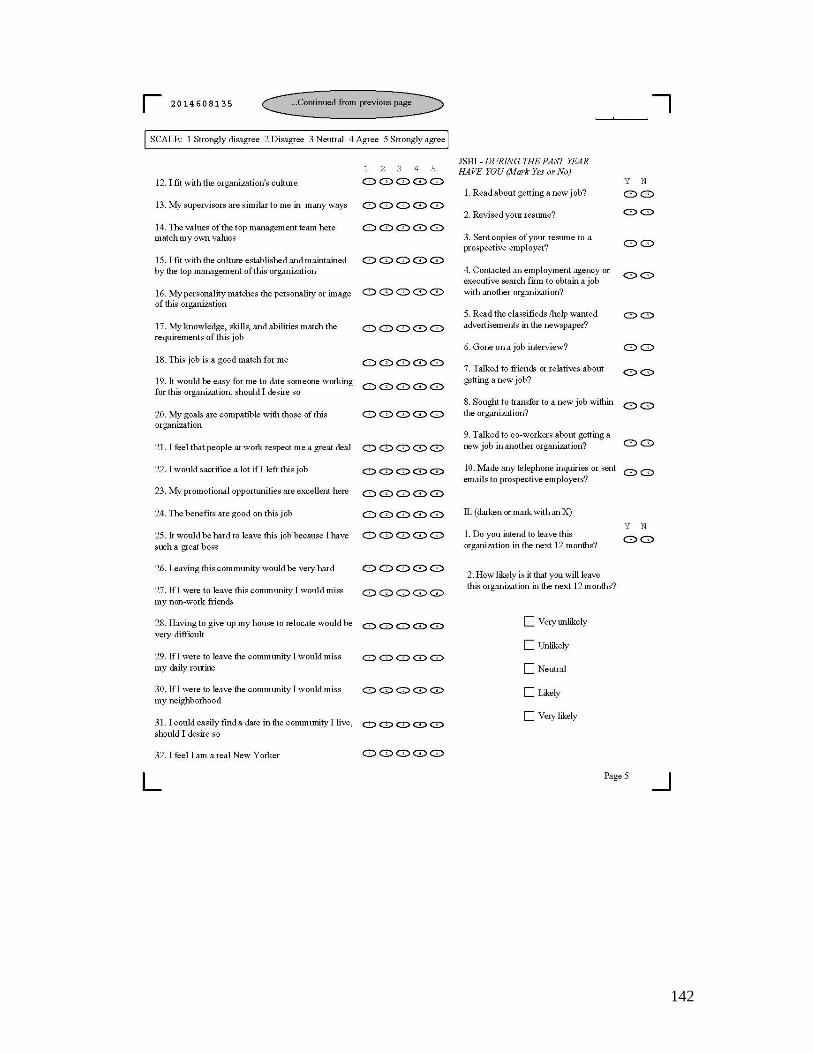

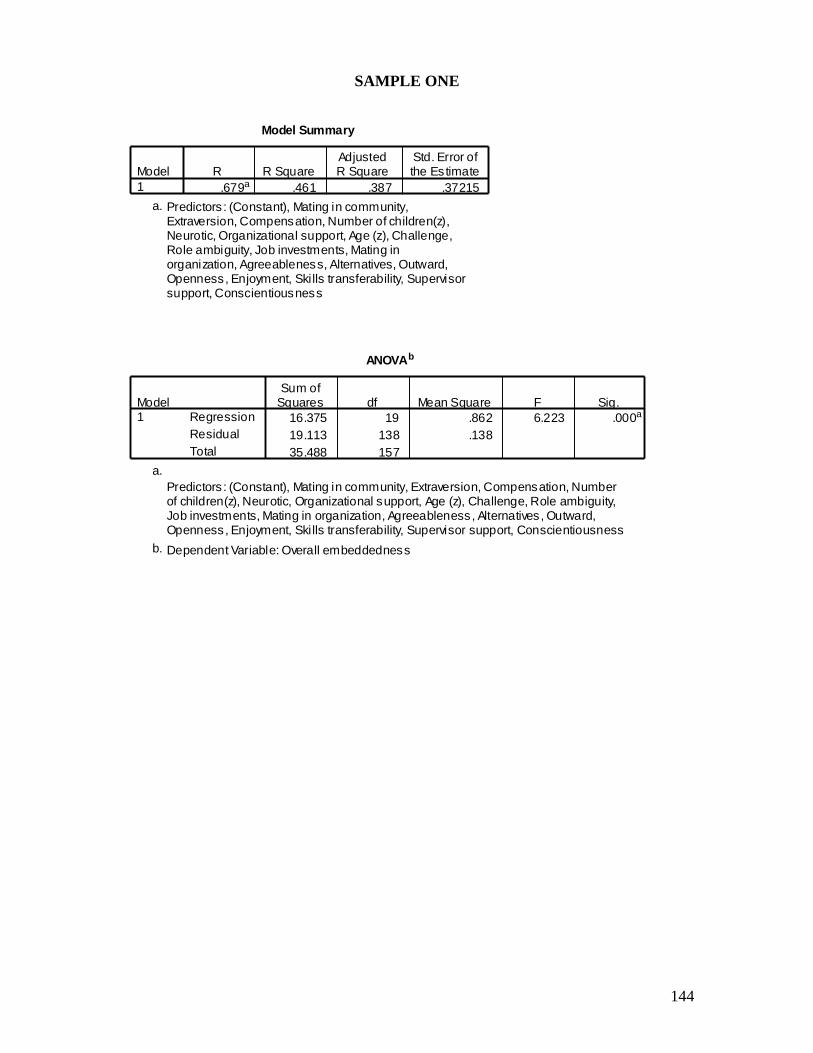
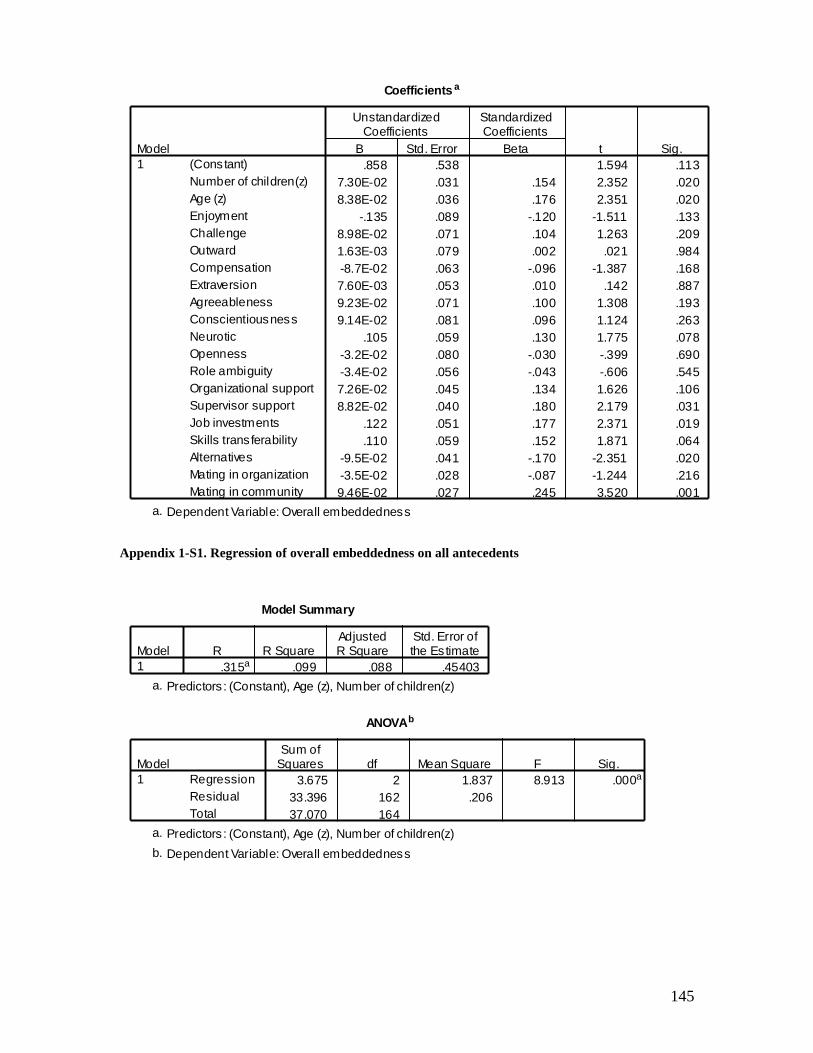
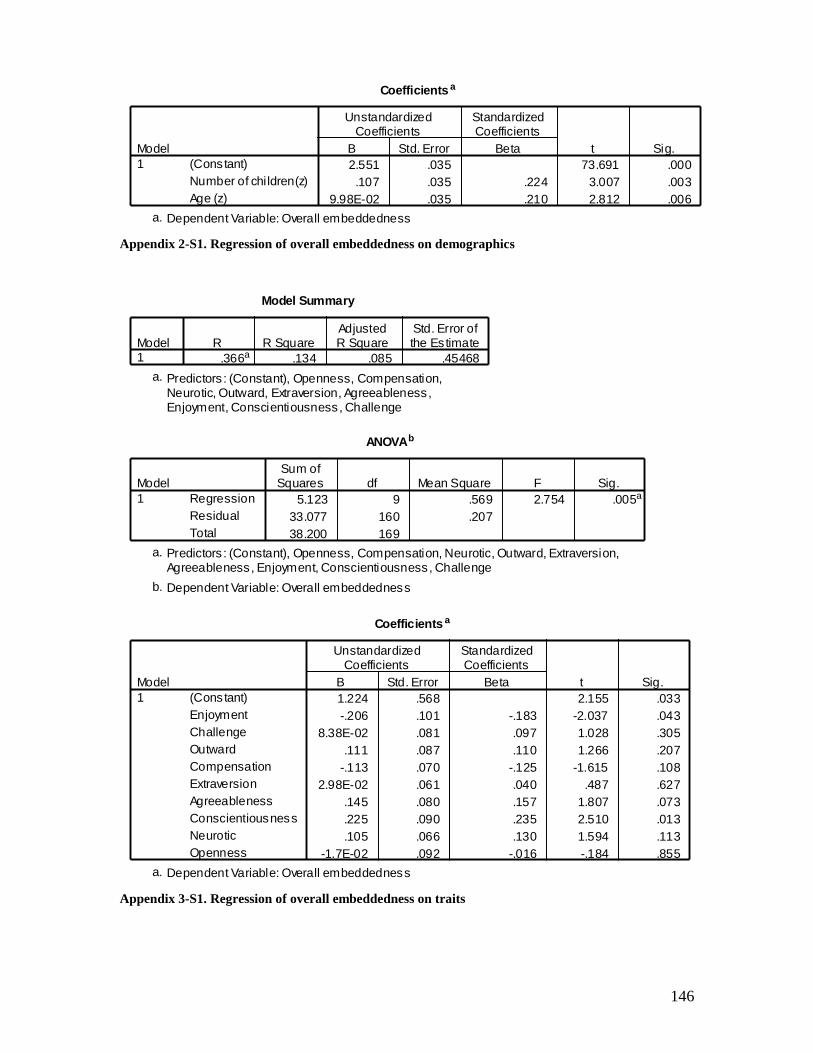


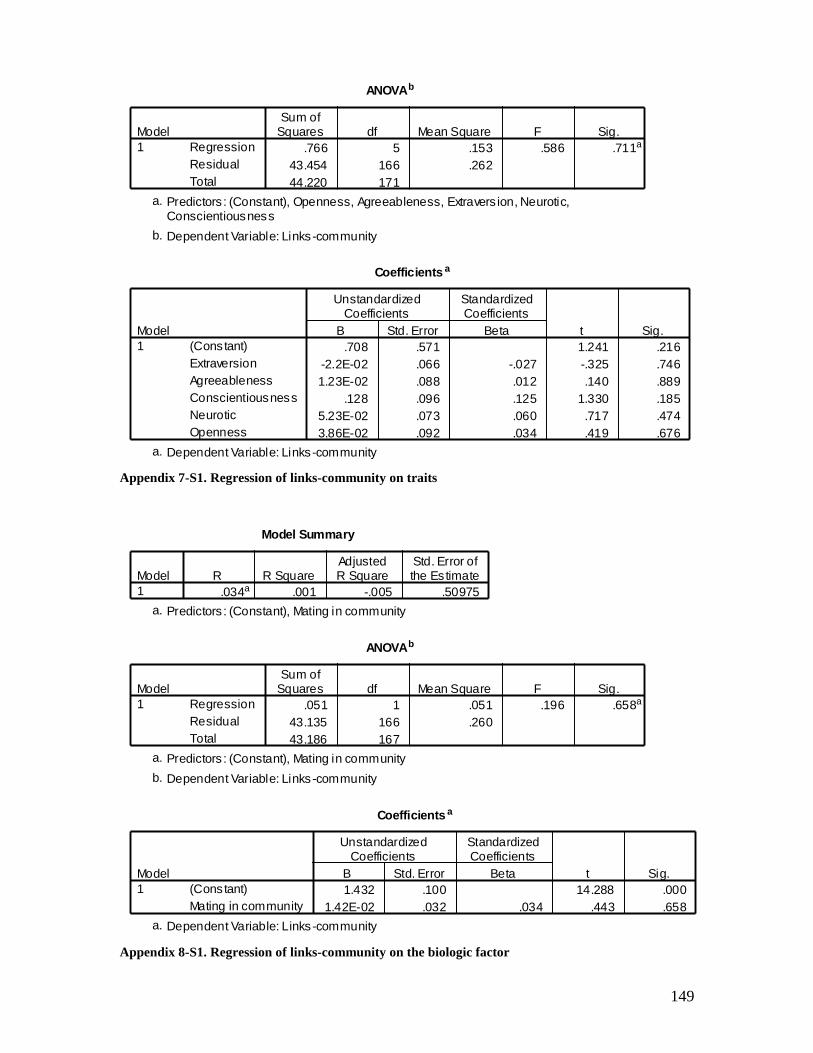
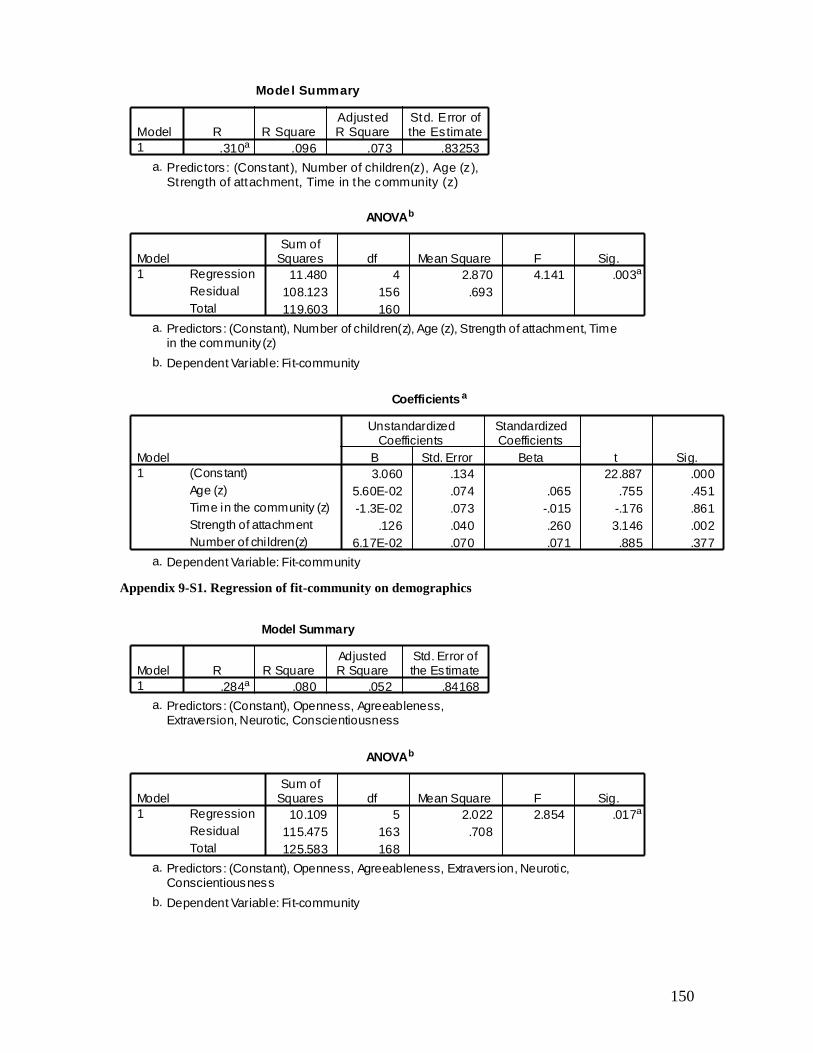
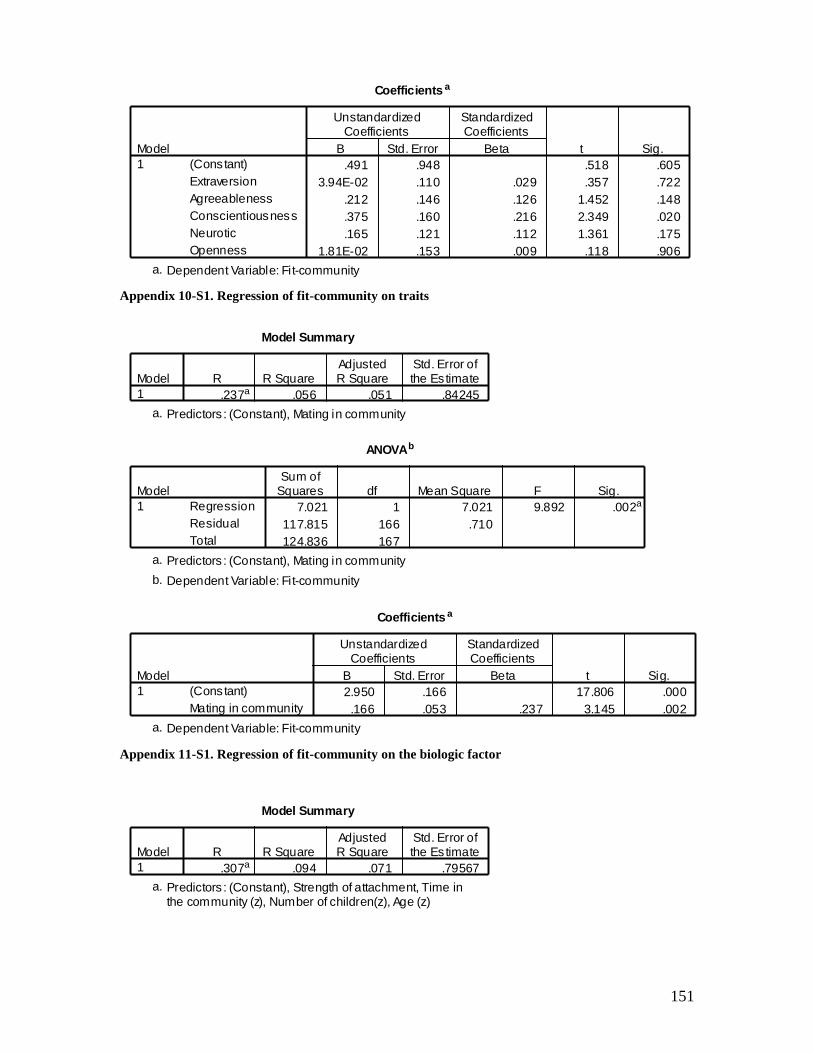


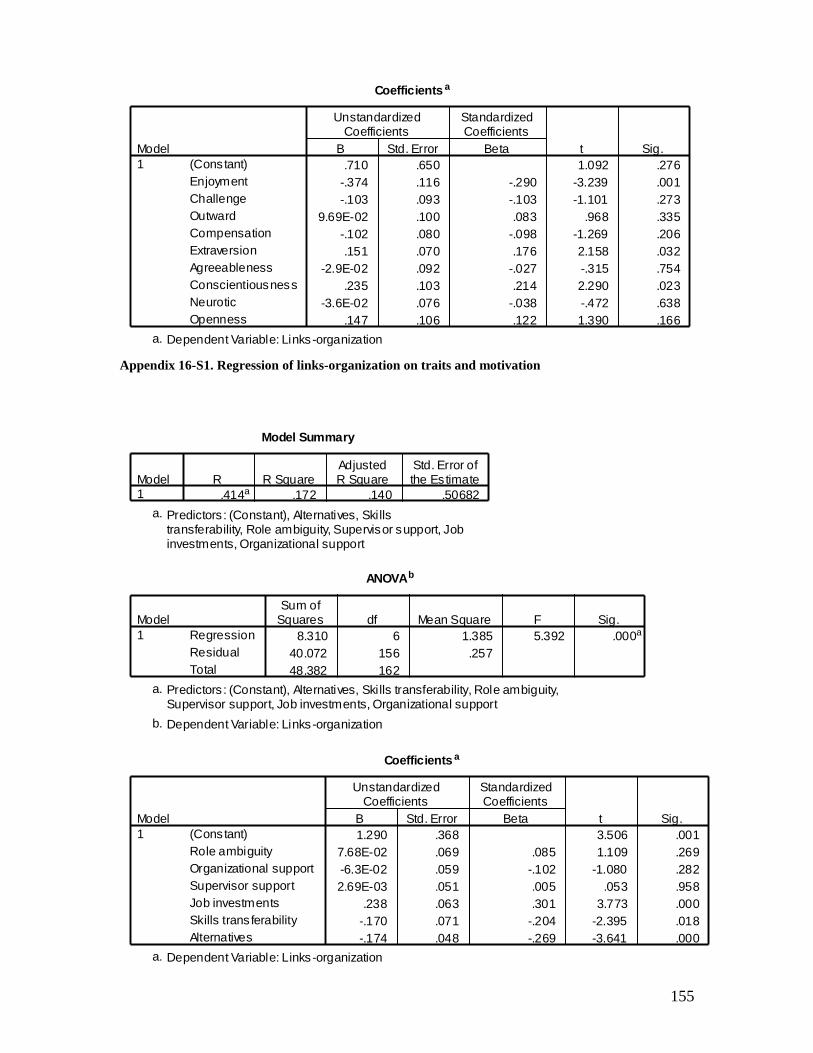

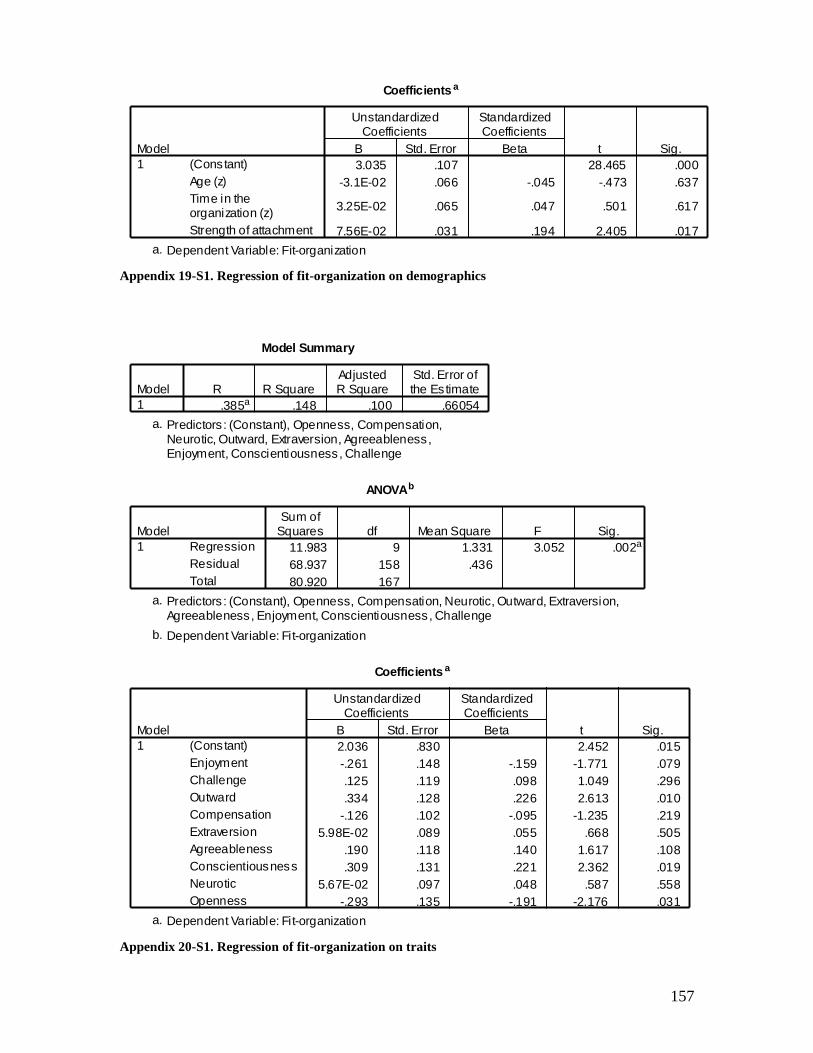
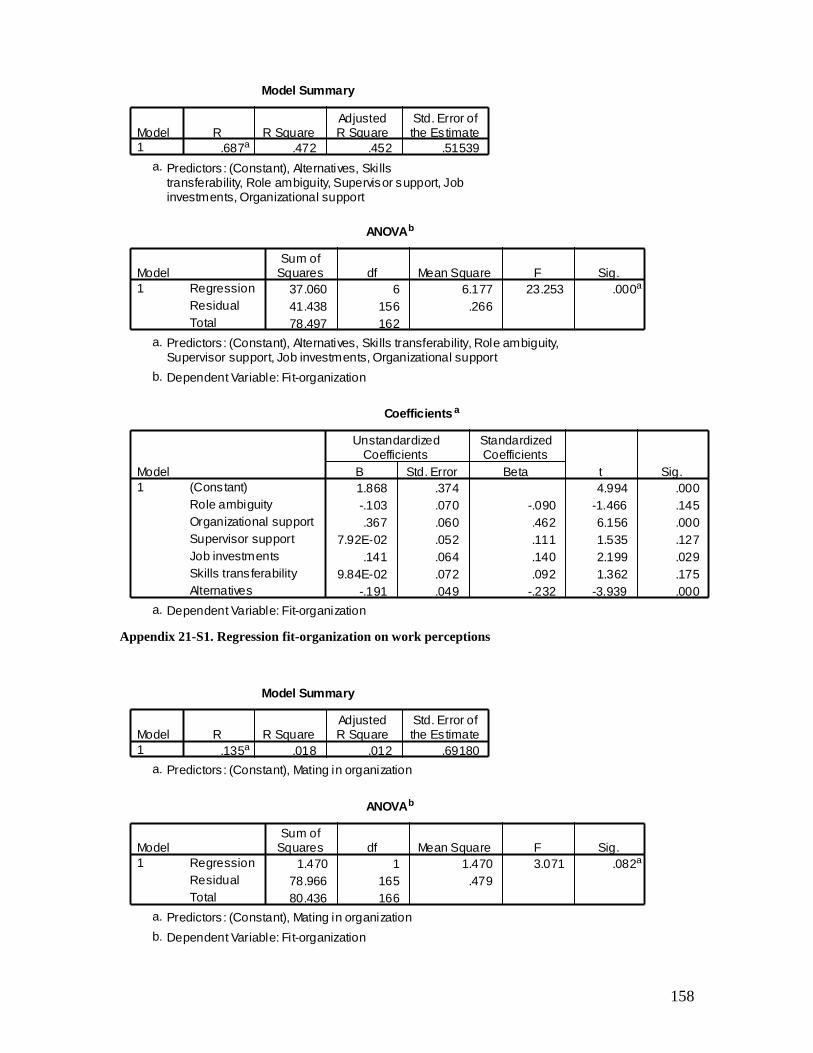
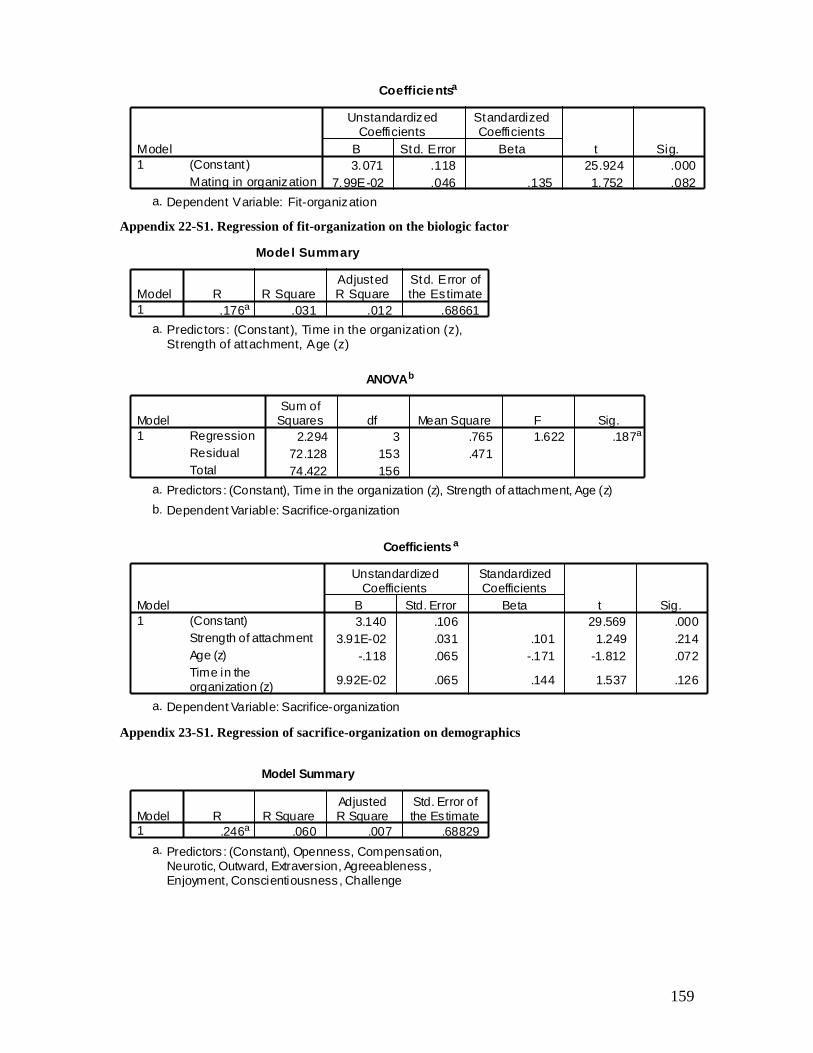

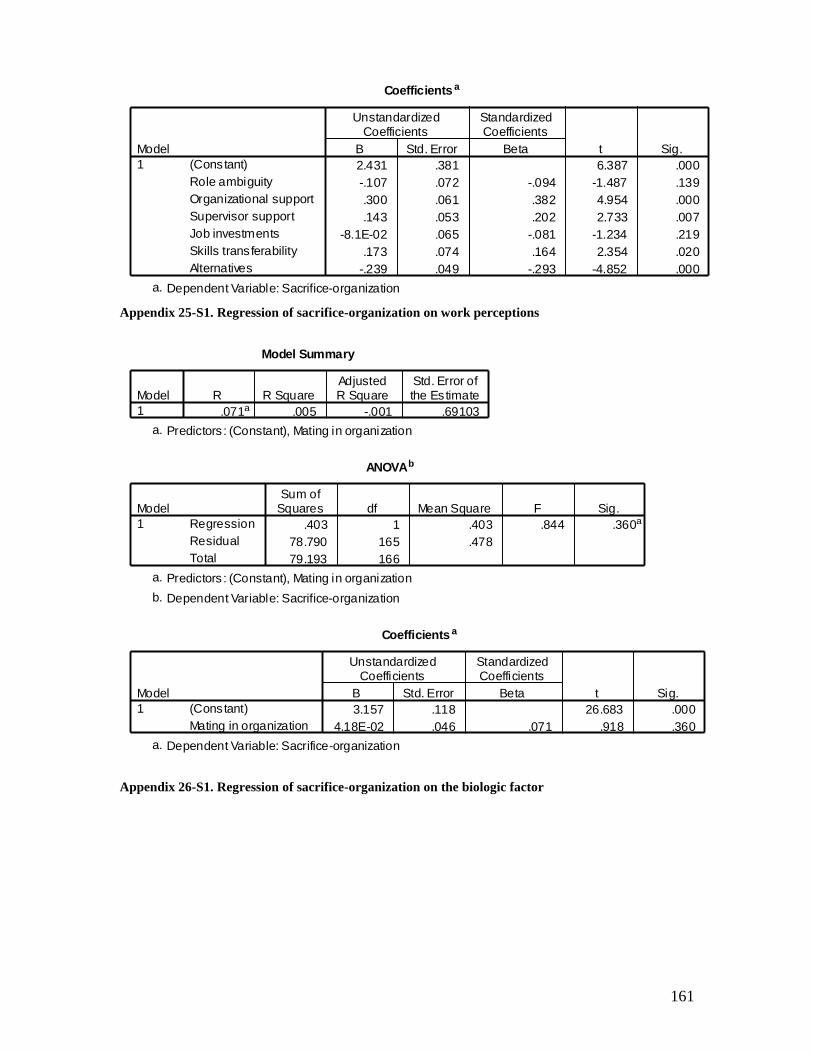

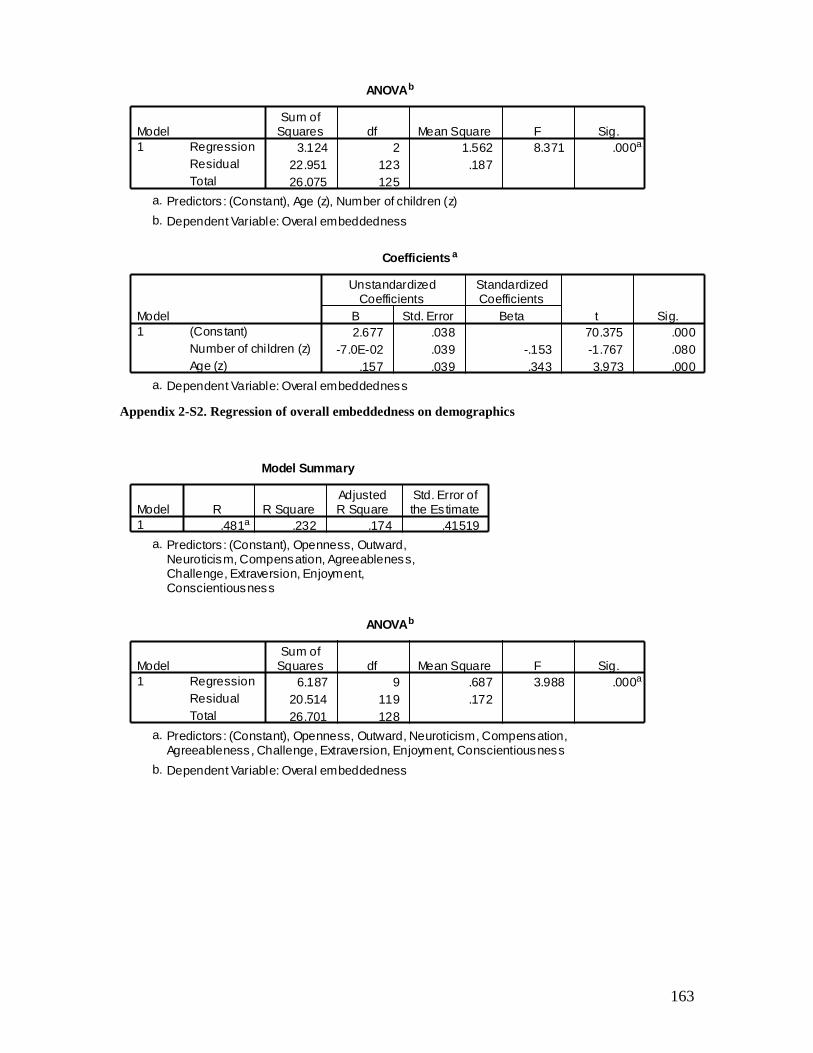
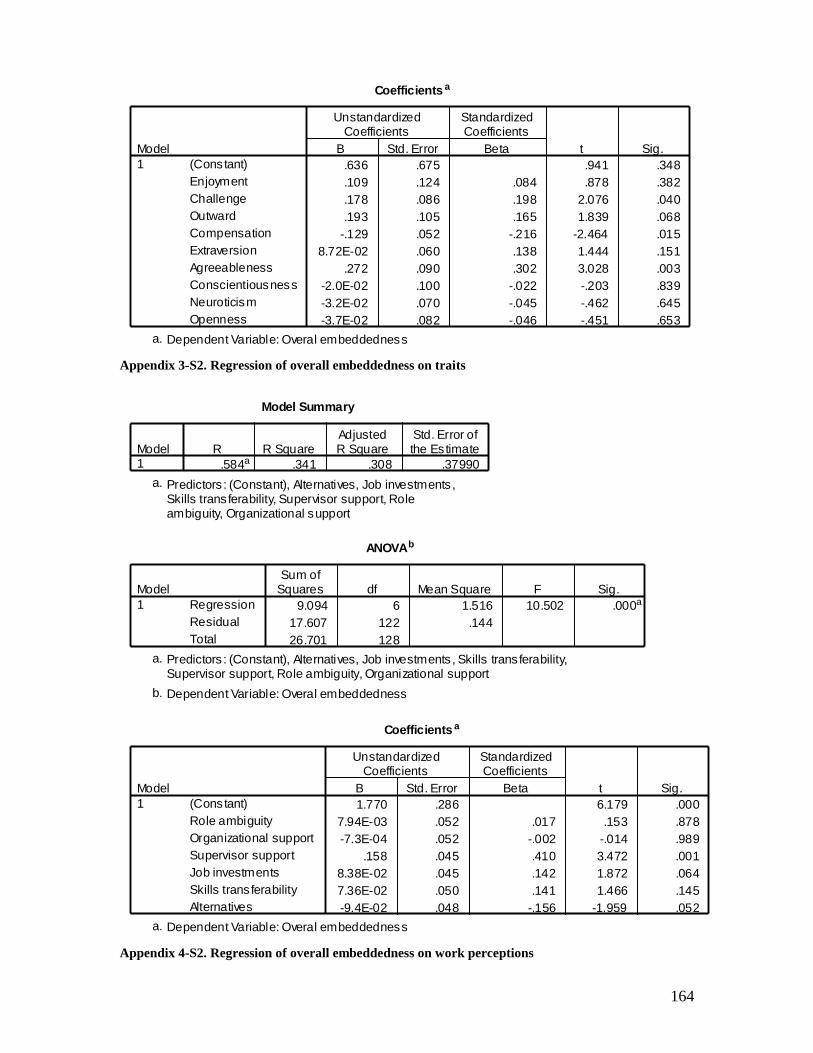
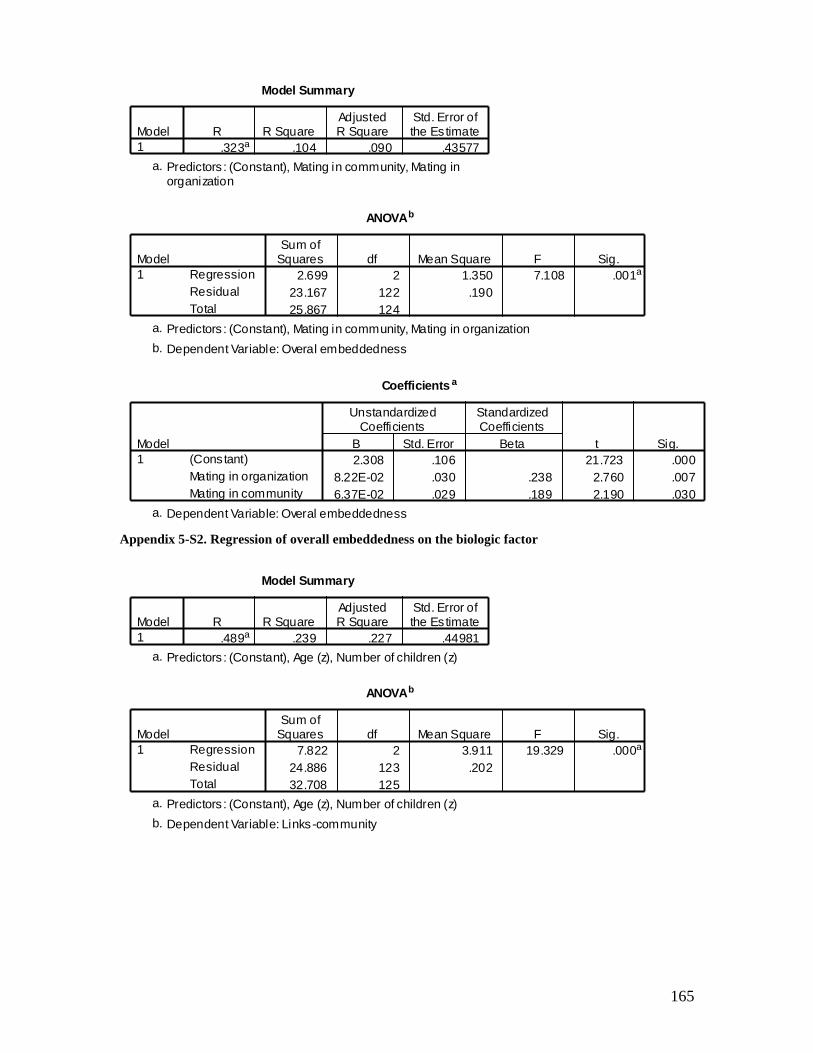
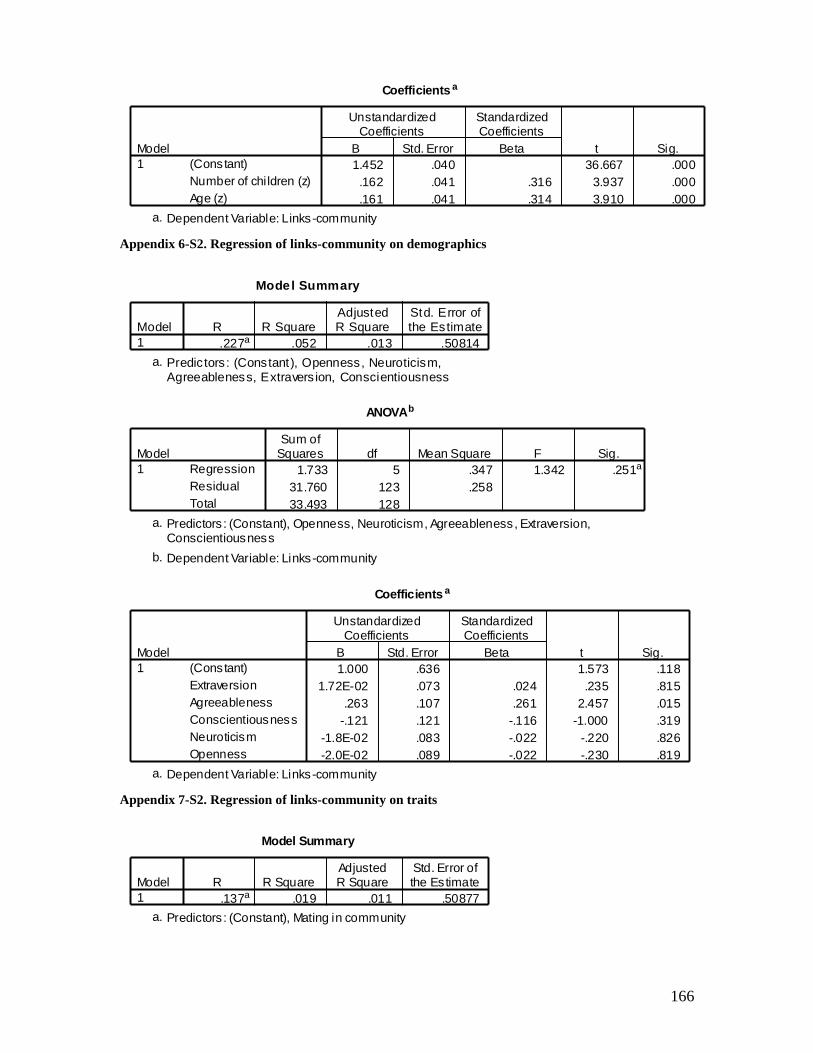
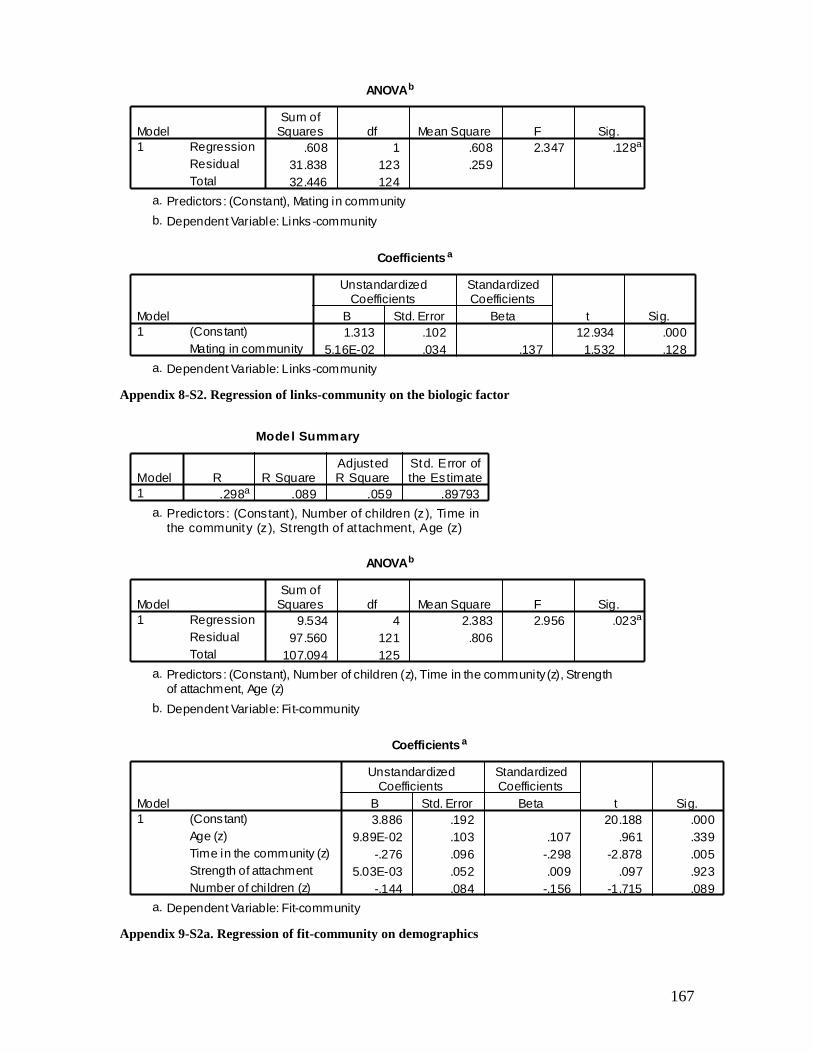
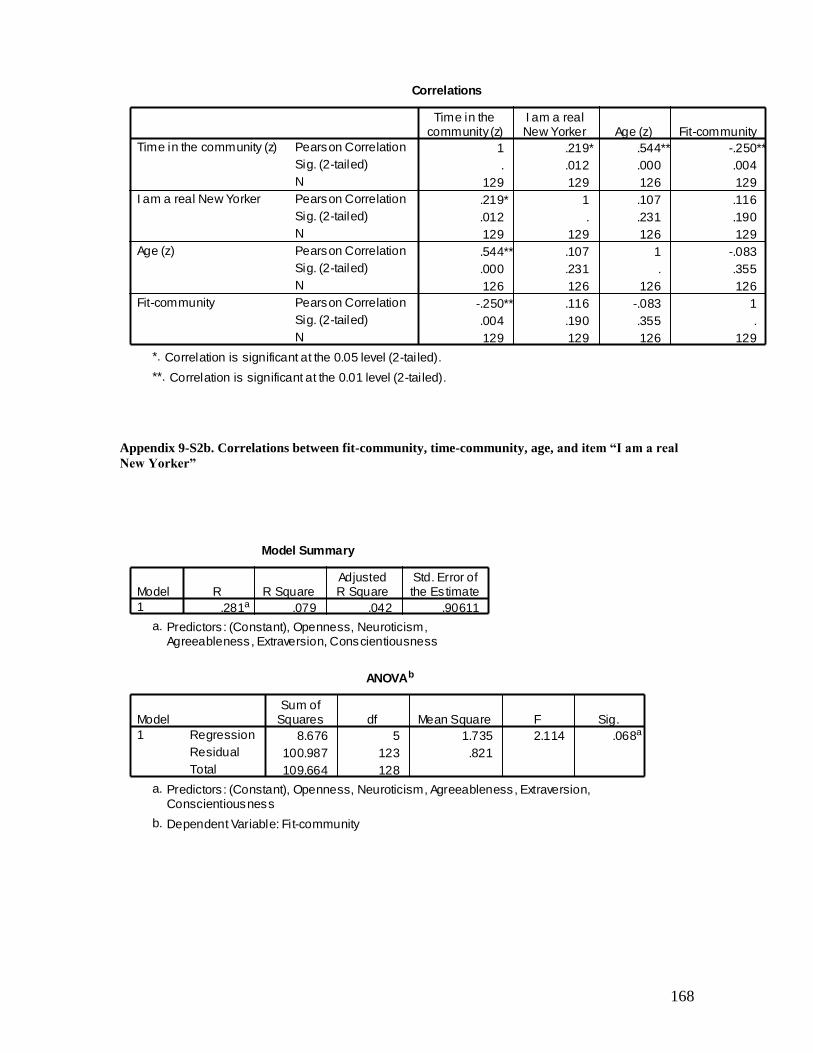
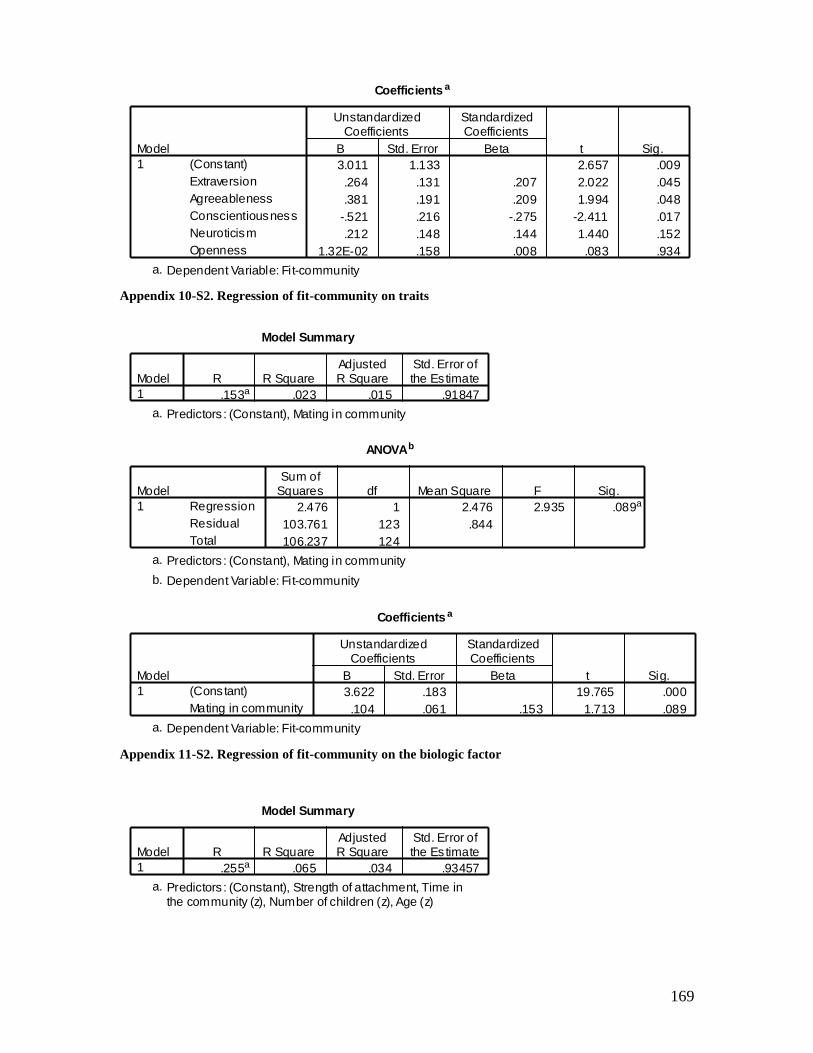
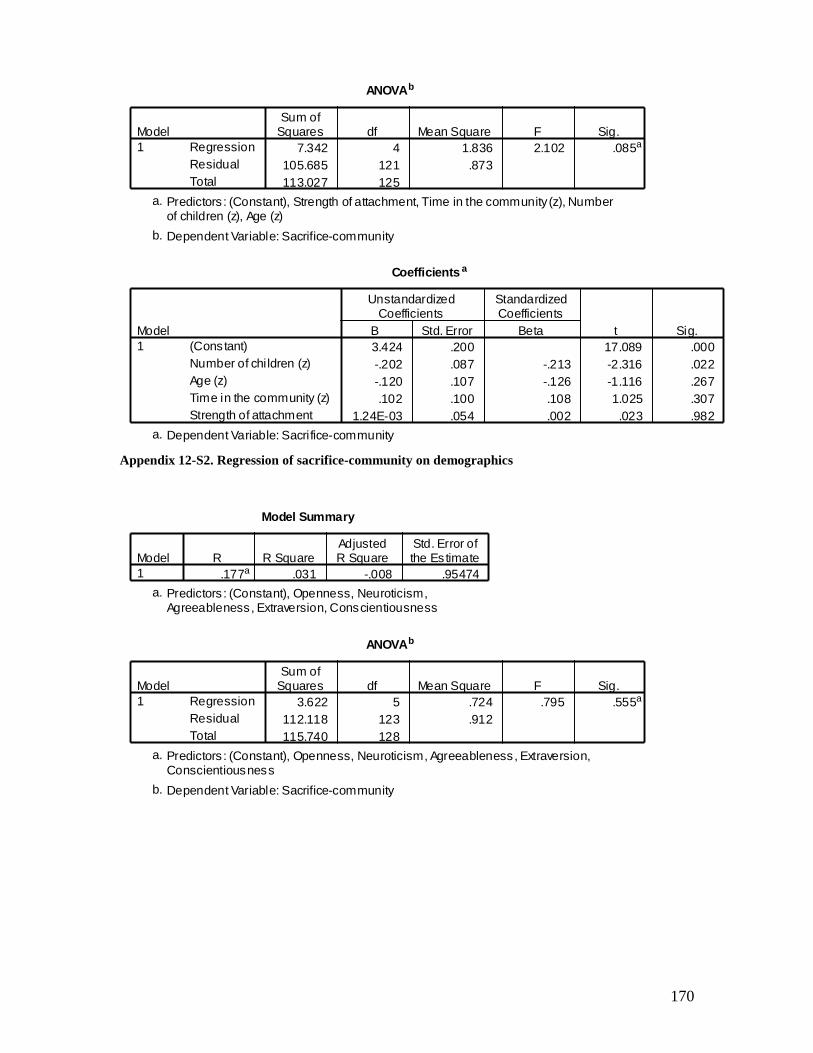
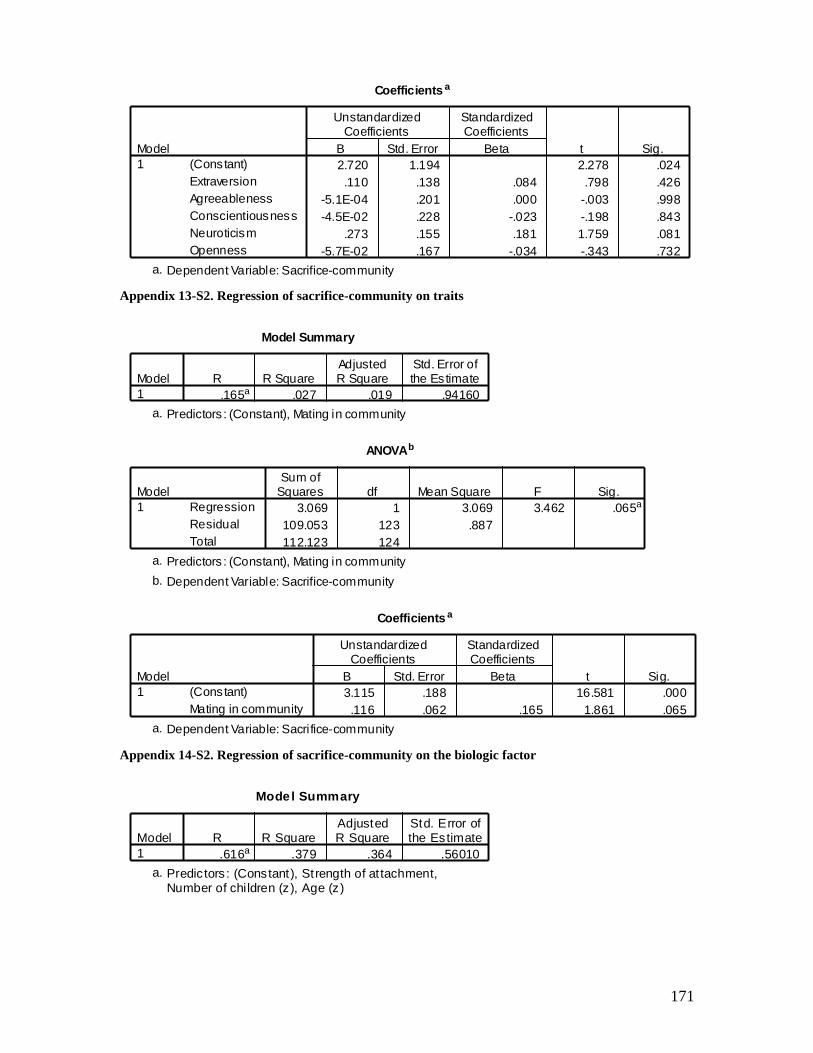

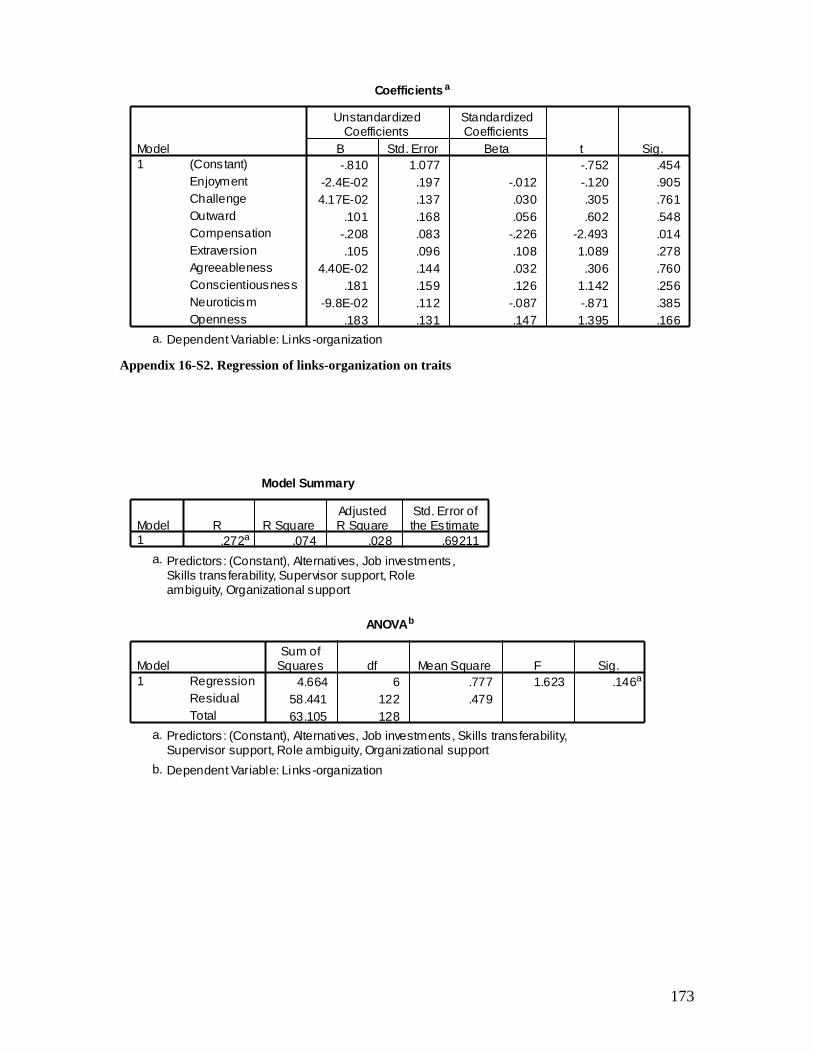
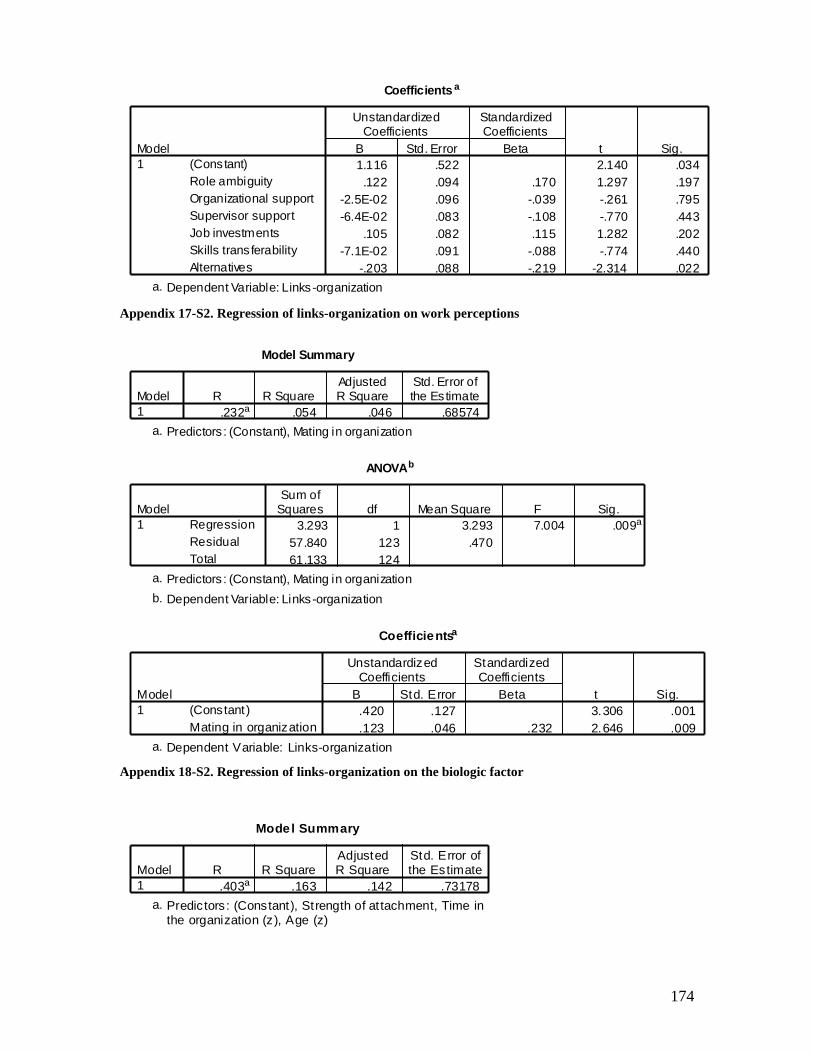
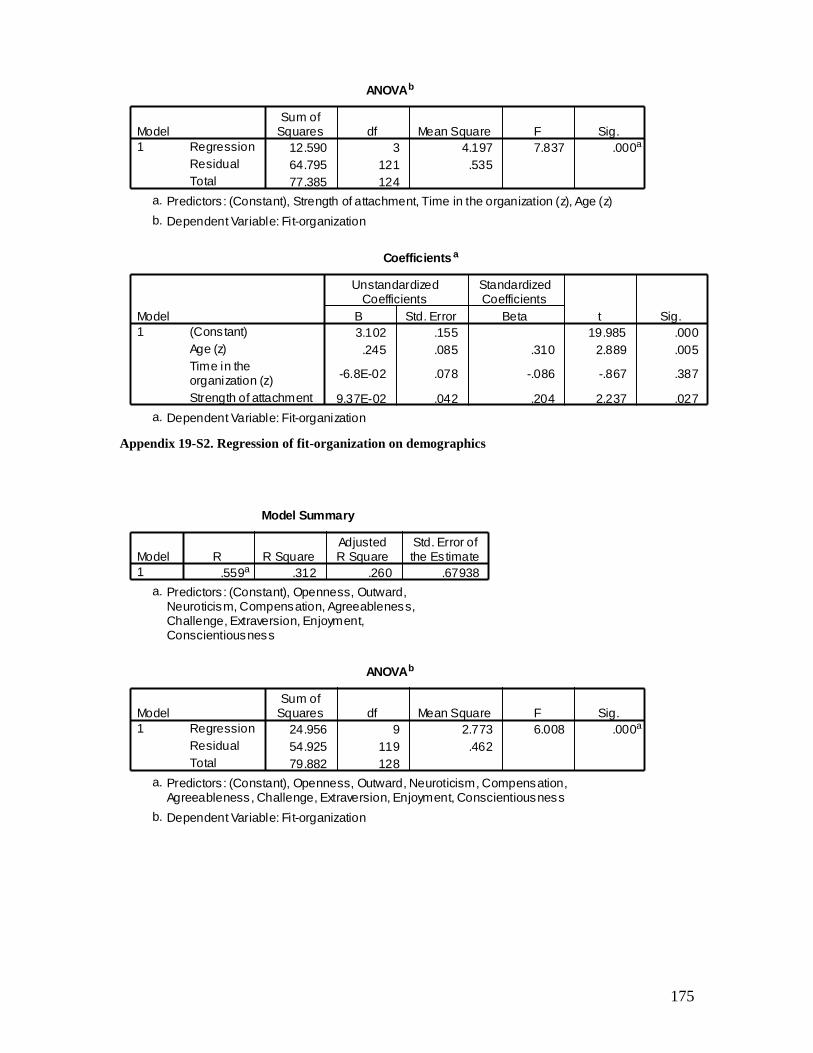

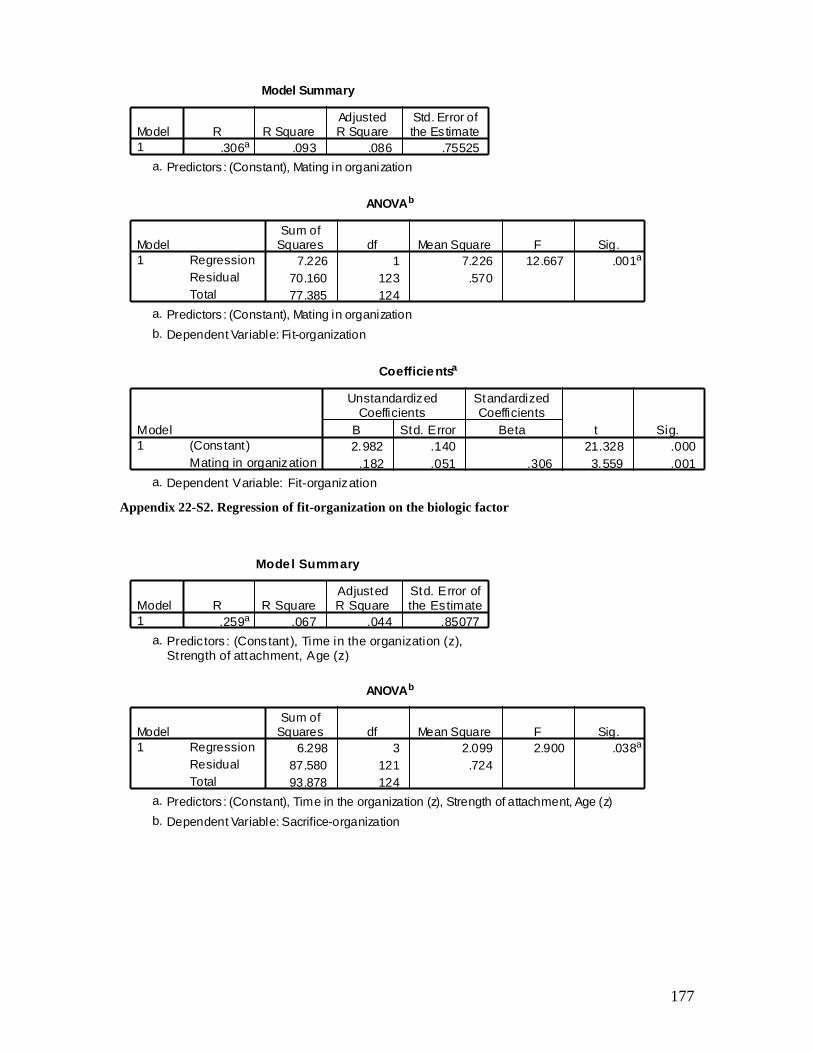
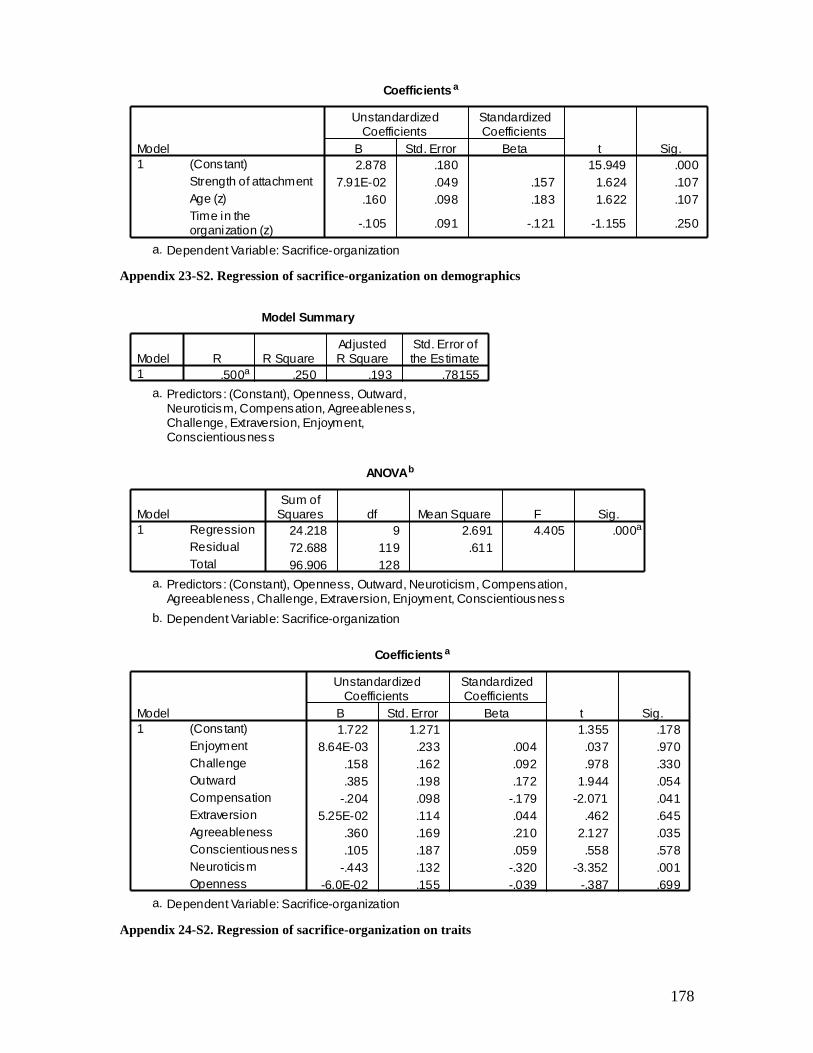
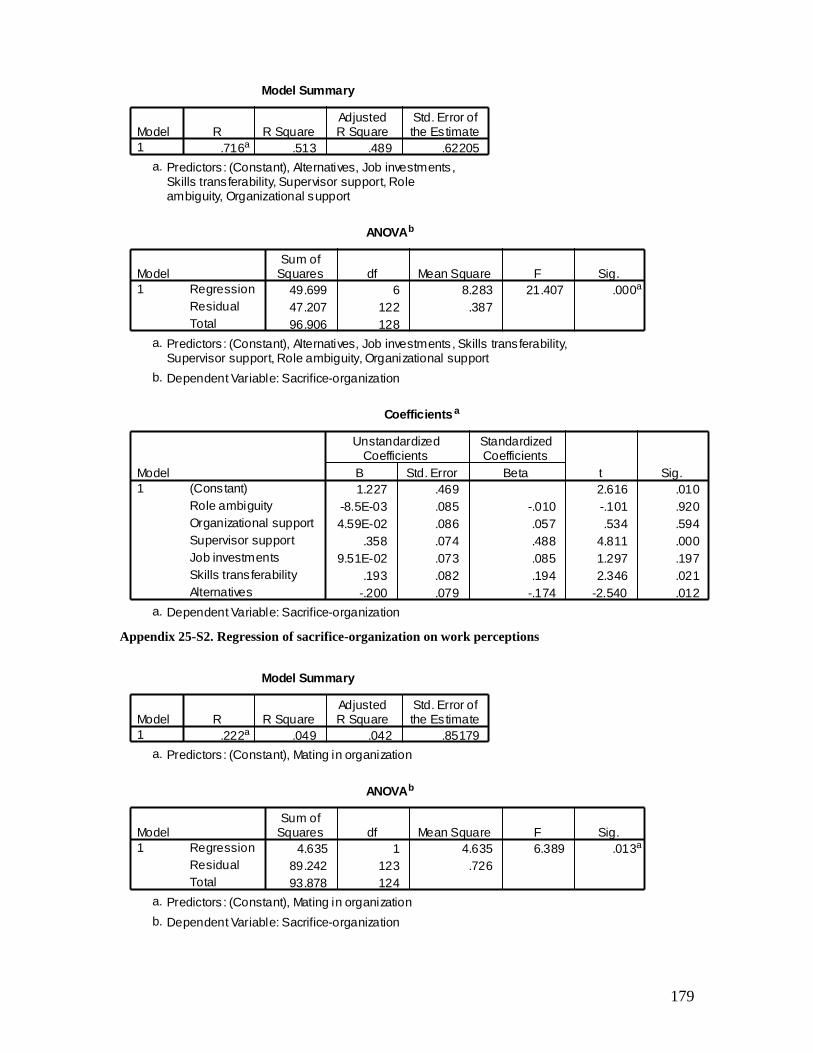
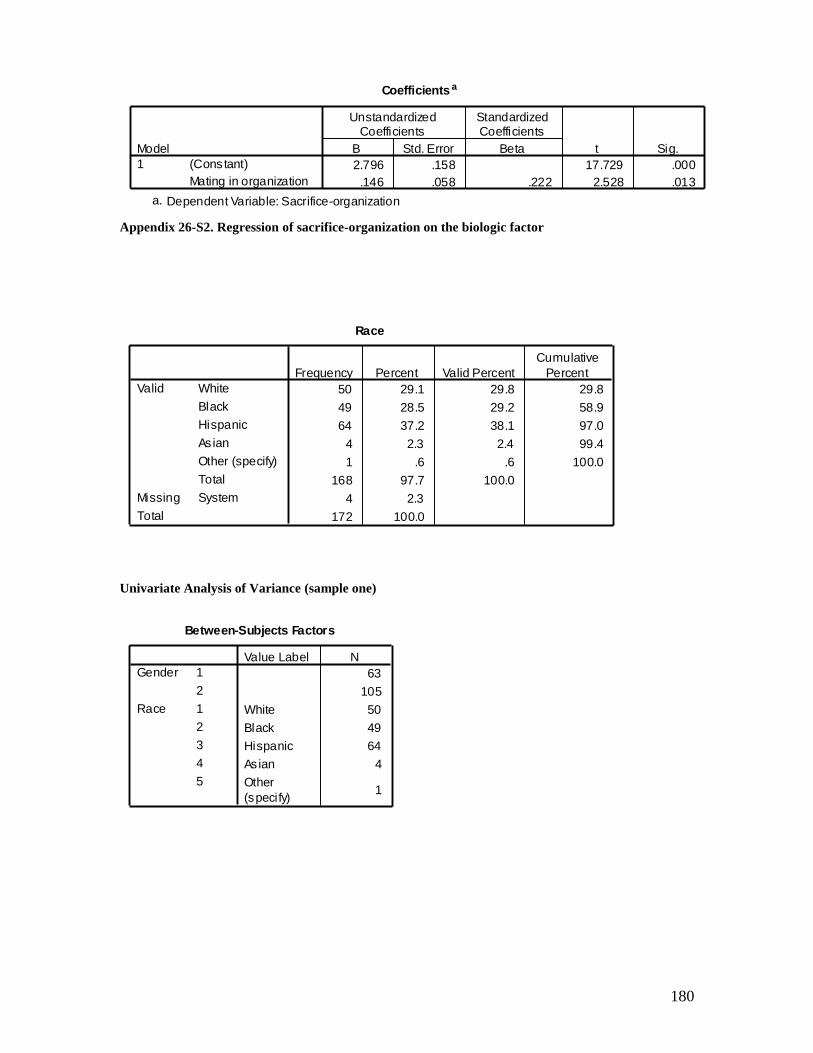

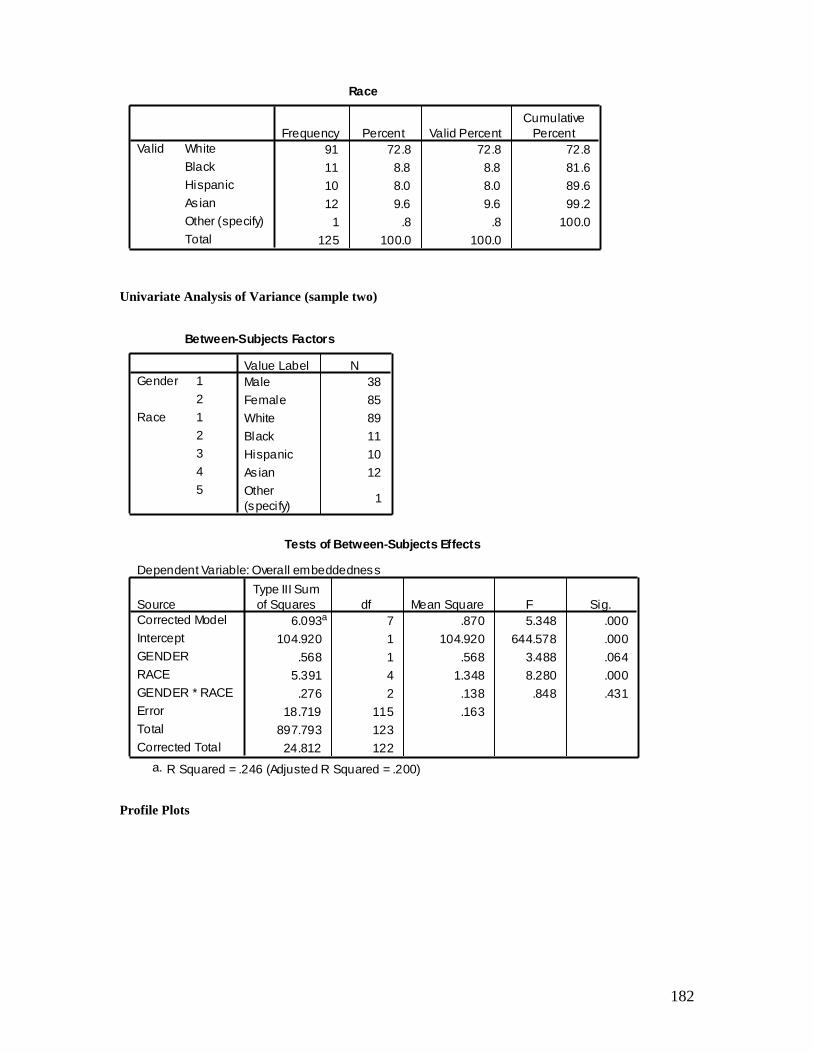


![Straightforward 2nd Editition Brochure.p[...]](https://static.documents.pub/doc/80x56/5868eab51a28abe7568be1c6/straightforward-2nd-editition-brochurep.jpg)


