113
Inventory management of the Technical Warehouse Freek van Eijndhoven 9/21/2012
| Date post: | 01-Jan-2017 |
| Category: |
Documents |
| Upload: | nguyentruc |
| View: | 224 times |
| Download: | 3 times |

UNILEVER
Inventory management of the Technical
Warehouse
Freek van Eijndhoven
9/21/2012

Page | II
Preface Dear reader, in front of you lays the research report of my Master thesis. My name is Freek van
Eijndhoven, and I have done the final stage of my study Industrial Engineering & Management at
Unilever Sourcing Unit Oss. In the last half year my world was the world of soups, sauces, and sausages,
products I had seen a lot in my seven years as student.
Before the subject of this thesis was known, I have already asked Leo van der Wegen as my first
supervisor from the University of Twente. My experiences with Leo were that he is patient with
students, can clearly explain subjects, and is organized in his work. These aspects made me chose him as
my first supervisor, and I am very thankful for the support of Leo in the last years and especially the last
half year.
My second advisor was chosen based on the subject of the research and is the expert on spare parts in
Twente. The suggestions and comments of Matthieu van der Heijden were very useful and I am thankful
for his criticism on my report.
The enthusiasm and opportunities given by Theo Dopheide, Technical & Implementation Manager, drew
me to Unilever SU Oss and he became my third supervisor in Oss. The discussions with Theo were
always positive and focussed on the strategic ideas for the technical warehouse and were very helpful.
Next, the ‘no nonsense’ discussions with Grad van Schijndel were very beneficial to my research. Grad
pulls no punches and says what is on his mind, and I really liked that approach. Together with him, I
discussed the current situation at the technical warehouse and the possibilities for the future. I hope
Grad will get the opportunity to implement our recommendations and that he will improve the technical
warehouse.
The last of my supervisors at Unilever SU Oss is Joost van Rossum, who was my first supervisor. With
Joost I had some good discussions about the structure of my report and about options to keep it short
and concise. As my roommate, we have shared a variety of things, from frustrations about insurances to
cups of coffee, and I am really thankful for everything he did for me.
Next to my five supervisors, this research could not have been successfully without the help of the
technical warehouse administrators, the head of the technical department, so Maarten, Tonnie, and
David, thanks a lot! Also, I want to thank the technical warehouse administrators of Unilever SU
Rotterdam, Heineken Den Bosch, and Johma Losser, where I saw some great ideas for the technical
warehouse of SU Oss.
Lastly, thanks to the help of Gerben van der Velde, Marjon Pol, and Sean Straatman, who critically read
this report, this report got the form that lays before you.
The fixtures in this report are not real, because of confidentiality. The results are however equal to
the results when using the real fixtures.
Freek van Eijndhoven, 21 September 2012
Page | III
Management Summary Unilever Sourcing Unit (SU) Oss, a ‘Make’ site with factories for sausages, soup and sauces has a
technical warehouse (TW) where they store their spare parts. These spare parts are used to replace
broken parts from the machines at the production lines. This TW is outdated at this moment, and the
number of differences between stock and storages (DSS), where the number of spares in the warehouse
does not correspond with the number of spares in the ERP system (SAP), is too high. Due to this, spares
are not available when needed, so broken machine parts cannot be replaced and downtime at the
production lines occurs.
Next to DSS, there are a lot of obsolete spares in the warehouse that are not used anymore or cannot be
used anymore. Also, the traceability of spare parts is difficult and takes too much time from the 70
clients of the warehouse.
The purpose of this research is to investigate the current spare parts inventory system of SU Oss and to
search for a method to optimize the warehouse, find a suitable policy to manage the warehouse and to
reduce the number of DSS. To find possible solutions for the technical warehouse, the ideal situation is
compared with the current situation.
The current situation is that the warehouse has one core problem, the lack of a clear organization and
structure of the warehouse. This is the main cause of DSS, which cause downtime and frustration. To
leave this downward spiral, the organization and structure have to be improved, and literature research
on the organization and structure of technical warehouses is done to find methods to improve the
organization and structure of a technical warehouse.
The uses of other documentation methods, other control and supervision methods, the use of TPM, and
KPIs are some of the most important findings of the literature review. This review is used to create
several alternatives for Unilever SU Oss, and is checked at other technical warehouses for feasibility.
Unilever SU Rotterdam, Johma Losser and Heineken Den Bosch are visited and here is seen that the use
of barcodes, TPM, and clean and organized warehouses result in less DSS and therefore a higher fill rate.
After the visits of other warehouse, the six alternatives are formed: Current Plus, Total Sup,
Consignment, RFID, Barcodes, and Kanban. These alternatives are used for the analysis to find the ideal
situation.
In the analysis for finding the optimal solution for SU Oss the two criteria of the main stakeholders, the
operations department and the technical & innovation department are used. These criteria are the total
value of all spares and the fill rate of the TW and these criteria are combined with the core problems
and suggestions from literature and the following criteria are realized: total cost and the chance of DSS.
In the analysis, the six alternatives are analyzed. Using the input and output of the alternatives given by
literature, costs, and stakeholder opinion, an ideal situation is given.
Page | IV
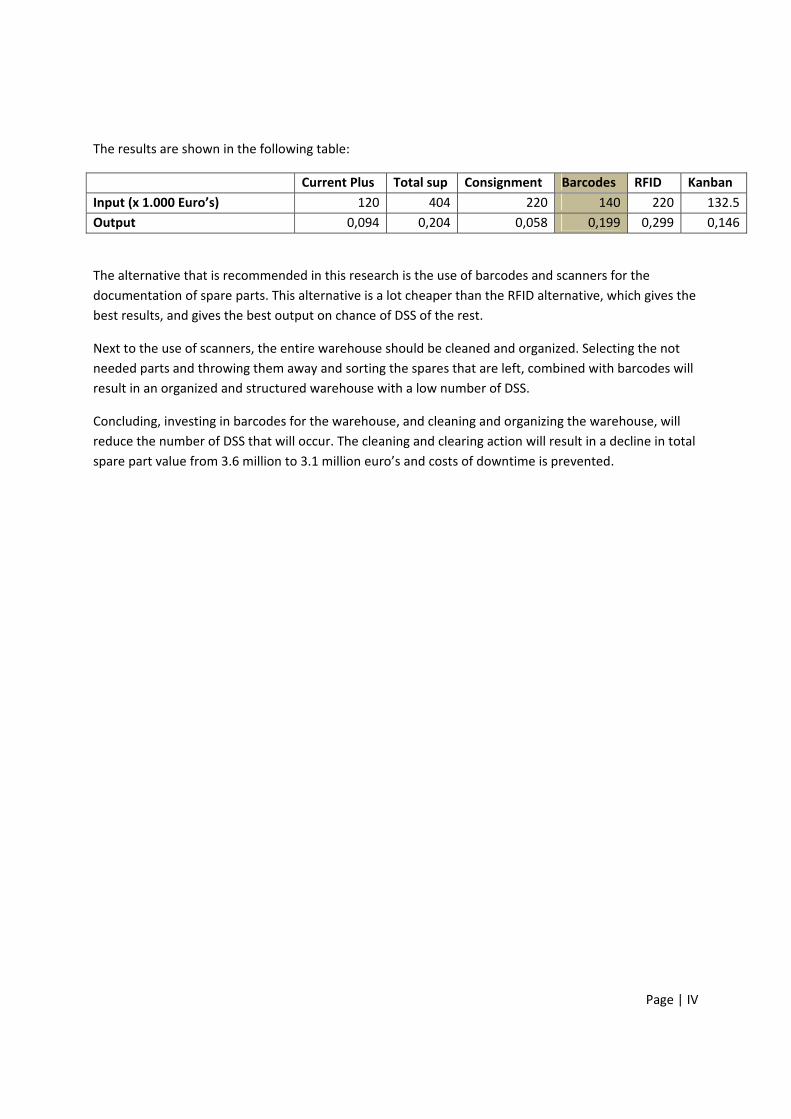
The results are shown in the following table:
Current Plus Total sup Consignment Barcodes RFID Kanban
Input (x 1.000 Euro’s) 120 404 220 140 220 132.5
Output 0,094 0,204 0,058 0,199 0,299 0,146
The alternative that is recommended in this research is the use of barcodes and scanners for the
documentation of spare parts. This alternative is a lot cheaper than the RFID alternative, which gives the
best results, and gives the best output on chance of DSS of the rest.
Next to the use of scanners, the entire warehouse should be cleaned and organized. Selecting the not
needed parts and throwing them away and sorting the spares that are left, combined with barcodes will
result in an organized and structured warehouse with a low number of DSS.
Concluding, investing in barcodes for the warehouse, and cleaning and organizing the warehouse, will
reduce the number of DSS that will occur. The cleaning and clearing action will result in a decline in total
spare part value from 3.6 million to 3.1 million euro’s and costs of downtime is prevented.

Page | V
Samenvatting (Nederlands) Unilever Sourcing Unit Oss, een fabriek waar soep, saus en worsten worden gemaakt heeft een
technisch magazijn waar reserve onderdelen van machines van de productielijnen worden opgeslagen.
Het magazijn is in de afgelopen decennia te weinig met zijn tijd meegegaan en daarnaast is het aantal
misgrijpen is te hoog, wat zorgt voor vertragingen in de productie. Deze misgrijpen, hier DSS genoemd,
zijn de verschillen tussen het aantal reserve onderdelen dat er volgens het ERP systeem (SAP) hoort te
liggen en het aantal wat fysiek in het magazijn ligt. Hierdoor kunnen er geen reserve onderdelen
gevonden worden voor kapotte onderdelen van machines, waardoor er stilstand van een productielijn
kan ontstaan.
Daarnaast is het aantal reserve onderdelen wat opgeslagen ligt enorm toegenomen in de afgelopen
jaren en liggen er reserve onderdelen die niet meer gebruikt (kunnen) worden. Deze niet gebruikte
onderdelen zowel oude, versleten en onnodige spare parts.
Het doel van dit onderzoek is om het technisch magazijn te onderzoeken en een advies te geven over
een methode om het magazijn te optimaliseren, voor goede regels om het magazijn te beheren en om
het aantal misgrijpen te verminderen. Hiervoor wordt de huidige situatie onderzocht en vergeleken met
de gewenste situatie.
In de huidige situatie beschrijving bleek dat het hoofdprobleem van het magazijn niet zozeer het aantal
spares is of de lage service graad, maar het ontbreken van een correcte organisatie en structuur. Dit is
de grootste oorzaak van misgrijpen en die veroorzaken stilstand en frustraties. Door deze frustraties
kunnen er dan weer nieuwe misgrijpen ontstaan.Om deze neerwaartse spiraal te verlaten moeten de
organisatie en structuur van het magazijn verbeterd worden en dit is gedaan aan de hand van
literatuuronderzoek. In dit onderzoek zijn de mogelijkheden voor het verbeteren van de organiatie en
structuur en de verbetering van discipline door onder andere nieuwe elektronische afboeksystemen
onderzocht.
Naast het literatuuronderzoek zijn de technische magazijnen van Unilever SU Rotterdam, Heineken Den
Bosch en Johma Losser bezocht. Hier is gekeken naar de methodes die zij gebruiken om het aantal
misgrijpen tegen te gaan en naar de manieren om discipline te handhaven. TPM, Barcodes en KPIs zijn
enkele van de meest voorkomende oplossingen bij de drie magazijnen.
Het literatuuronderzoek en de bezoeken aan andere magazijnen resulteerden in zes mogelijk
alternatieven: de huidige situatie, totale supervisie, consignatie, barcodes, RFID, en Kanban. Deze
alterantieven zijn meegenomen in de analyse.
In de analyse voor het bepalen van de gewenste situatie voor SU Oss zijn de twee criteria die door de
belangrijkste stakeholders, de afdelingen operaties en techniek & implementatie, waren opgesteld
gecombineerd met de resultaten uit het literatuuronderzoek en het hoofdprobleem. De service graad,
het aantal spares en organisatie en structuur resulteerden in totale kosten en kans op misgrijpen.

Page | VI
In the analyse worden de zes alternatieven getoetst voor het bepalen van de ideale situatie. Hiervoor
worden de input en output scores van de alternatieven bepaald, gebruik makend van literatuur, kosten
en de meningen van de stakeholders.
In onderstaande table staan de scores van de zes alternatieven:
Current Plus Total sup Consignment Barcodes RFID Kanban
Input (x 1.000 Euro’s) 120 404 220 140 220 132.5
Output 0,094 0,204 0,058 0,199 0,299 0,146
Het alternatief wat aanbevolen wordt in dit onderzoek is het gebruiken van barcodes en scanners voor
het afboeken van de spares. Dit alternatief is een stuk goedkoper dan RFID, die wel de hoogste output
heeft. Daarnaast heeft barcodes de hoogste output score van de betaalbare opties.
Naast het gebruik van barcodes en scanners zal het magazijn ook schoongemaakt en geordend moeten
worden. Het selecteren van de spares die niet meer gebruikt (kunnen) worden en het sorteren van de
spares op de juiste locaties gecombineerd met barcodes zal een georganiseerd en gestructureerd
magazijn opleveren met een veel lagere kans op misgrijpen.
Concluderend, investeren in barcodes en methodes om de organisatie van‐ en de structuur in het
magazijn te verhogen leveren een daling in de waarde van het totale aantal spares op van 500.000 euro
en daarnaast zal het aantal misgrijpen drastisch afnemen, waardoor het magazijn een nog grotere
toegevoegde waarde voor Unilever SU Oss zal worden.
Page | VII
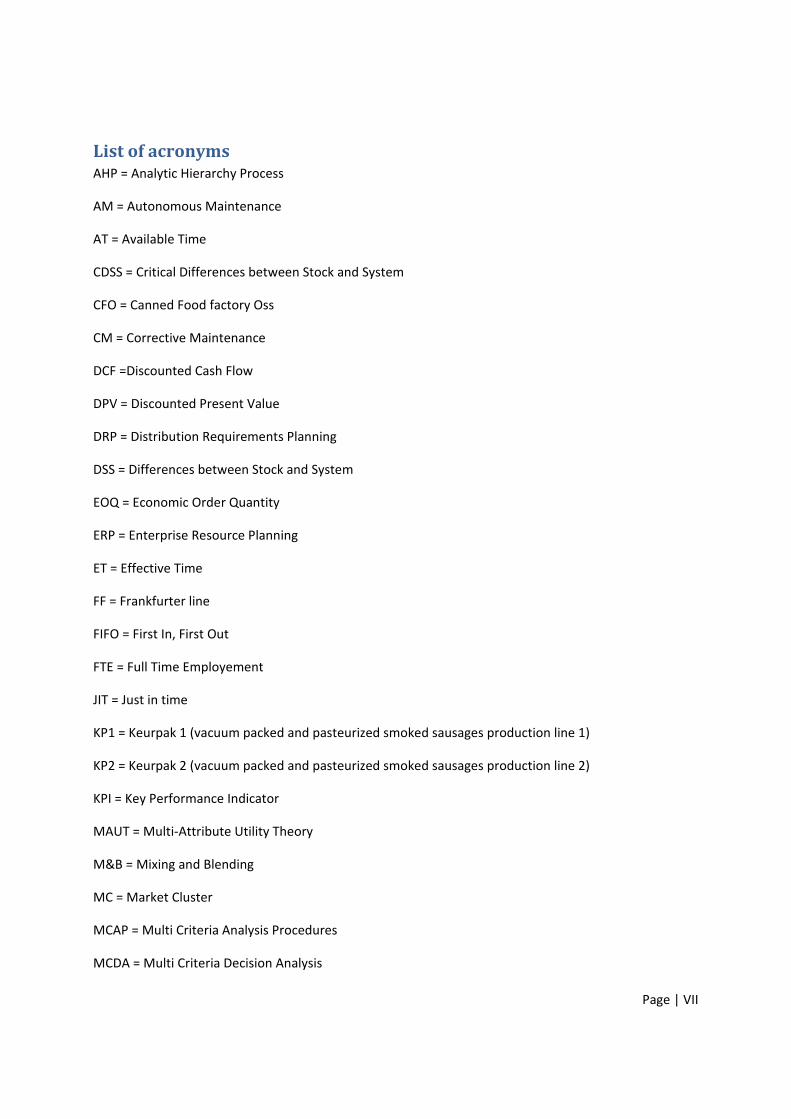
List of acronyms AHP = Analytic Hierarchy Process
AM = Autonomous Maintenance
AT = Available Time
CDSS = Critical Differences between Stock and System
CFO = Canned Food factory Oss
CM = Corrective Maintenance
DCF =Discounted Cash Flow
DPV = Discounted Present Value
DRP = Distribution Requirements Planning
DSS = Differences between Stock and System
EOQ = Economic Order Quantity
ERP = Enterprise Resource Planning
ET = Effective Time
FF = Frankfurter line
FIFO = First In, First Out
FTE = Full Time Employement
JIT = Just in time
KP1 = Keurpak 1 (vacuum packed and pasteurized smoked sausages production line 1)
KP2 = Keurpak 2 (vacuum packed and pasteurized smoked sausages production line 2)
KPI = Key Performance Indicator
MAUT = Multi‐Attribute Utility Theory
M&B = Mixing and Blending
MC = Market Cluster
MCAP = Multi Criteria Analysis Procedures
MCDA = Multi Criteria Decision Analysis

Page | VIII
MCO = Multi Country Organisation
METRIC = Multi‐Echelon Technique for Recoverable Item Control
MRP = Material Requirement Planning
MT = Management Team
ND = Spare parts that are ordered manually by experience instead of automatically
OE = Operational Efficiency
OT = Operational Time
OU = Operational Utilisation
PAMCO = Plant and Machine Control
PE = Production Efficiency
PM = Preventive Maintenance
PT = Production Time
QLE = Quality, Labour and Environment
RFID = Radio Frequency Identification
RMI = Raw material income
SKU = Stock Keeping Unit
SMART = Simple Multi‐Attribute Rating Technique
SPP = Spare Part Procedure
SPS = Smoked pork sausages
S/S = Soup and sauce
SSF = Soup and sauce factory
SU = Sourcing Unit
T&I = Technical & Implementation
TD = Technical Department
TPM = Total Productive Maintenance
Page | IX
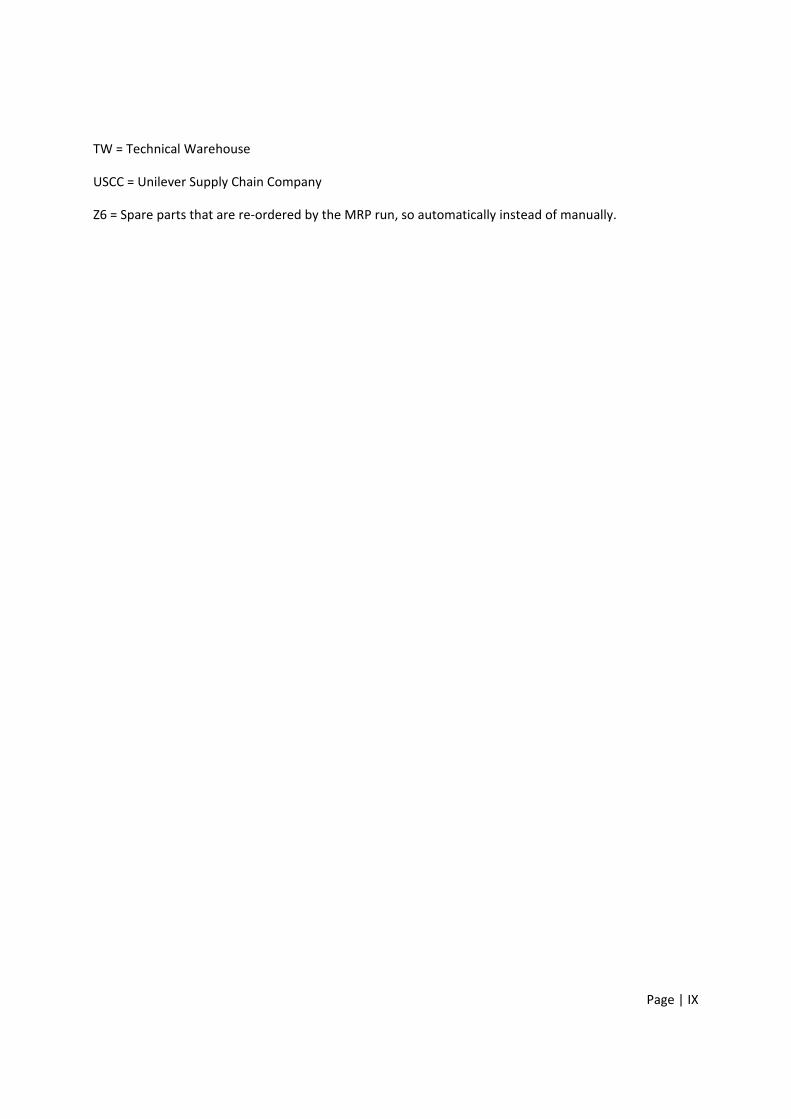
TW = Technical Warehouse
USCC = Unilever Supply Chain Company
Z6 = Spare parts that are re‐ordered by the MRP run, so automatically instead of manually.
Page | X
Table of Contents Preface .......................................................................................................................................................... II
Management Summary ............................................................................................................................... III
Samenvatting (Nederlands) .......................................................................................................................... V
List of acronyms .......................................................................................................................................... VII
1. Introduction .......................................................................................................................................... 1
1.1. Motivation ..................................................................................................................................... 1
1.2 Introduction to Unilever N.V. ........................................................................................................ 1
1.3. Introduction to Sourcing Unit Oss ................................................................................................. 2
1.4. Problem definition ........................................................................................................................ 3
1.5. Research goal ................................................................................................................................ 4
1.6. Research question(s) ..................................................................................................................... 4
1.7. Scope ............................................................................................................................................. 5
1.8. Conclusion ..................................................................................................................................... 6
2. Current situation ................................................................................................................................... 7
2.1. Current system .............................................................................................................................. 7
2.2. Current control/management .................................................................................................... 10
2.3. Current problems/bottlenecks ................................................................................................... 14
2.4. Current performance .................................................................................................................. 18
2.5. Summary of the chapter ............................................................................................................. 21
3. Alternatives ......................................................................................................................................... 22
3.1. Literature research ...................................................................................................................... 22
3.2. Comparing companies ................................................................................................................ 30
3.3. Alternatives for Unilever SU Oss ................................................................................................. 33
3.4. Conclusion ................................................................................................................................... 35
4. Analysis ............................................................................................................................................... 37
4.1. Criteria ......................................................................................................................................... 37
4.2. Method ....................................................................................................................................... 41
4.3. Output variables .......................................................................................................................... 42
4.4. Description of the ideal situation ................................................................................................ 47
4.5. Conclusion ................................................................................................................................... 51
5. Implementation Plan .......................................................................................................................... 53
Page | XI
6. Conclusion & Discussion ..................................................................................................................... 57
6.1. Conclusion ................................................................................................................................... 57
6.2. Recommendations ...................................................................................................................... 59
6.3. Discussion .................................................................................................................................... 63
Bibliography ................................................................................................................................................ 65
Appendix 1: Stakeholder analysis ............................................................................................................... 69
Appendix 2: Interview questions and results .............................................................................................. 71
Appendix 3: Literature Review .................................................................................................................... 73
Appendix 4: Different approach per spare type ......................................................................................... 75
Appendix 5: Inventory control .................................................................................................................... 77
Appendix 6: Comparable companies .......................................................................................................... 81
Appendix 7: Interview questions for visiting other warehouses (Dutch) ................................................... 82
Appendix 8: Choice of MCDA ...................................................................................................................... 84
Appendix 9: AHP ......................................................................................................................................... 87
Appendix 10: Weights of the criteria .......................................................................................................... 91
Appendix 11: Calculations at the analysis ................................................................................................... 93
Appendix 12: Using five years to calculate the results ............................................................................... 99
Appendix 13: Time schedule for the implementation plan ...................................................................... 101

Page | 1
1. Introduction In this chapter an introduction to the research is given, starting with the motivation of the research
(§1.1), followed by an introduction to Unilever N.V. (§1.2) and to Sourcing Unit Oss, where the research
has been conducted (§1.3). After the introductions the problem definition (§1.4), the goal of this
research (§1.5) and the research questions (§1.6) are given. The chapter ends with the scope (§1.7) and
the conclusion (§1.8), where the next steps of this research are shown.
1.1. Motivation Unilever Sourcing Unit Oss, a factory where they make soup, sauces and sausages has a problem with
their spare parts inventory. A spare part is “a replaceable component, sub assembly, and assembly
identical to and interchangeable with the item it is intended to replace” (Business Dictionary, 2012). For
Sourcing Unit (SU) Oss, spare parts are the parts that can replace the parts of machines at the
production lines that are broken and the parts that are replaced during revision.
Over the last decades the number of spare parts in stock has risen to over 10 thousands different parts
or stock keeping units (SKUs), which are stored in the technical warehouse (TW). In the technical
warehouse, the spare parts of the machines of different production lines are stored.
According to the problem owners of this research, which are the Technical & Implementation Manager
and the maintenance manager, the level of service of this technical warehouse is too low and the
number of spare parts is too high. Advice on improving these two criteria is given at the end of this
research, which starts with an introduction to Unilever N.V. and Sourcing Unit Oss.
1.2 Introduction to Unilever N.V. Unilever N.V. is a Dutch‐British multinational with activities on the markets of personal care,
refreshment, food, and homecare products. These products are globally and sold under one of the circa
400 Unilever brands, but also on behalf of other companies.
The company is officially established in 1930, after a merger of the British soap producer “Lever
Brothers” and the Dutch margarine producer “Margarine Union”, which both use oil. As competitors for
oil suppliers, merging gave them buying power, which resulted in “Unilever”. In 2011 the results of this
multinational were:
‐ Turnover of € 46.5 billion, which is 5% higher than in 2010
‐ Operating Profit of € 6.4 billion, which is 1% higher than in 2010
‐ Net profit of € 4.6 billion which is 1% higher than in 2010
‐ Advertising and promotions spent of € 6.2 billion (Unilever, 2012)
The activities of Unilever are geographically divided into eight market clusters (MC), which are divided
into several Multi Country Organizations (MCO). The activities of Unilever Netherlands, and therefore
also the activities of SU Oss, are part of the MCO “Unilever Benelux NL”, which is a part of MC Europe.
Page | 2
The MCO “Unilever Benelux” consists of five Sourcing Units, four in the Netherlands and one in Belgium.
The Dutch SUs are the margarine factory in Rotterdam, the ice‐cream factory in Hellendoorn, the
toothpaste factory in Amersfoort and the factory for meat products, soups and sauces in Oss.
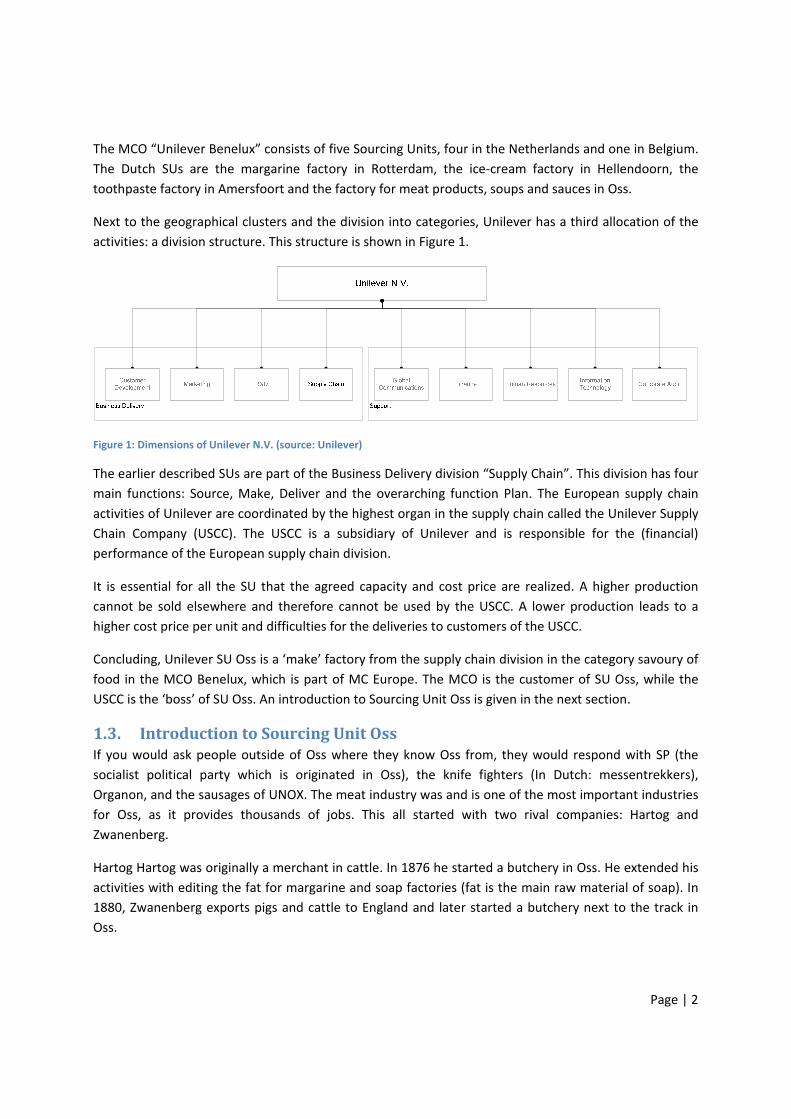
Next to the geographical clusters and the division into categories, Unilever has a third allocation of the
activities: a division structure. This structure is shown in Figure 1.
Figure 1: Dimensions of Unilever N.V. (source: Unilever)
The earlier described SUs are part of the Business Delivery division “Supply Chain”. This division has four
main functions: Source, Make, Deliver and the overarching function Plan. The European supply chain
activities of Unilever are coordinated by the highest organ in the supply chain called the Unilever Supply
Chain Company (USCC). The USCC is a subsidiary of Unilever and is responsible for the (financial)
performance of the European supply chain division.
It is essential for all the SU that the agreed capacity and cost price are realized. A higher production
cannot be sold elsewhere and therefore cannot be used by the USCC. A lower production leads to a
higher cost price per unit and difficulties for the deliveries to customers of the USCC.
Concluding, Unilever SU Oss is a ‘make’ factory from the supply chain division in the category savoury of
food in the MCO Benelux, which is part of MC Europe. The MCO is the customer of SU Oss, while the
USCC is the ‘boss’ of SU Oss. An introduction to Sourcing Unit Oss is given in the next section.
1.3. Introduction to Sourcing Unit Oss If you would ask people outside of Oss where they know Oss from, they would respond with SP (the
socialist political party which is originated in Oss), the knife fighters (In Dutch: messentrekkers),
Organon, and the sausages of UNOX. The meat industry was and is one of the most important industries
for Oss, as it provides thousands of jobs. This all started with two rival companies: Hartog and
Zwanenberg.
Hartog Hartog was originally a merchant in cattle. In 1876 he started a butchery in Oss. He extended his
activities with editing the fat for margarine and soap factories (fat is the main raw material of soap). In
1880, Zwanenberg exports pigs and cattle to England and later started a butchery next to the track in
Oss.

Page | 3
UNOX
After several mergers, the competitors become part of the same company in 1970; a company go under
the name Unilever Meat Group Netherlands. In 1957, canned soup entered the market for the first time.
In 1991, the sauce factory is opened in Oss, and in 1997, the first Unox‐hat appeared at the
“Elfstedentocht”. (Unilever Sourcing Unit Oss, 2012)
SU Oss in 2012
In 2012, the production volume of SU Oss has grown to 92.000 tons and the total plant area is 106.148
m2. The number of employees declined over the years and at the moment there are 417 employees on
payroll (Unilever Sourcing Unit Oss, 2012). On this site, there are three factories, one for soups, sauces
and sausages. The soups and sauces factory (SSF) is combined and the sausages factory is called Canned
Food factory Oss (CFO). Sauces and soups are made in their own production line and the CFO is divided
into three production lines, one frankfurter line (FF) and two smoked pork sausages lines which are
called ‘Keurpak’ lines (KP 1 and 2). Production volumes of SU Oss are shown in Table 1.
Volumes by brand Volumes by production line
Table 1: Total volume of Unilever SU Oss by brand and production line (source: Unilever Sourcing Unit Oss (2012))
1.4. Problem definition Because of the different production lines with different spare parts they have and had in the past, there
are a lot of different spare parts in the technical warehouse of SU Oss. New innovations and
technologies also causes a lot of different spare parts because of new machines, and this results in the
technical warehouse there is today. At this moment, the number of spare parts of the different
production lines has grown to over ten thousand different spare parts with an estimated value of over 3
million Euros.
Having a large number of spare parts is not a big problem on its own, as long as the service level of the
warehouse is close to 100%. According to the technical warehouse administrators this is not the case,
which is investigated in the next chapter. This means that some of the spares are not available when
they are needed. Breakdowns of machines are already bad for production and waiting for spare parts
when they are not available at the technical warehouse increases the impact of that problem.

Page | 4
Next to waiting for spares that are not available, there is a high number of differences in the number of
items in the warehouse and the number of items that must be in the warehouse according to the IT
system. This situation is called ‘differences in system and stock (DSS)’ in this research. DSS do not always
lead to downtime immediately, because some differences can be caught before they become
problematic. When DSS leads to downtime, it is called critical DSS or CDSS. According to all stakeholders,
the main causes of DSS are incorrect document handling and lack of discipline.
Concluding, the problems faced for the technical warehouse are the high number of DSS, the low service
level and a high number of spares.
1.5. Research goal Based on the problem definition in Section 1.4, the goal of this research is defined.
The goal of the research is to give advice on the technical warehouse at Unilever Sourcing Unit Oss, so
the amount of spares can be reduced and the service level can increase.
1.6. Research question(s) To realize the goal of this research, several research questions are developed. The main research
question of this research is:
What is the best possible spare parts system for the technical warehouse that can be implemented at
Unilever Sourcing Unit Oss?
Here, a spare parts system includes all the policies that influence the performance of the technical
warehouse, its order policies and its infrastructure. The spare parts system does not include the
maintenance that is done, which results in a demand for spares.
Sub questions:
1. How are the spare parts in the technical warehouse currently managed?
Before any literature research can be started and recommendations can be given it is necessary to
describe the current spare parts handling of the technical warehouse. This question is answered in
Chapter 2, the current system or ‘AS IS’ situation.
2. Which alternatives are available in literature for managing spare parts in production companies?
Instead of changing the current system, it is interesting to describe some feasible spare parts inventory
systems when you could start from scratch. A literature research will be conducted for the best spare
parts inventory systems and this question is answered in Chapter 3.
3. Which alternatives are used by other production companies in the Netherlands and at other
Unilever sites with comparable complexity?
Page | 5
After describing the spare parts inventory system, the comparison between the current system and other
systems can be done by investigating how other production companies in the Netherlands / Europe
control their spare parts inventories. This question is also answered in Chapter 3.
4. What is the best possible spare part system for the technical warehouse of Unilever SU Oss?
After the second and third sub question, some solutions are found. These solutions are made into
alternatives for Unilever SU Oss and need to be compared. For the comparison, a method (MCDA) is
used, criteria are needed, and the feasibility will be checked. After this analysis, a best solution or ‘TO BE’
situation is found. The criteria are given in Section 4.1, the MCDA method in Section 4.2, the analysis in
Section 4.3, and the best alternative is given in Section 4.4.
5. How can the recommended system be implemented at SU Oss?
In Chapter 5, the implementation plan starting with the concluded solution is given. After the
implementation plan, the conclusion is given in Section 6.1, followed by the recommendations in Section
6.2 and the discussion in Section 6.3.
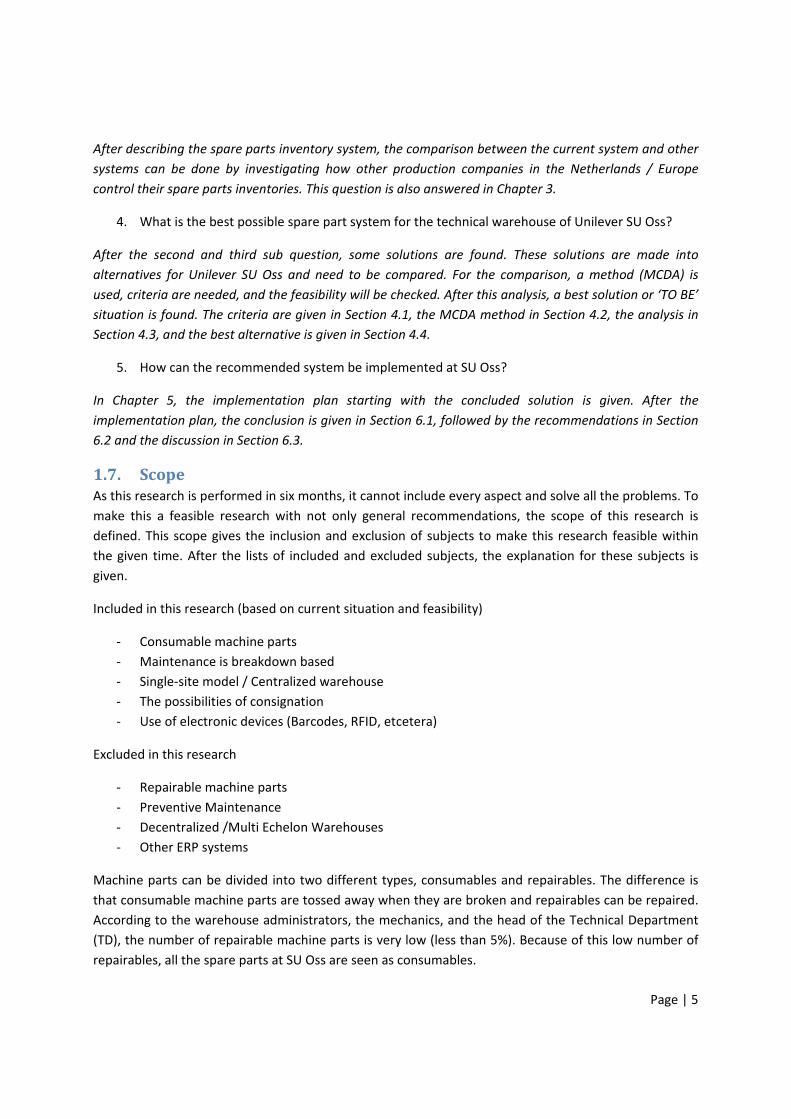
1.7. Scope As this research is performed in six months, it cannot include every aspect and solve all the problems. To
make this a feasible research with not only general recommendations, the scope of this research is
defined. This scope gives the inclusion and exclusion of subjects to make this research feasible within
the given time. After the lists of included and excluded subjects, the explanation for these subjects is
given.
Included in this research (based on current situation and feasibility)
‐ Consumable machine parts
‐ Maintenance is breakdown based
‐ Single‐site model / Centralized warehouse
‐ The possibilities of consignation
‐ Use of electronic devices (Barcodes, RFID, etcetera)
Excluded in this research
‐ Repairable machine parts
‐ Preventive Maintenance
‐ Decentralized /Multi Echelon Warehouses
‐ Other ERP systems
Machine parts can be divided into two different types, consumables and repairables. The difference is
that consumable machine parts are tossed away when they are broken and repairables can be repaired.
According to the warehouse administrators, the mechanics, and the head of the Technical Department
(TD), the number of repairable machine parts is very low (less than 5%). Because of this low number of
repairables, all the spare parts at SU Oss are seen as consumables.

Page | 6
Using consumables instead of repairables is also because of the current type of maintenance at SU Oss.
At this moment, the maintenance is breakdown based. The goal of SU Oss in the coming years is to
change this to preventive maintenance, which is described in Chapter 2, but at the moment it remains
breakdown based.
The location where the consumable spares are stored is a central technical warehouse, with the
production lines of the sourcing unit within a five minute walk. Because of the relatively compact
sourcing unit, the use of decentralized or multi echelon warehouses is not relevant, as it is not
beneficial. The terms centralized, decentralized, multi echelon and single‐site models are also explained
in Chapter 2.
The current ERP system of SU Oss is SAP, and the documentation of the spares is done by SAP. This
system works well according to the stakeholders, and should not be replaced. The possibilities to
upgrade the use of SAP are investigated, as it can be beneficial and complementary.
Last point that is investigated is the possibility of consignation, or outsourcing the warehouse. After
describing the current system of SU Oss in Chapter 2, this is the first section of Chapter 3, as the use of
consignation could lead to a relocation of the current problems to the supplier.
1.8. Conclusion As described in this chapter, this research will focus on the technical warehouse of Unilever SU Oss. This
warehouse has over 10.000 different spares and a high number of differences between SAP and the
actual stock, and those two points need to be investigated.
In this investigation, the AS IS or current situation is described in Chapter 2, in which the problems with
the TW are ‘established’. After the formulations of these problems, a couple of research points are
defined, which are used in Chapter 3. Possibilities for technical warehouses and comparable companies
are used to make several alternatives for SU Oss. These alternatives are made to establish the TO BE or
ideal situation for the TW.
For this establishment a MCDA method will be used. The explanation of MCDA can be found in Section
4.2 and in the rest of that chapter, the analysis is done. At the end, after a successful analysis, the ideal
situation is given and several recommendations are made.
Before this can happen, the current situation has to be described, which is done in the next chapter.
Page | 7
2. Current situation In this chapter, the first research question is answered.
“How are the spare parts in the technical warehouse currently managed?”
The current situation at the technical warehouse of Unilever SU Oss is determined in four steps, starting
with the current system in Section 2.1, followed by the current control and management (§2.2), the
current performance (§2.3) and the current problems and bottlenecks (§2.4). After the current situation
is sketched, a summary is given (§2.5).
2.1. Current system Before the bottlenecks and problems within SU Oss can be found, the current system is described. This
description consists of all actions that involve spare parts management in the TW and starts with an
explanation of what a technical warehouse is, and what the characteristics of the TW in SU Oss are.
2.1.1. Characteristics of a TW: SU Oss The technical warehouse is the location for stocking spare parts, as mentioned by the classical repairable
problem of Sherbrooke (1968). The classical repairable problem is the military logistics problem of
stocking repairable parts for aircrafts at bases which are capable of repairing some, but not all broken
parts, and a central depot which serves all of the bases (Sherbooke, 1968). The main difference
between the system of Sherbrooke and the situation of SU Oss is that repairing and stocking are
separated at SU Oss. Repairing is done by the technical department (TD) and stocking is done at the TW.
Mechanics and production personnel can take spares from the warehouse when the corresponding
machine parts do not function as requested. The TW of SU Oss is an open warehouse, where around 70
people (excl. third parties) can enter and is controlled by two warehouse administrators. The 70 people
can all search for spares in SAP, the ERP system used at SU Oss, find the spare part and handle the
documents. In the rest of this report, the 70 people are referred to as ‘clients’ of the TW.
Most of the spares are stored on one location, the TW, but there are some spares at the production
lines, which makes the TW a centralized and a decentralized warehouse. At decentralized warehouses,
or warehouses which use Multi‐Echelon Techniques for Recoverable Item Control (METRIC) there are
decentralized bases that are supplied by a depot, but as mentioned in Section 1.7, the warehouse is
seen a centralized warehouse, as the bases at SU Oss are just spare parts at the production lines and the
walking distances between the warehouse and the SSF and CFO are 15 minutes maximum, so supplying
bases from a depot is unnecessary. Concluding, the TW of SU Oss can be seen as a centralized (or single‐
site) model, with 70 clients who can get spare parts when they are needed.
2.1.2. Machine breakdown and the role of the TW The TW process is shown in Figure 2 and here explained step‐by‐step. This system shows the actors and
actions which are involved in a breakdown of a machine and the role of the TW in this process.
The system starts when a machine breaks down (1). At that moment, the TD is called to check which
part is broken (2). When the broken part is identified, the mechanic or the first operator of the machine
Page | 8
checks in SAP if the spare part is on stock (3). If the item is on stock, the TD looks for the needed item on
the location in the TW as indicated by SAP (4). In the best case scenario, the item is also physically in
stock and the TD can put this new part in the machine (9), after documentation in SAP (8) and the
machine works again (11). If the machine does not work after the installation of a new part (12), the TD
is contacted again to find another broken part, which needs replacement.
When the spare part is not available according to SAP, the spare part must be checked for reparability
(6). When this is not possible, the spare must be ordered by the technical planner of the production line
of the broken machine (7). After repair of the spare or the delivery of a new one, the process continues
at step 8.
There are still two processes left, the stage after documentation, and differences between stock and
system (DSS). When SAP shows that there are still some parts on stock and the TD cannot find them in
the TW, there is a critical DSS (CDSS). The TW administrator changes the inventory in SAP (5) and then
the system resumes at step 6.
The last process that is described is the documentation (8) and the step after it (13). It is crucial for the
correctness of the warehouse that all spares that leave the warehouse are documented, so DSS will not
occur after a MRP run. MRP is a production planning and inventory control system used to manage
manufacturing processes and tries to ensure that spares are available when needed.
When documentation is done properly, the Material Requirements Planning (MRP) system that runs
overnight finds the inventory levels of all the spares that are below their reorder point. When this
happens, the spare is documented on the order list, which is checked by the warehouse administrator
and ordered, so the level of spares is correct again. Ordering the spare parts is described in Section
2.2.4.
2.1.3. Maintenance Next to the normal break down process, the TW handles spare parts demand from maintenance. In
literature, there are two well‐known types of equipment maintenance; breakdown repair or corrective
maintenance (CM) and preventive maintenance (PM). Breakdown repair is the practice of caring for
equipment when it breaks and preventive maintenance is the practice of tending to equipment so it will
not break down and operates according to requirements. It entails understanding and maintaining all
the physical elements of manufacturing – machine components, equipment, and systems – so they
consistently perform at their required levels. (Nicholas, 1998)

Page | 9
Figure 2: Current system for the technical warehouse of SU Oss, using a failure as starting point (source: Unilever Sourcing Unit Oss)

Page | 10
Doing maintenance following breakdown repair results in a lot of downtime, because if it is broken, it
has to be fixed before the production line can continue. One method to make sure that downtime is
minimized is preventive maintenance. In SU Oss they introduced autonomous maintenance (AM) at the
factories as the first step to total preventive maintenance.
At the moment, once a week a shift (8 hours) of autonomous maintenance (AM) is done, which consists
of cleaning, lubrication and inspection of the production lines. During this shift, there is no production.
By inspecting the production lines, breakdowns can be prevented and it becomes clearer when a new
spare is needed.
2.2. Current control/management As is the case in any type of system, there needs to be a reliable control policy for the operation of a
spare parts system. The choice of the control system depends on the complexity of the operating
scenario, the number of items that need to be controlled, the number of locations where inventory may
be housed, and the availability of timely information to support the inventory control policy (Frazelle,
2002).
The control over the TW is divided here into two types of control: personnel / stakeholders, and
ordering methods. The stakeholders are responsible for the functioning of the TW and the ordering
methods. First, the organizational charts are described so the locations of the TW and TD in the
organization are clear.
2.2.1. Organization In Figure 3 the composition of the management team (MT) of Unilever SU Oss is given. In this
management team, led by the works director, there are six different departments, from which one is
responsible for the production (Operations Manager). The managers of the six departments are
together with the works director the MT of SU Oss.
Figure 3: Organizational chart of SU Oss (source: Unilever Oss)
In Figure 4, the organizational chart of the operations part of SU Oss are given, which are managed by
team leaders. SSF and CFO both have three team leaders. One of the team leaders of SSF is responsible
Works Director
Technical & Implementation
Manager
Quality Assurance Manager
Operations Manager
HR FinanceCustomer Service
SHE

Page | 11
for fabrication of the soup/sauce and two for filling, heating and packaging. At the CFO, there are two
team leaders responsible for smoked pork sausages (SPS) and packaging, and one for mixing & blending
(M&B), raw material income (RMI) and FIONA (traditional sausage). Next to these six team leaders with
their own department, there is one site broad team leader, the head of the technical department (TD).
Figure 4: Organizational chart of Operations SU Oss (source: Unilever Oss)
The TW is part of the technical and implementation (T&I) manager’s functions and not directly
controlled by operations. As a ‘Make’ factory, production is leading for SU Oss, so the needs of the
operations part of the factory are important for the TW. The difference between low costs (technical
and implementation manager) and high service level (all operations parts) is the field of tension where
the TW has to work with.
2.2.2. Personnel / Stakeholders The 70 clients of the TW are divided into several stakeholders, which are described in a stakeholder
analysis. In this analysis, it becomes clear who influences the warehouse and who the main stakeholders
are. The two most influential actors in Figure 3 are the Technical & Implementation (T&I) Manager and
the Operations Manager. The T&I manager is responsible for the TW and the Operations manager is
responsible for the production lines, and is the boss of most of the stakeholders.
The Operations department consists of five production lines, which are influenced by the TW because of
the availability of the needed spare parts. The first operators of the production lines, the technical
planners, the technical operators (Toppers) and the technical department personnel are the persons
who have access to the warehouse and are among others responsible for the correctness of SAP.
Toppers are responsible for the specific part of the production line they are stationed at. Some of the
regular operators have received a technical training to become Toppers. They have more responsibilities
and a little ownership of their specific part of the production line. Ideally, the part of the line is
inspected continuously by the Topper and results in preventive maintenance and less breakdowns.
The technical department (TD) is the department that is responsible for the mechanics and repairing
machines and its spare parts. As mentioned in Section 1.7, this research focuses on the consumable
spares instead of repairable spares. Technical department personnel are the mechanics that are called
when a machine breaks down. Their task is to fix production lines, so the production can continue, and
to repair spare parts. Before repairing a spare part, it must be investigated if is technically possible and
economically profitable.
The Technical & Implementation (T&I) department is responsible for the TW. The maintenance manager
and the warehouse administrators are responsible for the daily management of the TW. The warehouse
Operations Manager
Fabricage S/S
Fill/Heat S/S SPSM&B, RMI, IP/FIONA
TD

Page | 12
administrators are responsible for the control of the warehouse, and the warehouse is managed by the
maintenance manager.
The Technical & Implementation Manager, who is the problem owner in this research, is as member of
the MT already represented, but as problem owner gets his own part in the stakeholder analysis.
Other stakeholders that are interviewed in this research are the department heads, the finance
department, and management team (MT), as they are important for SU Oss.
2.2.3. Stakeholder Analysis Before the interviews and their results are shown, the stakeholders are analysed. Initial consideration of
stakeholders is often done using a technique based on some kind of stakeholder grid or map of which
many versions exist. In this research, the “Power versus Interest grid” of Mendelow (1981) is used, as
both the power as the level of interest of the stakeholders shows which stakeholders are the most
important to involve in this project and which stakeholders can influence the success of the conclusions
and recommendations. The results of this method are shown in Table 2, and the elaborated analysis is
shown in Appendix 1.
Next to Table 2, the stakeholders are shown in Figure 5. In this figure, the powers between the
stakeholders are shown, so it is clear who is responsible and financially accountable.
High Management Team (MT)
Operations Manager
T&I Manager
Team leaders of the production lines
Maintenance manager
Power
Work preparer
Technical department personnel
TW administrators
Low First operator
Topper
Low Level of Interest High
Table 2: Power versus Interest grid of the stakeholder analysis (source: Mendelow (1991))
The relations between the stakeholders are presented in a map in Figure 5. This map displays three
different types of relations: hierarchical relations, representation relations, and control relations. In
addition, the map displays different kind of actors, i.e. internal and external actors for the TW.
The internal actors are the actors that are daily or weekly visitors of the TW and influence the
correctness of the warehouse. With correctness, the level of spares, the correct ordering methods, and
part of the cleanliness is meant.
The external actors are the actors that do not influence the correctness of the warehouse. These actors
are not directly responsible for the cleanliness, as they are just clients or are higher hierarchical levels.

Page | 13
Figure 5: Network of stakeholders and their control (source: Unilever SU Oss)
2.2.4. Ordering methods Next to the stakeholders and their influence on the technical warehouse, the current control can be
described by the method of ordering spares at the technical warehouse. The procurement of spare parts
in SU Oss consists of two different ways of ordering. One of the two methods is done automatically and
uses a (r,q) model, while the other method is purely based on experience.
The first way in SU Oss is based on a continuous stochastic model, which Winston (2003) describes as
(r,q). In a (r,q) system, r is the reorder point, which is triggered when the stock level drops below r, and
at that moment, the reorder quantity q is ordered. In SAP, the r and q can be used, so the system
automatically orders q, when r is reached. Because of this, no control over these types of orders is
needed and it is ideal for low cost items and fast movers. These items are called “Z6”.
Fast movers are the spares that are used more than once per month and therefore easier to forecast.
Next to the Z6 items, there are items called “ND”, which are all other spare parts. If a spare is a ND item,
they are ordered by the experience of the warehouse administrators, technical planners and TD.
At SU Oss, the Z6 items have an r and a q. The r and q of all the cheap items are chosen based on the
order time, experiences of the supplier and historical data.
Page | 14
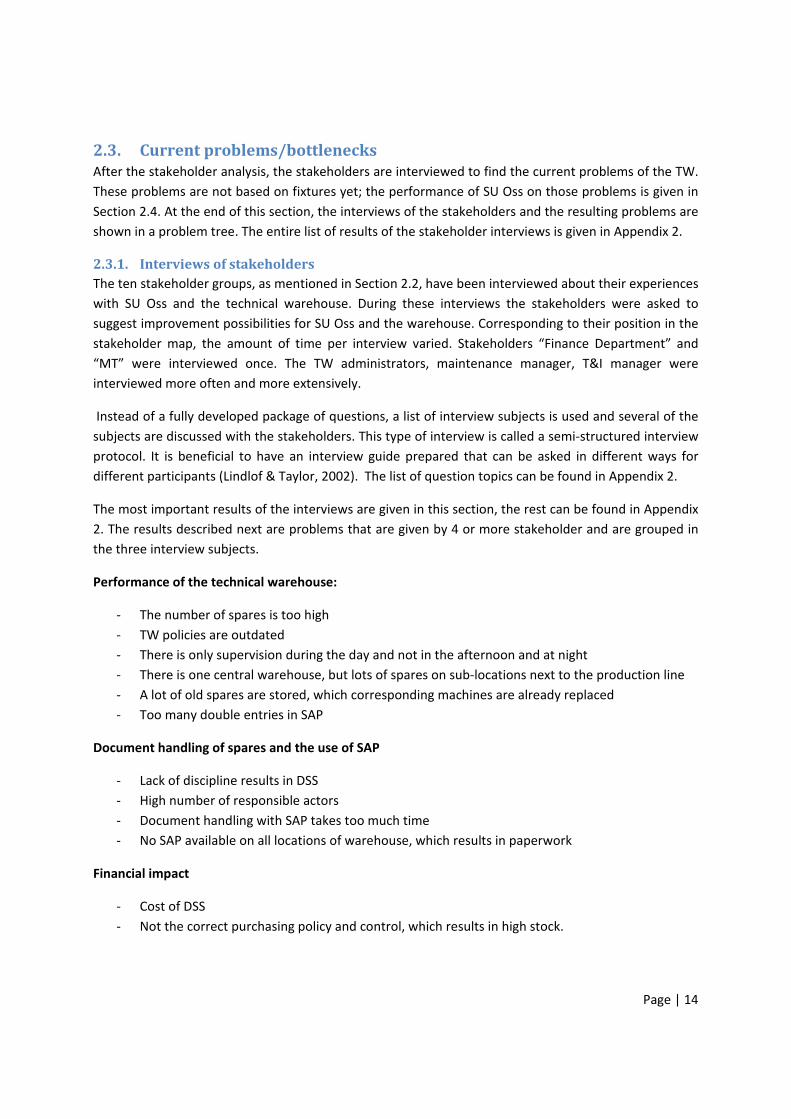
2.3. Current problems/bottlenecks After the stakeholder analysis, the stakeholders are interviewed to find the current problems of the TW.
These problems are not based on fixtures yet; the performance of SU Oss on those problems is given in
Section 2.4. At the end of this section, the interviews of the stakeholders and the resulting problems are
shown in a problem tree. The entire list of results of the stakeholder interviews is given in Appendix 2.
2.3.1. Interviews of stakeholders The ten stakeholder groups, as mentioned in Section 2.2, have been interviewed about their experiences
with SU Oss and the technical warehouse. During these interviews the stakeholders were asked to
suggest improvement possibilities for SU Oss and the warehouse. Corresponding to their position in the
stakeholder map, the amount of time per interview varied. Stakeholders “Finance Department” and
“MT” were interviewed once. The TW administrators, maintenance manager, T&I manager were
interviewed more often and more extensively.
Instead of a fully developed package of questions, a list of interview subjects is used and several of the
subjects are discussed with the stakeholders. This type of interview is called a semi‐structured interview
protocol. It is beneficial to have an interview guide prepared that can be asked in different ways for
different participants (Lindlof & Taylor, 2002). The list of question topics can be found in Appendix 2.
The most important results of the interviews are given in this section, the rest can be found in Appendix
2. The results described next are problems that are given by 4 or more stakeholder and are grouped in
the three interview subjects.
Performance of the technical warehouse:
‐ The number of spares is too high
‐ TW policies are outdated
‐ There is only supervision during the day and not in the afternoon and at night
‐ There is one central warehouse, but lots of spares on sub‐locations next to the production line
‐ A lot of old spares are stored, which corresponding machines are already replaced
‐ Too many double entries in SAP
Document handling of spares and the use of SAP
‐ Lack of discipline results in DSS
‐ High number of responsible actors
‐ Document handling with SAP takes too much time
‐ No SAP available on all locations of warehouse, which results in paperwork
Financial impact
‐ Cost of DSS
‐ Not the correct purchasing policy and control, which results in high stock.

Page | 15
2.3.2. Problem Tree The TW problems given by the stakeholder interviews are used for the problem tree given in this
section. This tree is used to give a clear view of the problems and the causes of these problems. The
starting points of the problem tree are “low service level” and “too many spares in TW”. The most
important goal for the TW of the Operation Manager is a high service level and the most important goal
for the Technical & Implementation Manager is to have low costs. All the points in the problem trees will
be briefly introduced.
The first main problem is the service level, which is too low according to the problem owners. This is
caused by the number of times that a spare is not in stock, the difficulty to find a spare part, and
because improving the service level is sometimes considered to be too expensive. The number of times
a spare is not in stock is mainly caused by DSS. According to all the stakeholders, it happens too often
that SAP tells them that there are spares in stock, and that the inventory level is zero or at least lower
than the number SAP shows. DSS are caused by not having the correct organization and structure.
The second problem is that spares are hard to find. Next to the warehouse, there are several storage
locations next to the production line, and sometimes the spare is not on the correct location or not even
labelled. This all decreases the traceability of the spares. This problem is caused by not having the
correct organization and structure.
The third and last problems is that improving the service level is too expensive. For example, if the
service level of a warehouse is 99%, it may be more expensive to improve it to 100% than improving
from 50% to 51%. These figures are normally used in service level agreements when outsourcing, hence
they are not applicable to the core problem at the TW.
Two of the three previous problems are caused by not having the correct organization and structure,
which has six causes.
1. Too many problems with documentation; the problems with documentation are a lack of
discipline, a lack of training, and difficult reporting procedure.
2. TW is too widely spread; The number of little storage locations next to the production lines
without supervision and the different storage locations within the warehouse decrease the
traceability of the spares and the supervision possibilities.
3. Lack of supervision at night and afternoon; the lack of supervision at night and in the
afternoon, and the number of old and superfluous spares make it hard to find the spares. The
warehouse administrators are busy with helping people with their spares and 24 hour control
would decrease the number of DSS and improve the service level of the TW.
4. Unorganized warehouse; one of the main causes of having a hard time to find a spare is that the
warehouse is unorganized or the cleanliness of the warehouse is too low. Too many spares in
the TW have no label or are not on the correct location, which decreases the traceability of the
spares.

Page | 16
Figure 6: Problem tree with as starting point 'too many spares in TW' and 'service level is too low', and the core problem and the right hand side problems shown in grey boxes (source: Unilever SU Oss)

Page | 17
5. Too many new spares; purchasing of new machines, where in this process, the current
machines are not used for this decision, results in a high number of new spares. Next to that,
the number of double entries in SAP is too high, which means that some spares have two SAP
codes, because they are added again after a new machine was bought.
6. Too many different spares; the last cause of not having to correct organization and structure is
the amount of different spares, which is caused by the amount of production lines and machines
at this moment, and old machine parts which spares are not removed from the TW. The number
of lines will not decrease during this project, but old spares could be removed.
The second main problem according to the problem owners is that the number of spares in the TW is
too high. The two main reasons for these problems are the incorrect purchasing policies, and not having
the correct organization and structure.
The incorrect purchasing policies are caused by the current control. The current purchasing control, as
mentioned in Section 2.2, is divided in regular spares handling and expensive spares handling. The
replenishment of both types is not done correctly for all stock keeping units (SKUs) according to most
stakeholders.
Conclusion of the problem tree
As can be seen in the problem tree, there is one core problem and one sub problem. The incorrect
inventory control is a sub problem for the TW and is discussed briefly, but the main focus of this report
is on the organization and structure of the warehouse, which is the core problem.
1. Organization and structure of the TW
Several of the points from the problem trees are influenced by the organization and/or structure of the
TW. If people cannot find parts in the warehouse this is because of the fact that the warehouse is widely
spread, but also because it is not well organized, and sometimes even a mess.
The control and supervision of the warehouse is also a part of this problem, as a lack of supervision
could lead to DSS. Another factor for DSS is discipline, which is investigated at the first question, but the
organization and structure of the warehouse can help with creating or maintaining discipline.
Old and deteriorated spares should be avoided by correct policies for purchasing spares, but also by
making policies when a spare is old and tossing away the unneeded spares in a cleanup.
Cleaning up the warehouse will lead to a decrease in number of spares and therefore the holding cost,
which are calculated in the next section. As mentioned by the warehouse administrators and the others
who visit the warehouse regularly, the number of old spares is too high.
2. Incorrect inventory control
As mentioned before, the incorrect inventory control is discussed briefly. After the organization and
structure is tackled and the solutions are implemented, the inventory control policies can be

Page | 18
implemented. Therefore, the incorrect inventory control is not the core problem and the two causes are
not used for the literature review and the alternatives in Chapter 3.
2.4. Current performance In this section, the current performance of the technical warehouse and the production lines of SU Oss
are described. The performance is measured with several key performance indicators (KPIs) that are
given in Section 2.3: DSS, level of service of the TW, and TW related costs.
These three performance indicators are also used in Chapter 4, the analysis, where the possible
solutions are measured on those points. The most important performance indicators, which are used for
the conclusion and recommendations, are the level of service of the technical warehouse versus the
costs of the systems. Before these performance indicators are checked by literature and in a stakeholder
analysis, they are used to describe the current performance of Unilever SU Oss and its technical
warehouse.
2.4.1. Critical and non critical differences between stock and system (CDSS and DSS) Differences between the number of spares physically in stock and the number of spares in stock
according to SAP are undesirable. The number of DSS and their value should be calculated to find out
the impact of these situations. According to the warehouse administrators 20 to 25% of the document
handling of spares is not properly done and lead to DSS. Incorrect document handling includes
forgetting to document the spares that are taken out of the warehouse and incomplete handling by not
filling in all parts of the document.
The number of critical DSS is hard to determine, because they are not documented by the warehouse. In
this research, only the number of DSS is used, as they are documented in SAP. In Table 3, the number of
DSS per quarter in 2010, 2011 and 2012 is shown. There is no pattern in the number of DSS in the last
years, but it is clear that the number of DSS is a problem if compared with the total amount of spares
that is taken from the warehouse, which were 10.000 in 2011. This means that in 2011, 14.6% of the
items taken out of the warehouse were DSS.
2010 2011 2012
1st Quarter 467 256 637
2nd Quarter 371 342 Unknown
3rd Quarter 314 706 Unknown
4th Quarter 965 156 Unknown
Total 2117 1460 637Table 3: Number of DSS at SU Oss per quarter in 2010, 2011 and the first quartile of 2012 (source: Unilever Sirius S1P)
In Table 4, the value of the DSS is shown. The value of DSS is calculated by summing the prices of all
spares which have DSS. The cost of DSS in 2012 is the amount of DSS between 1‐1‐2012 and 1‐4‐2012.

Page | 19
Year Cost of DSS (in Euro)
2010 250.000
2011 200.000
2012 (January – March) 80.400Table 4: Cost of DSS at SU Oss in 2010, 2011 and the first quartile of 2012 (source: Unilever Sirius S1P)
2.4.2. Level of service of the TW The level of service of the technical warehouse can be specified by its service level. There are three
service level definitions: S1, S2, and S3 (Axsäter, 2006) (Silver et al., 1998).
S1 = probability of no stock out per order cycle,
S2 = "fill rate"‐ fraction of demand that can be satisfied immediately from stock on hand.
S3 = "ready rate"‐ fraction of time with positive stock on hand.
This thesis defines the service level of SU Oss as its fill rate, as it is important that the demand
immediately can be satisfied by the spares on stock according to the stakeholders of ‘Operations’.
Possible actions that decrease the fill rate are DSS, out‐of‐stocks and wrongly placed items. The
calculation of the fill rate for SU Oss is hard, as shortages are not documented. The shortages that are
the most important for this research, the DSS, are known and therefore used for the service level of the
TW of SU Oss. The formula of fill rate: 1
100%
In Table 5, the fill rate of the TW in 2011 is given.
Number of DSS in 2011: 1.460
Items taken from the warehouse: 10.000
Level of service in 2011: 85.4%Table 5: Fill rate of the TW in 2011 (source: Unilever Sirius S1P)
2.4.3. Costs of the technical warehouse The costs of the technical warehouse are divided in the holding costs, the cost of control and the
number of superfluous and old spares and their costs. This section starts with the value of the spares, as
it influences the holding costs.
o Value of the spare parts in the TW
In Table 6, the amount of spares in the warehouse and the value of those spares are shown. The value of
a spare part is equal to the purchased price and no depreciation is done. Total value of the stock is one
of the most important criteria for this research. The T&I Manager and the maintenance manager both
want this amount reduced.
Number of unique spares in stock 12.500
Total amount of spares in stock 207.000
Total value of spares in stock € 3.650.000Table 6: Amount of spares in TW and the costs of those spares (source: Unilever Sirius S1P)

Page | 20
o Holding costs of the TW
The relevant costs that should be considered when determining optimal stock levels consists of holding
costs and ordering costs according to Drury (2007). Holding costs are seen as a percentage of the total
value of the spare parts and usually consists of the following:
1. Opportunity cost of investment in stocks
2. Incremental insurance costs
3. Incremental warehouse and storage costs
4. Incremental material handling costs
5. Costs of obsoletes and deterioration of stocks (Drury, 2007)
The percentage suggested by Lambert and Stock (1993) is between 12% and 34%, depending on the
industry field. According to Winston (2003), the capital opportunity cost hd is 20% of the value of
inventory. Combining the 20% of Winston (2003) with 5% for insurance, warehouse, handling and
obsolescence costs (Drury, 2007), results in a holding cost of 25%, which is used in this report.
Concluding, the holding costs for the TW of SU Oss are 900.000 Euro per year.
o Cost of control of the warehouse
Cost of control of the warehouse is the costs of the TW personnel. The control of the warehouse is done
by 2 warehouse administrators, who are at the warehouse between 07:30 and 16:00 hours. In these
hours, the first operators, Toppers and TD can come with questions and problems, but after 16:00 hours
and before 07:30 hours there is no real control over the warehouse.
According to the warehouse administrators and its clients, the number incorrectly documented spares is
higher when the TW administrators are not around. The control of the warehouse is taken into account
for the possible spare parts inventory systems and because around the clock control is than possible, it is
good to take the costs of the warehouse administrators into account, which is 50.000 euro per FTE per
year. Concluding, the cost of control of the warehouse is 100.000 Euros per year.
o Superfluous and old spares
The number of superfluous spares is calculated by adding four types of items:
The portion of ND items, which are in the warehouse for over a year and have more than 1
spare on stock. The time limit of 1 year is chosen by the maintenance manager, so these spares
are very slow movers.
Not needed spares are the spares which belong to machine which are no longer used in SU Oss.
Spares with a too high inventory level are the SKUs with an inventory level higher than the
demand in a multiple of the lead time for ordering the spare.
For example, if the demand for a spare part is 10 per month and the lead time is 2 weeks (0,5 month)
and the inventory level is 100 spares, than there is 100/10 – lead time = 10 – 0,5 – 9,5 months of
inventory available, which is a waste of space and opportunity costs.

Page | 21
The number of old spares is calculated by adding the number of spares that are in stock for over
3 years, so the items that haven’t been used in 2010 and 2011. This number of years is chosen
because of the change of ERP system in 2009, and therefore the information is not reliable in
the years before 2010.
Concluding, the precise number of superfluous and old spares is unknown, but is estimated on at least
500.000 Euro. The cost for SU Oss per year is unclear, but it results in too many spares and possible DSS.
2.5. Summary of the chapter In this chapter, the answer to the first research question was searched.
What is the current system for the inventory management of the spare parts warehouse?
The technical warehouse of Unilever SU Oss is a single‐site model with a central warehouse and several
sub‐locations for spares that are not controlled by the warehouse. The number of unique spares in the
warehouse is 12.500 and the total value of the inventory of the TW is 3.6 million Euros, which leads to a
holding cost of about 900.000 Euro (excl. personnel). The total number of spares in the warehouse is
over 200.000. The number of old and superfluous spares in unknown, but the estimated value of those
spares is 500.000 Euro.
The core problem of the warehouse is not having the correct organization and structure, which leads
to DSS and therefore decreases the service level.
A lack of discipline and a difficult reporting procedure is one of the causes of DSS, which is the biggest
difficulty in the TW’s operations. The inventory of the TW is too widely spread throughout the
warehouse, which leads to difficulties in finding the spares for the clients. 70 clients can enter the
warehouse and take spares, and after they take spares they are all responsible for the document
handling of the spares. Because this is not done correctly by everyone, a lot of DSS occur. The number of
DSS in 2011 is 1.460. This among other factors resulted in a fill rate of 84.5 %.
This could be because of a lack of supervision in two of the three shifts, as the warehouse is supervised
by two TW administrators who are only at the TW during the day (07:30 hour – 16:00 hour). The rest of
the day the TW is unsupervised.
In addition, the organization and structure of the warehouse lack clarity, which makes it hard to identify
new and different spare parts.
Last, the inventory control of the SKUs is investigated. Incorrect inventory control could lead to high
number of spares in the warehouse and a lot of superfluous spares. Alternatives for the organization
and structure of the warehouse are investigated in Chapter 3.

Page | 22
3. Alternatives In this chapter, the search for alternatives for the spare parts inventory system for Unilever SU Oss is
described, which is based on the second and third research question.
2. Which systems are available in literature for managing spare parts in production companies?
3. Which systems are used by other production companies in the Netherlands and at other Unilever
sites with comparable complexity?
The search for the solutions is done in two ways; answering the second research question by doing a
literature research (§3.1) and answering the third research question by visiting similar companies and
investigating their technical warehouse policies (§3.2).
After both researches are done, an overview of the alternatives is made (§3.3), which are used for the
analysis in Chapter 4. The answers to the two research questions that are investigated in this chapter
are given in Section 3.4, which is the conclusion of this chapter.
3.1. Literature research In this section, the literature research is done, which answers the second research question: Which
systems are available in literature for managing spare parts in production companies?
The literature review follows an explicit and systematic methodology, starting with the used databases
or journals, than the search terms, followed by the selection and prioritization of criteria. The total
review is shown in Appendix 3. The literature review is divided in three subjects, the problems of Section
2.3: discipline and documentation, organization and structure of the TW, and inventory control.
3.1.1. Discipline and documentation Two reasons of DSS are discussed in this section: problems with documentation and problems with
discipline. The third reason according to the problem tree “too many spares have no label” is discussed
in Section 3.1.2.
The problems of SU Oss with DSS are some of the most common problems with documentation
according to Kelly (2006). He describes five major problems. Several of those problems can be used to
describe the problems of SU Oss and are used in this section. DSS occur because somebody takes parts
out without booking, which can be because of the lack of a warehouse administrator overnight or the
open stores policy. Booking spares can be made easier with the use bar‐code readings or RFID (Kelly,
2006).
The second group of problems is because of the use of an ERP system. According to an extensive
research by Deloitte (1999), the main reasons for unsuccessful use of an ERP system are:
Lack of Discipline
Lack of Change Management
Inadequate Training
Poor Reporting Procedures (Deloitte, 1999)

Page | 23
These four problems are the main problems with DSS in SU Oss and are investigated in this section. At
the end of this section there is a conclusion of the methods and/or ideas that can be used for Unilever
SU Oss.
3.1.1.1. Discipline The main reason for DSS is the lack of discipline to handle the booking of a spare correctly. Lack of
discipline and other change management issues are the largest barriers to successful ‘second wave’
implementation of ERP, like supply chain management and inventories. ‘Second wave’ is the process of
achieving additional benefits from an ERP implementation (Hawking et al., 2004).
Motivation is one of the indicators of discipline, as a motivated worker has more chance to do a
disciplined job. Worker motivation can be divided in the three categories of Frederick W. Taylor (1911):
1. The “carrot”. System in which workers would get paid a lower basis rate and through rewards
could get a higher reward for their work.
2. The “stick”. Punishment for not doing the job properly. This can result in discharging or fines.
3. Factory ethos. Factory ethos is the ‘us’ feeling that workers and management can have.
The incentives for work are strategic actions of a company. Decisions on an incentives policy have to be
made by management and the height of those incentives is not discussed in this research.
Another way to create discipline in the technical warehouse is by using one of the philosophies that is
used in the rest of the sourcing unit: 5S, which is the fundament of TPM (Sugimori et al., 1977). The
English expression for 5S is CAN DO, of cleanliness, arrangement, neatness, discipline, and order
(Willmott & McCarthy, 2001). The idea of discipline is here “to pass on that discipline and order to your
colleagues so that we all strive for a dust‐free and dirt‐free plant” (Willmott & McCarthy, 2001). An
explanation of TPM, 5S and the use of discipline is given in Section 3.1.3.
Concluding, using incentives and TPM can decrease the discipline ‘problems’ at SU Oss.
3.1.1.2. Training and communication Effective communication is a major issue throughout the plant according to Umble (2003). In the
implementation of Baan, an ERP system that he describes, most employees felt that the Baan system
has great potential, but many found it necessary, or convenient, to go around the system. This caused a
“domino effect” of poor information flows throughout the entire company.
Additional training is commonly identified as a significant need across the organization. According to
Bingi et al. (1999) additional training is one of the important success factors of implementation, but the
lack of change management is nearly an equal problem. The report of Deloitte (1999) also acknowledges
this problem, that implementation cannot be done on a Big Bang way, but has to be implemented in
steps (Deloitte, 1999) (Bingi et al., 1999).
Another common complaint at Baan was that the process of finding needed information was too time
consuming. As a result, many users had developed numerous effective, but often inefficient,

Page | 24
“workarounds” for problems they encountered. Another common complaint was “the system will not do
that” which usually translates to “I do not know how to do that within the system” (Umble, 2003).
Concluding, training has to be done after the implementation and not only during the implementation of
a new system. For Unilever SU Oss, workarounds are also done according to the maintenance manager
and the TW administrators, where the training for the use of SAP occurs only at the beginning of the use
of SAP for every user. Showing regularly how it is done and other trainings can be of added value.
3.1.1.3. Reporting Procedures Automatic Identification Technologies Documentation of spares has to be done to know that a spare is taken from the warehouse and to know
who has taken it. This is particularly important for the budgets of the team leaders, also because all DSS
are divided amongst them. The current reporting procedure can very easily be affected by a lack of
discipline, as it is a task that is not part of the basic activities. Other ways to handle the documentation
of spares are discussed in this section, bar codes and RFID. Kanban is another method, but is discussed
in Section 3.1.2 under “Push vs. Pull”.
Bar Codes
A bar code system includes a bar code symbology to represent a series of alphanumeric characters, bar
code readers to interpret the bar code symbology, and bar code printers to reliably and accurately print
bar codes on labels, cartons, and/or picking/shipping documents (Frazelle, 2002). When a barcode
system is implemented, barcodes are put on the containers of the spares or their place on the shelf.
When a client needs a spare, he takes a barcode scanner and scans the barcode on the shelf. On this
way, the documentation becomes a lot quicker than the current procedure, which will result in a decline
of DSS.
Radio Frequency Identification (RFID)
Radio frequency tags encode data on a chip encased in a tag. When a tag is within range of a special
antenna, the chip is decoded and read by a tag reader. Many types of RFID exist, but at the highest
level, RFID devices can be divided into two classes: active and passive. Active tags require a power
source—they’re either connected to a powered infrastructure or use energy stored in an integrated
battery. Passive RFID is of interest because the tags don’t require batteries or maintenance. The tags
also have an indefinite operational life and are small enough to fit into a practical adhesive label (Want,
2006).
Next to the advantages of RFID, there are three main issues that are holding back RFID’s widespread
adoption, of which the first is cost. Most companies that sell RFID tags do not quote prices because
pricing is based on volume, whether the tag is active or passive and much more. Generally speaking,
active tags are $25 and up. A passive chip costs from 7 to 15 U.S. Dollar cents. If the tag is embedded in
a thermal transfer label on which companies can print a bar code, the price rises to 15 cents and up.
Low‐ and high‐frequency tags tend to cost a little more (RFID Journal, 2012). The others disadvantages
are design and acceptance, where acceptance is a privacy issue (Want, 2006).
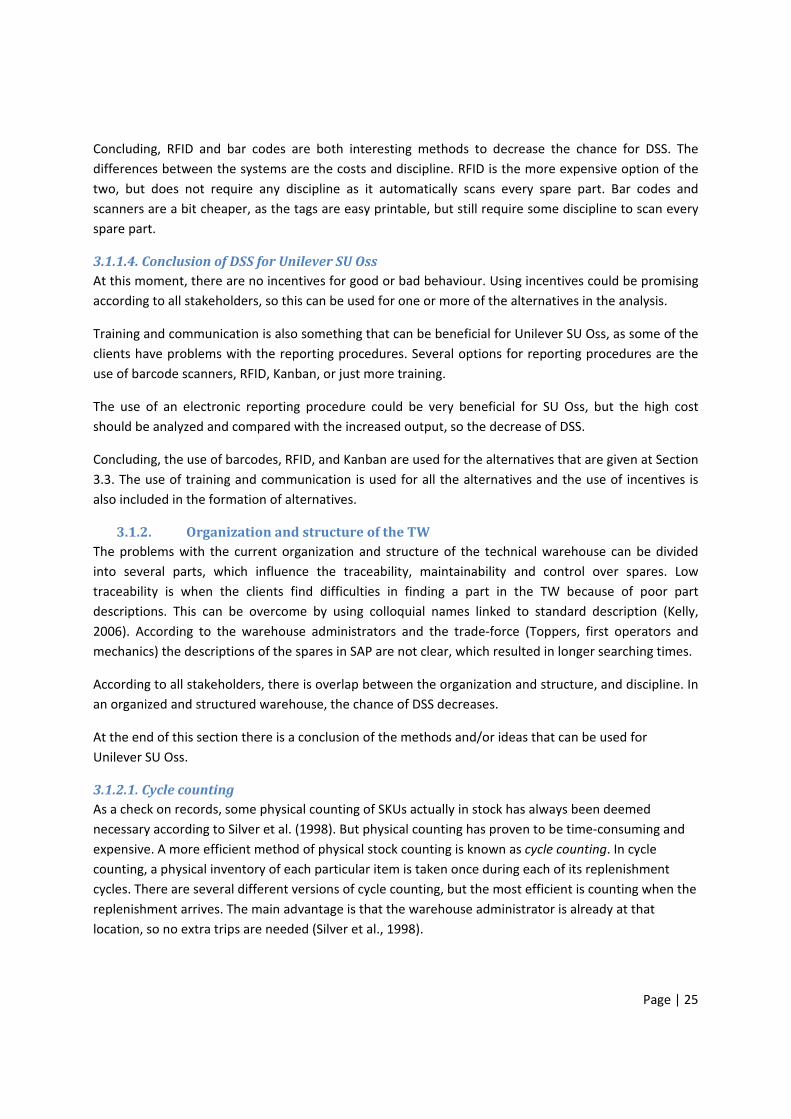
Page | 25
Concluding, RFID and bar codes are both interesting methods to decrease the chance for DSS. The
differences between the systems are the costs and discipline. RFID is the more expensive option of the
two, but does not require any discipline as it automatically scans every spare part. Bar codes and
scanners are a bit cheaper, as the tags are easy printable, but still require some discipline to scan every
spare part.
3.1.1.4. Conclusion of DSS for Unilever SU Oss At this moment, there are no incentives for good or bad behaviour. Using incentives could be promising
according to all stakeholders, so this can be used for one or more of the alternatives in the analysis.
Training and communication is also something that can be beneficial for Unilever SU Oss, as some of the
clients have problems with the reporting procedures. Several options for reporting procedures are the
use of barcode scanners, RFID, Kanban, or just more training.
The use of an electronic reporting procedure could be very beneficial for SU Oss, but the high cost
should be analyzed and compared with the increased output, so the decrease of DSS.
Concluding, the use of barcodes, RFID, and Kanban are used for the alternatives that are given at Section
3.3. The use of training and communication is used for all the alternatives and the use of incentives is
also included in the formation of alternatives.
3.1.2. Organization and structure of the TW The problems with the current organization and structure of the technical warehouse can be divided
into several parts, which influence the traceability, maintainability and control over spares. Low
traceability is when the clients find difficulties in finding a part in the TW because of poor part
descriptions. This can be overcome by using colloquial names linked to standard description (Kelly,
2006). According to the warehouse administrators and the trade‐force (Toppers, first operators and
mechanics) the descriptions of the spares in SAP are not clear, which resulted in longer searching times.
According to all stakeholders, there is overlap between the organization and structure, and discipline. In
an organized and structured warehouse, the chance of DSS decreases.
At the end of this section there is a conclusion of the methods and/or ideas that can be used for
Unilever SU Oss.
3.1.2.1. Cycle counting As a check on records, some physical counting of SKUs actually in stock has always been deemed
necessary according to Silver et al. (1998). But physical counting has proven to be time‐consuming and
expensive. A more efficient method of physical stock counting is known as cycle counting. In cycle
counting, a physical inventory of each particular item is taken once during each of its replenishment
cycles. There are several different versions of cycle counting, but the most efficient is counting when the
replenishment arrives. The main advantage is that the warehouse administrator is already at that
location, so no extra trips are needed (Silver et al., 1998).

Page | 26
Concluded, cycle counting has to be included in the main jobs of the warehouse administrators. A total
physical count of the entire warehouse can be done once or twice per year for baseline measurement,
but daily counting keeps the warehouse better up‐to‐date and DSS can be detected before they become
critical DSS.
3.1.2.2. Deterioration / old parts One of the problems Kelly (2006) shows in his book is deterioration. Products and spares deteriorate
and become useless for the production, but the extra problem is that they are still in the warehouse. If a
spare deteriorates, the production line is removed or a better spare has become available on the market
and the old spare has to be removed from the warehouse.
Deterioration should be documented by storing the spares on a first‐in‐first‐out (FIFO) base and to add
expiration dates on the spares. This would decrease the number of stock outs because of deteriorated
spares and therefore decreases downtime.
Old parts should be removed if they are not used for several years and are not vital to the organization.
The number of years to use in this case is to be filled in personally and several options are discussed in
the analysis (Roy & Guin, 1999) (Devnani et al., 2010).
3.1.2.3. Magpieing problem The next problem is the “magpieing problem”, which results in setting up of unofficial stores. The
magpieing problem is the result of the negative image of the warehouse and the number of DSS. When
someone of the trade‐force enters the warehouse to find a certain spare, other spares are withdrawn to
hold in their own ‘unofficial stores’. Some of these spares are not booked and result in DSS, but
withdrawing spares when they are not needed also influences the demand figures (Kelly, 2006).
The best way to prevent the rise of unofficial stores is to have a reliable warehouse. Another method is
to control the unofficial stores and make them ‘official’ by having decentral storage locations. Having
decentral warehouses has its advantages, but if the travel time decreases with less than 10 minutes, it is
not beneficial and the amount of paperwork outweighs them.
Concluded, the magpieing problem will decline if the warehouse becomes more reliable.
3.1.2.4. Supervision / Control One of the parts that is important for organization and structure, and also for DSS, is supervision and
control. The supervision and control of the warehouse and its spares can be divided into two obvious
parts: supervision and control. The supervision of the warehouse is displayed as the number of
warehouse administrators that are present during working hours, which is 2 at the moment.
According to them and several other stakeholders, the number of DSS that are created during the
presents of the warehouse administrators is lower than when they are not present, so total supervision
could decrease the number of DSS. The problem with total supervision, 3 teams of administrators, is
that it is expensive and does not solve the root of the problem, as clients are still responsible for the
documentation.

Page | 27
The only possible solution is to make the four‐wall inventory management only part of the administrator
jobs. Four‐wall inventory management is the management of inventory within the four walls of a
warehouse or distribution centre, the picking, counting and booking of the spares (Frazelle, 2002).
In this solution, the control over the spares is done by the administrators. The control can be done by
methods that are already described: RFID, barcode and scanners, Kanban systems, and cycle counting.
3.1.2.5. Total Productive Maintenance One of the main problems of the organization and structure of the TW is the lack of discipline and the
lack of cleanliness of the warehouse. At the moment, the TW is seen as an auxiliary function of the
production lines and gets easily neglected. One of the possibilities to increase the cleanliness of the TW
and the discipline is total productive maintenance (TPM).
TPM is a kind of physical check up and preventive medicine for equipment. Plant equipment life can be
prolonged by preventing equipment failure beforehand (Chan et al, 2005). The ultimate goal regarding
equipment and production is being free of breakdowns and defective production. Together, these
activities are generally called ‘‘productive maintenance’’ (Nakajima, 1986).
Nakajima (1986) established five pillars for the application of TPM:
1. Adopt improvement activities designed to increase the overall equipment effectiveness by
attacking the six losses.
2. Improve existing planned and predictive maintenance systems.
3. Establish a level of self‐maintenance and cleaning carried out by highly trained operators.
4. Increase the skills and motivation of clients by individual and group development.
5. Initiate maintenance prevention techniques (early equipment management).
One of the first and crucial steps towards asset care comes from the application of 5S. Problems cannot
be clearly seen when the work place is unorganized. Cleaning and organizing the workplace helps the
team to uncover problems. Making problems visible is the first step of improvement.
Seiri (organization) is the practice of dividing needed and unneeded items and removing the unneeded
ones. It also means integrating material flow with the best known operational methods. Unneeded
items are defective products, not useful items, and not urgent objects.
Seiton (orderliness) means orderly storage, putting things in the right place. Those things can then easily
be found, taken out and used again when they are needed. The locations of equipment, tooling and
materials are clearly defined, displayed and maintained.
Seiso (cleaning) refers to cleaning the workplace regularly, to make work easier and to maintain a clean
and safe workplace.
Seiketsu (cleanliness) means being aware of the need for maintaining a clean workplace, not just
through cleaning programs but through ensuring that spillage of liquids and dropping of materials,
packaging, etc. is avoided.
Page | 28
Shitsuke (discipline) means to formalize and practice the above items continuously each day as you
work, to have the discipline to always work to these principles. The initial plant clear and clean process is
described as follows:
Clear out
1. Zone the plant into clear geographical areas with clear management responsibility.
2. Carry out a first‐cut physical run for items that can be immediately thrown away.
3. Carry out a second label and sticker run, which needs to be more structured and thoughtful.
4. Get a great many waste disposal containers are needed.
5. Paint clear walkways and clear markings on the floor for anything mobile. Correct racking,
shadow boards, labelling and other visual storage aids form an important part of this stage.
6. Keep the workplace organization under a permanent microscope.
Clean Up
7. Do the obvious sweeping and vacuuming of the work area.
8. Inspect and clean every square centimetre of the equipment.
9. Identify the points of accelerated deterioration.
10. Get to the root causes of dust, dirt and scattering and eliminate those reasons. An dust‐free
plant will be achieved if‐ and only if‐ this step is achieved.
11. Revisit steps 1 to 10 and continuously improve. (Willmott & McCarthy, 2001)
Concluding, the use of TPM is done in several areas in Unilever SU Oss, both not yet in the technical
warehouse, which would be relevant. A clean and clear TW is beneficial, the task of the ‘clients’ are
easier and the lack of discipline reduces.
3.1.2.6. KPIs and visibility When the equipment has been cleaned, the next phase of the TPM process is to draw attention to the
right way of doing things by clear visual aids (Willmott & McCarthy, 2001). Some examples of visual
marking to encourage ease of inspection, discipline, order and tidiness are as follows:
‐ Make walking paths with line indicators
‐ Indicate the maximum and minimum number of spares per container. If a ‘client’ sees that the
spare level is below the minimum or above the maximum, he can report it.
‐ Indicate which spares are in a container by putting a photograph on the container.
‐ Display charts of the performance of the TW.
o Total value of the spares in the TW.
o Number of DSS per month.
o Number of old spares, which haven’t been used for 3 years.
‐ Make a location where unidentified spares can be stored for a short while.
Concluding, the use of KPIs is beneficial for the TW and will increase the discipline and attention for the
TW and its performances.
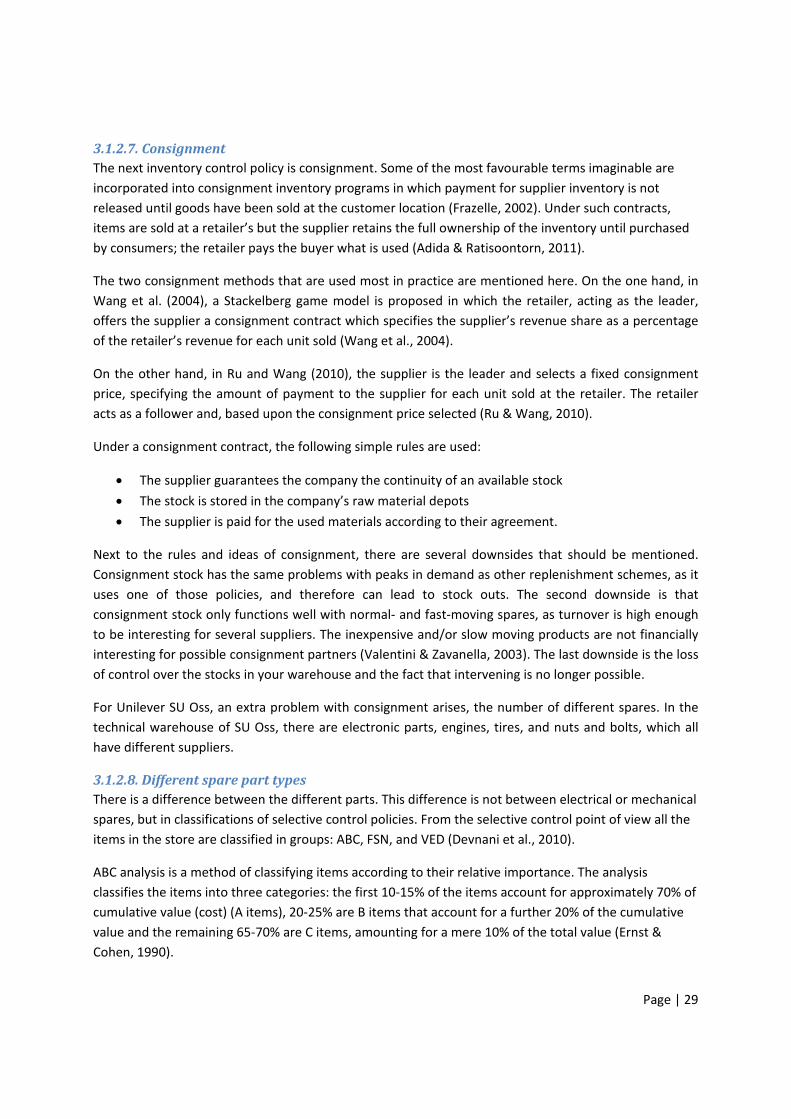
Page | 29
3.1.2.7. Consignment The next inventory control policy is consignment. Some of the most favourable terms imaginable are
incorporated into consignment inventory programs in which payment for supplier inventory is not
released until goods have been sold at the customer location (Frazelle, 2002). Under such contracts,
items are sold at a retailer’s but the supplier retains the full ownership of the inventory until purchased
by consumers; the retailer pays the buyer what is used (Adida & Ratisoontorn, 2011).
The two consignment methods that are used most in practice are mentioned here. On the one hand, in
Wang et al. (2004), a Stackelberg game model is proposed in which the retailer, acting as the leader,
offers the supplier a consignment contract which specifies the supplier’s revenue share as a percentage
of the retailer’s revenue for each unit sold (Wang et al., 2004).
On the other hand, in Ru and Wang (2010), the supplier is the leader and selects a fixed consignment
price, specifying the amount of payment to the supplier for each unit sold at the retailer. The retailer
acts as a follower and, based upon the consignment price selected (Ru & Wang, 2010).
Under a consignment contract, the following simple rules are used:
The supplier guarantees the company the continuity of an available stock
The stock is stored in the company’s raw material depots
The supplier is paid for the used materials according to their agreement.
Next to the rules and ideas of consignment, there are several downsides that should be mentioned.
Consignment stock has the same problems with peaks in demand as other replenishment schemes, as it
uses one of those policies, and therefore can lead to stock outs. The second downside is that
consignment stock only functions well with normal‐ and fast‐moving spares, as turnover is high enough
to be interesting for several suppliers. The inexpensive and/or slow moving products are not financially
interesting for possible consignment partners (Valentini & Zavanella, 2003). The last downside is the loss
of control over the stocks in your warehouse and the fact that intervening is no longer possible.
For Unilever SU Oss, an extra problem with consignment arises, the number of different spares. In the
technical warehouse of SU Oss, there are electronic parts, engines, tires, and nuts and bolts, which all
have different suppliers.
3.1.2.8. Different spare part types There is a difference between the different parts. This difference is not between electrical or mechanical
spares, but in classifications of selective control policies. From the selective control point of view all the
items in the store are classified in groups: ABC, FSN, and VED (Devnani et al., 2010).
ABC analysis is a method of classifying items according to their relative importance. The analysis
classifies the items into three categories: the first 10‐15% of the items account for approximately 70% of
cumulative value (cost) (A items), 20‐25% are B items that account for a further 20% of the cumulative
value and the remaining 65‐70% are C items, amounting for a mere 10% of the total value (Ernst &
Cohen, 1990).

Page | 30
FSN (Fast, Slow, and the Non‐moving) grouping is based on the movement of materials or their rates of
consumption. An item is said to have made one move if it is picked from the warehouse once or more in
a month. According to this rule if the material has made 12 moves in the last 24 months then it is a fast
moving item or else it is slow moving. If the material has not moved at all in five years then it is treated
as a non‐moving item. Maximum attention is paid to the fast moving (Roy & Guin, 1999).
VED (vital, essential and desirable) grouping is based on the criticality of the item. Maximum control is
exercised on the vital few than on the trivial many (Devnani et al., 2010).
Concluding, the use of different spare part types for storing, ordering can be very beneficial. Several
different approaches per spare type are shown in Appendix 4.
3.1.2.9. Conclusion of organization and structure for Unilever SU Oss The organization and structure of the TW of Unilever SU Oss should improve to make the warehouse
better accessible and decreases the chance of DSS. The use of yearly counting, removing useless and old
parts, showing KPIs, and the first steps of 5S should be used at SU Oss.
When these ideas are implemented at the TW, magpieing behaviour will decrease and the traceability of
the spares will increase. Also maintaining the TW with regard to discipline will be easier, as the
warehouse will be easier to control and maintain when it is organized.
The use of daily counting, total supervision, different spare part types and the rest of the possibilities of
TPM are used in the alternatives in the analysis or in the recommendations. The possibility of
consignment is also used for the analysis, as mentioned in the scope of this research.
An organized and structured TW results in less DSS and frustrations, so therefore some steps have to be
taken in SU Oss.
3.2. Comparing companies For the comparison between Unilever SU Oss and several other technical warehouses in real life, three
technical warehouses are visited at other companies. The following companies are visited: Unilever SU
Rotterdam, Heineken Den Bosch, and Johma Losser and were selected after answering these two sub
questions:
1. What kind of company is Unilever Sourcing Unit Oss?
2. Which sectors are comparable with SU Oss?
The answers to those questions are given in Appendix 6, and in Appendix 7 the interview questions for
visiting the other technical warehouses are given. Next, the three companies that are visited are briefly
described, the situation of the TW as well as the type of company, and after that the literature methods
are tested at those companies.

Page | 31
Johma
Johma Salades B.V. produces and markets spreadable salads in the Netherlands. The company was
founded in 1968 and is based in Losser, the Netherlands. Johma Salades B.V. operates as a subsidiary of
Johma Nederland B.V.
The technical warehouse of Johma is controlled by 1 person, who was responsible for the changes of the
last years. The total value of the spares was around 1 million 10 years ago and is now reduced with 60%.
The number of SKUs is 6.500 and all spares are labelled and barcodes are used for the document
handling of the spares.
In the value of the spares, the values of the machines are excluded. All machines have each one spare on
stock and the total value of all machine spares is around 100 thousands Euros.
Heineken
Heineken N.V. engages in brewing and selling beer. It offers beer, cider, soft drinks, and other
beverages. The company provides its products through distributors and breweries under several brands.
Heineken N.V. sells its products through a network of distributors, as well as through 140 breweries in
approximately 71 countries worldwide. The company was founded in 1864 and is headquartered in
Amsterdam, the Netherlands. Heineken N.V. is a subsidiary of Heineken Holding N.V.
The technical warehouse of Heineken is larger than those of Unilever SU Oss and Johma Losser, with 4.0
million Euros of spares and 13.000 different spares. There are three persons responsible for the
technical warehouse, which is open only during the day, and is open for cardholders. When entering the
warehouse, there are four barcodes scanners, which are used for the document handling of the spares.
The use of TPM and the KPIs of the warehouse are visible and shown clearly. The number of old spares,
superfluous spares, DSS and service level are shown at the entrance of the warehouse and they use a
Japanese garden for the unknown spares. In this garden, items are put on a designated location, where
they stay for at most a month. After this month, the spares are removed from the warehouse.
Unilever SU Rotterdam
Unilever SU Rotterdam is the margarine factory of Unilever in Rotterdam, as mentioned in the
introduction. Next to margarine, they make peanut butter.
The technical warehouse is in value and numbers a little smaller than the warehouse of Unilever SU Oss,
which is mainly because of the renovation of the warehouse. With clearer documentation and photos of
the spares on their locations, the spares are easier to find. Next to that, there are minimum and
maximum values shown on the location, so DSS can be reported.
The documentation is done by the two warehouse administrators, who collect all the documents of
spares taken from the warehouse, instead of all the clients. At certain moments in the day, the
documents are processed in SAP, so the MRP system can run optimally overnight. This is a unique
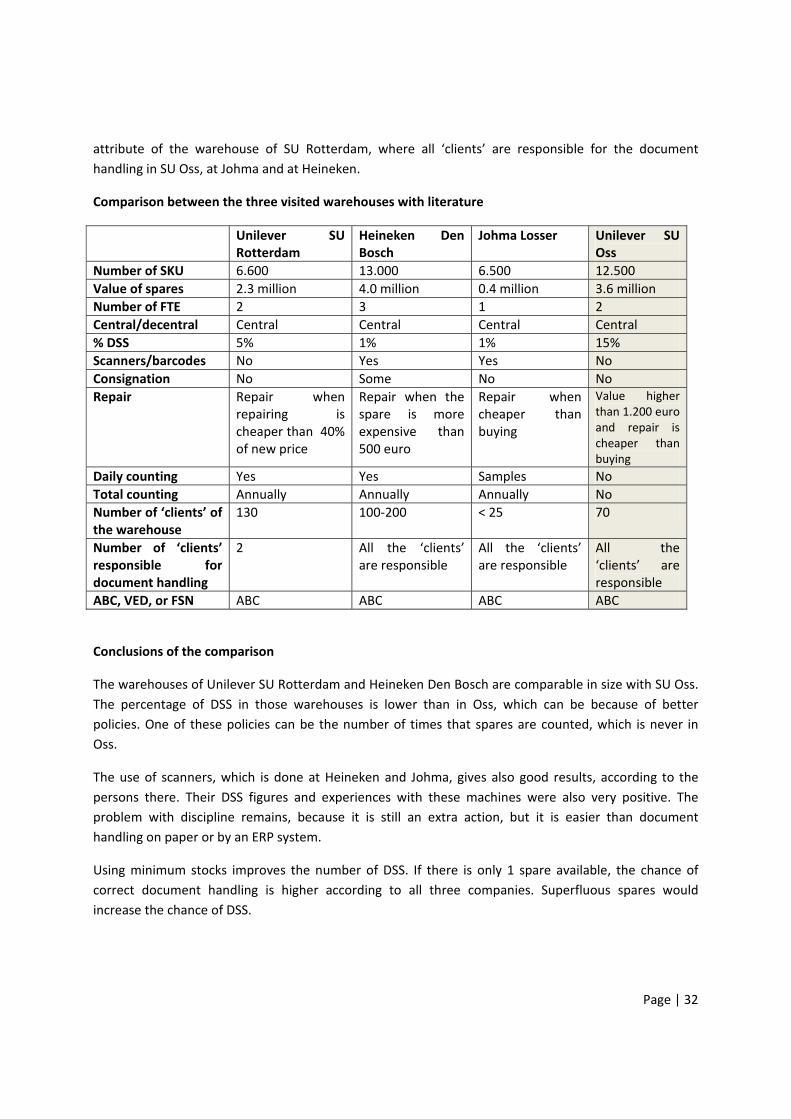
Page | 32
attribute of the warehouse of SU Rotterdam, where all ‘clients’ are responsible for the document
handling in SU Oss, at Johma and at Heineken.
Comparison between the three visited warehouses with literature
Unilever SU Rotterdam
Heineken Den Bosch
Johma Losser Unilever SU Oss
Number of SKU 6.600 13.000 6.500 12.500
Value of spares 2.3 million 4.0 million 0.4 million 3.6 million
Number of FTE 2 3 1 2
Central/decentral Central Central Central Central
% DSS 5% 1% 1% 15%
Scanners/barcodes No Yes Yes No
Consignation No Some No No
Repair Repair when repairing is cheaper than 40% of new price
Repair when the spare is more expensive than 500 euro
Repair when cheaper than buying
Value higher than 1.200 euro and repair is cheaper than buying
Daily counting Yes Yes Samples No
Total counting Annually Annually Annually No
Number of ‘clients’ of the warehouse
130 100‐200 < 25 70
Number of ‘clients’ responsible for document handling
2 All the ‘clients’ are responsible
All the ‘clients’ are responsible
All the ‘clients’ are responsible
ABC, VED, or FSN ABC ABC ABC ABC
Conclusions of the comparison
The warehouses of Unilever SU Rotterdam and Heineken Den Bosch are comparable in size with SU Oss.
The percentage of DSS in those warehouses is lower than in Oss, which can be because of better
policies. One of these policies can be the number of times that spares are counted, which is never in
Oss.
The use of scanners, which is done at Heineken and Johma, gives also good results, according to the
persons there. Their DSS figures and experiences with these machines were also very positive. The
problem with discipline remains, because it is still an extra action, but it is easier than document
handling on paper or by an ERP system.
Using minimum stocks improves the number of DSS. If there is only 1 spare available, the chance of
correct document handling is higher according to all three companies. Superfluous spares would
increase the chance of DSS.

Page | 33
Having a clean and clear office for the technical warehouse administrators and a clean and clear
warehouse increases the chance that it stays clean. The use of TPM can help and the Japanese garden of
Heineken gives good results, but is expensive because of depreciation.
Concluding, the three warehouses score better on DSS than SU Oss, which can have several reasons. The
use of barcodes, cycle counting, and TPM are already discussed in Section 3.1 and are used for the
alternatives as they already provide good results at other warehouses. Also consignment is used for the
alternatives, while the use of consignment was not done or a success at the other warehouse.
3.3. Alternatives for Unilever SU Oss In this section, the alternatives for the TW of Unilever SU Oss are given. In the previous section, several
methods are described, some of which are beneficial for the TW of SU Oss. Before showing the
alternatives, the methods that are used for each alternative are given. These methods are always
beneficial and are a good starting point for the implementation process.
3.3.1. First implementation steps ‐ First two S’s of 5S
o Seiri (organization): remove the unneeded spares, deteriorated, not useful and not
vital/essential spares
o Seiton (orderliness): order the spares, put them in the right place and label the spares
‐ Cycle counting: zero‐count of the spares to get to know the real amount of spares in the TW.
‐ Use of KPIs: To create awareness and increase discipline, the KPIs of the TW must be displayed.
After a first shift of organizing and ordering the warehouse, 150.000 Euros worth of spares is thrown
away after cleaning only 1 of the 5 production lines. Using it on all five can exceed the 500.000 Euros.
The next steps for the implementation steps are depending on the chosen alternative. The first
‘alternative’ is the current situation, which is already described in Chapter 2.
3.3.2. The six alternatives
Alternative 1: Current Plus
As mentioned in Chapter 2, the current situation involves a technical warehouse which is controlled by 2
warehouse administrators. The current number of different spares is 12.500 and the total value of those
spares is 3.6 million Euros. The 1500 DSS every year result in a fill rate of 85%.
In this alternative, the first steps of the implementation plan have already been started, as mentioned
before. Cleaning, organizing, the use of KPIs and annual counting all the spares are the steps that are
done no matter which alternative is chosen.

Page | 34
Alternative 2: Total supervision
In this alternative, the warehouse is controlled by 2 technical warehouse administrators 24 hours a day
and the spares are removed from the warehouse only by those 2 administrators. The number of DSS will
drop to around 0, because discipline problems are lower for the TW administrators. The disadvantage of
this alternative is the increased cost for supervision, as 8 FTE is needed.
The number of shifts per week becomes 20, as there are 3 shifts per day of the week, 3 on Saturday, and
2 shifts on every Sunday. At this moment, there are 2 FTE for 5 shifts per week, and if all 20 shifts per
week are planned, than 20/5 = 4 teams of 2 FTE are needed, which results in the 8 FTE mentioned
before.
Alternative 3: Consignment
In this alternative, there are two possibilities or sub‐alternatives: a) total outsourcing and b) some
consignment stocks. The number of suppliers to outsource the spares to is one of the important factors
of these alternatives.
a) Total outsourcing; Total outsourcing is outsourcing all the spares to one single supplier. This
supplier, preferably one of the largest suppliers, has to handle all the spares and maintain the
stock levels. A service level should be agreed on beforehand, so the supplier can adjust the
replenishment system.
b) Some consignment; Instead of total outsourcing, some consignment could also be done. The
largest suppliers can be used to outsource all their spares to, this way the supplier knows all the
spares and can start with the current replenishment system and adjust it to his wishes. In this
alternative, several suppliers are used for outsourcing spares.
The alternative that is chosen for the analysis in this research is total outsourcing of all spares. The
control remains at SU Oss and the 2 FTE that are now, so the warehouse administrators keep their job.
The problem owners and the other stakeholders of SU Oss have no faith in partial consignment, because
the warehouse becomes more complicated when that happens.
Alternative 4: Barcodes
With the use of barcodes and scanners, handling the documentation of the spares becomes easier, so
fewer mistakes are made. Clients still need to have the discipline to use the barcode scanners, but it is
easier and the explanations can be put on the wall, so less training is necessary. At Heineken and Johma
this has resulted in a lower number of problems with discipline.
Alternative 5: RFID
The use of RFID takes care of the discipline problem. If a client walks out the warehouse, the system
automatically decreases the inventory level of that spare, so DSS will not occur. The costs of the RFID
system are higher than those of barcodes and scanners, and higher than in the current situation.

Page | 35
Alternative 6: Kanban
Next to the automatic identification technologies, the possibility of using Kanban cards is an alternative.
This can be done as a back‐up, as is done at Johma, at certain product types only, or for every part. At
Johma, there is a Kanban card in every container, which is tossed in the ‘order container’ which is
emptied every day.
3.3.3. First implementation steps for all alternatives Next to the first implementation steps and the implementation steps that arise from the chosen
alternatives, there are a couple of implementation steps that are taken to complete the implementation
plan. These parts are briefly described here to make clear why they are not used in the analysis.
‐ Replenishment scheme
Using the correct replenishment scheme to reach optimal storage levels is beneficial to the TW of SU
Oss, but it is not relevant at this moment. The lack of a good organization and structure of the TW and
the number of DSS this results in, is more important at the moment. When the organization and
structure of the TW are improved, the correct replenishment scheme can be applied. This is described in
the implementation plan in Chapter 5.
‐ Use of incentives
The use of incentives can be beneficial for increasing the discipline of the clients of the TW of SU Oss,
but is something that has to be implemented on the entire site for optimal implementation results. The
use of incentives can have both positive as negative results, so has to be carefully implemented and this
is discussed in the implementation plan in Chapter 5.
3.4. Conclusion In this chapter, the answers to the second and third research question are given.
2. Which systems are available in literature for managing spare parts in production companies?
The literature research results in several options for improving the organization and structure of the
technical warehouse and for declining the number of DSS. The use of incentives, using a carrot and/or
stick, training and communication, barcodes, RFID, and Kanban are the solutions for discipline and
documentation at the technical warehouse.
The solutions for the organization and structure are cycle counting, removing old spare parts, the
magpieing problem, supervision, TPM, KPIs and visibility, SKU categories and consignment. All these
solutions are used for the alternatives and for the list of questions of the company visits.

Page | 36
3. Which systems are used by other production companies in the Netherlands and at other Unilever
sites with comparable complexity?
Next to the literature research, three other technical warehouses are visited in the Netherlands.
Unilever SU Rotterdam, Heineken Den Bosch, and Johma Losser are the locations that are visited and
interviewed for the use of systems, which are described in the literature.
The conclusion is that the other warehouses perform a lot better on the number of DSS and this can be
because the use of barcodes and scanners, the use of less people responsible for the documentation, or
the cleanliness of the warehouses. Usage of TPM and KPI boards give also good results for those
warehouses.
Combining the answers of question two and three, results in six alternatives for managing the spare
parts in technical warehouses: Current Plus, Total Sup, Consignment, RFID, Barcodes, and Kanban. The
main differences between the systems are the documentation method and other methods that
decrease the chance of DSS. These six alternatives are compared to find the ideal solution or the ‘To Be’
situation, which is done in Chapter 4.

Page | 37
4. Analysis In this chapter, the alternatives given in Section 3.3 are used to determine the ideal situation for the TW
of SU Oss. Before this ideal situation can be found, the fourth research question is answered.
4. What are the criteria that are needed for scoring the solutions?
The approach to answer this question is divided in four parts, the criteria needed for the analysis (§4.1),
the method used for the analysis (§4.2), the scores of the analysis (§4.3), and the determination of the
ideal situation (§4.4). At the end of this chapter, the conclusion is given in Section 4.5, in which the final
answer to the fourth research question is given.
4.1. Criteria In this section, the criteria for the analysis are given. To determine these criteria, the ten causes of
“Organization and structure” of the problem tree of Section 2.3 are used, as well as the results from
Chapter 3. The alternatives for the core problem, having not the optimal organization and structure for
the TW, are scored on their input and output, which is used for grouping the criteria. The input criteria
are the criteria which influence the cost of implementing an alternative at SU Oss and the output criteria
are those that influence the chance of DSS, which is the result of the core problem.
4.1.1. Input: Costs The costs of implementing an alternative can be divided in several cost factors, and can be summed at
the end, so the total input needed when choosing an alternative is clear for decision making.
Six cost factors are investigated: holding costs, ordering costs, administrators FTE, purchasing costs,
implementation costs, and costs of training and education. Two of these factors are not used in the
analysis; which are holding costs and ordering costs. The holding costs of an alternative are influenced
by the total value of the spares in the TW. For this research, it is not possible to find the exact value of
the TW after implementing one of the alternatives. Expected values are also unclear, and all alternatives
will decrease the total value mostly by the first implementation steps of Section 3.3, so no big
differences are made by adding holding costs.
The other factor that is not included in the analysis is the ordering costs. Every day at least one truck
arrives at the TW of SU Oss, so extra ordering and ordering in higher numbers, will not change the costs
of making orders. This factor is therefore also excluded.
The four cost factors that are included are explained one‐by‐one and the corresponding values are
shown after each section. In some of the factors, the costs will be zero, which does not mean that there
are no costs. In such a case, there are no extra costs compared with the current situation.
In Section 4.4, the total costs of the alternatives and the output values of Section 4.3 are used for an
efficient frontier. The graph used for this frontier shows the input versus the output for all the
alternatives, and the best alternatives are used for the efficient frontier.

Page | 38
1. Costs of warehouse administrators
The cost of warehouse administrators is the number of warehouse administrators that are needed in the
solution multiplied by the costs per administrator. As mentioned in Section 3.3.2, the number of
warehouse administrators in the ‘total sup’ alternative is 8. The other alternatives use the 2 warehouse
administrators that are currently available. At consignment, using 2 administrators is chosen instead of
outsourcing the personnel. This is done because of the expertise of the current warehouse
administrators and the extra costs outsourcing the warehouse administrators would result in. Their
expertise is important for SU Oss because the high number of questions the administrators get every
day. Therefore, the costs of warehouse administrators are 400.000 Euro for ‘total sup’ and 100.000 Euro
for the other alternatives.
2. Purchasing cost factor
The purchasing cost factor is the factor by which the order cost for consignment increases. If the spares
in the TW are outsourced, suppliers will ask for a price which is higher than the current price, because of
their increased risk, and the lack of experience with a lot of spares. According to the Technical &
Implementation manager, the maintenance manager and the TW administrators of SU Oss and the
other warehouses, this factor will be around 10%. The total cost of ordering spares per year is on
average 1.000.000 Euro. In Table 10, only the extra costs for purchasing are shown.
3. Annual cost and fixed implementation cost at the beginning
The alternatives have different implementation costs, which are divided in the yearly cost and the fixed
cost at the beginning.
Fixed cost at the beginning
The fixed cost of implementation is the cost of the implementation at the start of the project. The fixed
cost of Consignment and Current Plus are zero, as there is no need for an investment. For Kanban,
barcodes, RFID, and total supervision, investments are needed. Kanban cards are not very expensive and
with an estimated cost of 0,50 Euro per card, the cost at the beginning of the implementation would be
12.500 Euro. The number of SKU is 12.500 and 2 cards per SKU are needed for the use of Kanban.
Barcodes and RFID are more expensive, as both hardware and software are required for usage.
According to Serac, a company which sells barcode scanners, the hardware costs of a scanner would be
around 3.000 Euro and the software costs around 350 Euro per scanner (Serac, 2012). This price per
scanner is comparable with the 6.000 Euro that Johma Losser paid for their two hand scanners and
software.
The fixed costs at the beginning for RFID are harder to estimate, as there are multiple possibilities for
RFID readers. The system that is used in this alternative is the use of RFID gates, which are gates that can
be found at airports or libraries. According to RFID journal (2012), the cost of a RFID gate is around
21.500 Euro. The fixed software cost would be equal to the hardware cost (RFID Journal, 2012).
According to the Galecia Group, the hardware cost is around 15.000 Euro and the software costs would
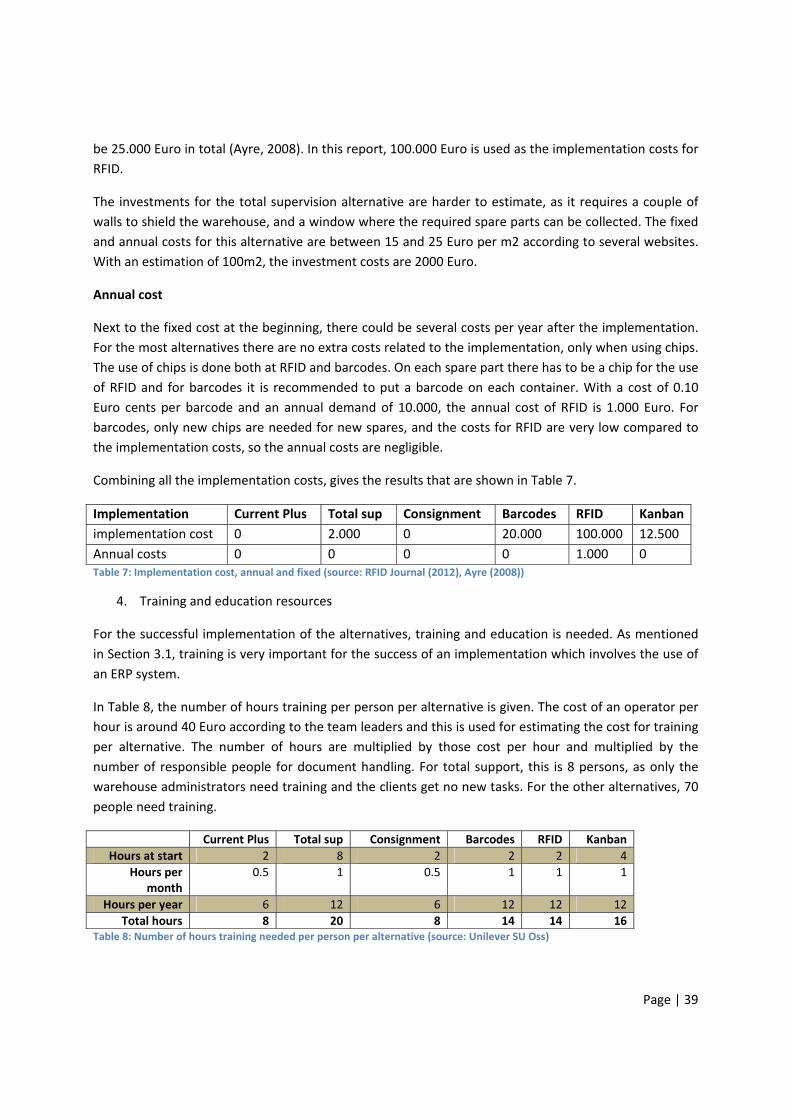
Page | 39
be 25.000 Euro in total (Ayre, 2008). In this report, 100.000 Euro is used as the implementation costs for
RFID.
The investments for the total supervision alternative are harder to estimate, as it requires a couple of
walls to shield the warehouse, and a window where the required spare parts can be collected. The fixed
and annual costs for this alternative are between 15 and 25 Euro per m2 according to several websites.
With an estimation of 100m2, the investment costs are 2000 Euro.
Annual cost
Next to the fixed cost at the beginning, there could be several costs per year after the implementation.
For the most alternatives there are no extra costs related to the implementation, only when using chips.
The use of chips is done both at RFID and barcodes. On each spare part there has to be a chip for the use
of RFID and for barcodes it is recommended to put a barcode on each container. With a cost of 0.10
Euro cents per barcode and an annual demand of 10.000, the annual cost of RFID is 1.000 Euro. For
barcodes, only new chips are needed for new spares, and the costs for RFID are very low compared to
the implementation costs, so the annual costs are negligible.
Combining all the implementation costs, gives the results that are shown in Table 7.
Implementation Current Plus Total sup Consignment Barcodes RFID Kanban
implementation cost 0 2.000 0 20.000 100.000 12.500
Annual costs 0 0 0 0 1.000 0 Table 7: Implementation cost, annual and fixed (source: RFID Journal (2012), Ayre (2008))
4. Training and education resources
For the successful implementation of the alternatives, training and education is needed. As mentioned
in Section 3.1, training is very important for the success of an implementation which involves the use of
an ERP system.
In Table 8, the number of hours training per person per alternative is given. The cost of an operator per
hour is around 40 Euro according to the team leaders and this is used for estimating the cost for training
per alternative. The number of hours are multiplied by those cost per hour and multiplied by the
number of responsible people for document handling. For total support, this is 8 persons, as only the
warehouse administrators need training and the clients get no new tasks. For the other alternatives, 70
people need training.
Current Plus Total sup Consignment Barcodes RFID Kanban
Hours at start 2 8 2 2 2 4
Hours per month
0.5 1 0.5 1 1 1
Hours per year 6 12 6 12 12 12
Total hours 8 20 8 14 14 16 Table 8: Number of hours training needed per person per alternative (source: Unilever SU Oss)
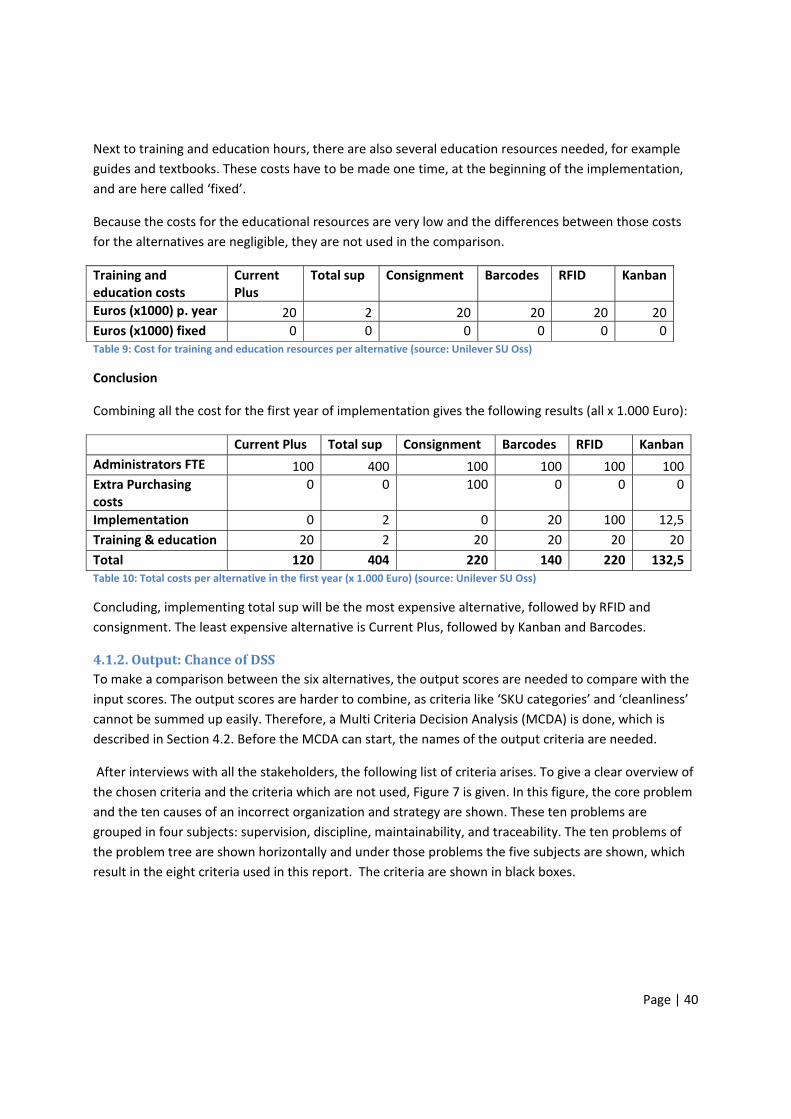
Page | 40
Next to training and education hours, there are also several education resources needed, for example
guides and textbooks. These costs have to be made one time, at the beginning of the implementation,
and are here called ‘fixed’.
Because the costs for the educational resources are very low and the differences between those costs
for the alternatives are negligible, they are not used in the comparison.
Training and education costs
Current Plus
Total sup Consignment Barcodes RFID Kanban
Euros (x1000) p. year 20 2 20 20 20 20
Euros (x1000) fixed 0 0 0 0 0 0Table 9: Cost for training and education resources per alternative (source: Unilever SU Oss)
Conclusion
Combining all the cost for the first year of implementation gives the following results (all x 1.000 Euro):
Current Plus Total sup Consignment Barcodes RFID Kanban
Administrators FTE 100 400 100 100 100 100
Extra Purchasing costs
0 0 100 0 0 0
Implementation 0 2 0 20 100 12,5
Training & education 20 2 20 20 20 20
Total 120 404 220 140 220 132,5Table 10: Total costs per alternative in the first year (x 1.000 Euro) (source: Unilever SU Oss)
Concluding, implementing total sup will be the most expensive alternative, followed by RFID and
consignment. The least expensive alternative is Current Plus, followed by Kanban and Barcodes.
4.1.2. Output: Chance of DSS To make a comparison between the six alternatives, the output scores are needed to compare with the
input scores. The output scores are harder to combine, as criteria like ‘SKU categories’ and ‘cleanliness’
cannot be summed up easily. Therefore, a Multi Criteria Decision Analysis (MCDA) is done, which is
described in Section 4.2. Before the MCDA can start, the names of the output criteria are needed.
After interviews with all the stakeholders, the following list of criteria arises. To give a clear overview of
the chosen criteria and the criteria which are not used, Figure 7 is given. In this figure, the core problem
and the ten causes of an incorrect organization and strategy are shown. These ten problems are
grouped in four subjects: supervision, discipline, maintainability, and traceability. The ten problems of
the problem tree are shown horizontally and under those problems the five subjects are shown, which
result in the eight criteria used in this report. The criteria are shown in black boxes.

Page | 41
Figure 7: The output criteria used in this report (source: Unilever SU Oss)
4.2. Method After finding the input criteria and their corresponding scores for the six alternatives, a different method
is used for scoring the output criteria. To determine the ideal situation or situations, the input and
output scores of the alternatives are compared in Section 4.4. Before this comparison can be done, the
method to find the output scores is described in this section.
To determine the scores for the output criteria for the technical warehouse of SU Oss, a Multiple Criteria
Decision Analysis (MCDA) is used. MCDA is an umbrella term to describe a collection of formal
approaches which seek to take explicit account of multiple criteria in helping individuals or groups
explore decisions that matter (Belton & Stewart, 2002). The purpose of an MCDA is to provide structure,
provide focus and language for discussion, to help to learn about the problem, complement and
challenges intuition, and assist in justification and communication.
MCDA methods are especially used when criteria cannot be summed as the input criteria can, as their
scores are not comparable. For example, 100 and 10 Euros can be summed up to 110 Euros, but “very
easy maintainable warehouse” and “not very innovative solution” are harder to sum.
A MCDA is used to make these types of output criteria comparable, so at the end a final output score
can be given. There are several different categories of MCDA, as is described in Appendix 8, and the
method that is used in this report is AHP (Analytic Hierarchy Process), which is described here briefly
and more in depth in Appendix 9.
AHP is a fully compensatory method, which means that a very bad score on one criterion does not have
to be crucial for the final score and can be compensated by good scores on the other criteria. The first
step that is important for the use of AHP is the decision makers, which are the ten stakeholder groups in
this research. These decision makers compare the alternatives on the criteria and tell if alternative A is
preferred over alternative B. This can be done by giving it different scores, between equally important
and very strongly important. For example, if coffee machine A makes very good coffee, and coffee
machine B makes not so good coffee, coffee machine A is preferred very strongly over coffee machine B

Page | 42
on the criterion taste of the coffee. The scores are combined by a mathematical method, which is shown
in Appendix 10. The next step, after finding the decision makers, is the weights of the criteria. Not all
criteria are equally important and the weights can be found on the same way as the scores of the
criteria. For example, the taste of the coffee from a coffee machine is very strongly preferred over the
colour of the coffee machine.
Combining the scores of the alternatives on the criteria with the weights of the criteria, makes it
possible to compare the alternatives, as the total output score per alternative are found. The use of this
method is used in the next section, which starts with the criteria used for finding the ideal situation for
the technical warehouse of Unilever SU Oss.
4.3. Output variables As mentioned in Section 4.1, the output of the alternatives is calculated by using several ‘output
criteria’. Finding the output scores of the alternatives is done by the AHP method as described in
Appendix 9 and is executed in several steps, 1) calculation of the weights and 2) the calculation of the
scores of the alternatives on the criteria. At the end of this section, the scores are shown and used for
finding the ideal situation in Section 4.4.
4.3.1. Calculation of the weights of the criteria In this section, the weights of the criteria are calculated in terms of 1,3,5,7, and 9, as mentioned in
Appendix 9. For the calculation of the weights, the interest of the stakeholders as mentioned in the
stakeholder analysis is used as the importance of the specific stakeholder. After determining the
importance of the stakeholders, all ten stakeholder groups are asked for their preferences, by giving
scores between 1 and 5, where 1 is very low and 5 is very high. At the end of this calculation, the total
scores per criterion are given, and the differences are used for Table 11. The entire calculation is given in
Appendix 11.
Because the scores are reciprocal, the score of alternative 2 compared to alternative 1 is 1 divided by
the score of alternative 1 compared to alternative 2. In example, if alternative 1 scores 3 on relative
relevance compared to alternative 2, than alternative 2 scores 1/3 on relative relevance compared to
alternative 1. Using stakeholder interviews and results from literature, the scores can be found in Table
11.
Weight SPP # SKUs Cleanliness
Number of Responsibles
SKU cat.
SAP compat. Counting
Innova‐ tiveness
SPP 1 3 3 5 5 3 3 7
# SKUs 1/3 1 1 3 3 1 1 5
Cleanliness 1/3 1 1 3 3 1 1 5
# Responsibles 1/5 1/3 1/3 1 1 1/3 1/3 3
SKU cat. 1/5 1/3 1/3 1 1 1/3 1/3 3
SAP compat. 1/3 1 1 3 3 1 1 5
Counting 1/3 1 1 3 3 1 1 5
Innovativeness 1/7 1/5 1/5 1/3 1/3 1/5 1/5 1 Table 11: Calculation of the weights: Relative relevance of the criteria (source: stakeholders Unilever SU Oss)

Page | 43
4.3.2. The weights of the criteria The weights of the eight attributes are calculated using the following two steps:
‐ Divide each number in a column of the pair wise comparison matrix by its column sum.
‐ Average each row of the normalized matrix. These row averages form the priority vector of
alternative preferences with respect to the particular criterion. The values in this vector sum to
1.
The calculation as described in the previous two steps is given in Appendix 11. Also the consistency
check is given in Appendix 11, and also the next consistency checks are given in that appendix. All scores
used in this report are consistent. The weights that are used are shown in Table 12.
Criteria SPP # SKUs Cleanliness # Responsibles
SKU cat. SAP compat.
Counting Innova‐ tiveness
Weight 0.32 0.14 0.14 0.05 0.05 0.14 0.14 0.03 Table 12: Weights of the criteria used in the analysis (source: Unilever SU Oss)
4.3.3. Calculation of the scores of the alternatives on the criteria The scores for the criteria are calculated in the same way as the weights, 1) find a way to compare the
alternatives on the criterion, 2) Calculate the relative importance of the alternatives on the criterion,
and 3) calculate the score on the criterion.
The calculation is done in 8 steps and finished with an overview of the results, in which becomes clear
which of the alternatives has the highest score.
4.3.3.1. Spare part procedure (SPP) The ‘spare part procedure’ is defined as the actions from searching the spare on SAP at the production
lines to the moment the documentation of the spare part is done after it leaves the warehouse. The
time of the spare part procedure is divided in three parts: walking in the TW, the average amount of
time spent with questions to the warehouse administrators, and the documentation procedure. In Table
13, these three pieces are calculated by measuring the times in minutes by stopwatch.
Current Plus Total sup Consignment Barcodes RFID Kanban
Walking in TW 5 2 5 3 2 5
Average minutes of questions
2 5 2 2 2 2
Documentation procedure
5 1 5 1 0 1
Total 12 8 12 6 4 8Table 13: Time of the alternatives on the spare part procedure in minutes (Unilever SU Oss)
Concluding, the use of RFID results in the shortest SPP and has therefore the best score on this criterion.
Because the first minutes extra will result in a higher chance of DSS, RFID is preferred weakly over
Barcodes, strongly above Total Sup and Kanban, and very strongly over Consignment and Current Plus.
Page | 44
4.3.3.2. Number of SKU in the TW The number of SKU in the TW is the chance of successful maintainability of the TW related to the
amount of spare parts. A lower number of SKU and spare parts will result in a more maintainable
warehouse and will increase the traceability of the spare parts for the clients.
The difference between the alternatives on this criterion is the amount of people that are responsible
for the warehouse, which is different than the number of people responsible for documentation. In the
current situation and in all alternatives besides ‘total sup’ and ‘consignment’ the amount of spares
decreases because of the cleaning actions as mentioned in Section 3.3. The amount of work that can be
done depends on the number of people that feel responsible for the warehouse.
In the total supervision and consignment alternative, the ‘clients’ of the warehouse will behave as
clients only and have no responsibility over the warehouse, so the cleaning actions and continuously
controlling the number of spares will be less successful.
Concluding, Current Plus, Barcodes, RFID, and Kanban, are preferred weakly over than Total Sup and
Consignment on this criterion.
4.3.3.3. Cleanliness of the TW Having a clean and clear TW increases the visibility in the TW and increases the traceability of the spares
in the TW. As the first steps of 5S are implemented for all the alternatives, the cleanliness of the TW is
around the same for all the alternatives. The only differences are for the total supervision and the
consignment alternatives. At consignment the ownership over the TW of the administrators and its
clients decreases and keeping the TW will be harder. At total supervision, the cleanliness will be
determined and maintained by the warehouse administrators, so because of this ownership, the TW will
be cleaner.
Concluding, Total sup is preferred weakly over Current Plus, RFID, Barcodes, and Kanban on this
criterion, and strongly over Consignment.
4.3.3.4. Number of people responsible for documentation Next to the number of people that are responsible for the warehouse and the ownership of the clients,
the number of people responsible for documentation is the next criterion which involves the chance for
DSS. The number of people responsible for documentation is equal for all alternatives except the ‘total
sup’ alternative. In this alternative, the warehouse administrators are the only persons who are
responsible for the documentation.
In RFID, there are a lot of clients responsible for the documentation, but they do not have to handle the
documentation themselves, the RFID gates handle that. However, the clients still have to use a pass to
show who they are, or have a badge on them which is visible for the gates, and both methods have a
possibility for foul play. Therefore, RFID scores equal to the other alternatives.
Concluding, Total sup is preferred weakly over all other alternatives on this criterion.

Page | 45
4.3.3.5. SKU category At this moment, the spares and their locations are organized based on an ABC category. As mentioned in
Section 3.1.3.6, using only ABC has several disadvantages.
Total supervision uses FSN, where the fast moving spares are closest to the location of the desk where
the clients stand. This method has, as also mentioned in Section 3.1.3.6, several disadvantages.
The disadvantages of ABC and FSN can be prevented by using a combination of ABC, VED, and FSN. This
is done in the alternatives ‘barcodes’, ‘RFID’, and ‘Kanban’. Because these combinations can look at vital
and fast moving spares for example, they can have proper strategies for both types and score a little
better on this sub criterion. The use of different SKU categories cannot be controlled at the consignment
alternative, which is not preferable for the controllability of the alternative.
Some of the possibilities of combinations are shown in Table 14.
Combination Explanation Action and location
AF‐ (very) fast moving spares or fast expensive spares
Close to the entrance of the TW
CV‐ / NV‐ / SV‐ Vital spares who move (very) slowly
Have at least one on stock, but not close to the entrance of the TW
CD‐ / DN‐/ CN‐ Items who are almost never used and not vital for the organization
Finding other spare parts for the function of the specific part, or place not close to the entrance of the TW
Table 14: Possibilities with combinations of SKU categories (source: Unilever SU Oss)
Concluding, RFID, Barcodes, and Kanban are preferred weakly over Current Plus and Total sup, and
strongly over Consignment on this criterion.
4.3.3.6. Compatibility with SAP Next to the number of people responsible for document handling, the compatibility with SAP is
important for the controllability of the TW. Mistakes with documentation can be caused by both points,
so making it easier will result in a decreased number of DSS.
The consignment alternative has the lowest compatibility with SAP as the use of documentation will be
done equally to the current situation. Current Plus and Kanban show little improvements for the
compatibility with SAP compared with the current situation, as the method of documentation and the
number of client do not improve, but the controllability is weakly more important at this criterion than
consignment.
The control when using RFID is very good, as automatic documentation is ideal for the control of spare
parts in the TW and the number of actions a client has to do is one, which is signing in to the system.
Consignment of the warehouse is less compatible with SAP as the lack of new ideas and changes will
result in less compatibility compared to the other alternatives.

Page | 46
Supervision is also very important for the compatibility, as the SAP usage is done with less persons and
persons with more rights in the system. Therefore, total supervision scores equal to RFID, while
barcodes score a bit less. The use of barcodes requires more steps in SAP by more persons, as the
documentation has several manual steps, so the score is not as good as the previous two alternatives.
Concluding, RFID and Total Sup are preferred weakly over Barcodes on this criterion, preferred strongly
over Current Plus and Kanban, and very strongly over Consignment.
4.3.3.7. Daily counting In all the alternatives, yearly counting is used. The results of this yearly counting are that at the
beginning of each (financial) year, there is a baseline measurement and the number of DSS is brought to
zero after that.
The use of daily counting is done at the total supervision, barcodes, RFID, and Kanban alternatives.
There are three ways of daily counting, which all lead to equal results.
1. Daily counting at MRP run
In this counting procedure, the warehouse administrators count the spares that have to be
ordered according to the MRP run, which runs overnight. With this procedure, the number of
spares ordered is correct and can be altered if necessary.
2. Daily counting of SKU that left the warehouse the previous day
In this counting procedure, the warehouse administrators count the count that left the
warehouse the previous day. With this procedure, the number of spares of the SKU that are
used is checked regularly.
3. Daily counting of the delivered SKU
In this counting procedure, the warehouse administrators count the spares of the SKUs that are
delivered during the day. The amount of spares that have to be counting is the lowest of the
procedures, but the orders cannot be altered beforehand.
Concluding, all the procedures have advantages and disadvantages. The main disadvantage is that the
spares that are taken from the containers that do not show on the MRP or picking lists are not counted
and DSS cannot be prevented. Counting according one of the three procedures and doing some extra
counting is the most beneficial to the maintainability, but is also the most time consuming.
So, Total Sup, Barcodes, RFID, and Kanban are preferred weakly over Current Plus and Consignment on
this criterion.
4.3.3.8. Innovativeness The innovativeness of the alternatives is determined by the innovativeness and the chance that other
warehouses will use this TW as their role model. The three visited warehouses were all innovative on
their own aspects and the people of SU Oss would visit them instead of the other way around. The

Page | 47
warehouse administrators of Unilever SU Rotterdam, Heineken Den Bosch, and Johma Losser were all
proud of their warehouse and this resulted in better performance of them and their clients.
The most innovative alternative is RFID as it is a relatively new way of organizing the warehouse. Next,
the use of consignment, barcodes and Kanban are innovative, as they are more innovative than the
current system. Less innovative than the current situation, which is equal in the Current Plus alternative,
is the use of total supervision, as it is the old way of organizing a warehouse.
Concluding, RFID is preferred weakly over Consignment, Barcodes, and Kanban on this criterion, strongly
preferred over Current Plus and very strongly over Total Sup.
4.3.3.9 Overview of the results The alternative with the best output is RFID, which is a result of the least time spent in the TW, the
compatibility with SAP and its innovativeness. RFID has no bad scores in Table 15, but is quite expensive,
as can be seen in Table 16. The cheapest alternative is Current Plus and Total Sup is the most expensive
alternative, because of the extra number of FTE.
Combining the relative importance interpretation values on all the criteria for the alternatives, gives the
results as shown in Table 15.
Criteria
Weight Current Plus
Total sup Consignment Barcodes RFID Kanban
SPP 0.32 0.05 0.11 0.05 0.24 0.45 0.11
Number of SKUs 0.14 0.21 0.07 0.07 0.21 0.21 0.21
Cleanliness 0.14 0.14 0.38 0.05 0.14 0.14 0.14
# People responsible 0.05 0.10 0.50 0.10 0.10 0.10 0.10
SKU category 0.05 0.10 0.10 0.04 0.26 0.26 0.26
SAP compatibility 0.14 0.07 0.33 0.03 0.16 0.33 0.07
Daily counting 0.14 0.07 0.21 0.07 0.21 0.21 0.21
Innovativeness 0.03 0.07 0.04 0.16 0.16 0.40 0.16
Total 0.094 0.204 0.058 0.199 0.299 0.146Table 15: Scores of the alternatives on the eight criteria (source: Unilever SU Oss)
4.4. Description of the ideal situation In this section, the ideal situation is described. For this description can be given, the input and output
scores of the alternatives are combined and an efficient frontier is given. The scores for this frontier are
shown in Table 16.
Current Plus Total sup Consignment Barcodes RFID Kanban
Input (x 1.000 Euro’s) 120 404 220 140 220 132.5
Output 0,094 0,204 0,058 0,199 0,299 0,146Table 16: Total costs per alternative (source: Unilever SU Oss)

Page | 48
In this section, the ideal situation is described. For this description, the input (costs) and output (chance
of DSS) variables are shown in Figure 8, which also shows the efficient frontier.
The efficient frontier, which shows the Pareto optimal solutions, includes four of the six alternatives. An
alternative is called Pareto optimal if no other feasible alternative is at least as good as the alternative
with respect to every objective and strictly better on at least one objective (Winston, 2003). In this
efficiency frontier, the objectives are input (costs) and output (chance of DSS) and the alternatives are
on that frontier when there is no cheaper and better solution.
Therefore, Consignment is outranked by Current Plus, as the last one gives a higher output for less input.
Total Sup is outranked by RFID, as it has a lower output and a higher input. Total Sup could be on the
efficiency frontier, but then 2 extra FTE instead of 6 should be used. This would not give the same good
output, so Total Sup is no option for SU Oss.
The options where the management of SU Oss can choose from are shown in Error! Reference source
not found., where the alternatives that are on the efficiency frontier are shown from the cheapest
alternative on the left to the most expensive alternative on the right.
Figure 8: Input vs. output variables of the alternatives with efficient frontier (source: Unilever SU Oss)
For determining the ideal situation, a sensitivity analysis is used and the four alternatives on the efficient
frontier are compared to find out if the extra output is worth the extra investment.
4.4.1. Sensitivity Analysis In this section, the scores of the alternatives are checked for robustness. The robustness of the scores is
found by changing the weights of the criteria and some of the factors that involve the scores of the
0
0,05
0,1
0,15
0,2
0,25
0,3
0,35
€ 1.000.000 € 1.100.000 € 1.200.000 € 1.300.000 € 1.400.000 € 1.500.000
Output
Input
Current +
Total sup
Consignment
Barcodes
RFID
Kanban

Page | 49
alternatives on specific criteria. For example, a check is done by how much the cost of one warehouse
administrator has to decline, so Total Sup becomes part of the efficient frontier.
Total sup
The most expensive alternative can become part of the efficient frontier if the costs of FTE decline from
400.000 euro to 216.000 euro. In this situation, the input scores of Barcodes and Total Sup become
equal (1.140.000 Euro), while the output scores of Total Sup are higher than those of Barcodes. In that
situation, Total Sup becomes part of the efficient frontier.
This can be done on two ways, less FTE or less expensive personnel. So, or the 8 FTE have to cost 27.000
euro per person, or the number of FTE should become 4. The first option is not preferable, as those
costs will not result in qualified personnel and the second one is not preferable, as the output score will
decline when there is only 1 warehouse administrator. The cleanliness, counting, and answering
questions will be a lot harder with only 1 FTE. Concluding, Total sup is not the ideal situation.
Consignment
The second alternative that is not on the efficient frontier of Figure 8Figure 10 is Consignment. Both its
input as output is worse than Current Plus, so one of these has to improve. Consignment can be on the
efficient frontier because of input only by reducing the order cost. This is not possible, as cost reductions
can only be done by having one supplier for all spares, which is not possible for SU Oss. On output,
Consignment scores only better than Current Plus on innovativeness, and worse or equal on the other
criteria. Changing the weight from 0,03 to 0,4 will result in total scores of 0,120 on both alternatives, but
this is not reasonable, so also Consignment is not the ideal situation.
Kanban
The alternative Kanban is on the efficient frontier, but it does not score higher on a criterion than
barcodes. Also RFID outranks Kanban on all criteria, so the output of Kanban cannot be higher than
those alternatives. If the 7.500 Euro extra input is worth the output, is calculated in Section 4.4.2, so no
conclusion can be given by the sensitivity analysis.
Current Plus
Current Plus is the cheapest alternative, as no big investments have to be made. The output results are
lower than Kanban, Barcodes, and RFID, so the decision has to be made based on input. The question
that has to be answered is “does the extra implementation costs give enough results to satisfy the
implementation?” This question is answered in Section 4.4.2.
Barcodes and RFID
The two most expensive alternatives on the efficient frontier have a lot of similarities and two big
differences; RFID is more expensive and Barcodes results in more DSS than when implementing RFID.
The choice is therefore also made in the last comparison in Section 4.4.2.
Page | 50
4.4.2. Swings in output In this section, the question “does the extra output justify the input?” is answered. This question is
answered by comparing two of the alternatives on the efficient frontier, and a calculation is made if the
lower chance of DSS is worth the extra costs. This section starts with Current Plus. This alternative,
which results in the current 1.500 DSS, is the cheapest alternative, but has the lowest score of the four
alternatives that are on the efficiency frontier.
Kanban versus Current Plus
The next alternative on the efficiency frontier is Kanban, which scores 0,051 better on output (0,1455 –
0,0944), but is also 12.500 Euro more expensive. The difference in chance of DSS results in a lower
expected amount of DSS, and to calculate if this is enough, the following estimations are used.
In SU Oss, the costs of one hour downtime are estimated on 250 Euro and an investment has a payback
time of 2 years. The Kanban alternative should therefore decrease the hours downtime for SU Oss with
12.500 / 250 = 50 hours. Because the number of minutes downtime for DSS is not known, three
possibilities are used, 5, 10 and 15 minutes. These numbers are estimated by the ‘clients’ of the
warehouse.
‐ 5 minutes per DSS: the use of Kanban should decrease the number of DSS by 300 (compared
with the 1.500 DSS of Current Plus)
‐ 10 minutes per DSS: the use of Kanban should decrease the number of DSS by 150.
‐ 15 minutes per DSS: the use of Kanban should decrease the number of DSS by 100.
The decreased number of DSS by Kanban will be 256 when using a linear relation between output and
DSS. If 0,299 (output of RFID) results in 0 DSS and 0,0944 (output of Current Plus) results in 1.500 DSS,
than 0,1455 (output of Kanban) results in 256. Conclusion, the Kanban alternative is in 2 of the 3
estimations better than Current Plus.
Barcodes versus Kanban
The next alternative on the efficiency frontier is ‘Barcodes’, which scores 0,046 better than Kanban and
0,091 better than Current Plus, but is also 7.500 Euro more expensive than Kanban.
Using the same calculation as used with Kanban gives the following estimations:
‐ 5 minutes per DSS: the use of Barcodes should decrease the number of DSS by 480 (compared
with the 1.500 DSS of Current Plus)
‐ 10 minutes per DSS: the use of Barcodes should decrease the number of DSS by 240.
‐ 15 minutes per DSS: the use of Barcodes should decrease the number of DSS by 160.
The decreased number of DSS by Barcodes will be 768 when using a linear relation between output and
DSS. Therefore, Barcodes scores better on all estimations compared with Current Plus.
Compared with the Kanban alternative, the Barcodes alternatives should decrease the number of DSS
with 129, 64, or 43 when using the same number of minutes per DSS as before. Because the estimated
Page | 51
difference between the number of DSS of the two alternatives is 512, Barcodes score better than
Kanban. Conclusion, the Barcodes alternatives scores better than the Kanban alternative.
RFID versus Barcodes
The next alternative on the efficiency frontier is ‘RFID, which scores 0,100 better than Barcodes and
0,205 better than Current Plus, but is also 80.000 Euro more expensive than Kanban.
Using the same calculation as used with Barcodes gives the following estimations:
‐ 5 minutes per DSS: the use of RFID should decrease the number of DSS by 1.920 (compared with
the 1.500 DSS of Current Plus)
‐ 10 minutes per DSS: the use of RFID should decrease the number of DSS by 960.
‐ 15 minutes per DSS: the use of RFID should decrease the number of DSS by 640.
The decreased number of DSS by RFID will be 1500 when using a linear relation between output and
DSS. Therefore, RFID does not scores better on all estimations compared with Current Plus. Conclusion,
RFID scores worse than Barcodes, and Barcodes is the best alternative for Unilever SU Os.
4.4.3. Conclusion The alternative which uses barcodes is the ideal situation, as is shown in the previous part of this
section. The barcodes alternative scores better than Current Plus and Kanban with a low increase in
costs and is so much cheaper than the RFID alternative that it outweighs the difference in output.
This alternative is also preferred by the problem owners of this research, which confirms and enhances
the conclusion. Therefore, the answer to the main research question is using barcodes.
4.5. Conclusion In this chapter, the fourth research question is answered and used to find the ideal situation by
comparing the six alternatives of Chapter 3 by using a MCDA method.
4. What are the criteria that are needed for scoring the solutions?
The criteria that are used are input‐ and output based. The input based criteria all involve costs that are
made when an alternative is implemented. The output criteria influence the chance of DSS. Time spend
in TW, Number of SKUs, Cleanliness, # People responsible, SKU category, SAP compatibility, Daily
counting, and Innovativeness are the output criteria.
The alternative that has the highest score on output is RFID, followed by total sup and barcodes. Total
sup and RFID have the highest input, so sensitivity analysis is used to find the ideal situation.
Because the use of barcodes results in the largest decline in DSS for the relative lowest implementation
costs, it outranks the other alternatives on the efficient frontier. For the implementation of barcodes,

Page | 52
all containers of small spare parts and the locations of the larger spare parts have to be tagged by a chip,
and several barcodes scanners have to be purchased.
The use of barcodes and scanners will make the electronic documentation a lot easier and quicker,
which will result in less DSS, as discipline will not be a problem. Combining this with the 5S steps of
Section 3.3.2, will result in a clean, maintainable technical warehouse, with easy traceable spares, which
are easy to document by barcodes.
In the next chapter, the implementation plan for using barcodes is given, followed by the discussion and
conclusions of this research in Chapter 6.
Page | 53
5. Implementation Plan In this chapter, the implementation plan for the recommended solution is given. The implementation
plan starts with the first steps determined in Section 3.3 and followed by the steps from the chosen
alternative: Barcodes. Last, the implementation steps of inventory control policies are given.
For all steps it is important to have the tasks clear, so who is responsible for which part of the
implementation. A project team is recommended and in this team the maintenance manager,
warehouse administrators, technical planners, TD and mechanics should be included, where the
maintenance manager is the project leader.
The success factor of this implementation is that everybody knows what is required from them and to
work together to keep the warehouse clean and organized. In Appendix 13, the time schedule is given.
First implementation steps
‐ Cleaning
o Remove deteriorated spares
o Remove spares that are not used anymore
o Remove not vital spares from automatic ordering in SAP
This step has to be done with the entire project team and, if possible, some extra support from
mechanics. The warehouse administrators do not know all the spares, so the expertise of the mechanics
and technical planners is required to know which items are not used or usable.
‐ Ordering
o Put the parts in the correct location according to SAP
o Label all spares that are too large for a container
This step also requires the help from the entire project team because of expertise. Every technical
planner can handle his or her own part of the warehouse.
‐ Counting
o Zero‐count of the spares to get to know the real amount of spares in the TW.
o Make several counting groups for yearly counting, so yearly counting can be done by
checking 1/12th every month instead of everything at one time.
This step can be combined with the ordering step. When all the spare part containers are checked for
correctness, they can simultaneously be counted.
‐ KPIs
o Number of DSS per month or fill rate, with requested amount (for example 95%)
o Cost of DSS per month, with requested amount
o Total value of all spares, with requested amount (for example 25% reduction)
o Total value of all spares that are not used in the last year
Page | 54
The KPIs that are the most important for the warehouse are given in this step and the results on those
indicators should be visible for everybody who enters the warehouse. The project team must decide who
enters the new data on the KPI boards. Recommended is that the warehouse administrator or the
maintenance manager are responsible for the KPIs, as they have all the information.
‐ Information
o Clear signs for which type of spares in a row or which production line
o Easy recognizable description of the spare in SAP (for SU Rotterdam, this step costs
several years)
At this moment, there are a lot of stickers and little signs in the warehouse, which all have a different
layout. These information signs should all be removed and new signs should be used. When all
information is in the same layout, it is clear that all information is applicable at this moment and not
outdated. This step can be done by the project team and all members can put the information on the
parts of the warehouse where they are responsible for.
The second part of this implementation step is more time consuming, as can be seen at SU Rotterdam. It
is important that SU Oss compares their required information on the description with those of SU
Rotterdam, so one uniform description method can be used.
Organization and structure
‐ Organization
o Number of clients
This step is important for the possible amount of DSS, as a lot of people responsible would increase the
chance of DSS. If only 1 or 2 persons per shift per production line can enter the warehouse, the number of
times they visit the warehouse increases. This increase results in more experience with the
documentation procedure and the creation of a little ownership to keep the TW clean and organized.
o Responsibilities
Technical planners
First operators and Toppers
Warehouse administrators
Daily counting
As mentioned in the beginning of this chapter, the responsibilities are very important. The technical
planners, who are also judged on the results of the warehouse by their operators, should be involved
more in the TW. They should process all suggestions from the mechanics on certain parts and then make
a proposal for a change in spare parts or the reorder quantities for example to the maintenance
manager.
The daily counting is one of the new tasks for the warehouse administrator, where the counting of the
SKUs in the MRP run is the more suitable for the TW of SU Oss. Monthly or weekly counting certain parts
of the TW are also recommended, so the spares level are incorrect less and DSS are prevented.

Page | 55
‐ Electronic documentation system
o Barcodes and scanners
Barcodes on all spare part locations
Software for barcode scanners and SAP
Numbers for production lines and machine parts, so the costs can be put on the
associated location.
o Training and education
This step is the recommendation on the alternative and therefore important for this research. The
success of this implementation step depends however more on the previous steps than on this actual
step, as an unorganized warehouse with a good documentation system still leads to DSS.
During the first implementation steps, the barcodes can be put on the containers of the DSS and on the
shelves where the spars should be placed. Also, the software for the barcode scanners must be applicable
to SAP, so it must be ordered and customized for Unilever SU Oss. When these two steps are complete,
the barcode scanners can be put in the warehouse and the documentation can be done by scanning from
that moment on.
The second step is the training and education for the clients to work with this system. Because
documentation by barcode scanners is relatively easy, this is not a time consuming step. The most
important is that every client knows his ‘number’.
‐ Structure
o SKU categories locations
The last implementation step of this part is the structure of the TW, the warehousing part. In the next
section, some recommendations on the use of SKU categories are given combined with an inventory
control policy.
Inventory control policies
‐ Safety stocks
o Safety stocks for vital spares
o No safety stock for desirable spares
o Safety stock for fast movers
o No more than 1 spare on stock for (very) slow and non movers
The safety stocks of the different SKU categories are the first implementation step. With three times the
yearly amount of spares demanded on stock, the current safety stock levels are not correct. Safety stocks
are important for the vital spares and spares with a high lead time.
In Section 2.3.4, an explanation of superfluous spares is given. Having 3 months supply is normally not
necessary. In Winston (2003), the order costs are an important factor for deciding safety stocks and
reorder levels, but at SU Oss, there are more than two deliveries every day, so this is not the important
Page | 56
factor for SU Oss. If there is one part of a SKU used in a machine, it breaks normally once a month, and
the lead time is 2 weeks, the required safety stock is 1.
The most important part for SU Oss is that the demand figures are clear and become better in the
coming months / years. At this moment, there is only information about the last 3 years, and it is hard to
say if a part breaks down once a year or that there is a lot of ‘bad luck’.
‐ Reorder levels
o (s,S) for fast moving spares
o 1 for (very) slow and non‐movers
As mentioned in the organization and structure implementation steps, it is important that the technical
planners and maintenance manager take a look at the reorder levels. The number of spares in stock can
be minimized, as long as there is a safety stock for vital and essential parts. This step is not a normal
implementation step, as it is a continuous step in the warehouse process.
‐ ND and Z6
o All fast movers: Z6
o All (very) slow movers and desirable spares: ND
The current number of ND and Z6 are odd. At this moment, there are ND spares with values under 10
euro and ND SKUs with more than 1 spare in stock. Recommended is a clear difference in Z6 and ND,
where as much SKUs as possible should be Z6, so no expertise mistakes can be made.
All (very) slow movers and desirable spares should be made ND items, where the technical planner has to
decide whether or not to reorder a certain spare. The other items should be Z6, which works correctly if
the demand figures are correct.
‐ Control
o Every year a check for new reorder points and levels by checking the demand of the last
years.
o Frequent control at new spares
As with most implementation plans, it is important that the implementation does not stop after the last
implementation step, but that it remains a continuous improvement process. This last step is that
continuous improvement step, as the reorder points for example should be checked every year for
correctness.
Next, the new spares should be checked frequently, as their demand is not certain. A supplier gives the
demand figures, but these can differ from the actual demand figures when implemented at SU Oss. Also,
the control over new parts that are ordered should be improved. When a supplier gives a spare parts list
at the purchasing of a new machine, these spares have to be checked if they already exist in the TW. This
will reduce the number of double spares, so after implementation of all these steps, the warehouse will
be structured and organized, and the number of spares and SKUs will be decreased.
Page | 57
6. Conclusion & Discussion In this chapter, the conclusions of this research are given. Next to the conclusions, there are several
recommendations drawn in Section 6.2, and finally, the discussion is given in Section 6.3. In that section,
the limitations of this research are given.
6.1. Conclusion In Chapter 1, after the goal of this research, several research questions are defined and a main research
question is given. In this section, the main research question is answered by first answering the six sub
questions and finally the main question.
The main research question, as given in Section 1.6, of this research is:
What is the best possible spare parts system for the technical warehouse that can be implemented at
Unilever Sourcing Unit Oss?
To answer this main research question, the six research questions are answered one‐by‐one first.
Research question 1: How are the spare parts in the technical warehouse currently managed?
The technical warehouse of Unilever SU Oss is currently managed by two warehouse administrators,
who have 70 ‘clients’ or people that take spare parts from the warehouse. Because the documentation
that belongs with the taking of spares is not done correctly, the warehouse administrators have a lot of
DSS which have to be corrected. DSS causes a lot of frustrations at the clients, as they get longer
downtime at a breakdown of one of the machines.
The frustrations and other factors influence the discipline of the clients, who are responsible for the
documentation of the spares, and therefore the traceability and cleanliness of the warehouse
decreases. The current organization and structure of the warehouse have to change before the
warehouse can run properly again.
Research question 2: Which systems are available in literature for managing spare parts in production
companies?
The literature research that is done in Chapter 3 of this report is divided into two parts, DSS and
electronic documentation, and structure and organization. The systems that are available in the DSS
literature are the use of electronic mechanisms, incentives, and training. At electronic mechanisms, RFID
and barcodes are described and also the non‐electronic Kanban is researched.
Next, the systems that are available in the organization and structure literature are described. The use
of total supervision, magpieing behaviour, TPM, and KPIs is researched and used for the formation of
alternatives.
The findings of the two literature parts are used for the third research question, as they are the focus
points during the visits of the other technical warehouses. The results of the visits are combined with

Page | 58
the possibilities in literature and are formed into six alternatives. These alternatives are given at the
answer of the fourth research question and used in the analysis.
Research question 3: Which systems are used by other production companies in the Netherlands and
at other Unilever sites with comparable complexity?
Next to the literature research, three other technical warehouses are visited in the Netherlands.
Unilever SU Rotterdam, Heineken Den Bosch, and Johma Losser are the locations that are visited and
interviewed for the use of systems, which are described in the literature.
The conclusion is that the other warehouses perform a lot better on the number of DSS and this can be
because the use of barcodes and scanners, the use of less people responsible for the documentation, or
the cleanliness of the warehouses.
Research question 4: What is the best possible spare part system for the technical warehouse of
Unilever SU Oss?
The second and third research question are formed into six alternatives at the end of Chapter 3: Current
Plus, Total Sup, Consignment, RFID, Barcodes, and Kanban. These alternatives are analyzed to find the
ideal situation for the technical warehouse of Unilever SU Oss. This analysis is done by scoring the input
criteria, cost factors, and the output criteria of the alternatives.
The criteria for scoring the solutions are based on the literature and the stakeholder analysis. There are
two main groups of stakeholders, operations and technical & innovation, which have different interests,
and both these groups have to be satisfied with the results. In Table 17, the output criteria are given, as
well as the weights the criteria received at the AHP method. AHP, which is described in Section 4.2, is
the method that is used for the entire analysis.
Criteria Weight
Time spend in TW 0.32
Number of SKUs 0.14
Cleanliness 0.14
# People responsible 0.05
SKU category 0.05
SAP compatibility 0.14
Daily counting 0.14
Innovativeness 0.03
Table 17: Criteria that are used for the analysis of the alternatives (source: Unilever SU Oss)
After the criteria are given, they are used for the MCDA analysis. The criteria gave the output scores of
the alternatives and the costs of implementing is the input of the alternatives. In Table 18, the input and
output scores are given.

Page | 59
Weight Current Plus Total Sup Consignment Barcodes RFID Kanban
Output: 0,094 0,204 0,058 0,199 0,299 0,145
Input (x 1.000 Euro) € 120 € 404 € 220 € 140 € 220 € 132 Table 18: input and output scores of the alternatives (source: Unilever SU Oss)
After finding the output and input criteria, four alternatives became part of the efficient frontier, which
shows the possible ideal situations: Current Plus, Barcodes, RFID, and Kanban. A sensitivity analysis and
comparisons between the alternatives resulted in the ideal situation, which is Barcodes.
Because the use of barcodes results in the largest decline in DSS for the relative lowest implementation
costs, it outranks the other alternatives on the efficient frontier.
Research question 5: How can the recommended system be implemented at SU Oss?
The use of barcodes and scanners is already done at Johma Losser and Heineken Den Bosch, so there is a
good chance of successful implementation. The most important part of the implementation are the first
steps: organizing the warehouse and keeping it organized and clean. If this is done, barcodes can be
implemented, the amount of DSS decreases, the warehouse will be easier to control, and spares are
easier to find.
Main research question
The answer to the main research question is that using barcodes for the electronic documentation gives
the best results for the technical warehouse of Unilever SU Oss. The use of barcodes and the first
implementation steps of Section 3.3.2 result in a decline of total spare part value of 500.000 Euros, as
cleaning one of the five production lines resulted in 150.000 Euros of old, superfluous, and broken
spares parts that are tossed away.
6.2. Recommendations In this chapter, the recommendations for Unilever Sourcing Unit Oss are given. The recommendations
for other research and recommendations which do not involve an alternative are given in respectively
Section 6.2.2 and Section 6.2.3.
6.2.1. Recommended alternative In this section, the recommended alternative is given. In Section 4.3 all the alternatives are investigated
if their scores are better than the other alternatives. The concluded alternative, barcodes, is also
recommended, as it is worth the implementation costs.
Next to barcodes, the first implementation steps have to be done, as they are crucial to the success of
the barcodes alternatives and influence the results of the TW. Also the use of KPIs is recommended, as
visualisation results in more interest in the action of the TW, so maintaining will be only easier.
Page | 60
6.2.2. Recommendation for further (related) research In this section, the recommendations which involve new possible research are given. There are three
research recommendations.
RFID Next to the use of barcodes, the use of RFID for spare parts documentation is a really interesting
alternative, which is usable for all purposes in the factory of SU Oss. Checking in personnel, raw material
entrances, and the production process can also be monitored by using RFID. The costs of RFID can
decrease when it is used more, so an Unilever broad investigation for the possibilities of RFID can be
beneficial.
Concluding, the barcodes alternative is recommended, but the use of RFID at Unilever SU Oss or at
Unilever worldwide should be investigated, as the output scores of that alternative are the highest of all
six alternatives.
Replenishment scheme As mentioned in Chapter 3, the use of the correct replenishment scheme and safety stocks is important
for a technical warehouse. In this research, it was not one of the core problems and is not further
investigated.
The spares can be divided in different groups or SKU categories, which all get a different replenishment
scheme. For fast moving spare parts, a (s,S) scheme is preferable, as it can handle the demand between
review periods. For slow movers and SKUs with one spare on stock, the s and S could be one or even
zero, but this can be investigated. Needed for this investigation is a lot of correct data on the demand of
the spares parts, their lead time and vitality to the organization.
Floor stock The second recommendation for further research is the possibility of grabbing spare parts which do not
have to be documented. No documentation leads to no DSS on these spares. The warehouse
administrator, or supplier, checks every review period the stock levels and orders according to a (R, s, S)
replenishment scheme. Because the amount of reviews have to be high to make this reliable, this is only
possible for fast moving spare parts.
Needed for this research are a lot of correct data on the demand of the spare parts, their lead time,
vitality and costs, so an assessment can be made if it is possible to make it floor stock or not.
Incentives One of the recommendations that is said the most by stakeholders is the use of incentives. Lack of
discipline and ingrained habits can only be changed by using incentives according to most stakeholders,
and this should be investigated.
A reward and penalty system could be preferable, so the personnel will be motivated to get the
rewards. Problem with this idea is that the entire site should use incentives for optimal results.

Page | 61
6.2.3. Other recommendations Next to the recommendations that require new research, there are several recommendations that are
already announced in the previous chapters and other recommendations for Unilever SU Oss.
Tasks of TW administrators One of the success factors on the implementation are the tasks of the warehouse administrators. As
mentioned before, the current tasks of the warehouse administrators involve more than they should be.
Tasks that are done by the warehouse administrators:
Daily and yearly counting (in the new situation)
Checking MRP run
Determining strategic stock
Determining stock levels
Adjusting price levels of spares
Putting new spares on their location in TW
Putting repaired or returned spares to their location in TW
Documentation of the number of DSS
Answering questions from clients
The tasks of a classical or normal warehouse administrator involve only the counting, putting spares on
their location, and answering the questions. Handling the documentation of DSS is also ideal, then the
DSS are quickly handled and maybe do not become critical DSS. The difference between the current and
the ideal situation is large, as half of the tasks are extra. The number of FTE that are needed for handling
all the tasks that are summed up remain therefore at 2.
In the ideal situation barcodes handle the documentation, the number of DSS is around zero, and
counting is done by the warehouse administrator. In this situation, one warehouse administrator could
be enough, but there should be at least one person for support and tactical decisions.
Repairables and preventive maintenance As promised in Chapter 2, a recommendation for repairables and preventive maintenance is given. In
Section 2.1.4 the differences between preventive maintenance and corrective maintenance is explained.
The current system is breakdown based and therefore corrective maintenance, while preventive
maintenance results in less downtime (Nicholas, 1998).
Using preventive maintenance can be done in several ways, but the recommended way is to replace the
part in the machine if it does not function as requested and then repair the part that is taken from the
machine. The repaired part can then return to the TW, so it can be used again. In this ideal situation, a
spare part is always available and the number of spares ordered decreases rapidly.
Because it is hard to find out if a machine part functions as requested, the part can also be replaced at
autonomous maintenance and then checked by the mechanics and Toppers. If the machine part needs
Page | 62
repairing it can be done before breakdown and then be returned to the warehouse, which also happens
when the part was not broken.
Generic machines One way to decrease the number of SKUs is using generic machines for different production lines. Using
the same production machines for packaging for example could lead to a decrease in SKUs, and this can
also be used for other new machines.
Before a new machine is ordered, the current SKUs and spares should be inventoried, so spares which
are already in the TW can be chosen. Those spares are most of the time cheaper than those of the
supplier of the new machine according to the stakeholders, and again, the number of SKUs decreases.
More generic machines or generic spares decrease the number of SKUs which increases the
maintainability of the warehouse and the traceability of the spares.
Combining powers with other SUs or industrial area Oss One of the more radical ideas is combing powers with other factories. Combining powers can be done in
two ways and with two types of other factories. The first way is having the possibility to order spares
from another warehouse, instead of the supplier. In this way, the average stock levels can be decreased,
because the spares are at SU Oss within a few hours for example.
The second way is having a technical warehouse for a couple of factories combined. In this way, the
number of FTEs can be combined and decreased, and total supervision and its advantages can be used.
The number of DSS decreases to around zero, and the holding costs are shared.
The first type of factories to share spares with is other Unilever Sourcing Units or Unilever partner. A lot
of similar spares where stored in the TW of SU Rotterdam, which have the same demand as in SU Oss,
once a year, and these demands could be combined.
The next type is combining powers with the industrial area of Oss or even Den Bosch. Combining powers
with several local factories would result in a lot of rules and regulations, but the advantages that are
given in the second way are applicable for this situation.
Conclusion, having your own technical warehouse can be something that will disappear in the future as
partnerships become more important. Partnering with factories in the same industrial area and
combining technical warehouses can be beneficial for SU Oss. However, it requires a lot of
communication, rules and regulations.
Combining TD and TW The classical repairable problem of Sherbrooke (1968) uses a location where the spares are stored,
ordered and repaired. This idea can also be applied at SU Oss, by combining the TD and TW, and
creating a ‘technical heart’ of the organization.
Combining maintenance, repairing, mechanics, spare parts, decreases the number of FTE that are
needed to control it and can increase the communication between the technical parts. Adding the TD to

Page | 63
the TW will also increase the ownership of the mechanics in the TW and this decreases the number of
DSS and increase the organization and structure of the TW.
The only problem is, which is also the reason why it is not an alternative in this research, is that it
requires an enormous change which will lead to a lot of resistance. In the ideal situation it could lead to
a lower number of FTE, but adding a manager Technical Affairs will be expensive and there will also be
something like ‘first operators’ in the technical department.
So this opportunity can be investigated, but as a lot of levels in the company are involved, this cannot be
done within six months, which is the time for a normal Master thesis.
All spares in the warehouse At the moment, several racks and shelves are located next to the technical warehouse, in the ‘normal’
warehouse. This location is next to the technical warehouse, but it is harder to control this part of the
warehouse as administrator. Also, to control and maintain the number of DSS, it is better to have all
spares within the walls of the warehouse. The use of a new documentation method, for example
barcodes, is easier to implement if the barcode scanner remain in the warehouse all the time. Losing
barcode scanners leads to increasing amounts of DSS, which is not preferable.
Therefore, the spares should be maintainable for the warehouse administrators and the electronic
documentation devices, so the spares should be placed within the walls of the technical warehouse.
6.3. Discussion The discussion starts with a reference to the main purpose of the study, followed by a generalised view
of the results, possible explanations for the findings, comparison with expected results and it ends with
the limitations of this study (Gillett et al., 2009).
a reference to the main purpose of the study
The goal of this study is: to give advice on the technical warehouse at Unilever Sourcing Unit Oss, so the
amount of spares can be reduced and the service level can increase.
a generalised review of the most important findings ‐ summary of results
The results of this research are shown in Error! Reference source not found., where the alternative
‘RFID’ has the highest output on the eight alternatives, followed by Total Sup and Barcodes. The
alternatives are more focussed on the organization and structure of the technical warehouse than on
the main items in the goal of this study, because the core problem was not the amount of spares, but
DSS and the organization and structure.
possible explanations for the findings in general
The two most expensive alternatives are the best scoring alternatives, but it is difficult to determine
how much money an added 0.05 on the output is worth. The most expensive solution, total supervision,
is not the best scoring solution, which is logical in this case. This old idea of organizing a TW is too

Page | 64
expensive and working with electronic documentation devices is the future and RFID gives already
better results for a lower cost, so therefore the high cost of the ‘Total sup’ alternative is logical.
The use of Kanban cards does not give the results that are expected beforehand. This is because AHP is a
fully compensatory method and because other alternatives score better on the criteria, the use of
Kanban cards get low scores. The use of Kanban cards is something that is better applicable for
production instead of technical warehouses, where the demand is too low.
comparison with expected results and other studies
The expected results are achieved, as the concluded ideal situation can be implemented at SU Oss and
will result in a better organized and structured warehoused.
Limitations of the overall study
The limitation of this study that restricts the extent to which the findings can be generalised is the lack
of data to calculate the scores for the criteria for other warehouses. The number of critical DSS, the
vitality of the spare parts and the time it costs per DSS are not known, and assumptions are made in this
report.
Next, the use of AHP has its limitations, as mentioned before. AHP is a fully compensatory method, so an
alternative with a very bad score can still be the best after the entire analysis. Despite of the limitations
of this method, it remains the ideal method for a comparison of alternatives with a lot of stakeholders
with other interests.
The last limitation of the results is the costs of the alternatives. The estimations that are made are based
on only one year and therefore the more expensive alternatives score worse. When using for example 5
years and discounted cash flows (DCF), the results would be different. In Appendix 12, a calculation for
the use of DCFs and a span of 5 years is done. Because the four alternatives on the efficiency frontier are
the same as those on the frontier of Section 4.4, the frontier of Section 4.4 is used for the
recommendations.
Concluding, the limitations of this research are because of the lack of data, the used multi criteria
decision analysis and the estimations of the costs. Nevertheless, the ideal situation is a situation in
which the technical warehouse becomes more structured, better organized, and will result in less DSS.
Page | 65
Bibliography Adida, E., & Ratisoontorn, N. (2011). Consignment contracts with retail competition. European Journal of
Operational Research, 136‐148.
Axsäter, S. (2006). Inventory Control. New York, USA: Springer Science + Business Media, LLC.
Ayre, L. B. (2008). Analysis, Evaluation and Recommendations for Materials Handling System and RFID at
Palo Alto City Library. Palo Alto: The Galecia Group.
Belton, V., & Stewart, T. J. (2002). Multiple Criteria Decision Analysis: An Integrated Approach.
Dordrecht: Kluwer Academic Publishers.
Bingi, P., Sharma, M., & Godla, J. (1999). Critical Issues Affecting an ERP Implementation. Information
Systems Management 16, 7‐14.
Business Dictionary. (2012, 03 06). What is spare part? Retrieved 03 06, 2012, from Business Dictionary:
http://www.businessdictionary.com/definition/spare‐part.html
Cauer, W. (1941). Theorie der linearen Wechselstromschaltungen. Leipzig: Verlags‐Gesellschaft Becker
und Erler.
Chan, F., Lau, H., Ip, R., Chan, H., & Kong, S. (2005). Implementation of total productive maintenance: A
case study. Int. J. Production Economics 95, 71‐94.
Deloitte. (1999). ERPs second wave. New York, USA: Deloitte Consulting.
Devnani, M., Gupta, A., & Nigah, R. (2010). ABC and VED Analysis of the Pharmacy Store of a Tertiary
Care Teaching, Research and Referral Healthcare Institute of India. Journal of Young Pharmacists
2, 201‐212.
Drury, C. (2007). Cost And Management Accounting, 7th edition. Stamford, Connecticut, U.S.: South‐
Western Cengage Learning.
Edwards, W. (1977). How to use multi attribute utility measurement for social decision making. IEEE
Transactions on Systems, Man and Cybernetics, SMC‐7, 326‐340.
Elsevier B.V. (2012). Elsevier. Retrieved 03 14, 2012, from Elsevier: http://www.journals.elsevier.com/
Ernst, R., & Cohen, M. A. (1990). Operations Related Groups (ORGs): A Clustering Procedure for
Production/ Inventory Systems. Journal of Operations Management, 574‐598.
Fishburn, P. (1970). Utility Theory for Decision Making. New York, USA: Wiley.
Frazelle, E. (2002). Supply Chain Strategy: the Logistics of Supply Chain Management. New York:
McGraw‐Hill Companies.

Page | 66
Gillett, A., Hammond, A., & Martala, M. (2009). Inside Track to Successful Academic Writing. London:
Pearson Education Limited.
Guitouni, A., & Martel, J.‐M. (1998). Tentative guidelines to help choosing an appropriate MCDA
method. European Journal of Operational Research 109, 501‐521.
Harris, F. (1913). How Many Parts to Make at Once. Factory, The Magazine of Management 10, 135‐152.
Hawking, P., Stein, A., & Foster, S. (2004). Revisiting ERP Systems: Benefit Realisation. 37th Hawaii
International Conference on System Sciences (pp. 1‐8). Victoria, Australia: HICSS'04.
Hopp, W. J., & Spearman, M. L. (2008). Factory Physics. New York, USA: McGraw Hill.
Kelly, A. (2006). Maintenance Systems & Documentation. Oxford: Butterworth‐Heinemann.
Lambert, D., & Stock, J. (1993). Strategic Logistics Management, 3rd edition. Homewood, IL, USA: Irwin
McGraw‐Hill.
Mendelow, A. (1981). Environmental scanning: the impact of stakeholder concept. Proceedings of the
second international conference on information systems. Cambridge: Mass.
Moody, D. (2009, 12 01). How to Conduct a Structured Literature Review. (C. Amrit, Interviewer)
Muckstadt, J. (2005). Analysis and Algorithms for Service Parts Supply Chains. Berlin: Springer.
Nakajima, S. (1986). Introduction to TPM. Portland, USA: Productivity Press.
Nicholas, J. M. (1998). Competitive Manufacturing Management. Singapore: McGraw‐Hill.
Ohno, T. (1988). Toyota Production System: Beyond Large‐Scale Production. Cambridge, USA:
Productivity Press (translation of Toyota seisan hoshiki, Tokyo: Diamond, 1978).
Olson, J. E. (2005). Top‐25‐Business‐School Professors Rate Journals in Operations Management and
Related Fields. Interfaces 35, 323–338.
RFID Journal. (2012, June 1). FAQS. Retrieved June 1, 2012, from RFID Jouranl:
http://www.rfidjournal.com/faq/20/85
Roy, B. (1966). Multicriteria Methodology for Decision Aiding. Dordrecht, The Netherlands: Kluwer.
Roy, B. (1985). Methodologie Multicritere d'Aide a la Decision. Economica, Paris.
Roy, B. (1990). The outranking approach and the foundations of ELECTRE methods. Readings in Multiple
Criteria Decision Aid (pp. 155‐183). Bana e Costa: Springler‐Verlag.
Roy, R., & Guin, K. (1999). A proposed model of JIT purchasing in an integrated steel plant. Industrial
Engineering & Management Department, Indian Institute of Technology, 1‐12.

Page | 67
Ru, J., & Wang, Y. (2010). Consignment contracting: Who should control inventory in the supply chain?
European Journal of Operational Research 201, 760‐769.
Saaty, T. (1980). The Analytic Hierarchy Process. New York, USA: McGraw‐Hill.
Scopus. (2012). Scopus. Retrieved 03 14, 2012, from SciVerse Scopus: www.scopus.com
Serac. (2012, June 26). Serac: Scanning XML. Retrieved June 26, 2012, from Serac: SAP business one:
http://www.serac.nl/producten/scanning‐smartphone?gclid=CMCY‐6PC67ACFccJtAodwCZlwQ
Sherbooke, C. (1968). METRIC: A multi‐echelon technique for recoverable item control. Operations
Research 16, 122‐141.
Sherbrooke, C. C. (2004). Optimal inventory modeling of systems – Multi‐echelon techniques. London:
Springer.
Silver, E. A., Pyke, D. F., & Peterson, R. (1998). Inventory Management and Production Planning and
Scheduling. New York, USA: John Wiley & Sons.
Sugimori, Y., Kusunoki, K., Cho, F., & Uchikawa, S. (1977). Toyota Production System and Kanban System
Materialization of Just‐in‐Time and Respect‐for‐human System. International Journal of
Production Research 15, 553‐564.
Taylor, F. W. (1911). The Principles of Scientific Management. New York, USA: Harper & Row.
Thomas Reuters. (2012). Journal Citation Reports. Retrieved 03 14, 2012, from Thomas Reuters:
http://thomsonreuters.com/products_services/science/science_products/a‐
z/journal_citation_reports/
Umble, E. (2003). Enterprise resource planning: Implementation procedures and critical success factors.
European Journal of Operational Research 146, 241‐257.
Unilever. (2012). Highlights 2011. Rotterdam: Unilever.
Unilever Sourcing Unit Oss. (2012). TPM Passport SU Oss. Oss: Unilever.
United Nations Statistics Division. (2012). Detailed structure and explanatory notes ISIC Rev.4 code 101.
Retrieved 03 12, 2012, from United Nations Statistics Division ‐ Classifications Registry:
http://unstats.un.org/unsd/cr/registry/regcs.asp?Cl=27&Lg=1&Co=101
Valentini, G., & Zavanella, L. (2003). The consignment stock of inventories: industrial case and
performance analysis. Int. J. Production Economics 81‐82, 215‐224.
Vincke, P. (1989). L'aide Multicritere a la Decision. Editions de l'Universite de Bruxelles.
Von Neumann, J., & Morgenstern, O. (1947). Theory of Games and Economic Behavior. Princeton, USA:
Princeton University Press.

Page | 68
Wang, Y., Jiang, L., & Shen, Z. (2004). Channel performance under consignment contract with revenue
sharing. Management Science 50, 34‐47.
Want, R. (2006). An introduction to RFID technology. Persvasive Computing, 25‐33.
Willmott, P., & McCarthy, D. (2001). Total Productivity Maintenance ‐ A Route to World Class
Performance. London, UK: Elsevier.
Wilson, R. (1934). A Scientific Routine for Stock Control. Harvard Business Review 13, 116‐128.
Winston, W. (2003). Operations Research: Applications & Algorithms. Belmont: Thomson.

Page | 69
Appendix 1: Stakeholder analysis For stakeholder analyses, there are several possible methods. The two most common methods are the
“Power versus Interest grid” (Mendelow, 1981) and “Interest versus Attitude grid”. Before the decision
for the method is shown, power, interest and attitude are defined.
1. Power: Their power or ability to influence in the organisation. This may be their potential to
influence derived from their positional or resource power in the organisation, or may be their
actual influence derived from their credibility as a leader or expert.
2. Interest: Their interest in the project or programme as measured by the extent to which they
will be active or passive.
3. Attitude: Their attitude to the project or programme as measured by the extent to which they
will ‘back’ (support) or ‘block’ (resist).
For the technical warehouse, the Power versus interest grid of Mendelow is used, because the most
important factors in the stakeholder analysis are the power of the stakeholders and their interest in this
problem and the warehouse.
The grid is shown in Figure 9 and within the figure are the corresponding strategies for the different
groups.
Figure 9: The Power versus Interest grid (source: Mendelow (1981))
In this section, the stakeholders are analyzed one by one and at the end the power versus interest grid
with the locations of the stakeholders are shown.
1. TW administrators. As the administrators of the problem location, they are very interested in
this research and the results. Their power is medium.
2. Maintenance manager. As the manager of the problem location, the maintenance manager is
very interested in this research and has also high power.
3. Technical department personnel (TD). The TD as part of the organization is very interested in
this research, but the power of the TD and the personnel is lower.
4. Work preparer. They have to order the spares and are judged by their operators on the success
of getting the spares, so they are interested in changes in the TW. Their power is medium.
5. First operators. Their interest in this research is low, they use the TW but are not judged by the
operators and they do not feel responsible for the functioning of the TW. The technical planners

Page | 70
and TD do feel that responsibility, which makes first operators less interested. The power of first
operators is medium/low
6. Toppers. Their interest is equal to the first operators and their power is lower than that of first
operators.
7. Technical and Implementation manager. He is the problem owner and therefore very
interested in this project and his power, as problem owner and member of the MT, is very high.
8. Management Team. The management team has very high power in Sourcing Unit Oss and
therefore should also be satisfied in this project. Their direct interest in this research is not very
high, because it is a project that influences just one of them directly.
9. Team leaders of the production lines. The heads of the different departments, both from CFO
and SSF, have high power in the organization, because they will have to use the spare parts and
when the parts are not available, results in downtime of their production lines. Regardless of
this importance to their production lines, their interest is medium.
10. Operations Manager. As manager of the operations department of SU Oss, the operations
manager high interest in the technical warehouse, as a low service level would negatively
influence his production lines and numbers. The operations manager is part of the MT, and
therefore he has high power.
This results in the following power versus interest grid:
High 8 10 7
9 2
Power 10
4 3 1
Low 5
6
Low Level of Interest High Table 19: Power versus Interest grid of the stakeholder analysis (source: Mendelow (1991))

Page | 71
Appendix 2: Interview questions and results The list of interview subjects:
‐ Differences between the CFO and the SSF
‐ Experiences with SAP
‐ Experiences with TW
o Different locations
o Paternoster
o Supervision
‐ DSS
‐ Discipline
‐ Suggestions for the TW
‐ Experiences with TD
‐ Experiences with Toppers
‐ Autonomous maintenance
‐ TPM / 5S
‐ ATM
‐ Different workplaces
Results
1. TW policies are outdated
2. Supervision only during the day
3. One central warehouse, but lots of spares on different locations
4. A lot of old spares which cannot be used anymore, because the corresponding machine is
already replaced.
5. It is possible that spares are more than once available in the warehouse
6. Lack of discipline results in DSS
7. High number of responsible actors
8. Toppers not reaching their expected potential
9. Using SAP takes too much time
10. No SAP on all locations of warehouse, which results in paperwork
11. Different AM strategies
12. SSF has more setups than CFO, while both have a lot of setups per week (more than 10 per
week)
13. SSF uses Excel for their maintenance management, while CFO uses SAP
14. Transferring SSF to SAP costs a lot of time, which is not available at the moment
15. Number of DSS
16. There is a breakdown culture, putting out small fires (In Dutch: brandjesblussen), and looking at
the next day/week is done more often than thinking about next year.
17. A lot of (good) personnel is lost during the reorganization
18. The reorganization cost a lot of knowledge

Page | 72
19. There are a lot of external people on the site, which are more expensive than regular personnel
(but easier to fire)
20. Not reaching the PE and OE targets / low ET
21. Too many spares, which in total represent too much
22. Not the correct purchasing policy and control
23. Suggestion: order all the spares per production line
24. ABC ordering for the spares in TW
25. Suggestion: only access to the TW for the TW administrators and TD personnel
26. Suggestion: Control all around the clock, three shifts of TW administrators
27. There is no confidence in the TW at the moment
28. Suggestion: hand scanner connected to SAP to write off spares
29. Suggestion: SAP on all the locations of the warehouse
30. Suggestion: barcodes on all the spares in the warehouse
31. Suggestion: throw all the spares outside and ask the first operators and technical planners to
take all the spares they could use for their production line and take those back inside. When this
is done, all the old spares stay outside and can be removed afterwards.
32. Suggestion: when a spare is taken out of the warehouse, note the number of spares that is left
in the warehouse so the differences can be checked
33. Suggestion: TPM campaign: Whatever you do, write it off!!
34. SAP has no administrator at the moment
35. Suggestion: Make someone responsible for SAP
36. Suggestion: Put the value of the product on the spare, so the care of the product increases when
operators / TD personnel see what the spare is worth
37. Suggestion: Add a photo of the spare at SAP, so it is easier for the production line to see if that is
the spare they need and therefore reduce walking without knowing if that is the needed spare.
38. Paternoster is a nice storing system for spares, but does not function ideal because of the lack of
connection to SAP and automatically writing off taken spares.
39. Risk of transporting a factory to another site if large improvements are investigated
40. Lack of plans for the future
41. Lack of plans of replacing machines in the coming years
42. 60‐20‐20 rule (CFO, Soup, Sauce) for DSS spares that have to be written off is reasonable, but
investigating the DSS could decrease the number of partly bookings to the incorrect production
lines
43. SSF and CFO have totally different mentalities
44. QA, responsible for the quality, could combine some of their tasks with the TPM team to reduce
time and costs
45. Some of the spares are placed in the warehouse for finished products because of space
problems and not delineated

Page | 73
Appendix 3: Literature Review Choice of research databases or journals
Because using “people’s choice” of search engines for finding articles and randomly searching for
articles undermines the credibility of literature reviews and is mostly used for convenience rather than
quality, the journals that are used in this research are defined and clearly justified.
The journals that are used have to be peer‐reviewed articles that have been through a blind review
process, this is the most important indicator of scientific quality (Moody, 2009). To find peer‐reviewed
articles, the top databases are used, as they use only peer‐reviewed articles. The top databases are
described by Olson (2005) and ranked in his report (Olson, 2005).
In the list there are a lot of journals that cannot be used for this research, because their interest is
different than the interest of this article, therefore the used articles must be related to ‘operations
research’, ‘production companies’, ‘inventory’, ‘warehousing’ and / or ‘spare parts’.
Combining those subjects with the SNIP (Source Normalised Impact per Paper) of Scopus (Scopus, 2012)
and the impact factor of Thomson Reuters Journal Citation Reports (Thomas Reuters, 2012) used by
Elsevier (Elsevier B.V., 2012) the following list of journals is given:
o International Journal of Production Economics
o European Journal of Operations Research
o International Journal of Production Research
o Production and Inventory Management Journal
o International Journal of Operations and Production Management
o OMEGA
o Harvard Business Review
Because of the first and second place in the article of Olson (2005), the following two journals are also
taken into account:
o Management Science
o Operations Research
Choice of search terms
After finding the journals that are used, the search terms must be defined. The following terms are
already used for the choice of journals and should be taken into account: ‘Operations research’,
‘production’, ‘inventory’, ‘warehousing’ or ‘spare parts’.
o Spare parts AND warehousing OR inventory policy OR production
o Spare parts AND service level OR ownership OR Operations research
o Service level AND inventory
o Supervision AND warehouse

Page | 74
o Warehouse AND electronic devices
Clearly defined selection criteria
o Include spare parts
o Exclude production materials and ingredients
o Exclude the use of other ERP systems
Clearly defined prioritisation criteria
o Articles from between the years 2002 and 2012.
o Articles from the databases mentioned before.
Evaluation (critical analysis) and synthesis of papers (not just sequential description)

Page | 75
Appendix 4: Different approach per spare type According to Silver, Pyke and Peterson (1998) the Class B spares should be made by routine
(computerized or manual) rules. This should not be the case with Class A items. The potentially high
payoff warrants frequent attention to the replenishment decisions of individual spares.
Guidelines for the control of Class A items:
1. Inventory records should be maintained on a perpetual (transaction recording) basis,
particularly for the more expensive items. This does not need to be done by a computer, the use
of a manual system (for example, VISI‐Record or Kanban) is quite attractive.
2. Keep top management informed. Frequent reports should be prepared for at least a portion of
the A items.
3. Estimate and influence demand. This can be done in three ways:
a. Provide manual input to forecasts. (For example, call the customers to get advance
warnings of their needs)
b. Ascertain the predictability of the demand. This is particularly important for expensive,
slow‐moving items. If there is an adequate warning of the need for replacement part is
given, there is no need to carry protection stock. On the other hand, when a random
breakdown occurs, some protection stock is preferable. When the unit value of an item
is extremely high, it would be wise to use a pool of spare parts shared among several
companies within the same industry.
c. Manipulate the given demand pattern. Seasonal or erratic fluctuations can sometimes
be reduced by altering price structures, negotiating with customers, smoothing
shipments, and so forth.
4. Estimate and influence supply. Negotiations with suppliers may reduce the average
replenishment lead time, its variability, or both.
5. Use conservative initial provisioning. For Class A items that have a very high v value and a
relatively low D value the initial provisioning decision becomes particularly crucial. It is a good
idea to be conservative in initial provisioning, to reduce the chance of overstocking.
6. Review decision parameters frequently
7. Determine precise values of control quantities
8. Confront shortages as opposed to setting service levels. Because Class A spares are reviewed
frequently, it is possible to operate with very little on‐hand stock (that is, low safety stock) and
make sure the replenishment can be done very fast.
The C category, or so‐called cats and dogs, usually represents an appreciable percentage of the total
number of different spares, but a very small fraction of the total investment in euros (Silver, Pyke, &
Peterson, 1998) . There are two choices for selecting a review interval for a C item:
1. Periodic review with a relatively long interval
2. Continuously review but with a mechanism for triggering orders that requires neither a physical
stock count nor the manual updating of the stock status.

Page | 76
The different approaches for VED and FSN are similar to ABC. Fast‐moving spares need more control and
observation than the non‐moving spares and using (r,q) or (s,S) can be very beneficial for the fast‐
movers. (Roy & Guin, 1999)
Vital and essential spares also need most of the observations and attention and their results should be
rechecked often. For desirable items should be tried to maintain minimal stock. If spares can be in the
warehouse within 2 hours and there is no downtime when they are needed, then there is no need for
stock. (Devnani, Gupta, & Nigah, 2010)
Of the three methods, ABC is the most famous, but that does not mean that the other two methods are
not needed. A combination of ABC and VED as done by Devnani, Gupta and Nigah (2010) can be very
beneficial, because class A products can also be very expensive parts with a very low demand, or there
can be Class B or C spares that are vital to the production line and a shortage results in immediate
downtime. (Devnani, Gupta, & Nigah, 2010)
Concluding, it is good to divide spares in different categories, but a combination of different methods
gives even better results. A combination of VED and FSN for example shows if a spare has a high demand
or is vital to the organization, instead of only the importance for the company.

Page | 77
Appendix 5: Inventory control In this appendix, inventory control literature is discussed that can be used at SU Oss. As mentioned in
the conclusion of the problem tree in Chapter 2, inventory control is not the core problem of this report,
and this is why it is investigated last. The solutions and alternatives of this research will not involve new
inventory control policies, but because some inventory control subjects are important to understand the
other alternatives, several subjects are investigated in this section.
Decision making in procurement of inventory management is a problem of coping with large numbers
and with a diversity of external and internal factors to the organization. Given that a specific item is to
be stocked at a particular location, four basic issues must be resolved:
1. How often the inventory status should be determined
2. When a replenishment order should be placed
3. How large the replenishment order should be
4. How the safety stock level should be determined
First, some definitions are given that are used in the rest of this section.
Definitions Before inventory control policies are revisited, some definitions are given (Silver et al., 1998) (Hopp &
Spearman, 2008) (Muckstadt, 2005) (Sherbrooke, 2004):
‐ On‐hand inventory: number of spares on stock in the warehouse
‐ Backorders: number of spares that are needed, not on stock, and ordered.
‐ Replenishment order: purchasing order of spare parts
‐ Net inventory level: On‐hand inventory minus backorder level
‐ Inventory position: on‐hand inventory minus backorder level + replenishment orders
‐ Cycle stock: inventory held to avoid excessive replenishment costs
‐ Safety stock: inventory held to avoid stock outs
‐ Replenishment lead time (L) is defined as the time that elapses from the moment at which it is
decided to place an order, until it is physically on the shelf ready to satisfy customer demand.
‐ T = review period, i.e., the time interval between reviews.
How often the inventory status should be determined The determination of the number of times the inventory status should be checked can be done on
several ways. In this section, they are divided in push vs. pull, and review periods.
Push vs. Pull
The TW of SU Oss uses MRP runs to check which spares should be ordered, which is referred to as a
push system according to Hopp & Spearman (2008). The key insight MRP can be stated as follows:
dependent demand is different from independent demand. Production to meet dependent demand
should be scheduled so as to explicitly recognize its linkage to production to meet independent demand.

Page | 78
The father of JIT, Taiichi Ohno, used the terms push and pull only in a very general sense:
“Manufacturers and workplaces can no longer base production on desktop planning alone and then
distribute, or push, them onto the market. It has become a matter of course for customers, or users, each
with a different value system, to stand in the frontline of the marketplace and, so to speak, pull the
goods they need, in the amount and at the time they need them” (Ohno, 1988).
Conclusion, for a spare parts warehouse, a hybrid approach is possible. The trays with expensive and/or
slow‐moving spare parts are controlled on a pull basis. The fast‐moving spares are refilled when they
reach its reorder point and the MRP run detects that. For the number of times the inventory status
should be determined, the review period s are used and is described in the next section.
Review periods
An inventory control system can be designed so that the inventory position is monitored continuously or
periodically. Continuously means that the inventory position is monitored non‐stop, while periodically
means that the inventory position is checked every review period (T).
At continuous review, as soon as the inventory position is sufficiently low, an order is triggered. The
triggered order is delivered after a certain lead‐time. The lead‐time is the time from the ordering
decision until the ordered amount is available on shelf. An alternative to continuous review is to
consider the inventory position only at certain given points in time. In general, the intervals between
these reviews are constant and we talk about periodic review.
Continuous review is a faster method, because there are continuously reviews and not only per T. If T is
very short, it becomes similar to continuous review (Axsäter, 2006). In Oss, the stock status is reviewed
continuously by the stock levels in SAP. The MRP run is done overnight, so the review period is one day.
When should a replenishment order be placed and how large should the order be? The second and third basic issues of purchasing control are described in one section, because they are
dependent. The purchasing policies should look at the following points: reorder times and quantities of
spares, the lead time of ordering spares and the minimum / maximum amount of spares that should be
in the warehouse. To determine these points, three categories distribution inventory control policies are
described (Frazelle, 2002).
Manual inventory control
The most common manual inventory control systems are manual two‐bin systems and visual review.
The manual two‐bin system is similar to the system at home to control the flow of potato chips or milk.
The advantage is its simplicity, where the disadvantage is the lack of reliability when discipline is a
problem. With visual review, the on‐hand inventory in each location is visually inspected and based on
the inspector’s judgment and/or using visual aids a replenishment order for an item may be placed.
Visual review is common in small retail outlets and warehouses that lack the technology required to
support automated inventory control policies. Both systems are based on manual control and therefore
not applicable for SU Oss.

Page | 79
Basic replenishment schemes
There are four basic replenishment designs in use in literature; continuous review (r, Q) policy,
continuous review (s,S) policy, periodic review (R,S) policy, and the (R,s,S) system
The most well‐known result in the whole inventory control area may be the classical economic order
quantity (EOQ) formula. This simple result has had and still has an enormous number of practical
applications. It was first derived by Harris (1913), but Wilson (1934) is also recognized in connection with
this model. (Harris, 1913) (Wilson, 1934)
The EOQ formula is shown in Figure 10, where K (ordering cost), D (demand per year), and h (holding
cost per year) are used to calculate EOQ, which is the optimal reorder level. The optimal reorder level is
used as Q. The EOQ model involves the following costs: ordering, setup, purchasing, holding and stock
out costs.
Figure 10: The EOQ formula (source: Winston (2003), Harris (1913))
‐ Continuous review (r, Q) policy
When the inventory position declines to or below the reorder point r, a batch quantity of size Q is
ordered. (If the inventory position is sufficiently low it may be necessary to order more than one batch
to get above r, the considered policy is therefore sometimes also denoted (r, nQ) policy
‐ Continuous review (s,S) policy
In the best (r,q) policy, it is assumed that an order could be placed exactly at the point when the
inventory level reached the reorder point r. It is however possible that a demand for more than one unit
can arrive between reaching r and the refill. At that moment, the inventory level is below r, and the
expected inventory level at the beginning of an inventory cycle is incorrect. To solve that problem, the
(s,S) policy is made. To implement an (s,S) policy, an order is placed whenever the inventory level is less
than or equal to s. The size of the order is sufficient to raise the inventory level to S (assuming zero lead
time) (Winston, 2003).
‐ Periodic Review (R,S) policy
The difference between the periodic review policies and the continuous review policies is already
explained at the review period. Every R units of time, the on‐hand inventory level is reviewed and an
order is placed to bring the on order inventory level up to S. For example, if a (0.25,100) policy is used,
every quarter of the year the on‐hand inventory (i) is reviewed and if i is lower than 100 units are on
hand, 100‐i units are ordered.

Page | 80
‐ Periodic Review (R,s,S) policy
This is a combination of (s,S) and (R,S) systems, where the idea is to check the inventory position every R
units of time. If the inventory position is at or below the reorder point s, an order is done to raise the
inventory to S. If the position is above s, nothing is done until at least the next review. The (s,S) case is
the special case where R=0 and (R,S) is the special case where s = S‐1.
Advanced control policies
There are three main advanced control policies, which are defined as the joint replenishment program,
the distribution requirements planning, and continuous replenishment program (Frazelle, 2002). All
systems are based on decentralized systems, so not applicable for SU Oss.
How to determine the safety stock level Next to the replenishment schemes and the reorder points and values, it is very important to determine
the safety stock level of the spares. If demand is constant and the lead time is zero, then safety stock is
not necessary, but that does not apply for SU Oss. In different methods, one of the recurring costs is the
cost of shortages and backorders (Silver et al., 1998) (Axsäter, 2006). At SU Oss, the cost of a shortage is
difficult to determine, because the client is Unilever itself and not all spares are vital for the production
lines and result in downtime.
Conclusion of inventory control for Unilever SU Oss The use of proper inventory control policies influences the stock levels of the SKUs. Safety stocks are
needed to ensure a good fill rate and decrease the chance for downtime because a lack of spare parts.
Having a good replenishment scheme, having good reorder points and levels, is beneficial for Unilever
SU Oss, but is something that has to be implemented after the first organization and structure steps.
Having the optimal r and q for example can be beneficial for the stock levels, but with low discipline and
high numbers of DSS this does not result in optimal results.
Page | 81
Appendix 6: Comparable companies Unilever Sourcing Unit Oss is, as mentioned in the first and second chapter of this report, a factory
where savoury food products are made. Industry classification is quite hard for SU Oss, because they
have different types of products. The sausages belong to category C1010, which stands for “Processing
and preserving of meat” according to ISIC (International Standard Industrial Classification of All
Economic Activities) Rev.4 (United Nations Statistics Division, 2012). Soups and sauces are harder to
classify, but also belong to category C10 “Manufacture of food products”.
Sausages, soups and sauces are indeed food products, but when comparing SU Oss to other companies
other product types could also be investigated. The products of SU Oss are fast moving consumer goods,
while the production line of sausages could be compared with a production line of televisions or
chemical products. Televisions and chemical products are totally different products, but they could have
the same production line.
Comparing foods with chemicals can be done based on the three major production parts; making the
product, filling the product and packaging the product. The mixing and blending of Oss can be compared
with the production of the chemicals, and both could use the same bottle to be filled and have similar
lines for packaging.
Next, SU Oss must be compared with a company who also has a lot of turnovers. The production line of
soup has 20 to 50 turnovers and therefore setups per week, which costs a lot of time. Comparing SU Oss
with another company with a lot of turnovers can be beneficial.
Last, the production line must be non‐critical. If the production line has downtime or the products have
problems, at SU Oss there is no big problem as there would be when they would make airplanes.
Breakdowns and downtime at an airplane could endanger human lives, when cannot be said directly
from breakdowns at the production lines at SU Oss.
Summarizing the points before, the companies to compare SU Oss to must be one (or more) of the
following:
‐ Processing and preserving of meat
‐ Fast moving consumer goods
‐ Production line with a lot of turnovers
‐ Non critical production line
The following companies are visited:
‐ Unilever SU Rotterdam
‐ Heineken Den Bosch
‐ Johma Losser

Page | 82
Appendix 7: Interview questions for visiting other warehouses (Dutch) Algemene vragen (voor beschrijven van de situatie)
‐ Hoeveel spares liggen er op voorraad? ‐ Hoeveel verschillende spares liggen er op voorraad? ‐ Op hoeveel locaties liggen er spares op voorraad? ‐ Strategische voorraad en hoe bepaald.
Centrale of decentrale voorraad
‐ Is er gekozen voor decentrale of centrale voorraad en waarom? ‐ Zijn er verschillende productielijnen die een eigen voorraad zouden kunnen hebben? ‐ Liggen er onderdelen bij de productielijnen?
ERP systeem
‐ Hoe wordt de voorraad beheerd, elektronisch of op papier? ‐ Indien elektronisch, wordt hier een ERP systeem of Excel voor gebruikt?
o Indien ERP, welke mogelijkheden heeft het systeem voor voorraadbeheer? o Indien Excel, hoe wordt dit gedaan? o In beide gevallen; Hoe wordt dit beheerd?
‐ Indien papier, waarom is hier voor gekozen? ‐ Wordt er gebruik gemaakt van scanners, RFID, of Barcode lezers?
Afboeken
‐ Hoe worden de spares afgeboekt? ‐ Door wie? ‐ Hoeveel mensen kunnen er afboeken?
Misgrijpen
‐ Wordt de voorraad (regelmatig) geteld? o Zo ja, hoe vaak en door wie allemaal?
Methode ABC ranking? Tellen automatisch door systeem aangegeven
o Zo nee, waarom niet? In hoeverre is de voorraad accuraat?
‐ Is er sprake van misgrijpen? o Hoe worden deze voorkomen? o Is er een beloning/straf systeem voor misgrijpen?
Beheer
‐ Hoe wordt de voorraad beheerd? o Door hoeveel mensen? o Hoeveel uur per dag?
‐ Hoeveel mensen kunnen het magazijn in? ‐ Hoe ziet de organisatiestructuur er uit? ‐ Hoe wordt het financieel beheerd? Incentives, vooraf betalen, verschilboekingen.
Technische dienst
‐ Kunnen de (storings)monteurs ook in het magazijn?

Page | 83
‐ Worden er (veel) spares gerepareerd en wat is het beleid hiervoor? ‐ Is de technische dienst eigenaar van het magazijn en/of wat is de betrokkenheid? ‐ Zijn er dagdienstmonteurs, storingsmonteurs, area‐monteurs of andere soorten monteurs?
Bestellen
‐ Wordt er gebruik gemaakt van automatisch of handmatig bestellen? (en waarom) ‐ Worden bestelhoeveelheden en bestelmomenten vastgesteld door gegevens, literatuur of
ervaring? ‐ Is er sprake van een minimale voorraadbeleid of risicovermijdend door alles (meerdere malen)
op voorraad te hebben? ‐ Wie bepaalt welke onderdelen een spare krijgen, productie, TD of samen? ‐ Gebeurt dit op basis van gevoel of met onderbouwing?
Oude parts en nieuwe machines
‐ Wat is het beleid t.a.v. spares bij het aanschaffen van een nieuwe machine? o Wordt er gekeken naar de spares die al aanwezig zijn? o Worden machines besteld die al aanwezig zijn of altijd de nieuwst mogelijke ?
‐ Wat wordt er gedaan met een oude machine en haar parts/spares? ‐ Wordt er bijgehouden welke spares er al jaren niet meer gebruikt zijn? ‐ Wordt de kwaliteit van oude spares in de gaten gehouden? ‐ Hoe wordt om gegaan met spares die niet meer ondersteund worden? ‐ Hoe wordt om gegaan met spares die een upgrade krijgen en daardoor andere montage maten.
Locaties in het magazijn
‐ Hoe lang doet men erover om een spare te vinden in het magazijn? ‐ Hoe worden spares en de locaties aangegeven? ‐ Staat alles per machine, per afdeling of anders (en waarom)? ‐ Liggen de spares gesorteerd via ABC methode, op leeftijd of anders (en waarom)?
Onderhoud
‐ Wordt er gebruik gemaakt van breakdown, preventief of een andere vorm van onderhoud (en waarom)?
‐ Is er een goede koppeling tussen onderhoud en het magazijn? ‐ Wat gebeurt er met de onderdelen die van de lijn komen door onderhoud, intern gerepareerd,
extern gerepareerd of weggegooid (en waarom)? Testen van ideeën uit de literatuur
‐ Wordt er gebruik gemaakt van ABC ranking? ‐ Is er een system of item approach? ‐ Multi‐echelon optimization ‐ Centraal of decentrale voorraden
Technical & Implementation Manager:
‐ Hoe is het magazijn voor onderdelen georganiseerd aantal mensen, (in house of geoutsourced), openingstijden, waarde onderdelen t.o.v. de assetbase wat houdt men op voorraad en wat niet en tot op welk niveau, hoe komt men tot de keuze welke onderdelen op voorraad moeten liggen.

Page | 84
Appendix 8: Choice of MCDA Guitouni and Martel (1998) made a comprehensive list of some known multi criterion aggregation
procedures (MCAP) in there study (Guitouni & Martel, 1998). These methods can be assigned to one of
the three following categories: (i) the single synthesizing criterion approach without incomparability, (ii)
the outranking synthesizing approach and (iii) the interactive local judgements with trial‐and‐error
approach (Roy B. , Methodologie Multicritere d'Aide a la Decision, 1985). These categories are called by
Vincke (1989) (i) the multi attribute utility theory methods, (ii) the outranking methods and (iii) the
interactive methods (Vincke, 1989). Many other specifications and categorisations exist, so combining
the two categories and adding the “simple” methods, gives the following four types of MCDA: 1)
Elementary methods, 2) single synthesizing criterion, 3) outranking methods, and 4) mixed methods.
Before the categories are investigated, the term compensatory is explained.
Compensatory
Next to the different categories, we can state that any MCDA method can be either:
1. Compensatory: in this case, one admits that an absolute compensation between the different
evaluations can exist. Hence, a good performance on one criterion can easily counterbalance a poor one
on another. There exist many methods that can fall into this category like the weighted sum.
2. Non‐compensatory: no compensation is accepted between the different dimensions. The decision
method may state that the dimensions are important enough to refuse any kind of compensation or
tradeoffs. The lexicographic method is considered as a non‐compensatory method.
3. Partially compensatory: in this case, some kind of compensation is accepted between the different
dimensions or criteria. Most of the MCDA methods fall within this category. The major problem is to
evaluate the degree of compensation for each one.
Categories
Elementary methods
The elementary methods are the simple methods of MCDA. An example of an elementary method is
taking the weighted sum of all the scores. If all criteria can be made into indexed number, a comparison
can be made, but this method are used for SU Oss.
For SU Oss, it is important to score the alternatives on both their costs as well as their outputs, so they
cannot directly be combined to one type of score.
Single synthesizing criterion
Single synthesizing criterion methods have some of the most famous MCDA methods, which are fully
compensatory methods: SMART (Simple multi‐attribute rating technique), AHP (Analytic Hierarchy
Process) and MAUT (Multi‐attribute utility theory). These methods are used in the choice for a MCDA.
SMART is discussed in Appendix 14, AHP in Appendix 15, and MAUT in Appendix 16.
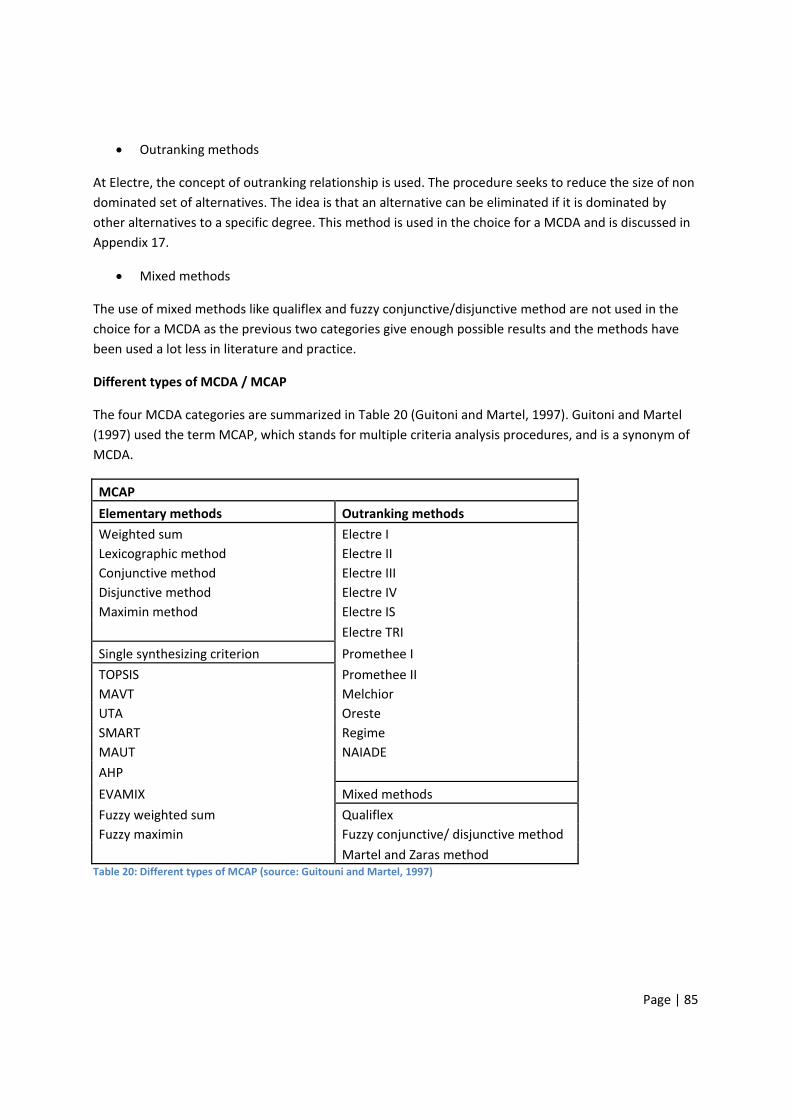
Page | 85
Outranking methods
At Electre, the concept of outranking relationship is used. The procedure seeks to reduce the size of non
dominated set of alternatives. The idea is that an alternative can be eliminated if it is dominated by
other alternatives to a specific degree. This method is used in the choice for a MCDA and is discussed in
Appendix 17.
Mixed methods
The use of mixed methods like qualiflex and fuzzy conjunctive/disjunctive method are not used in the
choice for a MCDA as the previous two categories give enough possible results and the methods have
been used a lot less in literature and practice.
Different types of MCDA / MCAP
The four MCDA categories are summarized in Table 20 (Guitoni and Martel, 1997). Guitoni and Martel
(1997) used the term MCAP, which stands for multiple criteria analysis procedures, and is a synonym of
MCDA.
MCAP
Elementary methods Outranking methods
Weighted sum Electre I
Lexicographic method Electre II
Conjunctive method Electre III
Disjunctive method Electre IV
Maximin method Electre IS
Electre TRI
Single synthesizing criterion Promethee I
TOPSIS Promethee II
MAVT Melchior
UTA Oreste
SMART Regime
MAUT NAIADE
AHP
EVAMIX Mixed methods
Fuzzy weighted sum Qualiflex
Fuzzy maximin Fuzzy conjunctive/ disjunctive method
Martel and Zaras method Table 20: Different types of MCAP (source: Guitouni and Martel, 1997)
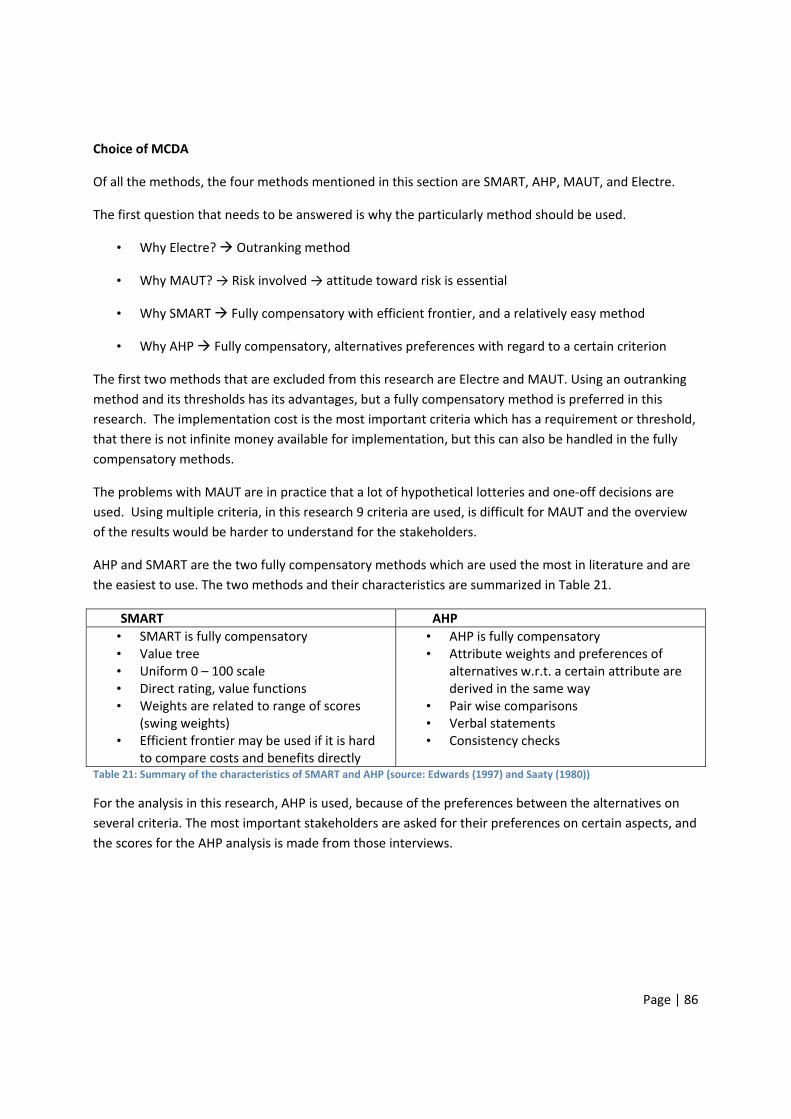
Page | 86
Choice of MCDA
Of all the methods, the four methods mentioned in this section are SMART, AHP, MAUT, and Electre.
The first question that needs to be answered is why the particularly method should be used.
• Why Electre? Outranking method
• Why MAUT? → Risk involved → attitude toward risk is essential
• Why SMART Fully compensatory with efficient frontier, and a relatively easy method
• Why AHP Fully compensatory, alternatives preferences with regard to a certain criterion
The first two methods that are excluded from this research are Electre and MAUT. Using an outranking
method and its thresholds has its advantages, but a fully compensatory method is preferred in this
research. The implementation cost is the most important criteria which has a requirement or threshold,
that there is not infinite money available for implementation, but this can also be handled in the fully
compensatory methods.
The problems with MAUT are in practice that a lot of hypothetical lotteries and one‐off decisions are
used. Using multiple criteria, in this research 9 criteria are used, is difficult for MAUT and the overview
of the results would be harder to understand for the stakeholders.
AHP and SMART are the two fully compensatory methods which are used the most in literature and are
the easiest to use. The two methods and their characteristics are summarized in Table 21.
SMART AHP
• SMART is fully compensatory • Value tree • Uniform 0 – 100 scale • Direct rating, value functions • Weights are related to range of scores
(swing weights) • Efficient frontier may be used if it is hard
to compare costs and benefits directly
• AHP is fully compensatory • Attribute weights and preferences of
alternatives w.r.t. a certain attribute are derived in the same way
• Pair wise comparisons • Verbal statements • Consistency checks
Table 21: Summary of the characteristics of SMART and AHP (source: Edwards (1997) and Saaty (1980))
For the analysis in this research, AHP is used, because of the preferences between the alternatives on
several criteria. The most important stakeholders are asked for their preferences on certain aspects, and
the scores for the AHP analysis is made from those interviews.

Page | 87
Appendix 9: AHP Analytic Hierarchy Process (AHP) (Saaty, 1980) is a fully compensatory method. The main goal of AHP is
to find out which alternative scores the best on several criteria, where these criteria all have weights
and the criteria are scored on relative importance per alternative. In this appendix, AHP is explained by
using the steps of the AHP process, using examples to clarify.
1. Decision maker(s)
The first steps of the AHP method are one or more decision maker(s). The decision makers need to have
preferences regarding the alternative on several criteria. In this research, the ten stakeholders are all
used.
2. Alternatives (added to value tree)
The second steps are the alternatives. The alternatives that are used in this research are the same type
as the criteria used in AHP. In this research there are six alternatives which have to be analysed.
3. Attributes
To find the ideal situation, several attributes are used. The attributes AHP uses are the criteria of this
research, which are the decision making values. The score on all criteria combined results in the final
score, so all criteria or attributes are relevant.
4. Measure performance of alternatives on attributes
Measuring the performance of the alternatives on the criteria can be done on several ways. In this
research, the input variables are all based on the amount of Euros the alternative will cost based on that
criterion. So for example, the criteria “implementation cost” looks at the costs that are needed for the
implementation, which is the purchase of barcodes and scanners for the barcodes alternative.
The decision makers compare the alternatives on the criteria and tell if alternative A is preferred over
alternative B. This can be done by giving it different scores, between equally important and very strongly
important. For example, if coffee machine A makes very good coffee, and coffee machine B makes not
so good coffee, coffee machine A is preferred very strongly over coffee machine B on the criterion taste
of the coffee.
5. Weight of attributes
The weight of attributes calculates the weight a criterion gets for the analyses. A more important
criterion will receive an higher weight than a less important one. The calculation is equal to the
calculation for the scores of the criteria, so the explanation is done here.
Calculation of the weights and scores
As mentioned at the fourth step, the comparison between two criteria has to be recalculated to values.
The preferences of the stakeholders are used and for the coffee machines example, machine A is
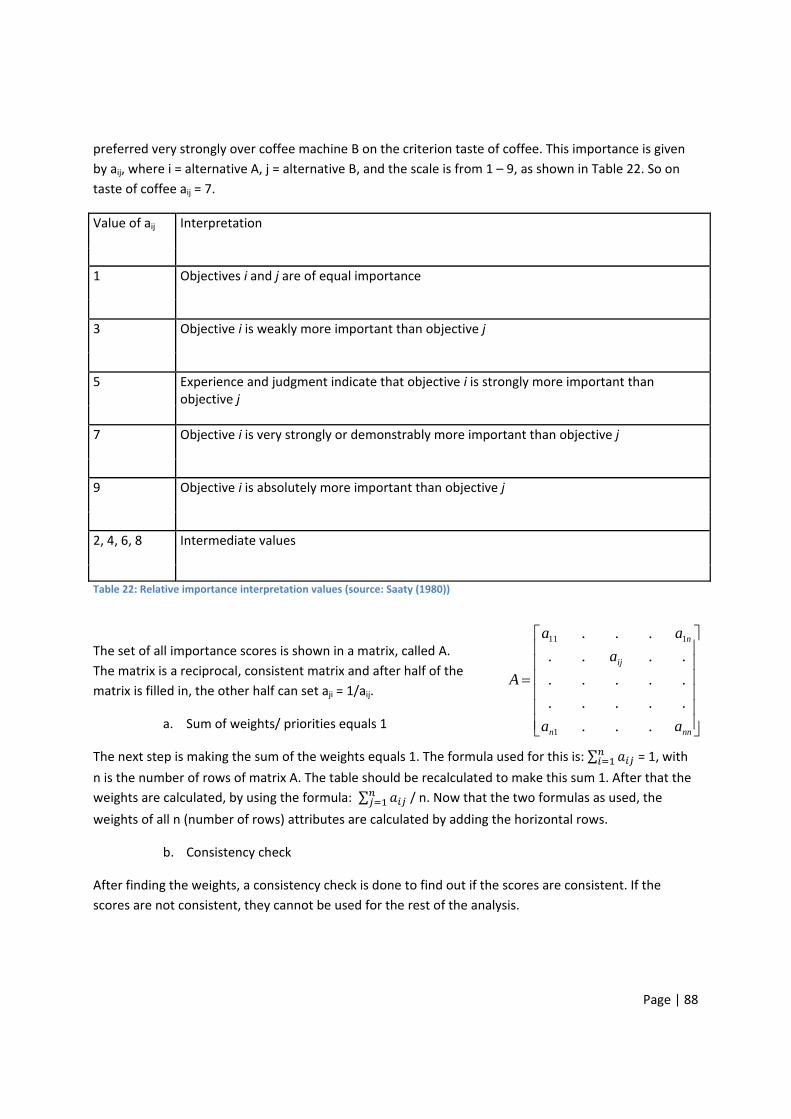
Page | 88
preferred very strongly over coffee machine B on the criterion taste of coffee. This importance is given
by aij, where i = alternative A, j = alternative B, and the scale is from 1 – 9, as shown in Table 22. So on
taste of coffee aij = 7.
Value of aij Interpretation
1 Objectives i and j are of equal importance
3 Objective i is weakly more important than objective j
5 Experience and judgment indicate that objective i is strongly more important than objective j
7 Objective i is very strongly or demonstrably more important than objective j
9 Objective i is absolutely more important than objective j
2, 4, 6, 8 Intermediate values
Table 22: Relative importance interpretation values (source: Saaty (1980))
The set of all importance scores is shown in a matrix, called A.
The matrix is a reciprocal, consistent matrix and after half of the
matrix is filled in, the other half can set aji = 1/aij.
a. Sum of weights/ priorities equals 1
The next step is making the sum of the weights equals 1. The formula used for this is: ∑ = 1, with
n is the number of rows of matrix A. The table should be recalculated to make this sum 1. After that the
weights are calculated, by using the formula: ∑ / n. Now that the two formulas as used, the
weights of all n (number of rows) attributes are calculated by adding the horizontal rows.
b. Consistency check
After finding the weights, a consistency check is done to find out if the scores are consistent. If the
scores are not consistent, they cannot be used for the rest of the analysis.
nnn
ij
n
aa
a
aa
A
...
.....
.....
....
...
1
111

Page | 89
• Determine eigenvalue max , which is the sum of the weights of the attributes multiplied by the
sum of the normalized score. In 5c, an explanation is done, which shows how the eigenvalue is
calculated.
• Next, the consistency index (CI) has to be calculated and compared with the random index (RI)
• CI = (max – n)/(n – 1)
• Compare CI with the random index (RI), which is shown in Table 23.
• Degree of consistency is satisfactory in case the consistency ratio CR = CI/RI < 0.10
n 2 3 4 5 6 7 8 9 10
RI 0.00 0.58 0.90 1.12 1.24 1.32 1.41 1.45 1.49
Table 23: Random index values (n = 2,...,10) for AHP (source: Winston, 2004)
c. Example
A decision has to be made for the purchase of a new coffee machine. There are three possible new
coffee machines, X, Y, and Z. One of the criteria is taste of coffee others are costs and looks of the
machine. The decision maker decided that costs is moderately preferred to taste of coffee and very
strongly preferred to looks of the machine. In turn, taste is strongly to very strongly preferred to looks.
This results in the following table A:
Taste Costs Looks
Taste 1 1/3 6
Costs 3 1 7
Looks 1/6 1/7 1
Sum of the weights equals 1, so the columns should sum to 1:
Taste Costs Looks
Taste 6/25 7/31 6/14
Costs 18/25 21/31 7/14
Looks 1/25 3/31 1/14
The weight of taste is therefore= (6/25+7/31+614)/3 = 0,298. Costs and looks get therefore 0,632 and
0,069 respectively. The sum of the normalized scores of taste is 4,166 (1+3+ 1/6), and costs and looks
score 1,48 and 14 respectively.
The largest eigenvalue λmax is therefore (0,298 * 4,166) + (0,632 * 1,483) + (0,069 * 14) = 3,145.
Consistency check gives ((3,145‐3)/2)/0,58 = 0,072. Because this is lower than 0,1, the results are
consistent.
Page | 90
6. Ranking
In the ranking stage of AHP, the alternatives are ranked based on their scores, and the provisional
decision can be made based on this ranking. The weights of the criteria are multiplied by the scores of
the alternatives and those scores are summed per alternative. At the end, six total scores will show, and
the highest score is ranked number 1. This decision can be checked by doing a sensitivity analysis, which
checks if the results change if several weights change.

Page | 91
Appendix 10: Weights of the criteria As mentioned in Section 4.3, the weights of the criteria are calculated by using four steps:
1. Stakeholder analysis 2. Interest 3. Scores 4. Weights of the criteria
Stakeholder Analysis
The first step is using the stakeholder analysis, as shown in Section 2.2.3, which is shown in Figure 11,
where the ten stakeholders are shown as numbers. In Table 24, the numbers and names of the
stakeholders are shown.
High 8 10 7
9 2
Power 10
4 3 1
Low 5
6
Low Level of Interest High
Figure 11: Stakeholder analysis (source: Unilever SU Oss)
Interest
The next step is using the level of interest of the stakeholders to calculate the weights of the
stakeholders for determining the weights of the criteria for the AHP analysis. The interest numbers are
the location in the stakeholder analysis of Figure 11, where 1 is the lowest level of interest and 6 is the
score for the highest level of interest.
Stakeholder Interest Weight
1: TW administrators 6 0,146
2: Maintenance Manager 6 0,146
3: TD personnel 5 0,122
4: Work preparor 4 0,097
5: First operator 2 0,049
6: Toppers 2 0,049
7: T&I Manager 6 0,146
8: Management Team 2 0,049
9: Production leaders 3 0,073
10: Operations Manager 5 0,122
Total 41 1Table 24: Stakeholders, their interests, and the weights for calculation the weights of the criteria for the AHP analysis (source: Unilever SU Oss)
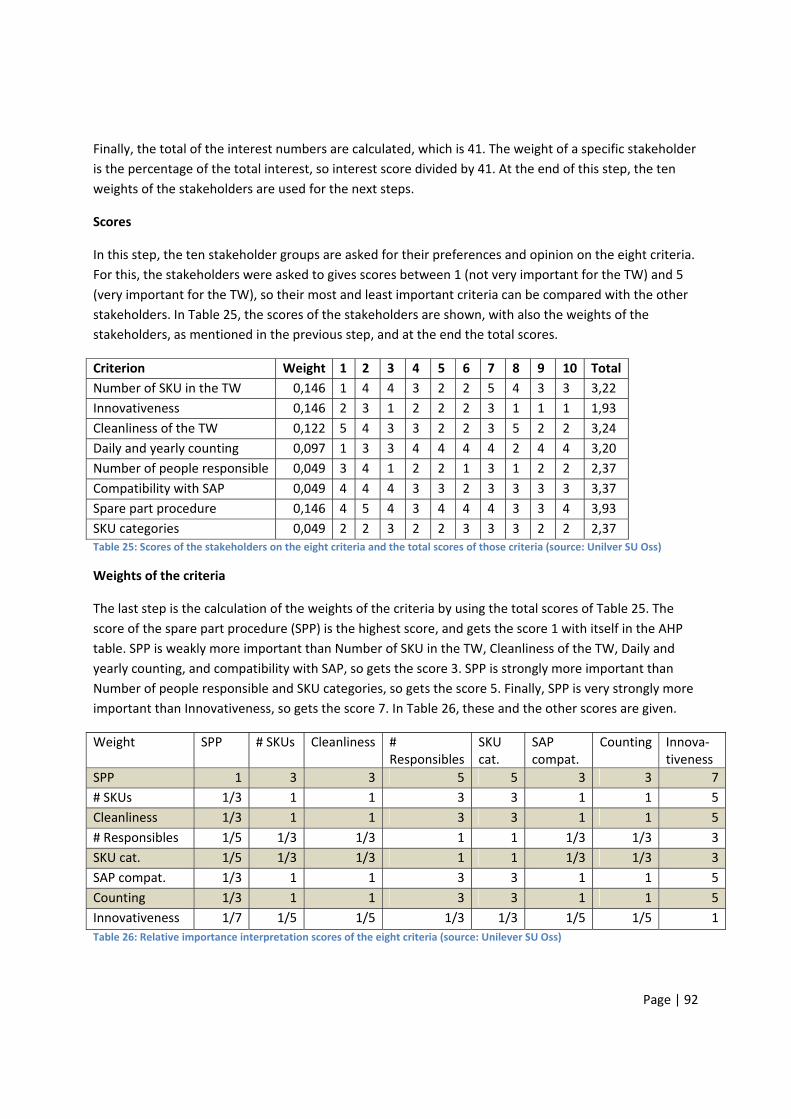
Page | 92
Finally, the total of the interest numbers are calculated, which is 41. The weight of a specific stakeholder
is the percentage of the total interest, so interest score divided by 41. At the end of this step, the ten
weights of the stakeholders are used for the next steps.
Scores
In this step, the ten stakeholder groups are asked for their preferences and opinion on the eight criteria.
For this, the stakeholders were asked to gives scores between 1 (not very important for the TW) and 5
(very important for the TW), so their most and least important criteria can be compared with the other
stakeholders. In Table 25, the scores of the stakeholders are shown, with also the weights of the
stakeholders, as mentioned in the previous step, and at the end the total scores.
Criterion Weight 1 2 3 4 5 6 7 8 9 10 Total
Number of SKU in the TW 0,146 1 4 4 3 2 2 5 4 3 3 3,22
Innovativeness 0,146 2 3 1 2 2 2 3 1 1 1 1,93
Cleanliness of the TW 0,122 5 4 3 3 2 2 3 5 2 2 3,24
Daily and yearly counting 0,097 1 3 3 4 4 4 4 2 4 4 3,20
Number of people responsible 0,049 3 4 1 2 2 1 3 1 2 2 2,37
Compatibility with SAP 0,049 4 4 4 3 3 2 3 3 3 3 3,37
Spare part procedure 0,146 4 5 4 3 4 4 4 3 3 4 3,93
SKU categories 0,049 2 2 3 2 2 3 3 3 2 2 2,37 Table 25: Scores of the stakeholders on the eight criteria and the total scores of those criteria (source: Unilver SU Oss)
Weights of the criteria
The last step is the calculation of the weights of the criteria by using the total scores of Table 25. The
score of the spare part procedure (SPP) is the highest score, and gets the score 1 with itself in the AHP
table. SPP is weakly more important than Number of SKU in the TW, Cleanliness of the TW, Daily and
yearly counting, and compatibility with SAP, so gets the score 3. SPP is strongly more important than
Number of people responsible and SKU categories, so gets the score 5. Finally, SPP is very strongly more
important than Innovativeness, so gets the score 7. In Table 26, these and the other scores are given.
Weight SPP # SKUs Cleanliness # Responsibles
SKU cat.
SAP compat.
Counting Innova‐ tiveness
SPP 1 3 3 5 5 3 3 7
# SKUs 1/3 1 1 3 3 1 1 5
Cleanliness 1/3 1 1 3 3 1 1 5
# Responsibles 1/5 1/3 1/3 1 1 1/3 1/3 3
SKU cat. 1/5 1/3 1/3 1 1 1/3 1/3 3
SAP compat. 1/3 1 1 3 3 1 1 5
Counting 1/3 1 1 3 3 1 1 5
Innovativeness 1/7 1/5 1/5 1/3 1/3 1/5 1/5 1
Table 26: Relative importance interpretation scores of the eight criteria (source: Unilever SU Oss)

Page | 93
Appendix 11: Calculations at the analysis In this appendix, the calculation of the weights and the criteria of the analysis of Chapter 4 are done.
The calculations start with the weight of the criteria and then the ten criteria. The criteria and their
relative importance interpretation values are calculated in three steps:
Step 1: finding a factor to compare (plusses, Euros, or minutes)
Step 2: Relative importance interpretation values
Step 3: Determine results on the criterion of the alternatives
Step 4: Consistency check
The method that is used in this calculation is AHP, which is shown in Appendix 15.
Weights of the criteria Step 1:
Criterion Weight 1 2 3 4 5 6 7 8 9 10 Total
Number of SKU in the TW 0,146 1 4 4 3 2 2 5 4 3 3 3,22
Innovativeness 0,146 2 3 1 2 2 2 3 1 1 1 1,93
Cleanliness of the TW 0,122 5 4 3 3 2 2 3 5 2 2 3,24
Daily and yearly counting 0,097 1 3 3 4 4 4 4 2 4 4 3,20
Number of people responsible 0,049 3 4 1 2 2 1 3 1 2 2 2,37
Compatibility with SAP 0,049 4 4 4 3 3 2 3 3 3 3 3,37
SPP 0,146 4 5 4 3 4 4 4 3 3 4 3,93
SKU categories 0,049 2 2 3 2 2 3 3 3 2 2 2,37
Step 2:
Weight SPP # SKUs Cleanliness # Responsibles
SKU cat.
SAP compat.
Counting Innovativeness
SPP 1 3 3 5 5 3 3 7
# SKUs 1/3 1 1 3 3 1 1 5
Cleanliness 1/3 1 1 3 3 1 1 5
# Responsibles 1/5 1/3 1/3 1 1 1/3 1/3 3
SKU cat. 1/5 1/3 1/3 1 1 1/3 1/3 3
SAP compat. 1/3 1 1 3 3 1 1 5
Counting 1/3 1 1 3 3 1 1 5
Innovativeness 1/7 1/5 1/5 1/3 1/3 1/5 1/5 1

Page | 94
Step 3:
Weight SPP # SKUs Cleanliness# Responsibles
SKU cat.
SAP compat. Counting Innovativeness
SPP 0.35 0.38 0.38 0.26 0.26 0.38 0.38 0.21
# SKUs 0.12 0.13 0.13 0.16 0.16 0.13 0.13 0.15
Cleanliness 0.12 0.13 0.13 0.16 0.16 0.13 0.13 0.15
# Responsibles 0.07 0.04 0.04 0.05 0.05 0.04 0.04 0.09
SKU cat. 0.07 0.04 0.04 0.05 0.05 0.04 0.04 0.09
SAP compat. 0.12 0.13 0.13 0.16 0.16 0.13 0.13 0.15
Counting 0.12 0.13 0.13 0.16 0.16 0.13 0.13 0.15
Innovativeness 0.05 0.03 0.03 0.02 0.02 0.03 0.03 0.03
Step 4:
Consistency check
Before the weights can be used, a consistency check is made. In the explanation of AHP in Appendix 11,
the total procedure is given, but the three main steps are described here briefly.
1. Approximation for wmax : the values of
Criteria SPP # SKUs Cleanliness # Responsibles
SKU cat. SAP compat.
Counting Innova‐ tiveness
Weight 0.32 0.14 0.14 0.05 0.05 0.14 0.14 0.03
2. Table 12 are the approximations
3. Approximation for Δmax : 8.18
4. Consistency ratio
a. Consistency Index: (Δmax – n)/(n‐1) = 0.03
b. Random index: 1.41
c. Consistency ratio: 0.03 / 1.41 = 0.02
d. 0.02 is lower than 0.1, so the weights are consistent
Calculation of the relative importance interpretation values of the eight criteria which influence the chance of DSS on the six alternatives. Not all the four steps of the calculation of the relative importance interpretation values of the eight
criteria are given. The second step, the results, and the consistency check are given. Step 1 is already
given in Section 4.3.

Page | 95
1. Spare part procedure (SPP)
Current Plus Total sup Consignment Barcodes RFID Kanban Result
Current Plus 1 1/3 1 1/5 1/7 1/3 0.05
Total sup 3 1 3 1/3 1/5 1 0.11
Consignment 1 1/3 1 1/5 1/7 1/5 0.05
Barcodes 5 3 5 1 1/3 3 0.24
RFID 7 5 7 3 1 5 0.45
Kanban 3 1 3 1/3 1/5 1 0.11
Consistency check
• Δmax = 6.08
• CI = 0.02
• RI = 1.24 (n=6)
• CR = 0.01 < 0.10, so consistent.
2. Number of SKU in the TW
Current Plus Total sup Consignment Barcodes RFID Kanban Result
Current Plus 1 3 3 1 1 1 0.21
Total sup 1/3 1 1 1/3 1/3 1/3 0.07
Consignment 1/3 1 1 1/3 1/3 1/3 0.07
Barcodes 1 3 3 1 1 1 0.21
RFID 1 3 3 1 1 1 0.21
Kanban 1 3 3 1 1 1 0.21
Consistency check
• Δmax = 6.00
• CI = 0.00
• RI = 1.24 (n=6)
• CR = 0.00 < 0.10, so consistent.

Page | 96
3. Cleanliness of the TW
Current Plus Total sup Consignment Barcodes RFID Kanban Result
Current Plus 1 1/3 3 1 1 1 0.14
Total sup 3 1 5 3 3 3 0.38
Consignment 1/3 1/5 1 1/3 1/3 1/3 0.05
Barcodes 1 1/3 3 1 1 1 0.14
RFID 1 1/3 3 1 1 1 0.14
Kanban 1 1/3 3 1 1 1 0.14
Consistency check
• Δmax = 6.05
• CI = 0.0097
• RI = 1.24 (n=6)
• CR = 0.01 < 0.10, so consistent.
4. Number of people Responsible
Current Plus Total sup Consignment Barcodes RFID Kanban Result
Current Plus 1 1/5 1 1 1 1 0.10
Total sup 5 1 5 5 5 5 0.50
Consignment 1 1/5 1 1 1 1 0.10
Barcodes 1 1/5 1 1 1 1 0.10
RFID 1 1/5 1 1 1 1 0.10
Kanban 1 1/5 1 1 1 1 0.10
Consistency check
• Δmax = 6.00
• CI = 0.00
• RI = 1.24 (n=6)
• CR = 0.00 < 0.10, so consistent.

Page | 97
5. SKU categories
Current Plus Total sup Consignment Barcodes RFID Kanban Result
Current Plus 1 1 3 1/3 1/3 1/3 0.10
Total sup 1 1 3 1/3 1/3 1/3 0.10
Consignment 1/3 1/3 1 1/5 1/5 1/5 0.04
Barcodes 3 3 5 1 1 1 0.26
RFID 3 3 5 1 1 1 0.26
Kanban 3 3 5 1 1 1 0.26
Consistency check
• Δmax = 6.07
• CI = 0.0146
• RI = 1.24 (n=6)
• CR = 0.01 < 0.10, so consistent.
6. Compatibility with SAP
Current Plus Total sup Consignment Barcodes RFID Kanban Result
Current Plus 1 1/5 3 1/3 1/5 1 0.07
Total sup 5 1 7 3 1 5 0.33
Consignment 1/3 1/7 1 1/5 1/7 1/3 0.03
Barcodes 3 1/3 5 1 1/3 3 0.16
RFID 5 1 7 3 1 5 0.33
Kanban 1 1/5 3 1/3 1/5 1 0.07
Consistency check
• Δmax = 6.23
• CI = 0.0462
• RI = 1.24 (n=6)
• CR = 0.04 < 0.10, so consistent.
7. Daily counting

Page | 98
Current Plus Total sup Consignment Barcodes RFID Kanban Result
Current Plus 1 1/3 1 1/3 1/3 1/3 0.07
Total sup 3 1 3 1 1 1 0.21
Consignment 1 1/3 1 1/3 1/3 1/3 0.07
Barcodes 3 1 3 1 1 1 0.21
RFID 3 1 3 1 1 1 0.21
Kanban 3 1 3 1 1 1 0.21
Consistency check
• Δmax = 6.00
• CI = 0.00
• RI = 1.24 (n=6)
• CR = 0.00 < 0.10, so consistent.
8. Innovativeness
Current Plus Total sup Consignment Barcodes RFID Kanban Result
Current Plus 1 3 1/3 1/3 1/5 1/3 0.07
Total sup 1/3 1 1/5 1/5 1/7 1/5 0.04
Consignment 3 5 1 1 1/3 1 0.16
Barcodes 3 5 1 1 1/3 1 0.16
RFID 5 7 3 3 1 3 0.40
Kanban 3 5 1 1 1/3 1 0.16
Consistency check
• Δmax = 6.16
• CI = 0.0326
• RI = 1.24 (n=6)
• CR = 0.03 < 0.10, so consistent.
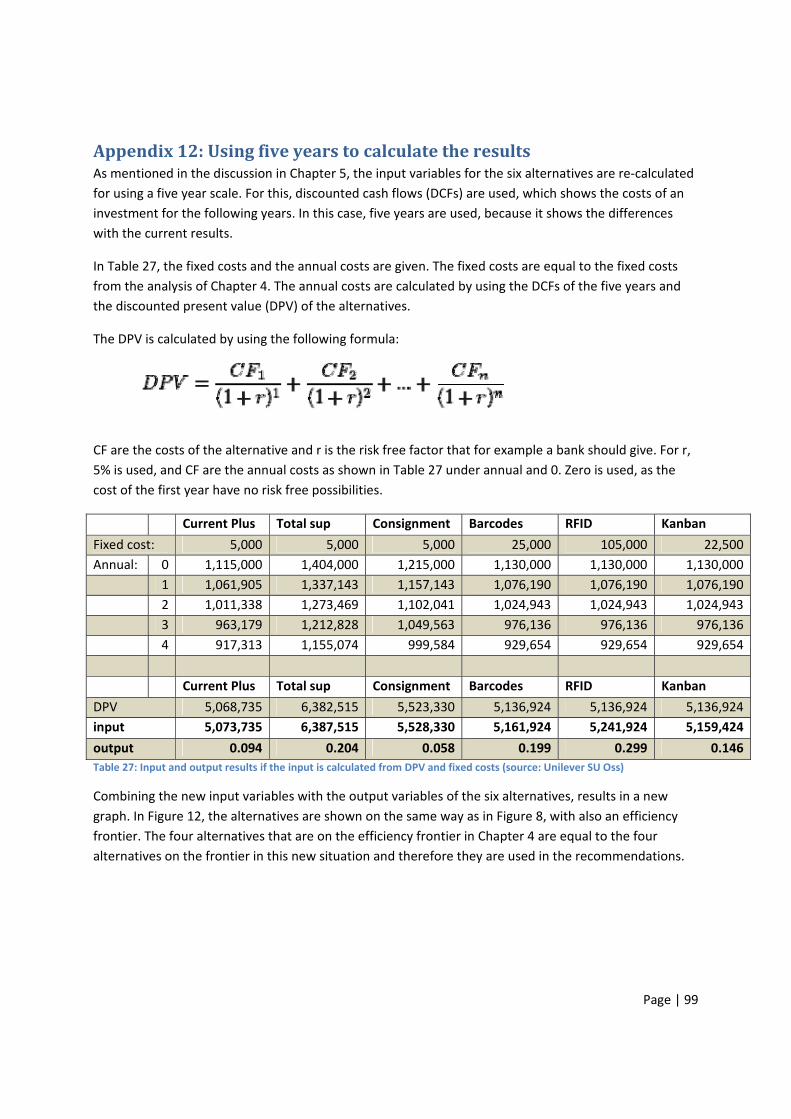
Page | 99
Appendix 12: Using five years to calculate the results As mentioned in the discussion in Chapter 5, the input variables for the six alternatives are re‐calculated
for using a five year scale. For this, discounted cash flows (DCFs) are used, which shows the costs of an
investment for the following years. In this case, five years are used, because it shows the differences
with the current results.
In Table 27, the fixed costs and the annual costs are given. The fixed costs are equal to the fixed costs
from the analysis of Chapter 4. The annual costs are calculated by using the DCFs of the five years and
the discounted present value (DPV) of the alternatives.
The DPV is calculated by using the following formula:
CF are the costs of the alternative and r is the risk free factor that for example a bank should give. For r,
5% is used, and CF are the annual costs as shown in Table 27 under annual and 0. Zero is used, as the
cost of the first year have no risk free possibilities.
Current Plus Total sup Consignment Barcodes RFID Kanban
Fixed cost: 5,000 5,000 5,000 25,000 105,000 22,500
Annual: 0 1,115,000 1,404,000 1,215,000 1,130,000 1,130,000 1,130,000
1 1,061,905 1,337,143 1,157,143 1,076,190 1,076,190 1,076,190
2 1,011,338 1,273,469 1,102,041 1,024,943 1,024,943 1,024,943
3 963,179 1,212,828 1,049,563 976,136 976,136 976,136
4 917,313 1,155,074 999,584 929,654 929,654 929,654
Current Plus Total sup Consignment Barcodes RFID Kanban
DPV 5,068,735 6,382,515 5,523,330 5,136,924 5,136,924 5,136,924
input 5,073,735 6,387,515 5,528,330 5,161,924 5,241,924 5,159,424
output 0.094 0.204 0.058 0.199 0.299 0.146
Table 27: Input and output results if the input is calculated from DPV and fixed costs (source: Unilever SU Oss)
Combining the new input variables with the output variables of the six alternatives, results in a new
graph. In Figure 12, the alternatives are shown on the same way as in Figure 8, with also an efficiency
frontier. The four alternatives that are on the efficiency frontier in Chapter 4 are equal to the four
alternatives on the frontier in this new situation and therefore they are used in the recommendations.
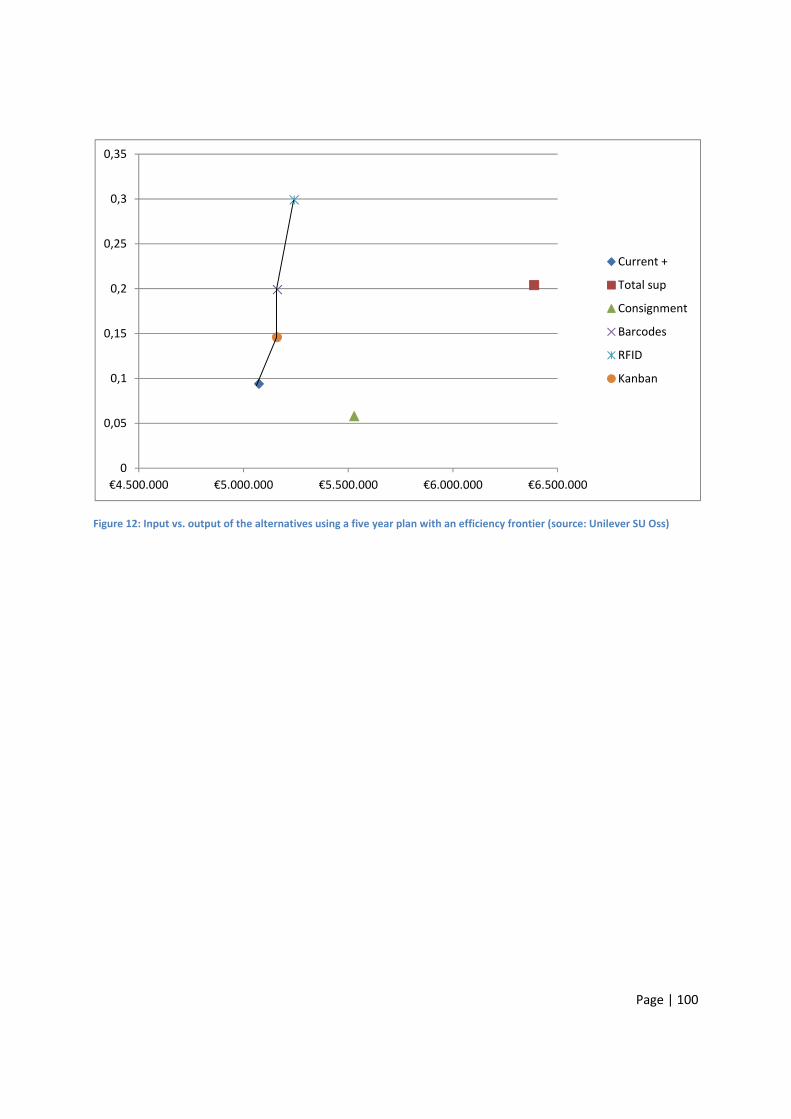
Page | 100
Figure 12: Input vs. output of the alternatives using a five year plan with an efficiency frontier (source: Unilever SU Oss)
0
0,05
0,1
0,15
0,2
0,25
0,3
0,35
€4.500.000 €5.000.000 €5.500.000 €6.000.000 €6.500.000
Current +
Total sup
Consignment
Barcodes
RFID
Kanban
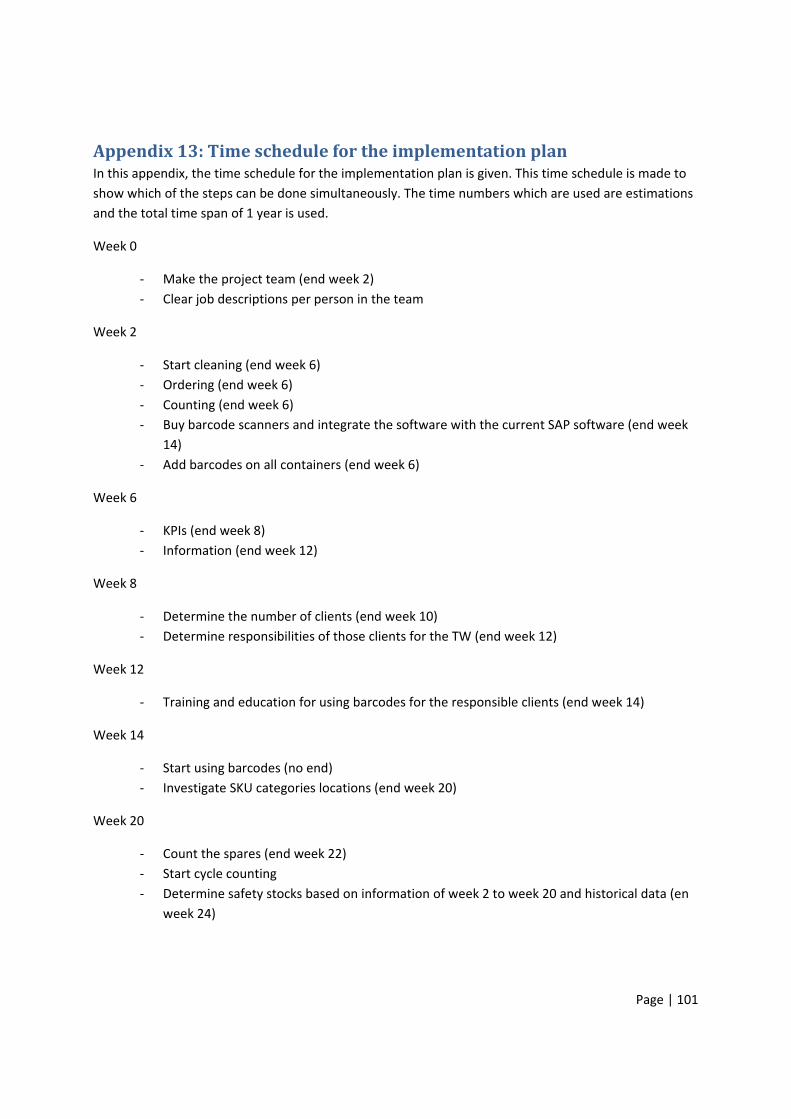
Page | 101
Appendix 13: Time schedule for the implementation plan In this appendix, the time schedule for the implementation plan is given. This time schedule is made to
show which of the steps can be done simultaneously. The time numbers which are used are estimations
and the total time span of 1 year is used.
Week 0
‐ Make the project team (end week 2)
‐ Clear job descriptions per person in the team
Week 2
‐ Start cleaning (end week 6)
‐ Ordering (end week 6)
‐ Counting (end week 6)
‐ Buy barcode scanners and integrate the software with the current SAP software (end week
14)
‐ Add barcodes on all containers (end week 6)
Week 6
‐ KPIs (end week 8)
‐ Information (end week 12)
Week 8
‐ Determine the number of clients (end week 10)
‐ Determine responsibilities of those clients for the TW (end week 12)
Week 12
‐ Training and education for using barcodes for the responsible clients (end week 14)
Week 14
‐ Start using barcodes (no end)
‐ Investigate SKU categories locations (end week 20)
Week 20
‐ Count the spares (end week 22)
‐ Start cycle counting
‐ Determine safety stocks based on information of week 2 to week 20 and historical data (en
week 24)
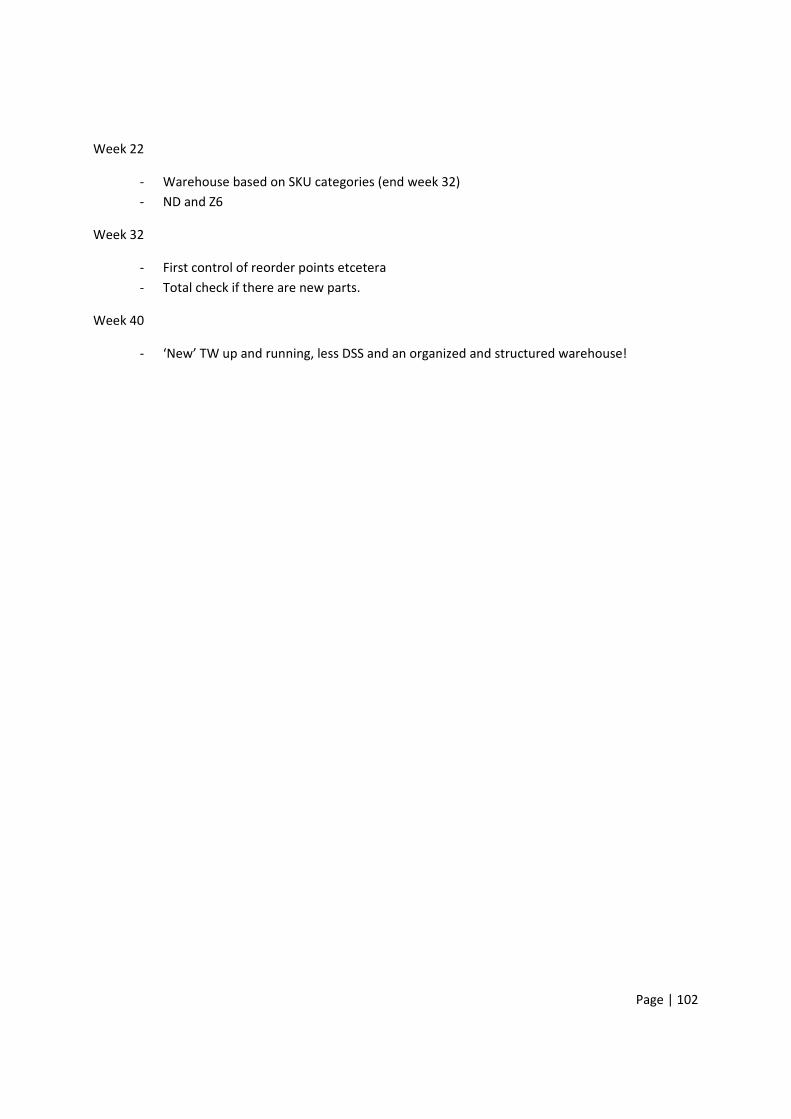
Page | 102
Week 22
‐ Warehouse based on SKU categories (end week 32)
‐ ND and Z6
Week 32
‐ First control of reorder points etcetera
‐ Total check if there are new parts.
Week 40
‐ ‘New’ TW up and running, less DSS and an organized and structured warehouse!


