39
– Invesco Funds Series 3 Annual Report (Audited) For the year ended 30 November 2016
–
Invesco Funds Series 3 Annual Report (Audited)
For the year ended 30 November 2016

Invesco Funds Series 3
Invesco Global Health Care Fund
01 Investment Policy and Description of Series
02 Investment Adviser’s Report on behalf of the Manager
03 Fund Performance (Unaudited)
03 Price and Income Record (Unaudited)
04-05 Portfolio Statement
06 Changes in the Composition of the Portfolio (Unaudited)
Invesco Global Technology Fund
01 Investment Policy and Description of Series
07 Investment Adviser’s Report on behalf of the Manager
08 Fund Performance (Unaudited)
08 Price and Income Record (Unaudited)
09-10 Portfolio Statement
11 Changes in the Composition of the Portfolio (Unaudited)
12 Statement of Financial Position 30 November 2016
13 Statement of Financial Position 30 November 2015
15 Income Statement 30 November 2016
16 Income Statement 30 November 2015
17 Statement of Changes in Net Assets Attributable to Holders of Redeemable Participating Shares 30 November 2016
18 Statement of Changes in Net Assets Attributable to Holders of Redeemable Participating Shares 30 November 2015
19-30 Notes to the Financial Statements
31 Statement of the Manager’s and Depositary’s Responsibilities
32 Report of the Independent Auditors to the Shareholders of Invesco Fund Series 3
33 Report of the Depositary to the Shareholders
34 Additional Information (Unaudited)
35 General Information

Investment Policy and Description of Series
01 Invesco Funds Series 3
Investment Objectives and Policies
Invesco Global Health Care Fund (the “Fund”) aims to achieve long- term capital growth by investing in healthcare companies throughout the world. The Manager (“Invesco Global Asset Management DAC”) will invest principally in four different sectors of the healthcare market, these being pharmaceuticals, biotechnology, healthcare services and medical technology and supplies. The Manager will seek to achieve the investment objective by investing primarily in equity or equity related securities. At least 70% of the Fund’s total assets (without taking into account ancillary liquid assets) will be invested in healthcare companies throughout the world.
Invesco Global Technology Fund (the “Fund”) aims to achieve long-term capital growth by investing in technology companies throughout the world. For the purposes of the Fund, a technology company is one which operates in fields such as information processing (including computer systems, software development, communication systems and instrumentation development), telecommunications, information services, internet related technology and services, medical and healthcare technology and general electronics. The Manager will seek to achieve the investment objective by investing primarily in equity or equity related securities. At least 70% of the Fund’s total assets (without taking into account ancillary liquid assets) will be invested in technology companies throughout the world. While the technological capability and quality of product is an important factor in investment selection, the decisive factor in selecting investments will be the confidence that the Manager has in the ability of the relevant company’s management to achieve its goals and objectives. The Fund may invest in any recognised Market. Description of the Series
The Invesco Funds Series 3 (the “Series”) is a multi-portfolio Irish unit trust comprising Invesco Global Health Care Fund and Invesco Global Technology Fund (the “Funds”). The Series is authorised by the Central Bank of Ireland (the “Central Bank”) as an undertaking for collective investment in transferable securities pursuant to the European Communities (Undertakings for Collective Investment in Transferable Securities) Regulations 2011 (as amended) (the “UCITS Regulations”) and by the Hong Kong Securities and Futures Commission (SFC) under the Hong Kong Securities and Futures Ordinance (Cap. 571) and the Central Bank (Undertakings for Collective Investment in Transferable Securities) Regulations 2015 (the “Central Bank UCITS Regulations”). The Funds also endeavour to comply with regulatory standards of the other jurisdictions where the Funds are authorised for distribution. The Funds issue units to unitholders. As per the consolidated prospectus, these units are referred to as “Shares” and the unitholder is referred to as the “Shareholder” throughout these Financial Statements.
Both Funds are funds in the Invesco range of Funds managed by Invesco Global Asset Management DAC, (“the Manager”). Invesco Global Asset Management DAC is an indirect wholly-owned subsidiary of Invesco Ltd.
Both Funds are approved by the Central Bank of Ireland. Both Funds are also approved by the SFC. In giving authorisation for the Funds the SFC does not take responsibility for the financial soundness of a fund nor for the correctness of any statements made or opinions expressed in this regard.
The Funds are not registered under the United States Investment Company Act of 1940 (as amended) and Shares in the Funds (“Shares”) have not been registered under the United States Securities Act of 1933 (as amended). Accordingly, Shares may not be offered, sold or delivered in the United States or to US Persons as defined in the current Prospectus of the Series (the “Prospectus”).
Share prices are available through the Invesco internet site www.invesco.com (for Shareholders in Hong Kong please refer to www.invesco.com.hk) and, if required by local law or regulation, published in local leading financial newspapers including, in the case of Hong Kong, the Hong Kong Economic Times, the South China Morning Post and the Hong Kong Economic Journal. Share prices are currently also available from Reuters and Bloomberg.
Any investment in the Funds should be considered long-term. There can be no guarantee that the amounts subscribed for Shares will be ultimately realised. Changes in rates of exchange between currencies may cause the value of an investment in the Funds to diminish or increase.
This report to Shareholders does not constitute an offer or invitation to purchase Shares in either of the Funds.
An updated Consolidated Prospectus for Invesco Funds Series 1, 2, 3, 4, 5, 6 and the Invesco Fund Series was issued on 29 July 2016. This contains all current and relevant information (as at the date of issue) regarding the Series and other Funds within the Invesco Funds Series 1, 2, 3, 4, 5, 6 and the Invesco Fund Series. This report to Shareholders has been prepared on the basis of the Prospectus. If you wish to receive a copy of this Prospectus please contact any Invesco office.
Charges Share
Launch Date
Annual
Management Fee
Annual
Distributor Fee
Annual
Administration Fee
Annual
Depositary Fee
%
%
Actual %
Actual %
Invesco Global Health Care Fund ‘A-AD’ Shares AA 01/03/1994 2.00 - 0.40 0.006375 ‘B-AD’ Shares AA 07/04/2000 2.00 1.00 0.30 0.006375 ‘C-AD’ Shares AA 03/03/1994 1.50 - 0.30 0.006375 ‘Z-AD’ Shares AA 21/08/2013 1.00 - 0.40 0.006375 Invesco Global Technology Fund ‘A-AD’ Shares AA 03/01/1993 1.50 - 0.30 0.006375 ‘B-AD’ Shares AA 07/04/2000 1.50 1.00 0.30 0.006375 ‘C-AD’ Shares AA 13/01/1993 1.00 - 0.30 0.006375 ‘Z-AD’ Shares AA 21/08/2013 0.75 - 0.30 0.006375 Distribution Frequency AA = Annual The Manager’s annual fee is based on the daily net asset value (“NAV”) of both Funds and is paid monthly. The Manager will also be paid a fee in respect of the duties as Administrator (“Invesco Global Asset Management DAC”) and Registrar (“Invesco Global Asset Management DAC”) for each Fund. The Administration fee will be calculated daily and will be paid monthly on the last business day of each month at the rates set out above based on the net asset value of each Share Class of each Fund on each business day. The charges are deductible from the income of each Fund or from capital in the event of an income shortfall.
The Manager may pay a portion of it’s administration fees to the Sub-Administrator (BNY Mellon Fund Services (Ireland) Designated Activity Company) in consideration for the Sub-Administrator providing certain administrative functions to the Funds.
The Depositary (“BNY Mellon Trust Company (Ireland) Limited”) will be paid a fee calculated on a sliding scale to a maximum rate of 0.0075% per annum of the net asset value of each class of each Share of the Fund on the last business day of the month and paid monthly.
The assets of a Fund are exclusively available to satisfy the rights of Shareholders in relation to that Fund and the rights of creditors whose claims have arisen in connection with the creation, operation or liquidation of that Fund.

Invesco Global Health Care Fund
02 Invesco Funds Series 3
Investment Adviser’s Report on behalf of the Manager
During period ending 30 November 2016, the Fund’s ‘A’ Shares returned -12.32% (US$, total return), underperforming its benchmark, the MSCI World Health Care Index, which returned -6.86%. The Fund lagged its peer group sector, which had an average return of -8.56%, putting the Fund in the third quartile for the period. The reporting period began with market volatility, as a late-2015 crash in oil prices rattled the markets. The US Federal Reserve (the Fed) also raised interest rates in December, the first increase since 2006, even as the European Central Bank extended its asset purchase program and Japan introduced additional quantitative easing measures. Markets began 2016 with a sharp selloff, driven by investor concerns about economic weakness in China and falling oil prices. Markets recovered in late February and posted gains as central banks reaffirmed commitments to loose monetary policy. In June after UK voters opted to leave the European Union all major global stock indexes experienced steep declines; however, after the initial shock, stocks made a strong recovery over the summer. Market volatility increased in the fall as investors anticipated the results of the US Presidential election in November. Following Trump’s unexpected victory, US equity markets rallied, but global indexes were mixed, as emerging markets declined due to currency weakness and the prospect of a less favorable trade environment. During the fiscal year, the health care sector experienced significant pressure as US Presidential candidates and a series of press reports focused attention on drug pricing and price increases. This caused a selloff during the fiscal year, particularly in the biotechnology and specialty pharmaceutical industries. An overweight in life science tools and services was the largest contributor to the Fund’s relative and absolute return during the fiscal year. Thermo Fisher Scientific, a company that markets scientific instruments and lab equipment was a strong contributor. Following a number of acquisitions, the company reported increasing operation margins and strong earnings growth during the period. The Fund’s drug retail and managed health care holdings also contributed to the Fund’s relative and absolute return. Stock selection and an overweight in the biotechnology industry was the largest detractor from the Fund’s relative return. Vertex Pharmaceuticals was a key detractor as shares declined amid a particularly sharp selloff in biotechnology stocks in the first quarter of 2016.
The Fund’s underweight and stock selection in the pharmaceuticals industry also detracted from relative returns. Within the industry, Endo International, Allergan and Teva Pharmaceuticals were the largest detractors. Specialty pharmaceutical company Endo International was the largest individual detractor from the Fund’s return. During the period, the company reported weaker than anticipated financial results and revised its full year earnings estimates down significantly from its initial forecast. We reduced our exposure to the company during the period. During the reporting period, we trimmed positions in areas that we believe have performed relatively well and reached full valuations, such as large cap pharmaceuticals, medical devices, and health care services. Geographically, we have increased our weighting in the United States, as US companies appear more mis-priced than their European counterparts, in our view. As such, our largest underweight is in Europe. We also maintain a substantial overweight in small cap stocks, and an underweight in large cap companies relative to the index. We maintained an underweight position in large-cap pharmaceuticals relative to the style-specific benchmark during the fiscal year; however, the pharmaceuticals industry was the Fund’s largest absolute industry exposure during the fiscal year. Our largest sector overweight is biotechnology where we believe valuations are attractive, growth is robust, pipelines are strong, and there is pipeline and takeout optionality not priced into the stocks. We continue to emphasize specialty pharmaceuticals and biotech stocks based on their generally robust product portfolios, strong pipelines, and our view that many could be targets for acquisition. As always, thank you for your continued investment in Invesco Global Health Care Fund. Dated: 28 December 2016– Invesco Global Asset Management DAC
Invesco Global Health Care Fund
03 Invesco Funds Series 3
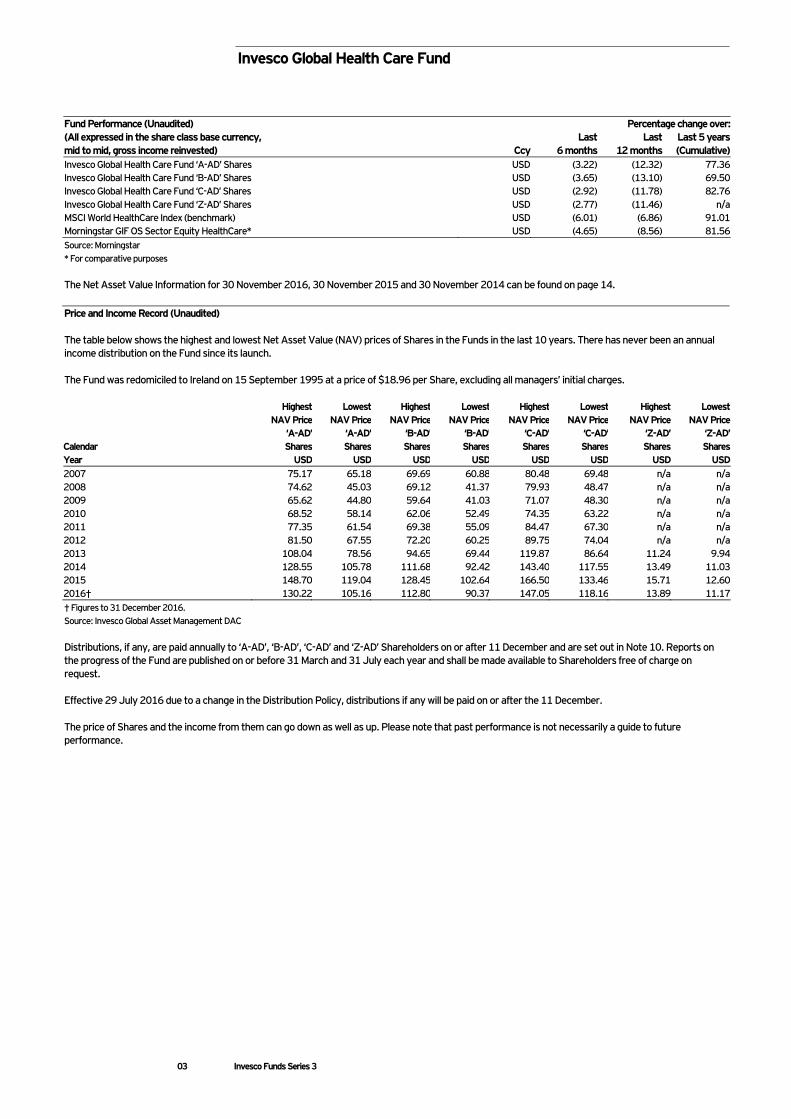
Fund Performance (Unaudited) Percentage change over: (All expressed in the share class base currency, mid to mid, gross income reinvested)
Ccy
Last 6 months
Last 12 months
Last 5 years (Cumulative)
Invesco Global Health Care Fund ‘A-AD’ Shares USD (3.22) (12.32) 77.36 Invesco Global Health Care Fund ‘B-AD’ Shares USD (3.65) (13.10) 69.50 Invesco Global Health Care Fund ‘C-AD’ Shares USD (2.92) (11.78) 82.76 Invesco Global Health Care Fund ‘Z-AD’ Shares USD (2.77) (11.46) n/a MSCI World HealthCare Index (benchmark) USD (6.01) (6.86) 91.01 Morningstar GIF OS Sector Equity HealthCare* USD (4.65) (8.56) 81.56 Source: Morningstar * For comparative purposes The Net Asset Value Information for 30 November 2016, 30 November 2015 and 30 November 2014 can be found on page 14. Price and Income Record (Unaudited) The table below shows the highest and lowest Net Asset Value (NAV) prices of Shares in the Funds in the last 10 years. There has never been an annual income distribution on the Fund since its launch. The Fund was redomiciled to Ireland on 15 September 1995 at a price of $18.96 per Share, excluding all managers’ initial charges. Highest Lowest Highest Lowest Highest Lowest Highest Lowest NAV Price NAV Price NAV Price NAV Price NAV Price NAV Price NAV Price NAV Price ‘A-AD’ ‘A-AD’ ‘B-AD’ ‘B-AD’ ‘C-AD’ ‘C-AD’ ‘Z-AD’ ‘Z-AD’ Calendar Shares Shares Shares Shares Shares Shares Shares Shares Year USD USD USD USD USD USD USD USD 2007 75.17 65.18 69.69 60.88 80.48 69.48 n/a n/a 2008 74.62 45.03 69.12 41.37 79.93 48.47 n/a n/a 2009 65.62 44.80 59.64 41.03 71.07 48.30 n/a n/a 2010 68.52 58.14 62.06 52.49 74.35 63.22 n/a n/a 2011 77.35 61.54 69.38 55.09 84.47 67.30 n/a n/a 2012 81.50 67.55 72.20 60.25 89.75 74.04 n/a n/a 2013 108.04 78.56 94.65 69.44 119.87 86.64 11.24 9.94 2014 128.55 105.78 111.68 92.42 143.40 117.55 13.49 11.03 2015 148.70 119.04 128.45 102.64 166.50 133.46 15.71 12.60 2016† 130.22 105.16 112.80 90.37 147.05 118.16 13.89 11.17 † Figures to 31 December 2016. Source: Invesco Global Asset Management DAC Distributions, if any, are paid annually to ‘A-AD’, ‘B-AD’, ‘C-AD’ and ‘Z-AD’ Shareholders on or after 11 December and are set out in Note 10. Reports on the progress of the Fund are published on or before 31 March and 31 July each year and shall be made available to Shareholders free of charge on request. Effective 29 July 2016 due to a change in the Distribution Policy, distributions if any will be paid on or after the 11 December. The price of Shares and the income from them can go down as well as up. Please note that past performance is not necessarily a guide to future performance.

Invesco Global Health Care Fund Portfolio Statement As at 30 November 2016
04 Invesco Funds Series 3
The Portfolio of Investments - (analysed by industrial sector) Fair Value of
(Ordinary shares quoted unless otherwise stated) Value Fund
Investment Holding $ %
PHARMACEUTICALS (46.26%) (30 November 2015: 53.59%) AbbVie Inc 197,858 12,187,063 2.46ACADIA Pharmaceuticals Inc 75,074 2,075,796 0.42Aclaris Therapeutics Inc 135,863 4,095,590 0.83Agile Therapeutics Inc 278,529 1,919,065 0.39Allergan Plc 46,807 9,020,177 1.82Array BioPharma Inc 430,377 3,544,155 0.72AstraZeneca Plc 169,815 4,536,608 0.92Bayer AG 73,294 6,925,205 1.40Bristol-Myers Squibb Co 243,722 13,737,391 2.78Cardinal Health Inc 48,274 3,426,730 0.69DBV Technologies SA 118,893 4,352,078 0.88Eli Lilly & Co 214,575 14,409,784 2.91Endo International Plc 245,682 3,973,906 0.80Heron Therapeutics Inc 130,174 1,923,321 0.39Hikma Pharmaceuticals Plc 117,443 2,513,135 0.51Jazz Pharmaceuticals Plc 55,837 5,908,392 1.19Johnson & Johnson 42,428 4,773,150 0.97Lipocine Inc 230,310 765,781 0.15McKesson Corp 74,040 10,458,890 2.11Merck & Co Inc 331,736 20,632,321 4.17Neurocrine Biosciences Inc 60,945 2,954,309 0.60Nippon Shinyaku Co Ltd 102,900 4,838,130 0.98Novartis AG 160,617 11,078,558 2.24Pfizer Inc 149,134 4,761,103 0.96Roche Holding AG 82,371 18,382,025 3.72Sanofi 378,500 15,327,357 3.10Sarepta Therapeutics Inc 80,351 2,949,685 0.60Shire Plc 119,398 20,991,362 4.24Supernus Pharmaceuticals Inc 117,145 2,603,548 0.53TESARO Inc 21,662 2,984,265 0.60Teva Pharmaceutical Industries Ltd 226,385 8,569,804 1.73Zogenix Inc 176,084 2,223,060 0.45 228,841,744 46.26BIOTECHNOLOGY (27.91%) (30 November 2015: 24.76%) Alder Biopharmaceuticals Inc 85,347 2,071,798 0.42Alexion Pharmaceuticals Inc 50,058 6,287,035 1.27Amgen Inc 90,547 13,219,409 2.67BioCryst Pharmaceuticals Inc 214,458 1,206,326 0.24Biogen Inc 67,205 20,351,018 4.11BioMarin Pharmaceutical Inc 144,146 12,496,738 2.53Bluebird Bio Inc 48,471 3,122,744 0.63Celgene Corp 247,102 30,182,274 6.10Dermira Inc 118,556 3,863,147 0.78Exact Sciences Corp 132,461 2,007,446 0.41Gilead Sciences Inc 89,026 6,666,712 1.35Incyte Corp 110,456 11,607,269 2.35Medicines Co 41,685 1,500,660 0.30Prothena Corp Plc 55,431 3,336,946 0.68REGENXBIO Inc 63,360 1,436,688 0.29Spark Therapeutics Inc 54,567 3,090,675 0.63Ultragenyx Pharmaceutical Inc 34,789 2,929,060 0.59United Therapeutics Corp 19,594 2,479,915 0.50Vertex Pharmaceuticals Inc 118,826 10,178,635 2.06 138,034,495 27.91HEALTHCARE-SERVICES (11.18%) (30 November 2015: 8.00%) Aetna Inc 91,787 12,119,097 2.45Amsurg Corp 52,962 3,569,109 0.72Brookdale Senior Living Inc 158,799 1,871,446 0.38

Invesco Global Health Care Fund Portfolio Statement (continued) As at 30 November 2016
05 Invesco Funds Series 3
The Portfolio of Investments - (analysed by industrial sector) Fair Value of
(Ordinary shares quoted unless otherwise stated) Value Fund
Investment Holding $ %
HEALTHCARE-SERVICES (11.18%) (30 November 2015: 8.00%) (continued) HCA Holdings Inc 98,561 7,049,576 1.43Humana Inc 41,936 8,815,576 1.78Medpace Holdings Inc 22,413 825,023 0.17Tenet Healthcare Corp 224,864 3,369,587 0.68UnitedHealth Group Inc 83,155 13,117,285 2.65Universal Health Services Inc 37,116 4,572,877 0.92 55,309,576 11.18HEALTHCARE-PRODUCTS (7.85%) (30 November 2015: 3.69%) Olympus Corp 215,300 7,642,098 1.55ResMed Inc 76,839 4,772,086 0.96Thermo Fisher Scientific Inc 125,473 17,727,453 3.58Wright Medical Group NV 369,216 8,696,883 1.76 38,838,520 7.85RETAIL (2.44%) (30 November 2015: 1.09%) Raia Drogasil SA 141,000 2,658,286 0.54Walgreens Boots Alliance Inc 110,181 9,424,332 1.90 12,082,618 2.44ELECTRONICS (0.85%) (30 November 2015: 1.96%) Agilent Technologies Inc 94,777 4,215,207 0.85
COMMERCIAL SERVICES (0.60%) (30 November 2015: 0.13%) HealthEquity Inc 42,942 1,918,004 0.39Qualicorp SA 207,200 1,059,450 0.21 2,977,454 0.60Total Value of Investments (Cost $445,621,216) 480,299,614 97.09
Total Financial Assets 480,299,614 97.09Cash and Cash Equivalents (see Note 6 for details) 15,038,849 3.04Other Net Current Liabilities (645,367) (0.13)Total Value of the Fund at 30 November 2016 494,693,096 100.00
Analysis of total assets % of
Total AssetsTransferable securities admitted to an official stock exchange listing or dealt in on another regulated market. 96.82Other assets 3.18 100.00
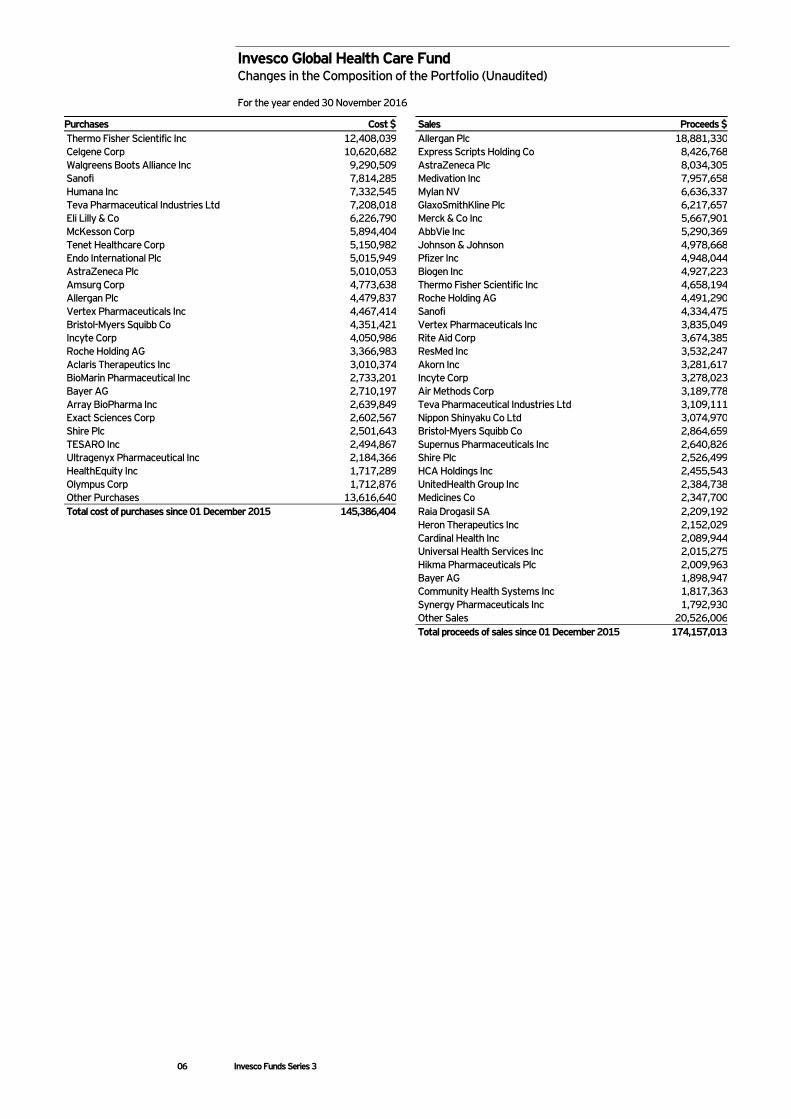
Invesco Global Health Care Fund Changes in the Composition of the Portfolio (Unaudited) For the year ended 30 November 2016
06 Invesco Funds Series 3
Purchases Cost $ Sales Proceeds $ Thermo Fisher Scientific Inc 12,408,039 Allergan Plc 18,881,330 Celgene Corp 10,620,682 Express Scripts Holding Co 8,426,768 Walgreens Boots Alliance Inc 9,290,509 AstraZeneca Plc 8,034,305 Sanofi 7,814,285 Medivation Inc 7,957,658 Humana Inc 7,332,545 Mylan NV 6,636,337 Teva Pharmaceutical Industries Ltd 7,208,018 GlaxoSmithKline Plc 6,217,657 Eli Lilly & Co 6,226,790 Merck & Co Inc 5,667,901 McKesson Corp 5,894,404 AbbVie Inc 5,290,369 Tenet Healthcare Corp 5,150,982 Johnson & Johnson 4,978,668 Endo International Plc 5,015,949 Pfizer Inc 4,948,044 AstraZeneca Plc 5,010,053 Biogen Inc 4,927,223 Amsurg Corp 4,773,638 Thermo Fisher Scientific Inc 4,658,194 Allergan Plc 4,479,837 Roche Holding AG 4,491,290 Vertex Pharmaceuticals Inc 4,467,414 Sanofi 4,334,475 Bristol-Myers Squibb Co 4,351,421 Vertex Pharmaceuticals Inc 3,835,049 Incyte Corp 4,050,986 Rite Aid Corp 3,674,385 Roche Holding AG 3,366,983 ResMed Inc 3,532,247 Aclaris Therapeutics Inc 3,010,374 Akorn Inc 3,281,617 BioMarin Pharmaceutical Inc 2,733,201 Incyte Corp 3,278,023 Bayer AG 2,710,197 Air Methods Corp 3,189,778 Array BioPharma Inc 2,639,849 Teva Pharmaceutical Industries Ltd 3,109,111 Exact Sciences Corp 2,602,567 Nippon Shinyaku Co Ltd 3,074,970 Shire Plc 2,501,643 Bristol-Myers Squibb Co 2,864,659 TESARO Inc 2,494,867 Supernus Pharmaceuticals Inc 2,640,826 Ultragenyx Pharmaceutical Inc 2,184,366 Shire Plc 2,526,499 HealthEquity Inc 1,717,289 HCA Holdings Inc 2,455,543 Olympus Corp 1,712,876 UnitedHealth Group Inc 2,384,738 Other Purchases 13,616,640 Medicines Co 2,347,700 Total cost of purchases since 01 December 2015 145,386,404 Raia Drogasil SA 2,209,192 Heron Therapeutics Inc 2,152,029 Cardinal Health Inc 2,089,944 Universal Health Services Inc 2,015,275 Hikma Pharmaceuticals Plc 2,009,963 Bayer AG 1,898,947 Community Health Systems Inc 1,817,363 Synergy Pharmaceuticals Inc 1,792,930 Other Sales 20,526,006 Total proceeds of sales since 01 December 2015 174,157,013
Invesco Global Technology Fund
07 Invesco Funds Series 3
Investment Adviser’s Report on behalf of the Manager The global economy continued to expand, albeit slowly, for the fiscal year ended November 30, 2016. However, that growth became increasingly uneven across developed and emerging economies, amid continued volatility in oil prices and as the policies of central banks globally began to diverge. Stocks began calendar year 2016 on a negative note, driven by investor concerns about economic weakness in China and falling oil prices. Markets recovered in late February and posted gains amid concerted central bank commitments to very loose monetary policy. All major global stock indexes experienced steep declines again in June after UK voters opted to leave the European Union — resulting in a sharp stock-market sell-off. Stocks in economically sensitive sectors were hardest hit, and investors flocked to the perceived safety of US Treasuries and more defensive, dividend-paying equities. After the initial shock of the UK vote, stocks made a strong recovery, regaining most of their losses as fears of a shock to consumer confidence never materialized. For the remainder of the reporting period, developed markets generally outperformed as the US presidential election cycle concluded and oil prices began to rise. While emerging markets declined due to currency weakness and the prospect of a less favorable trade environment. During the twelve months to 30 November 2016, the Fund’s ‘A’ Shares produced a negative return and underperformed its benchmark, the NASDAQ Composite index. Relative to the benchmark, the Fund outperformed the index by the widest margin in the wireless telecommunication services industry due to positive stock selection. Additional positive impacts came from stock selection in the health care providers and services industry and overweight exposure within the aerospace and defense industry. In contrast, the Fund underperformed the index by the widest margin within the biotechnology industry due to negative stock selection and overweight exposure. Overweight exposure within the pharmaceuticals industry and stock selection within the semiconductors and semiconductor equipment industry also detracted from fund performance versus the benchmark. Fund exposure in the communications equipment and IT services industries along with a modest cash position detracted from relative performance as well.
The Portfolio has shifted towards growth technology, including biopharma, and away from mature technology. Current areas of focus are those expected to take market share from mature companies, including the game-changing technologies of mobile, security, cloud and biopharma. The increased pace of health care innovation will continue to drive attractive long term growth rates in our opinion, as a result of the successful mapping of the human genome and recent productivity improvements which have fostered faster and more effective targeting of promising therapeutics. Even with the market’s significant rise during the reporting period, growth technology valuations appeared reasonable with forward price-to-earnings premiums near multi-year lows. At the close of the reporting period, we remained optimistic about technology spending. We believed that business confidence was poised to improve with expanding hiring and increased investment. Companies with strong balance sheets are investing in new disruptive technologies such as cloud, mobile, security and new data architectures which we believed were likely to continue to drive spending. At the same time, many categories have reached maturity and are in low growth or declining revenue-harvest mode. Substitution and supply chain deflation represent risks to many of these companies. We’re focused on identifying what we believe are category leaders and companies poised to take market share. We attempt to harness multi-year secular trends, which we believe may benefit long-term investors regardless of near-term economic strength. We see modest but resilient US growth, a more advanced recovery and competitive advantages for industrial development when compared to the rest of the world. Dated: 28 December 2016– Invesco Global Asset Management DAC
Invesco Global Technology Fund
08 Invesco Funds Series 3
Fund Performance (Unaudited) Percentage change over:(All expressed in share class base currency, mid to mid, gross income reinvested)
Ccy
Last 6 months
Last12 months
Last 5 years (Cumulative)
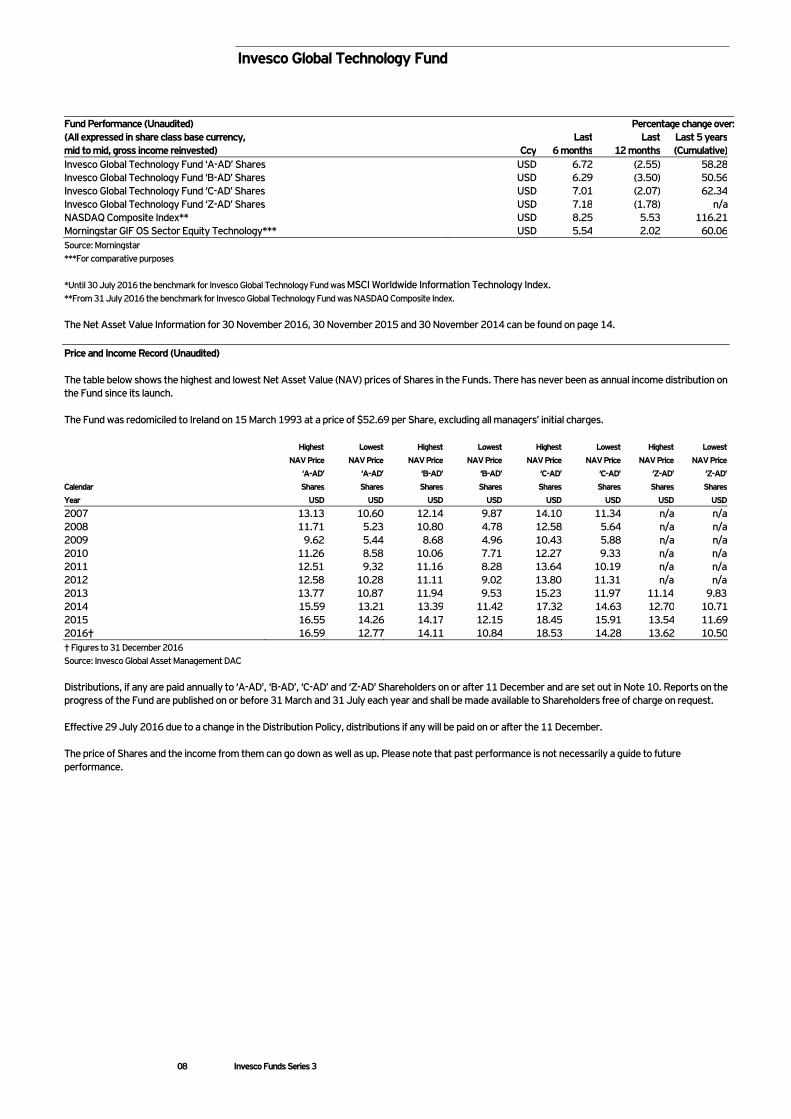
Invesco Global Technology Fund ‘A-AD’ Shares USD 6.72 (2.55) 58.28Invesco Global Technology Fund ‘B-AD’ Shares USD 6.29 (3.50) 50.56Invesco Global Technology Fund ‘C-AD’ Shares USD 7.01 (2.07) 62.34Invesco Global Technology Fund ‘Z-AD’ Shares USD 7.18 (1.78) n/aNASDAQ Composite Index** USD 8.25 5.53 116.21Morningstar GIF OS Sector Equity Technology*** USD 5.54 2.02 60.06Source: Morningstar ***For comparative purposes *Until 30 July 2016 the benchmark for Invesco Global Technology Fund was MSCI Worldwide Information Technology Index. **From 31 July 2016 the benchmark for Invesco Global Technology Fund was NASDAQ Composite Index. The Net Asset Value Information for 30 November 2016, 30 November 2015 and 30 November 2014 can be found on page 14.
Price and Income Record (Unaudited) The table below shows the highest and lowest Net Asset Value (NAV) prices of Shares in the Funds. There has never been as annual income distribution on the Fund since its launch. The Fund was redomiciled to Ireland on 15 March 1993 at a price of $52.69 per Share, excluding all managers’ initial charges. Highest Lowest Highest Lowest Highest Lowest Highest Lowest
NAV Price NAV Price NAV Price NAV Price NAV Price NAV Price NAV Price NAV Price
‘A-AD’ ‘A-AD’ ‘B-AD’ ‘B-AD’ ‘C-AD’ ‘C-AD’ ‘Z-AD’ ‘Z-AD’
Calendar Shares Shares Shares Shares Shares Shares Shares Shares
Year USD USD USD USD USD USD USD USD 2007 13.13 10.60 12.14 9.87 14.10 11.34 n/a n/a 2008 11.71 5.23 10.80 4.78 12.58 5.64 n/a n/a 2009 9.62 5.44 8.68 4.96 10.43 5.88 n/a n/a 2010 11.26 8.58 10.06 7.71 12.27 9.33 n/a n/a 2011 12.51 9.32 11.16 8.28 13.64 10.19 n/a n/a 2012 12.58 10.28 11.11 9.02 13.80 11.31 n/a n/a 2013 13.77 10.87 11.94 9.53 15.23 11.97 11.14 9.83 2014 15.59 13.21 13.39 11.42 17.32 14.63 12.70 10.712015 16.55 14.26 14.17 12.15 18.45 15.91 13.54 11.692016† 16.59 12.77 14.11 10.84 18.53 14.28 13.62 10.50† Figures to 31 December 2016 Source: Invesco Global Asset Management DAC Distributions, if any are paid annually to ‘A-AD’, ‘B-AD’, ‘C-AD’ and ‘Z-AD’ Shareholders on or after 11 December and are set out in Note 10. Reports on the progress of the Fund are published on or before 31 March and 31 July each year and shall be made available to Shareholders free of charge on request. Effective 29 July 2016 due to a change in the Distribution Policy, distributions if any will be paid on or after the 11 December. The price of Shares and the income from them can go down as well as up. Please note that past performance is not necessarily a guide to future performance.
Invesco Global Technology Fund Portfolio Statement As at 30 November 2016
09 Invesco Funds Series 3
The Portfolio of Investments - (analysed by industrial sector) Fair Value of
(Ordinary shares quoted unless otherwise stated) Value Fund
Investment Holding $ %
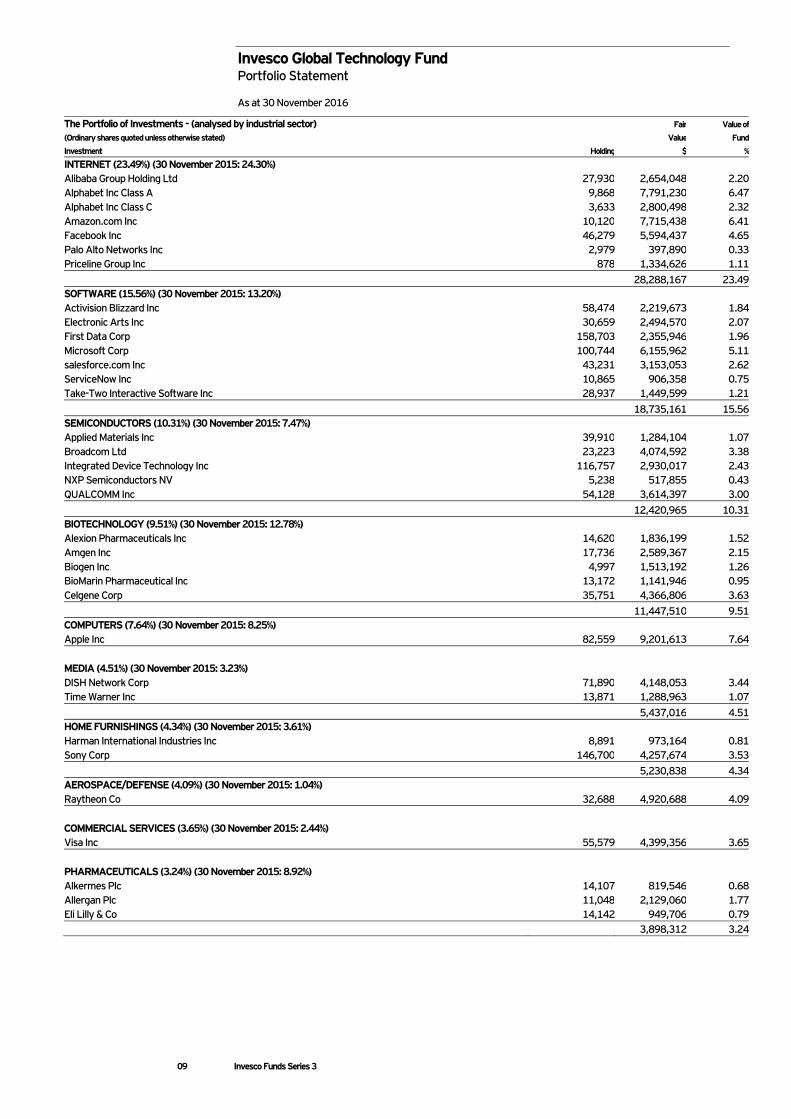
INTERNET (23.49%) (30 November 2015: 24.30%) Alibaba Group Holding Ltd 27,930 2,654,048 2.20Alphabet Inc Class A 9,868 7,791,230 6.47Alphabet Inc Class C 3,633 2,800,498 2.32Amazon.com Inc 10,120 7,715,438 6.41Facebook Inc 46,279 5,594,437 4.65Palo Alto Networks Inc 2,979 397,890 0.33Priceline Group Inc 878 1,334,626 1.11 28,288,167 23.49SOFTWARE (15.56%) (30 November 2015: 13.20%) Activision Blizzard Inc 58,474 2,219,673 1.84Electronic Arts Inc 30,659 2,494,570 2.07First Data Corp 158,703 2,355,946 1.96Microsoft Corp 100,744 6,155,962 5.11salesforce.com Inc 43,231 3,153,053 2.62ServiceNow Inc 10,865 906,358 0.75Take-Two Interactive Software Inc 28,937 1,449,599 1.21 18,735,161 15.56SEMICONDUCTORS (10.31%) (30 November 2015: 7.47%) Applied Materials Inc 39,910 1,284,104 1.07Broadcom Ltd 23,223 4,074,592 3.38Integrated Device Technology Inc 116,757 2,930,017 2.43NXP Semiconductors NV 5,238 517,855 0.43QUALCOMM Inc 54,128 3,614,397 3.00 12,420,965 10.31BIOTECHNOLOGY (9.51%) (30 November 2015: 12.78%) Alexion Pharmaceuticals Inc 14,620 1,836,199 1.52Amgen Inc 17,736 2,589,367 2.15Biogen Inc 4,997 1,513,192 1.26BioMarin Pharmaceutical Inc 13,172 1,141,946 0.95Celgene Corp 35,751 4,366,806 3.63 11,447,510 9.51COMPUTERS (7.64%) (30 November 2015: 8.25%) Apple Inc 82,559 9,201,613 7.64
MEDIA (4.51%) (30 November 2015: 3.23%) DISH Network Corp 71,890 4,148,053 3.44Time Warner Inc 13,871 1,288,963 1.07 5,437,016 4.51HOME FURNISHINGS (4.34%) (30 November 2015: 3.61%) Harman International Industries Inc 8,891 973,164 0.81Sony Corp 146,700 4,257,674 3.53 5,230,838 4.34AEROSPACE/DEFENSE (4.09%) (30 November 2015: 1.04%) Raytheon Co 32,688 4,920,688 4.09
COMMERCIAL SERVICES (3.65%) (30 November 2015: 2.44%) Visa Inc 55,579 4,399,356 3.65
PHARMACEUTICALS (3.24%) (30 November 2015: 8.92%) Alkermes Plc 14,107 819,546 0.68Allergan Plc 11,048 2,129,060 1.77Eli Lilly & Co 14,142 949,706 0.79 3,898,312 3.24
Invesco Global Technology Fund Portfolio Statement (continued) As at 30 November 2016
10 Invesco Funds Series 3
The Portfolio of Investments - (analysed by industrial sector) Fair Value of
(Ordinary shares quoted unless otherwise stated) Value Fund
Investment Holding $ %
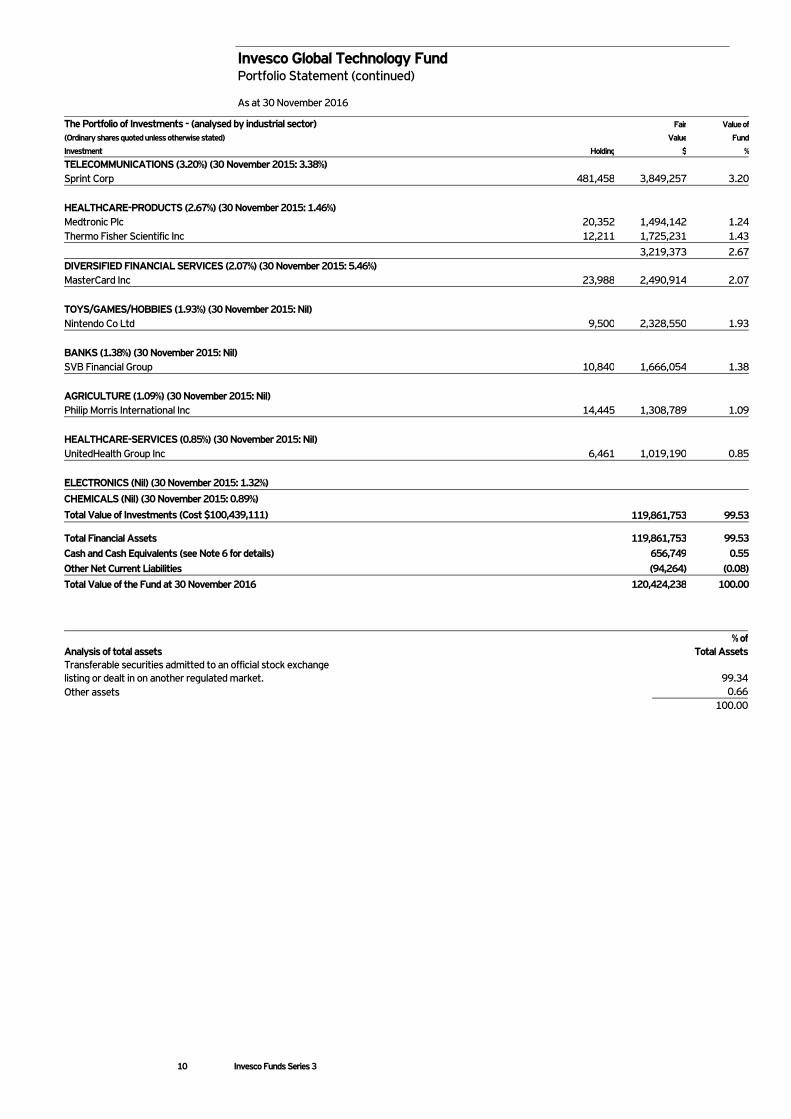
TELECOMMUNICATIONS (3.20%) (30 November 2015: 3.38%) Sprint Corp 481,458 3,849,257 3.20
HEALTHCARE-PRODUCTS (2.67%) (30 November 2015: 1.46%) Medtronic Plc 20,352 1,494,142 1.24Thermo Fisher Scientific Inc 12,211 1,725,231 1.43 3,219,373 2.67DIVERSIFIED FINANCIAL SERVICES (2.07%) (30 November 2015: 5.46%) MasterCard Inc 23,988 2,490,914 2.07
TOYS/GAMES/HOBBIES (1.93%) (30 November 2015: Nil) Nintendo Co Ltd 9,500 2,328,550 1.93
BANKS (1.38%) (30 November 2015: Nil) SVB Financial Group 10,840 1,666,054 1.38
AGRICULTURE (1.09%) (30 November 2015: Nil) Philip Morris International Inc 14,445 1,308,789 1.09
HEALTHCARE-SERVICES (0.85%) (30 November 2015: Nil) UnitedHealth Group Inc 6,461 1,019,190 0.85
ELECTRONICS (Nil) (30 November 2015: 1.32%) CHEMICALS (Nil) (30 November 2015: 0.89%) Total Value of Investments (Cost $100,439,111) 119,861,753 99.53
Total Financial Assets 119,861,753 99.53Cash and Cash Equivalents (see Note 6 for details) 656,749 0.55Other Net Current Liabilities (94,264) (0.08)Total Value of the Fund at 30 November 2016 120,424,238 100.00
Analysis of total assets % of
Total AssetsTransferable securities admitted to an official stock exchange listing or dealt in on another regulated market. 99.34Other assets 0.66 100.00
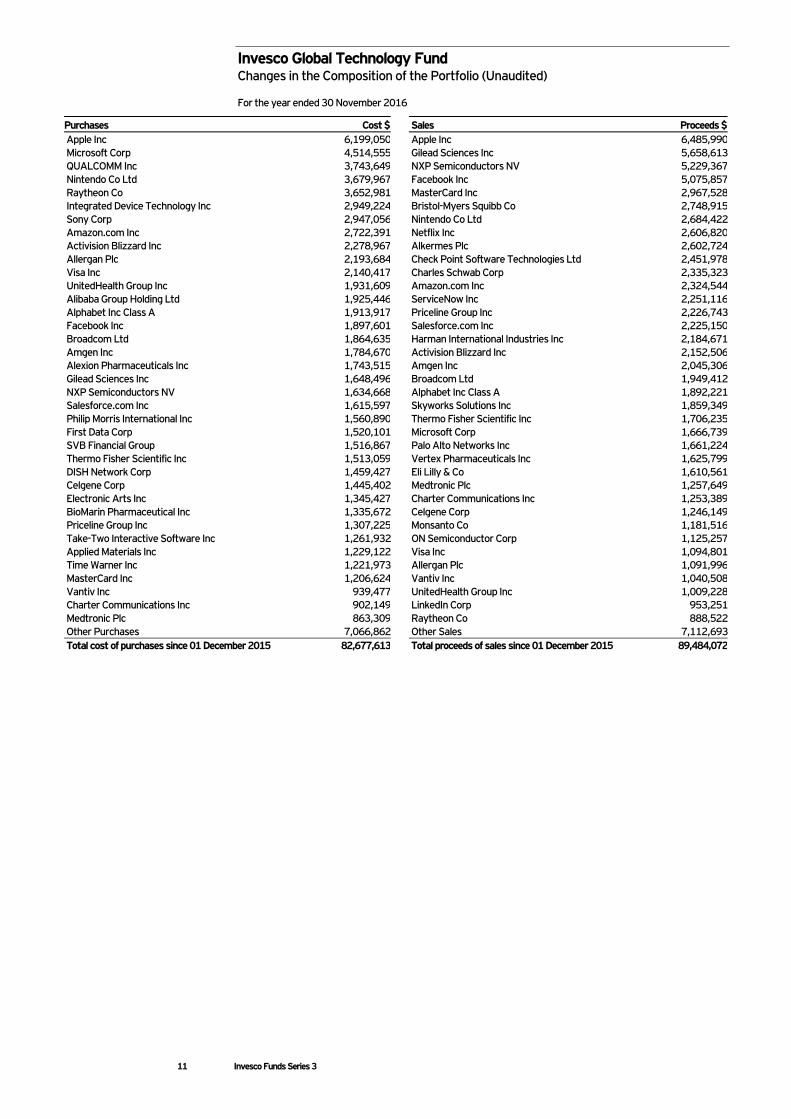
Invesco Global Technology Fund Changes in the Composition of the Portfolio (Unaudited) For the year ended 30 November 2016
11 Invesco Funds Series 3
Purchases Cost $ Sales Proceeds $ Apple Inc 6,199,050 Apple Inc 6,485,990 Microsoft Corp 4,514,555 Gilead Sciences Inc 5,658,613 QUALCOMM Inc 3,743,649 NXP Semiconductors NV 5,229,367 Nintendo Co Ltd 3,679,967 Facebook Inc 5,075,857 Raytheon Co 3,652,981 MasterCard Inc 2,967,528 Integrated Device Technology Inc 2,949,224 Bristol-Myers Squibb Co 2,748,915 Sony Corp 2,947,056 Nintendo Co Ltd 2,684,422 Amazon.com Inc 2,722,391 Netflix Inc 2,606,820 Activision Blizzard Inc 2,278,967 Alkermes Plc 2,602,724 Allergan Plc 2,193,684 Check Point Software Technologies Ltd 2,451,978 Visa Inc 2,140,417 Charles Schwab Corp 2,335,323 UnitedHealth Group Inc 1,931,609 Amazon.com Inc 2,324,544 Alibaba Group Holding Ltd 1,925,446 ServiceNow Inc 2,251,116 Alphabet Inc Class A 1,913,917 Priceline Group Inc 2,226,743 Facebook Inc 1,897,601 Salesforce.com Inc 2,225,150 Broadcom Ltd 1,864,635 Harman International Industries Inc 2,184,671 Amgen Inc 1,784,670 Activision Blizzard Inc 2,152,506 Alexion Pharmaceuticals Inc 1,743,515 Amgen Inc 2,045,306 Gilead Sciences Inc 1,648,496 Broadcom Ltd 1,949,412 NXP Semiconductors NV 1,634,668 Alphabet Inc Class A 1,892,221 Salesforce.com Inc 1,615,597 Skyworks Solutions Inc 1,859,349 Philip Morris International Inc 1,560,890 Thermo Fisher Scientific Inc 1,706,235 First Data Corp 1,520,101 Microsoft Corp 1,666,739 SVB Financial Group 1,516,867 Palo Alto Networks Inc 1,661,224 Thermo Fisher Scientific Inc 1,513,059 Vertex Pharmaceuticals Inc 1,625,799 DISH Network Corp 1,459,427 Eli Lilly & Co 1,610,561 Celgene Corp 1,445,402 Medtronic Plc 1,257,649 Electronic Arts Inc 1,345,427 Charter Communications Inc 1,253,389 BioMarin Pharmaceutical Inc 1,335,672 Celgene Corp 1,246,149 Priceline Group Inc 1,307,225 Monsanto Co 1,181,516 Take-Two Interactive Software Inc 1,261,932 ON Semiconductor Corp 1,125,257 Applied Materials Inc 1,229,122 Visa Inc 1,094,801 Time Warner Inc 1,221,973 Allergan Plc 1,091,996 MasterCard Inc 1,206,624 Vantiv Inc 1,040,508 Vantiv Inc 939,477 UnitedHealth Group Inc 1,009,228 Charter Communications Inc 902,149 LinkedIn Corp 953,251 Medtronic Plc 863,309 Raytheon Co 888,522 Other Purchases 7,066,862 Other Sales 7,112,693 Total cost of purchases since 01 December 2015 82,677,613 Total proceeds of sales since 01 December 2015 89,484,072

Statement of Financial Position As at 30 November 2016
12 Invesco Funds Series 3
Invesco Global Health Care
Fund
Invesco Global Technology
Fund Notes $ $ Assets Cash and cash equivalents 1(d)/6/7 15,038,849 656,749 Amounts due on creations 1(p)/7 375,275 48,487 Financial assets at fair value through profit or loss 1(b)/9 480,299,614 119,861,753 Other accrued income and prepaid expenses 363,986 92,927 Total assets 496,077,724 120,659,916
Liabilities Pre-funded trades 7 100,299 6,337 Amounts due on liquidations 1(p)/7 990,351 142,663 Management fee payable 1(g) 181,224 34,014 Administrator’s fee payable 1(g) 35,648 3,673 Accrued expenses 1(g) 77,106 48,991 Total liabilities (excluding net assets attributable to holders of redeemable participating Shares) 1,384,628 235,678
Net assets attributable to holders of redeemable participating Shares 494,693,096 120,424,238
The accompanying Notes 1 to 15 on pages 19 to 30 form part of these Financial Statements. Signed for and on behalf of Invesco Global Asset Management DAC on 21 March 2017. Director: William Manahan Director: Sybille Hofmann
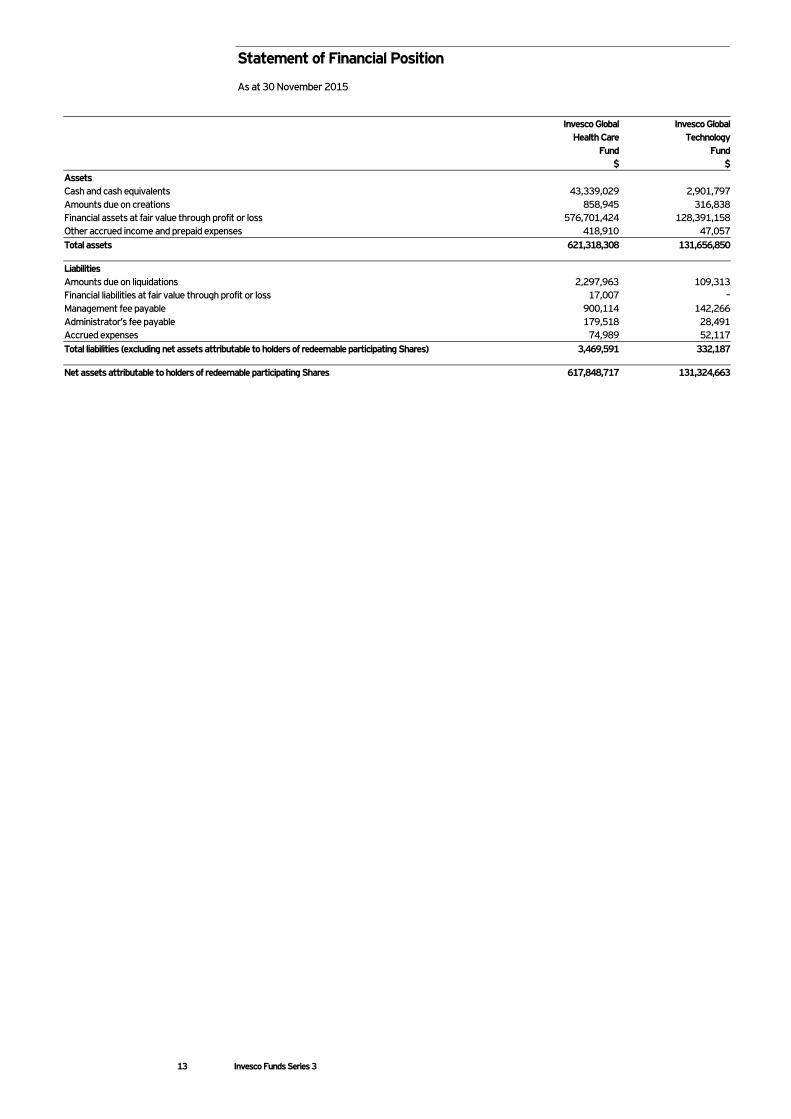
Statement of Financial Position As at 30 November 2015
13 Invesco Funds Series 3
Invesco Global Health Care
Fund
Invesco Global Technology
Fund $ $ Assets Cash and cash equivalents 43,339,029 2,901,797 Amounts due on creations 858,945 316,838 Financial assets at fair value through profit or loss 576,701,424 128,391,158 Other accrued income and prepaid expenses 418,910 47,057 Total assets 621,318,308 131,656,850
Liabilities Amounts due on liquidations 2,297,963 109,313 Financial liabilities at fair value through profit or loss 17,007 – Management fee payable 900,114 142,266 Administrator’s fee payable 179,518 28,491 Accrued expenses 74,989 52,117 Total liabilities (excluding net assets attributable to holders of redeemable participating Shares) 3,469,591 332,187
Net assets attributable to holders of redeemable participating Shares 617,848,717 131,324,663

Statement of Financial Position
14 Invesco Funds Series 3
30 November2016
Total NAVin sub-fund
currencyTotal
Number ofShares in
issue
NAV perShare in
Shareclass
currency
30 November2015
Total NAVin sub-fund
currencyTotal
Number ofShares in
issue
NAV per Share in
Share class
currency
30 November 2014
Total NAVin sub-fund
currencyTotal
Number of Shares in
issue
NAV per Share in
Share class
currency
Invesco Global Health Care Fund (USD) A-AD USD 281,227,290 2,450,358 114.77 363,239,089 2,775,196 130.89 278,225,340 2,164,295 128.55B-AD USD 16,747 171 97.92 14,202 126 112.68 7,293 65 111.68C-AD USD 212,952,626 1,643,463 129.58 253,871,335 1,728,336 146.89 238,289,935 1,661,716 143.40Z-AD USD 496,433 40,391 12.29 724,091 52,178 13.88 563,335 41,751 13.49
Invesco Global Technology Fund (USD) A-AD USD 68,260,104 4,252,860 16.05 78,683,239 4,777,283 16.47 78,986,710 5,070,480 15.58B-AD USD 8,644 640 13.52 9,563 683 14.01 9,995 747 13.38C-AD USD 52,141,345 2,894,002 18.02 52,595,588 2,858,965 18.40 43,443,332 2,509,436 17.31Z-AD USD 14,145 1,065 13.28 36,273 2,684 13.52 30,251 2,384 12.69
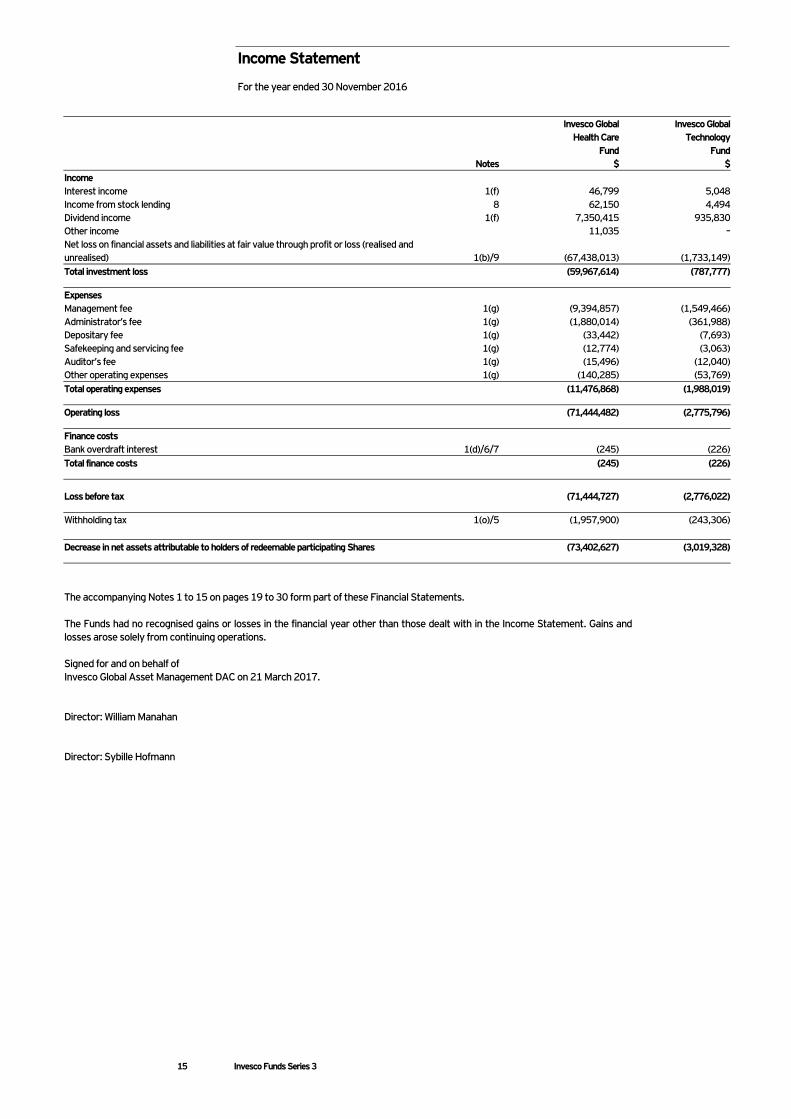
Income Statement For the year ended 30 November 2016
15 Invesco Funds Series 3
Invesco Global Health Care
Fund
Invesco Global Technology
Fund Notes $ $ Income Interest income 1(f) 46,799 5,048 Income from stock lending 8 62,150 4,494 Dividend income 1(f) 7,350,415 935,830 Other income 11,035 – Net loss on financial assets and liabilities at fair value through profit or loss (realised and unrealised) 1(b)/9 (67,438,013) (1,733,149) Total investment loss (59,967,614) (787,777)
Expenses Management fee 1(g) (9,394,857) (1,549,466) Administrator’s fee 1(g) (1,880,014) (361,988) Depositary fee 1(g) (33,442) (7,693) Safekeeping and servicing fee 1(g) (12,774) (3,063) Auditor’s fee 1(g) (15,496) (12,040) Other operating expenses 1(g) (140,285) (53,769) Total operating expenses (11,476,868) (1,988,019)
Operating loss (71,444,482) (2,775,796)
Finance costs Bank overdraft interest 1(d)/6/7 (245) (226) Total finance costs (245) (226)
Loss before tax (71,444,727) (2,776,022)
Withholding tax 1(o)/5 (1,957,900) (243,306) Decrease in net assets attributable to holders of redeemable participating Shares (73,402,627) (3,019,328)
The accompanying Notes 1 to 15 on pages 19 to 30 form part of these Financial Statements. The Funds had no recognised gains or losses in the financial year other than those dealt with in the Income Statement. Gains and losses arose solely from continuing operations. Signed for and on behalf of Invesco Global Asset Management DAC on 21 March 2017. Director: William Manahan Director: Sybille Hofmann
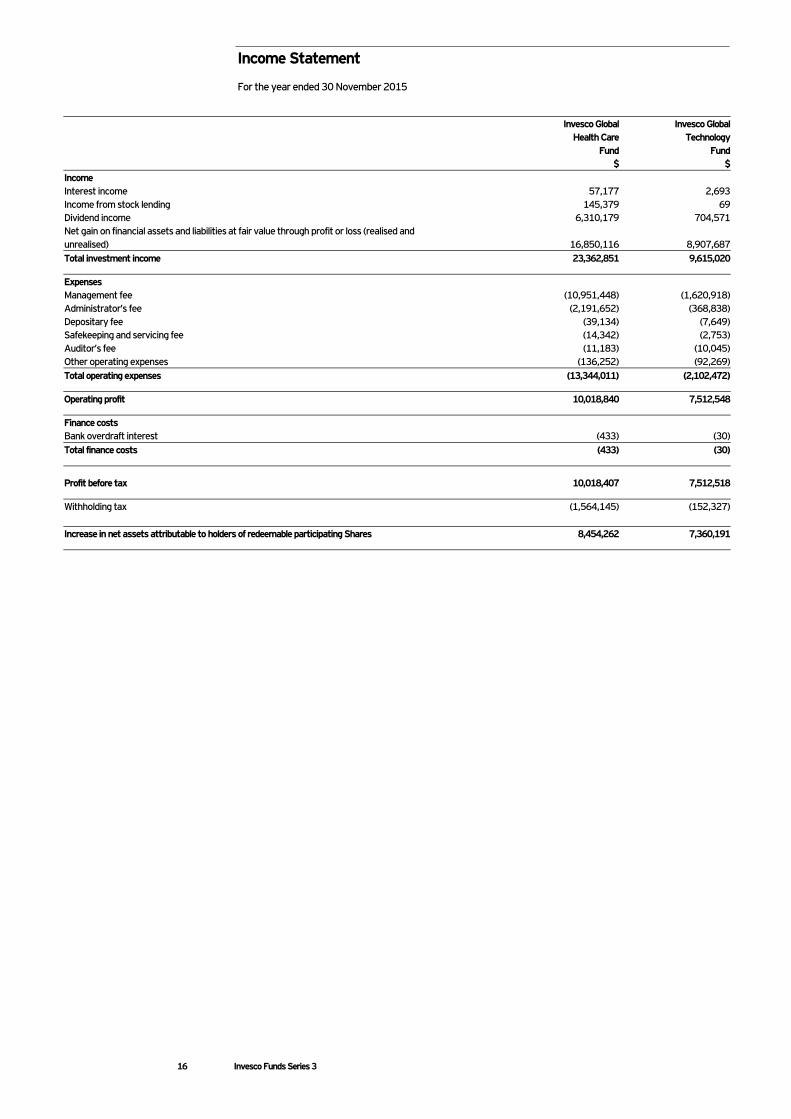
Income Statement For the year ended 30 November 2015
16 Invesco Funds Series 3
Invesco Global Health Care
Fund
Invesco Global Technology
Fund $ $ Income Interest income 57,177 2,693 Income from stock lending 145,379 69 Dividend income 6,310,179 704,571 Net gain on financial assets and liabilities at fair value through profit or loss (realised and unrealised) 16,850,116 8,907,687 Total investment income 23,362,851 9,615,020
Expenses Management fee (10,951,448) (1,620,918) Administrator’s fee (2,191,652) (368,838) Depositary fee (39,134) (7,649) Safekeeping and servicing fee (14,342) (2,753) Auditor’s fee (11,183) (10,045) Other operating expenses (136,252) (92,269) Total operating expenses (13,344,011) (2,102,472)
Operating profit 10,018,840 7,512,548
Finance costs Bank overdraft interest (433) (30) Total finance costs (433) (30)
Profit before tax 10,018,407 7,512,518
Withholding tax (1,564,145) (152,327) Increase in net assets attributable to holders of redeemable participating Shares 8,454,262 7,360,191

Statement of Changes in Net Assets attributable to Holders of Redeemable Participating Shares For the year ended 30 November 2016
17 Invesco Funds Series 3
Invesco Global Health Care
Fund
Invesco Global Technology
Fund $ $ Net assets attributable to holders of redeemable participating Shares at beginning of year 617,848,717 131,324,663
Decrease in net assets attributable to holders of redeemable participating Shares (73,402,627) (3,019,328)
Share Transactions
Proceeds from redeemable participating Shares issued 110,362,758 35,670,025 Cost of redeemable participating Shares redeemed (160,115,752) (43,551,122)
Net assets attributable to holders of redeemable participating Shares at the end of year 494,693,096 120,424,238
The accompanying Notes 1 to 15 on pages 19 to 30 form part of these Financial Statements
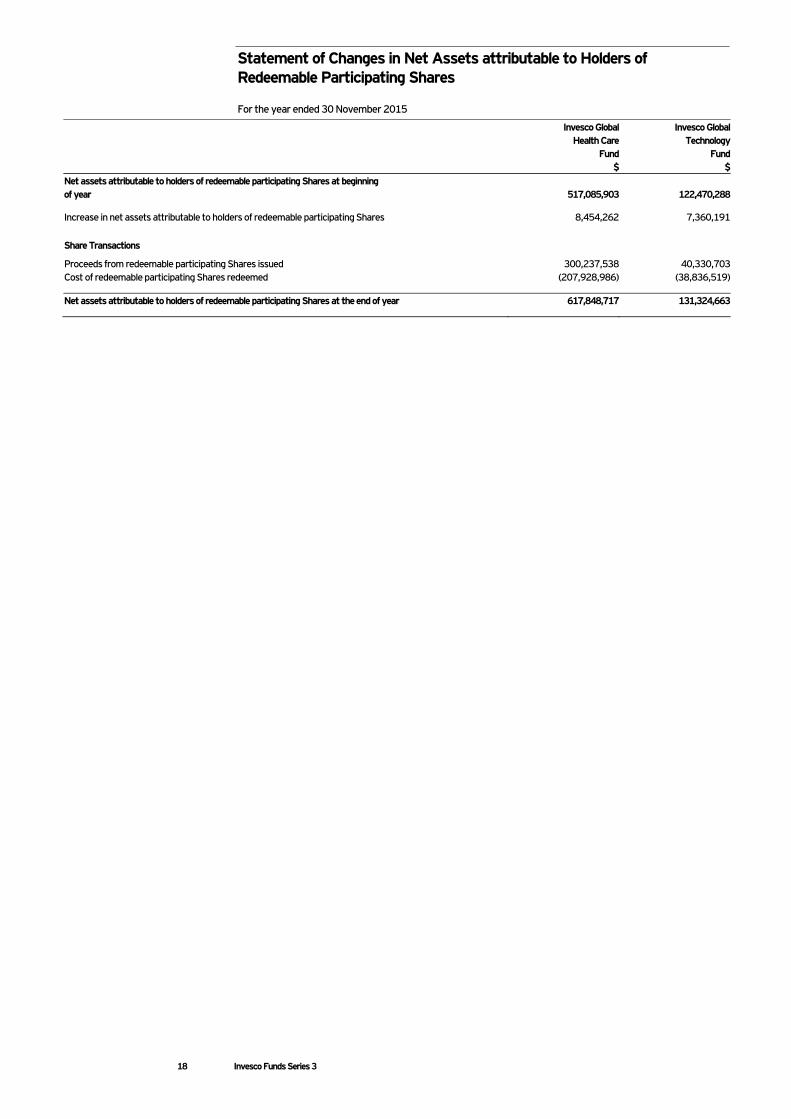
Statement of Changes in Net Assets attributable to Holders of Redeemable Participating Shares For the year ended 30 November 2015
18 Invesco Funds Series 3
Invesco Global Health Care
Fund
Invesco Global Technology
Fund $ $ Net assets attributable to holders of redeemable participating Shares at beginning of year 517,085,903 122,470,288
Increase in net assets attributable to holders of redeemable participating Shares 8,454,262 7,360,191
Share Transactions
Proceeds from redeemable participating Shares issued 300,237,538 40,330,703 Cost of redeemable participating Shares redeemed (207,928,986) (38,836,519)
Net assets attributable to holders of redeemable participating Shares at the end of year 617,848,717 131,324,663
Notes to the Financial Statements For the year ended 30 November 2016
19 Invesco Funds Series 3
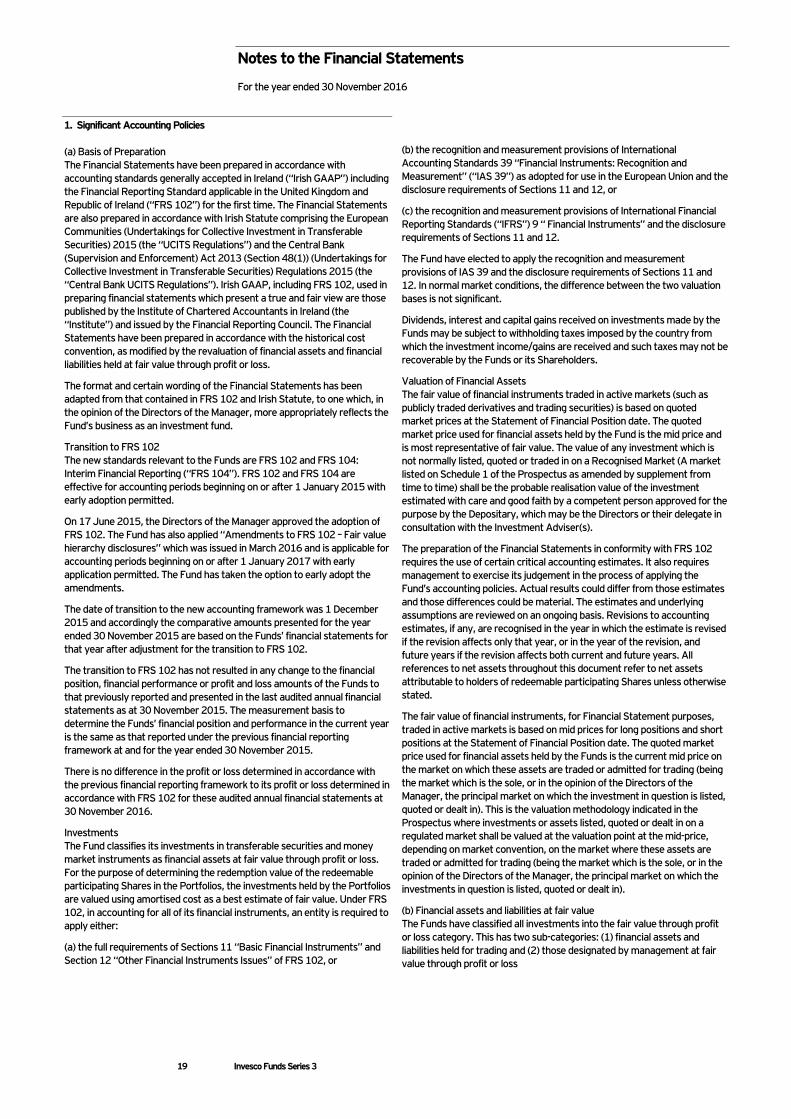
1. Significant Accounting Policies (a) Basis of Preparation The Financial Statements have been prepared in accordance with accounting standards generally accepted in Ireland (“Irish GAAP”) including the Financial Reporting Standard applicable in the United Kingdom and Republic of Ireland (“FRS 102”) for the first time. The Financial Statements are also prepared in accordance with Irish Statute comprising the European Communities (Undertakings for Collective Investment in Transferable Securities) 2015 (the “UCITS Regulations”) and the Central Bank (Supervision and Enforcement) Act 2013 (Section 48(1)) (Undertakings for Collective Investment in Transferable Securities) Regulations 2015 (the “Central Bank UCITS Regulations”). Irish GAAP, including FRS 102, used in preparing financial statements which present a true and fair view are those published by the Institute of Chartered Accountants in Ireland (the “Institute”) and issued by the Financial Reporting Council. The Financial Statements have been prepared in accordance with the historical cost convention, as modified by the revaluation of financial assets and financial liabilities held at fair value through profit or loss.
The format and certain wording of the Financial Statements has been adapted from that contained in FRS 102 and Irish Statute, to one which, in the opinion of the Directors of the Manager, more appropriately reflects the Fund’s business as an investment fund.
Transition to FRS 102 The new standards relevant to the Funds are FRS 102 and FRS 104: Interim Financial Reporting (“FRS 104”). FRS 102 and FRS 104 are effective for accounting periods beginning on or after 1 January 2015 with early adoption permitted.
On 17 June 2015, the Directors of the Manager approved the adoption of FRS 102. The Fund has also applied “Amendments to FRS 102 – Fair value hierarchy disclosures” which was issued in March 2016 and is applicable for accounting periods beginning on or after 1 January 2017 with early application permitted. The Fund has taken the option to early adopt the amendments.
The date of transition to the new accounting framework was 1 December 2015 and accordingly the comparative amounts presented for the year ended 30 November 2015 are based on the Funds’ financial statements for that year after adjustment for the transition to FRS 102.
The transition to FRS 102 has not resulted in any change to the financial position, financial performance or profit and loss amounts of the Funds to that previously reported and presented in the last audited annual financial statements as at 30 November 2015. The measurement basis to determine the Funds’ financial position and performance in the current year is the same as that reported under the previous financial reporting framework at and for the year ended 30 November 2015.
There is no difference in the profit or loss determined in accordance with the previous financial reporting framework to its profit or loss determined in accordance with FRS 102 for these audited annual financial statements at 30 November 2016.
Investments The Fund classifies its investments in transferable securities and money market instruments as financial assets at fair value through profit or loss. For the purpose of determining the redemption value of the redeemable participating Shares in the Portfolios, the investments held by the Portfolios are valued using amortised cost as a best estimate of fair value. Under FRS 102, in accounting for all of its financial instruments, an entity is required to apply either:
(a) the full requirements of Sections 11 “Basic Financial Instruments” and Section 12 “Other Financial Instruments Issues” of FRS 102, or
(b) the recognition and measurement provisions of International Accounting Standards 39 “Financial Instruments: Recognition and Measurement” (“IAS 39”) as adopted for use in the European Union and the disclosure requirements of Sections 11 and 12, or
(c) the recognition and measurement provisions of International Financial Reporting Standards (“IFRS”) 9 “ Financial Instruments” and the disclosure requirements of Sections 11 and 12.
The Fund have elected to apply the recognition and measurement provisions of IAS 39 and the disclosure requirements of Sections 11 and 12. In normal market conditions, the difference between the two valuation bases is not significant.
Dividends, interest and capital gains received on investments made by the Funds may be subject to withholding taxes imposed by the country from which the investment income/gains are received and such taxes may not be recoverable by the Funds or its Shareholders.
Valuation of Financial Assets The fair value of financial instruments traded in active markets (such as publicly traded derivatives and trading securities) is based on quoted market prices at the Statement of Financial Position date. The quoted market price used for financial assets held by the Fund is the mid price and is most representative of fair value. The value of any investment which is not normally listed, quoted or traded in on a Recognised Market (A market listed on Schedule 1 of the Prospectus as amended by supplement from time to time) shall be the probable realisation value of the investment estimated with care and good faith by a competent person approved for the purpose by the Depositary, which may be the Directors or their delegate in consultation with the Investment Adviser(s).
The preparation of the Financial Statements in conformity with FRS 102 requires the use of certain critical accounting estimates. It also requires management to exercise its judgement in the process of applying the Fund’s accounting policies. Actual results could differ from those estimates and those differences could be material. The estimates and underlying assumptions are reviewed on an ongoing basis. Revisions to accounting estimates, if any, are recognised in the year in which the estimate is revised if the revision affects only that year, or in the year of the revision, and future years if the revision affects both current and future years. All references to net assets throughout this document refer to net assets attributable to holders of redeemable participating Shares unless otherwise stated.
The fair value of financial instruments, for Financial Statement purposes, traded in active markets is based on mid prices for long positions and short positions at the Statement of Financial Position date. The quoted market price used for financial assets held by the Funds is the current mid price on the market on which these assets are traded or admitted for trading (being the market which is the sole, or in the opinion of the Directors of the Manager, the principal market on which the investment in question is listed, quoted or dealt in). This is the valuation methodology indicated in the Prospectus where investments or assets listed, quoted or dealt in on a regulated market shall be valued at the valuation point at the mid-price, depending on market convention, on the market where these assets are traded or admitted for trading (being the market which is the sole, or in the opinion of the Directors of the Manager, the principal market on which the investments in question is listed, quoted or dealt in).
(b) Financial assets and liabilities at fair value The Funds have classified all investments into the fair value through profit or loss category. This has two sub-categories: (1) financial assets and liabilities held for trading and (2) those designated by management at fair value through profit or loss

Notes to the Financial Statements (Continued) For the year ended 30 November 2016
20 Invesco Funds Series 3
1. Significant Accounting Policies (continued)
Financial assets or liabilities held for trading are acquired or incurred principally for the purposes of selling or repurchasing in the short term.
The investments are initially recognised at fair value and transaction costs are expensed as incurred. The investments of the Fund have been valued at the market dealing mid prices at 12.00pm (Irish time) on 30 November 2016. Investment transactions are accounted for on the trade date up to 12:00pm on 30 November 2016.
Applications which are received prior to the dealing cut-off point (12.00pm) will, if accepted, be dealt with on the basis of the net asset value per Share of the relevant class calculated at the next valuation point. Investments are initially recognised at fair value and are derecognised when the rights to receive cash flows from these investments have expired or the Fund has transferred substantially all rights and rewards of ownership. Realised gains/losses on investments disposals are calculated on the Average Cost Method and are recognised in the Income Statement.
(c) Foreign Currency Translation (i) Functional and presentation currency Items included in each Fund’s Financial Statements are measured using the currency of the primary economic environment in which it operates (‘the functional currency’). This is the US Dollar ($). The US Dollar is also the presentation currency.
The Financial Statements are presented in the Fund’s functional and presentation currency and rounded to the nearest whole number. They are prepared on the fair value basis for financial assets and financial liabilities at fair value through profit or loss and derivative financial instruments. Other financial assets and financial liabilities are stated at amortised cost or redemption amount (redeemable Shares).
(ii) Assets and liabilities in foreign currencies are translated into US Dollars at the rates of exchange ruling at the Statement of Financial Position date. Income and expenditure transactions are translated at the rates of exchange ruling at the date of the transactions.
The principal exchange rates used: US$1.00
30 November 2016 30 November 2015Australian Dollar 1.34 1.39Brazilian Real 3.40 3.87Canadian Dollar 1.34 1.34Czech Koruna 25.42 25.56Danish Krone 6.99 7.06Egyptian Pound 17.90 7.83Euro 0.94 0.95Hong Kong Dollar 7.76 7.75Indian Rupee 68.45 66.66Indonesian Rupiah 13,552.50 13,835.00Japanese Yen 113.26 123.09Malaysian Ringgit 4.47 4.26New Zealand Dollar 1.40 1.53Nigeria Naira 315.25 199.20Norwegian Kroner 8.47 8.71Philippine Peso 49.73 47.14Pound Sterling 0.80 0.67Singapore Dollar 1.43 1.41South African Rand 13.97 14.41South Korean Won 1,169.05 1,158.05Swedish Krona 9.15 8.70Swiss Franc 1.01 1.03Taiwan Dollar 31.87 32.64Thailand Baht 35.68 35.84Turkish Lira 3.42 2.91Uruguay Peso 29.03 29.60
(d) Cash and Cash Equivalents Cash and cash equivalents includes cash in hand, deposits held at call with banks and settled spot contracts. Bank overdrafts are included in liabilities on the Statement of Financial Position. Bank overdraft interest is included as a finance cost in the Income Statement.
(e) Due from/to Brokers Amounts due from/to brokers represent payables for securities purchased and receivables for securities sold that have been contracted for but not yet delivered or settled as at year end.
(f) Dividend Income and Interest Income Dividends are credited to the Income Statement on the dates on which the relevant securities are listed as “ex-dividend”. Deposit interest Income is accrued on a daily basis using the effective interest rate method. Income is shown gross of any non-recoverable withholding taxes, which are disclosed separately in the Income Statement, and net of any tax credits.
(g) Expenses The Funds’ expenses are recognised on an accruals basis and presented in the Income Statement. Expenses include value added tax where appropriate. Expenses payable at the year end date are presented in the Statement of Financial Position.
(h) Equalisation An equalisation account is maintained by each Fund so that the amount distributed on all classes of Shares will be the same for all Shares of the same type, notwithstanding different dates of issue. A sum equal to that part of the issue price of a Share which reflects income (if any) accrued up to the date of issue will be deemed to be an equalisation payment. It will be treated as repaid to Shareholders with the first distribution or accumulation for the relevant Fund to which the Shareholders are entitled in the same accounting period as that in which the Shares are issued. Equalisation will not be operated in respect of the first issue of Shares by a fund.
(i) Financial Reporting Standard 1 (Cash Flow Statement) The Funds have availed of the exemption permitted to open-ended investment funds under Section 7 “Statement of Cash Flows” not to prepare a cashflow statement on the basis that substantially all the Funds investments are highly liquid and carried at fair value.
(j) Forward Foreign Exchange Contracts The unrealised gain or loss on open forward foreign exchange contracts is calculated as the difference between the contracted rate and the rate to close out the contract at the Statement of Financial Position date. Realised gains or losses include net gains on contracts which have been settled or offset on other contracts. Net realised gains or losses on forward foreign exchange contracts are a component of net gains/losses on financial assets and financial liabilities at fair value through profit or loss (See Note 9 for details).
(k) Distributions payable to holders of redeemable participating Shares Proposed distributions to holders of redeemable participating Shares are classified as finance costs in the Income Statement when they are ratified by the Board of Directors of the Manager.
(l) Redeemable Participating Shares Redeemable participating Shares are redeemable at the Shareholder’s option and are classified as financial liabilities. The distributions on these redeemable participating Shares are recognised in the Income Statement as finance costs.
The participating Shares can be put back to the relevant Fund at any time for cash equal to a proportionate share of the Fund’s net asset value. The participating Shares are carried at the redemption amount that is payable at the Statement of Financial Position date if the Shareholders exercised their right to put the share back to each Fund.

Notes to the Financial Statements (Continued) For the year ended 30 November 2016
21 Invesco Funds Series 3
1. Significant Accounting Policies (continued)
(m) Value of Investments To determine the net asset value of each Fund for subscriptions and redemptions, investments have been valued based on the mid market prices at 12:00pm (Irish time) on the relevant trading day. For Financial Statements purposes, investments are valued mid market.
The net asset value per Share is disclosed in the Statement of Financial Position.
(n) Swing Pricing Securities are valued as outlined in Note 1(b). However, in order to mitigate the effects of dilution, the Funds have implemented a policy of “Swing Pricing”. In the best interest of Shareholders, the Directors of the Manager may allow for the net asset value to be adjusted, using bid or ask market quotation rather than mid, depending on the net share activity arising from subscriptions, redemptions or switching in a fund for a given business day. The Funds operate partial swing only. That means the Funds will not swing to either a bid or ask price basis daily, but only when a predetermined level of Shareholders activities are exceeded. High redemption level triggers a swing to a bid price basis, whereas high subscription level triggers a swing to ask price basis. The Directors of the Manager have the ability to place a fund on constant swing depending on the recent Shareholders activities trend of a fund.
(o) Withholding Tax The Funds currently incur withholding taxes imposed by certain countries on investment income. Such income is recorded gross of withholding taxes in the Income Statement. Withholding taxes are shown as a separate item in the Income Statement.
(p) Amounts Due on Creations/Liquidations Amounts due on creations and liquidations represent receivables for creation of Shares and payables for liquidation of Shares that have been contracted for but not yet delivered by the year end. Creations and liquidations paid after the year end, but based upon year end net asset values, are reflected as amounts due on creations and liquidations in the Statement of Financial Position as at 30 November 2016.
(q) Offsetting Financial assets and liabilities are offset and the net amount reported in the Statement of Financial Position when there is a legally enforceable right to offset the recognised amounts and there is an intention to settle on a net basis or realise the asset and settle the liability simultaneously. During the years ended 30 November 2016 and at 30 November 2015 there were no master netting agreements.
2. UK Reporting
The offshore Funds (Tax) Regulations 2009 and Subsequent Regulations Amendments (“the Regulations”) introduced new provisions to update offshore funds regime and came into effect for periods of accounting commencing after 1 December 2009. The Reporting Funds Regime requires:
1. The reporting fund status is applied for once and in advance.
2. The relevant Share classes to report details of Income annually, within six months of their accounting year end to both Investors and UK authorities.
3. Investors to provide details of reportable income on their annual tax return.
The following Share Classes currently have UK Reporting Status;
Invesco Global Health Care Fund A-Dist, C-Dist & Z-Dist
Invesco Global Technology Fund A-Dist, C-Dist & Z-Dist
2. UK Reporting (continued)
The Statement of Reportable Income for the financial year end 30 November 2016 is available through the following Invesco websites by 31 May 2017.
www.invesco.com
3. Soft Commissions and Related Party Transactions
The Funds, (consistent with obtaining the best net result, including best execution), may enter into agreements with counterparties whereby those counterparties may make payments for investment services provided to the Funds.
Investment services are used by the Funds to improve or add to the services provided to its clients. Although each and every service may not be used to service each and every account managed by the Funds, the Directors of the Manager consider that those investment services received are, in the aggregate, of significant assistance in fulfilling its investment responsibilities and are of demonstrable benefit to all clients. Only services that in the view of the Directors of the Manager assist in the provision of investment services to the Funds clients will be paid for by counterparties.
Allowable investment services include services that provide assistance to the Funds in its investment performance. Those services include, but are not necessarily limited to, furnishing analysis, research and advisory services including economic factors and trends, portfolio valuation and analysis, performance measurement, market prices services and the use of specialised computer software and hardware or other information facilities.
The Funds will ensure adherence to the investment decision making responsibilities to its clients in accordance with the laws of the countries that have jurisdiction over its clients or business. This may vary in application with respect to the appropriateness of those investment services provided.
The Funds select counterparties to execute transactions on the basis that transactions will only be executed provided the placing of orders will not operate against the best interest of the Fund’s clients and that the multiple is at a level which is generally accepted market practice. The Funds will endeavour to obtain best execution on all transactions for all clients.
In addition, clients may direct the Funds to pay commission to counterparties for products and services that would otherwise have to be paid for. In such cases, the commission is used for the exclusive benefit of the client whose transactions generated that commission.
The Manager, Administrator, Global Distributor (Invesco Global Asset Management DAC) are deemed to be Related Parties under Financial Reporting Standard 102. Fees charged, out of the Fund, by the Manager and Administrator fees are disclosed in the Income Statement on page 15. Amounts payable at the year end are disclosed in the Statement of Financial Position on page 12. The Manager may pay a portion of its administration fees to BNY Mellon Fund Services (Ireland) Designated Activity Company, the Sub-Administrator, in consideration for the Sub-Administrator providing certain administration functions to the Funds. Fees for the Global Distributor are paid from the Management fee.
The Manager, Invesco Global Asset Management DAC is a wholly owned subsidiary of Invesco UK Limited, which is a wholly owned subsidiary of Invesco Limited, the group parent company.
Directors Fees are not paid by the Funds during the period under review. Directors fees are paid by Invesco Global Asset Management DAC.
There were no Director’s holdings in the Funds for the year ended 30 November 2016 and 30 November 2015.

Notes to the Financial Statements (Continued) For the year ended 30 November 2016
22 Invesco Funds Series 3
3. Soft Commissions and Related Party Transactions (continued)
Invesco UK Limited, held a beneficial interest in the Shares representing approximately the following percentages of the total number of Shares in issue of the relevant fund class: Seed Capital Invesco UK Limited held the following Redeemable Participating Shares in the Funds and class as detailed below:
Number of Shares at the start of the
year
Number of Shares acquired in the
year
Number of Shares redeemed in the
year
Number of Shares at
year end
Percentage of Total Shares
For the Year Ended 30 November 2016 Invesco Global Health Care Fund ‘B-AD’ Shares 65 − − 65 38 Invesco Global Health Care Fund ‘Z-AD’ Shares 700 − − 700 2 Invesco Global Technology Fund ‘Z-AD’ Shares 700 − − 700 66
Number of Shares at the start of the
year
Number of Shares acquired in the
year
Number of Sharesredeemed in the
year
Number of Shares at
year end
Percentage of Total Shares
For the Year Ended 30 November 2015 Invesco Global Health Care Fund ‘B-AD’ Shares 65 − − 65 52 Invesco Global Health Care Fund ‘Z-AD’ Shares 700 − − 700 1 Invesco Global Technology Fund ‘Z-AD’ Shares − 700 − 700 26
4. Financial Investments and Associated Risks
Risk Management In pursuing its investment objectives set out within the section describing the Funds’ Investment Policies, each Fund holds a number of financial instruments, these comprise:
– Equity and non-equity Shares: These are held in accordance with each Funds’ investment objectives and policies. – Cash, liquid resources and short-term debtors and creditors that arise directly from operations; and – Forwards or other derivatives. The main risks arising from the Funds’ financial instruments are market price, (including foreign currency and price and interest rate), liquidity, credit and custody risks. The Manager reviews policies for managing these risks and they are summarised below and on the following page(s).
Global Exposure Following the assessment of the investment policy of each Fund, Invesco Global Asset Management DAC has decided to use Value at Risk (VaR) for the assessment of the global exposure of each Fund.
Value-at-Risk (VaR) is a statistical measurement. It intends to measure the maximum potential loss at a given confidence level (probability) over a specific time period under normal market conditions. All of the positions within the Portfolio are taken into account for the VaR calculation, not just derivatives.
Relative VaR is calculated daily using a VaR risk model based on a two years historical simulation methodology. This method for calculating VaR contains no standard distribution assumption and assumes that history repeats itself.
The calculation standards used for the VaR model are in compliance with the provisions in box 15 of ESMA Guidelines on Risk Measurement and the calculation of Global Exposure and Counterparty Risk for UCITS (Ref:10-788) (“ESMA Guidelines”).
The Relative VaR of a UCITS cannot be more than 2 times the VaR of the reference portfolio. The Manager monitors that the VaR of the UCITS / 2* VaR of the reference portfolio is not greater than 100%.
The calculation of the Relative VaR is carried out in accordance with the following parameters:
(a) one-tailed confidence interval of 99%; (b) holding period equivalent to 1 month (i.e. 20 business days); (c) effective observation period (history) of risk factors of 500 business days (ESMA Guidelines require at least 250 business days); and (d) Daily calculation.
In line with ESMA Guidelines, as the Funds use the VaR approach to monitor the global exposure, Invesco Global Management DAC calculates the leverage for each Fund on a daily basis, as the sum of the absolute value of the notionals of the derivatives used. With respect to financial derivative instruments which do not have a notional value attached to them, the calculation of the value is based upon the market value of the equivalent position of the underlying asset that is attached to the financial derivative instrument and applied consistently and appropriately.
The average level of leverage figures provided below does not take into account any netting and hedging arrangements that the Funds may have in place at any time even though these netting and hedging arrangements are used for risk reduction purpose.
Notes to the Financial Statements (Continued) For the year ended 30 November 2016
23 Invesco Funds Series 3
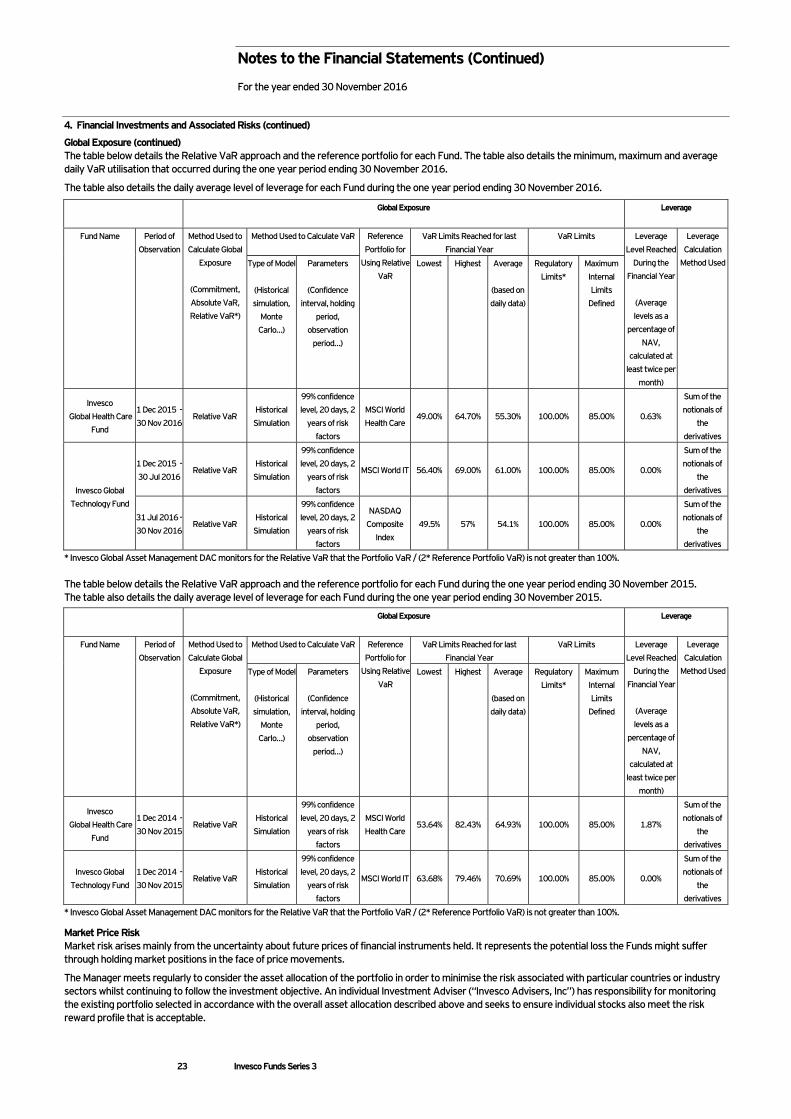
4. Financial Investments and Associated Risks (continued)
Global Exposure (continued) The table below details the Relative VaR approach and the reference portfolio for each Fund. The table also details the minimum, maximum and average daily VaR utilisation that occurred during the one year period ending 30 November 2016.
The table also details the daily average level of leverage for each Fund during the one year period ending 30 November 2016.
Global Exposure Leverage
Fund Name Period of Observation
Method Used to Calculate Global
Exposure
(Commitment, Absolute VaR, Relative VaR*)
Method Used to Calculate VaR Reference Portfolio for
Using Relative VaR
VaR Limits Reached for last Financial Year
VaR Limits Leverage Level Reached
During the Financial Year
(Average levels as a
percentage of NAV,
calculated at least twice per
month)
Leverage Calculation
Method Used Type of Model
(Historical simulation,
Monte Carlo…)
Parameters
(Confidence interval, holding
period, observation
period…)
Lowest Highest Average
(based on daily data)
Regulatory Limits*
Maximum Internal Limits
Defined
Invesco Global Health Care
Fund
1 Dec 2015 - 30 Nov 2016
Relative VaR Historical Simulation
99% confidence level, 20 days, 2
years of risk factors
MSCI World Health Care
49.00% 64.70% 55.30% 100.00% 85.00% 0.63%
Sum of the notionals of
the derivatives
Invesco Global Technology Fund
1 Dec 2015 - 30 Jul 2016
Relative VaR Historical Simulation
99% confidence level, 20 days, 2
years of risk factors
MSCI World IT 56.40% 69.00% 61.00% 100.00% 85.00% 0.00%
Sum of the notionals of
the derivatives
31 Jul 2016 - 30 Nov 2016
Relative VaR Historical Simulation
99% confidence level, 20 days, 2
years of risk factors
NASDAQ Composite
Index 49.5% 57% 54.1% 100.00% 85.00% 0.00%
Sum of the notionals of
the derivatives
* Invesco Global Asset Management DAC monitors for the Relative VaR that the Portfolio VaR / (2* Reference Portfolio VaR) is not greater than 100%. The table below details the Relative VaR approach and the reference portfolio for each Fund during the one year period ending 30 November 2015. The table also details the daily average level of leverage for each Fund during the one year period ending 30 November 2015.
Global Exposure Leverage
Fund Name Period of Observation
Method Used to Calculate Global
Exposure
(Commitment, Absolute VaR, Relative VaR*)
Method Used to Calculate VaR Reference Portfolio for
Using Relative VaR
VaR Limits Reached for last Financial Year
VaR Limits Leverage Level Reached
During the Financial Year
(Average levels as a
percentage of NAV,
calculated at least twice per
month)
Leverage Calculation
Method Used Type of Model
(Historical simulation,
Monte Carlo…)
Parameters
(Confidence interval, holding
period, observation
period…)
Lowest Highest Average
(based on daily data)
Regulatory Limits*
Maximum Internal Limits
Defined
Invesco Global Health Care
Fund
1 Dec 2014 - 30 Nov 2015
Relative VaR Historical Simulation
99% confidence level, 20 days, 2
years of risk factors
MSCI World Health Care
53.64% 82.43% 64.93% 100.00% 85.00% 1.87%
Sum of the notionals of
the derivatives
Invesco Global Technology Fund
1 Dec 2014 - 30 Nov 2015
Relative VaR Historical Simulation
99% confidence level, 20 days, 2
years of risk factors
MSCI World IT 63.68% 79.46% 70.69% 100.00% 85.00% 0.00%
Sum of the notionals of
the derivatives
* Invesco Global Asset Management DAC monitors for the Relative VaR that the Portfolio VaR / (2* Reference Portfolio VaR) is not greater than 100%.
Market Price Risk Market risk arises mainly from the uncertainty about future prices of financial instruments held. It represents the potential loss the Funds might suffer through holding market positions in the face of price movements.
The Manager meets regularly to consider the asset allocation of the portfolio in order to minimise the risk associated with particular countries or industry sectors whilst continuing to follow the investment objective. An individual Investment Adviser (“Invesco Advisers, Inc”) has responsibility for monitoring the existing portfolio selected in accordance with the overall asset allocation described above and seeks to ensure individual stocks also meet the risk reward profile that is acceptable.
Notes to the Financial Statements (Continued) For the year ended 30 November 2016
24 Invesco Funds Series 3
4. Financial Investments and Associated Risks (continued)
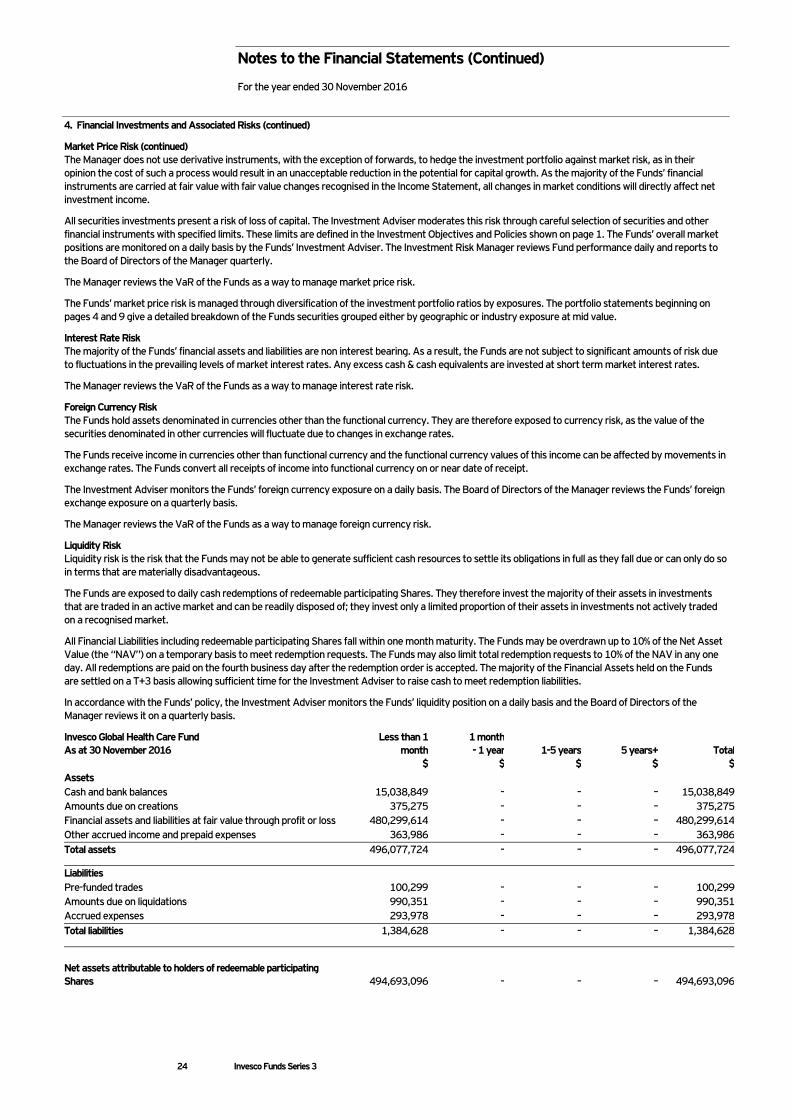
Market Price Risk (continued) The Manager does not use derivative instruments, with the exception of forwards, to hedge the investment portfolio against market risk, as in their opinion the cost of such a process would result in an unacceptable reduction in the potential for capital growth. As the majority of the Funds’ financial instruments are carried at fair value with fair value changes recognised in the Income Statement, all changes in market conditions will directly affect net investment income.
All securities investments present a risk of loss of capital. The Investment Adviser moderates this risk through careful selection of securities and other financial instruments with specified limits. These limits are defined in the Investment Objectives and Policies shown on page 1. The Funds’ overall market positions are monitored on a daily basis by the Funds’ Investment Adviser. The Investment Risk Manager reviews Fund performance daily and reports to the Board of Directors of the Manager quarterly.
The Manager reviews the VaR of the Funds as a way to manage market price risk.
The Funds’ market price risk is managed through diversification of the investment portfolio ratios by exposures. The portfolio statements beginning on pages 4 and 9 give a detailed breakdown of the Funds securities grouped either by geographic or industry exposure at mid value.
Interest Rate Risk The majority of the Funds’ financial assets and liabilities are non interest bearing. As a result, the Funds are not subject to significant amounts of risk due to fluctuations in the prevailing levels of market interest rates. Any excess cash & cash equivalents are invested at short term market interest rates.
The Manager reviews the VaR of the Funds as a way to manage interest rate risk.
Foreign Currency Risk The Funds hold assets denominated in currencies other than the functional currency. They are therefore exposed to currency risk, as the value of the securities denominated in other currencies will fluctuate due to changes in exchange rates.
The Funds receive income in currencies other than functional currency and the functional currency values of this income can be affected by movements in exchange rates. The Funds convert all receipts of income into functional currency on or near date of receipt.
The Investment Adviser monitors the Funds’ foreign currency exposure on a daily basis. The Board of Directors of the Manager reviews the Funds’ foreign exchange exposure on a quarterly basis.
The Manager reviews the VaR of the Funds as a way to manage foreign currency risk.
Liquidity Risk Liquidity risk is the risk that the Funds may not be able to generate sufficient cash resources to settle its obligations in full as they fall due or can only do so in terms that are materially disadvantageous.
The Funds are exposed to daily cash redemptions of redeemable participating Shares. They therefore invest the majority of their assets in investments that are traded in an active market and can be readily disposed of; they invest only a limited proportion of their assets in investments not actively traded on a recognised market.
All Financial Liabilities including redeemable participating Shares fall within one month maturity. The Funds may be overdrawn up to 10% of the Net Asset Value (the “NAV”) on a temporary basis to meet redemption requests. The Funds may also limit total redemption requests to 10% of the NAV in any one day. All redemptions are paid on the fourth business day after the redemption order is accepted. The majority of the Financial Assets held on the Funds are settled on a T+3 basis allowing sufficient time for the Investment Adviser to raise cash to meet redemption liabilities.
In accordance with the Funds’ policy, the Investment Adviser monitors the Funds’ liquidity position on a daily basis and the Board of Directors of the Manager reviews it on a quarterly basis.
Invesco Global Health Care Fund As at 30 November 2016
Less than 1month
1 month - 1 year 1-5 years 5 years+ Total
$ $ $ $ $Assets Cash and bank balances 15,038,849 – – – 15,038,849Amounts due on creations 375,275 – – – 375,275Financial assets and liabilities at fair value through profit or loss 480,299,614 – – – 480,299,614Other accrued income and prepaid expenses 363,986 – – – 363,986Total assets 496,077,724 – – – 496,077,724
Liabilities Pre-funded trades 100,299 – – – 100,299Amounts due on liquidations 990,351 – – – 990,351Accrued expenses 293,978 – – – 293,978Total liabilities 1,384,628 – – – 1,384,628
Net assets attributable to holders of redeemable participating Shares 494,693,096 – – – 494,693,096
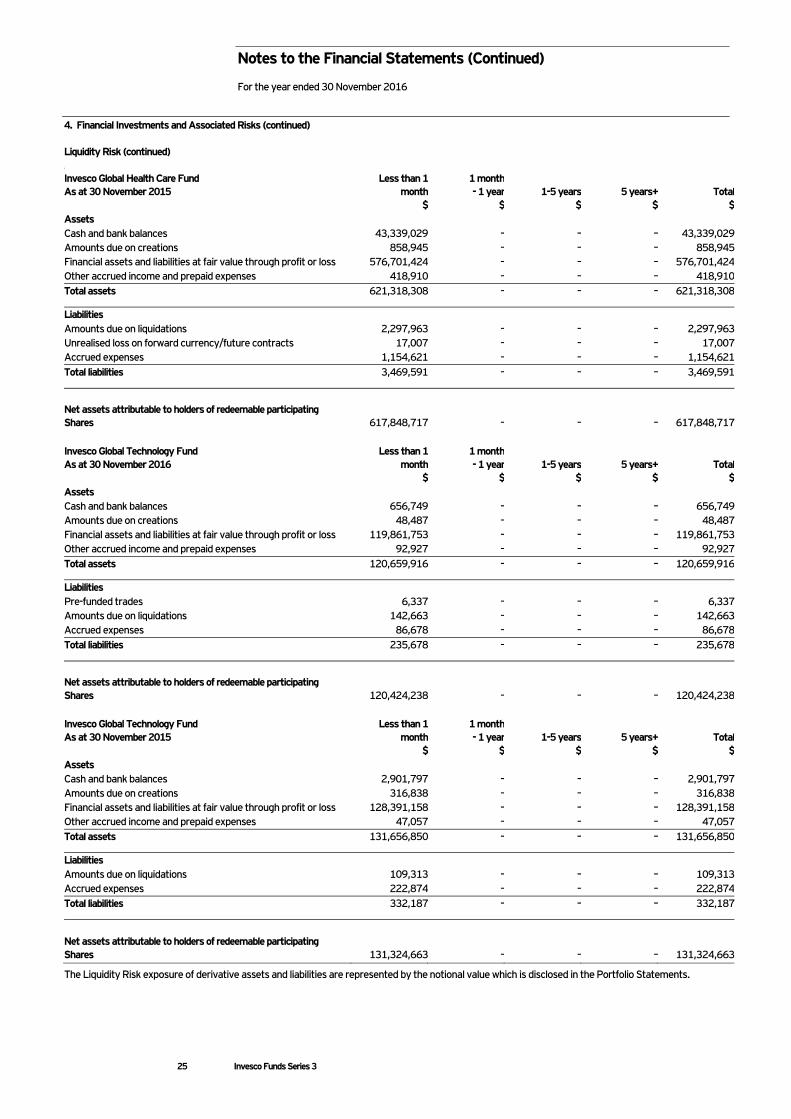
Notes to the Financial Statements (Continued) For the year ended 30 November 2016
25 Invesco Funds Series 3
4. Financial Investments and Associated Risks (continued)
Liquidity Risk (continued) ks
Invesco Global Health Care Fund As at 30 November 2015
Less than 1month
1 month - 1 year 1-5 years 5 years+ Total
$ $ $ $ $Assets Cash and bank balances 43,339,029 – – – 43,339,029Amounts due on creations 858,945 – – – 858,945Financial assets and liabilities at fair value through profit or loss 576,701,424 – – – 576,701,424Other accrued income and prepaid expenses 418,910 – – – 418,910Total assets 621,318,308 – – – 621,318,308
Liabilities Amounts due on liquidations 2,297,963 – – – 2,297,963Unrealised loss on forward currency/future contracts 17,007 – – – 17,007Accrued expenses 1,154,621 – – – 1,154,621Total liabilities 3,469,591 – – – 3,469,591
Net assets attributable to holders of redeemable participating Shares 617,848,717 – – – 617,848,717
Invesco Global Technology Fund As at 30 November 2016
Less than 1month
1 month - 1 year 1-5 years 5 years+ Total
$ $ $ $ $Assets Cash and bank balances 656,749 – – – 656,749Amounts due on creations 48,487 – – – 48,487Financial assets and liabilities at fair value through profit or loss 119,861,753 – – – 119,861,753Other accrued income and prepaid expenses 92,927 – – – 92,927Total assets 120,659,916 – – – 120,659,916
Liabilities Pre-funded trades 6,337 – – – 6,337Amounts due on liquidations 142,663 – – – 142,663Accrued expenses 86,678 – – – 86,678Total liabilities 235,678 – – – 235,678
Net assets attributable to holders of redeemable participating Shares 120,424,238 – – – 120,424,238 Invesco Global Technology Fund As at 30 November 2015
Less than 1month
1 month - 1 year 1-5 years 5 years+ Total
$ $ $ $ $Assets Cash and bank balances 2,901,797 – – – 2,901,797Amounts due on creations 316,838 – – – 316,838Financial assets and liabilities at fair value through profit or loss 128,391,158 – – – 128,391,158Other accrued income and prepaid expenses 47,057 – – – 47,057Total assets 131,656,850 – – – 131,656,850
Liabilities Amounts due on liquidations 109,313 – – – 109,313Accrued expenses 222,874 – – – 222,874Total liabilities 332,187 – – – 332,187
Net assets attributable to holders of redeemable participating Shares 131,324,663 – – – 131,324,663
The Liquidity Risk exposure of derivative assets and liabilities are represented by the notional value which is disclosed in the Portfolio Statements.

Notes to the Financial Statements (Continued) For the year ended 30 November 2016
26 Invesco Funds Series 3
4. Financial Investments and Associated Risks (continued)
Fair Value Estimation The Fund has chosen to early adopt the amendments to FRS 102 – “Fair Value Hierarchy Disclosures”, which is effective for accounting periods beginning on or after 1 January 2017.
The fair value of financial assets and liabilities traded in active markets (such as publicly trading securities) are based on quoted market prices at 12:00pm (Irish Time) on 30 November 2016 and 30 November 2015 for Financial Statement purposes.
The quoted market price used for financial assets held by the Funds is the current mid price. The appropriate quoted market price for financial liabilities is the current asking price.
A financial instrument is regarded as quoted in an active market if quoted prices are readily and regularly available from an exchange, dealer, broker, industry group, pricing service, or regulatory agency, and those prices represent actual and regularly occurring market transactions on an arm’s length basis.
The Funds are exposed to daily cash redemptions of redeemable Shares. They therefore invest the majority of their assets in investments that are traded in an active market and can be readily disposed of; they invest only a limited proportion of their assets in investments not actively traded on a recognised market.
For instruments for which there is no active market, the Funds may use internally developed models, which are usually based on valuation methods and techniques generally recognised as standard within the industry. Valuation models are used primarily to value unlisted equity instruments for which markets were or have been inactive during the financial year. Some of the inputs to these models may not be market observable and are therefore estimated based on assumptions. The output of a model is always an estimate or approximation of a value that cannot be determined with certainty, and valuation techniques employed may not fully reflect all factors relevant to the positions the Funds hold. Valuations are therefore adjusted, where appropriate, to allow for additional factors including model risk, liquidity risk and counterparty risk.
The carrying value of other receivables and payables are assumed to approximate their fair values.
The Funds classifies fair value measurements using a fair value hierarchy that reflects the significance of the inputs used in making the measurements.
The fair value hierarchy has the following levels:
– Quoted prices (unadjusted) in active markets for identical assets or liabilities (Level 1). – Inputs other than quoted prices included within Level 1 that are observable for the asset or liability, either directly (that is, as prices) or indirectly – (that is, derived from prices) (Level 2). – Inputs for the asset or liability that are not based on observable market data (that is, unobservable inputs) (Level 3).
The level in the fair value hierarchy within which the fair value measurement is categorised in its entirety is determined on the basis of the lowest level input that is significant to the fair value measurement in its entirety. For this purpose, the significance of an input is assessed against the fair value measurement in its entirety.
If a fair value measurement uses observable inputs that require significant adjustment based on unobservable inputs, that measurement is a Level 3 measurement. Assessing the significance of a particular input to the fair value measurement in its entirety requires judgement, considering factors specific to the asset or liability.
The determination of what constitutes ‘observable’ requires significant judgement by the Directors of the Manager. The Funds consider observable data to be that market data that is readily available, regularly distributed or updated, reliable and verifiable, not proprietary, and provided by independent sources that are actively involved in the relevant market.
The level assigned to the securities valuations may not be an indication of the risk or liquidity associated with investing in those securities. Because of the inherent uncertainties of valuation, the values reflected in the Financial Statements may materially differ from the value received upon actual sale of those investments.
The following tables provide an analysis of financial instruments as at 30 November 2016 and 30 November 2015 that are measured in accordance with FRS102 and have early adopted FRED 62 Amendments to FRS102 - Fair Value Hierarchy Disclosures. The comparative figures have been reclassified to conform to current year presentation.
30 November 2016
Invesco Global Health Care Fund Level 1 Level 2 Level 3 TotalFinancial assets designated at fair value through profit or loss at inception: $ $ $ $Equity securities 480,299,614 – – 480,299,614Total Investments 480,299,614 – – 480,299,614
Invesco Global Technology Fund Level 1 Level 2 Level 3 TotalFinancial assets designated at fair value through profit or loss at inception: $ $ $ $Equity securities 119,861,753 – – 119,861,753Total Investments 119,861,753 – – 119,861,753

Notes to the Financial Statements (Continued) For the year ended 30 November 2016
27 Invesco Funds Series 3
4. Financial Investments and Associated Risks (continued)
Fair Value Estimation (continued)
30 November 2015
Invesco Global Health Care Fund Level 1 Level 2 Level 3 TotalFinancial assets designated at fair value through profit or loss at inception: $ $ $ $Equity securities 576,176,676 – – 576,176,676Derivatives – 524,748 – 524,748Total Investments 576,176,676 524,748 – 576,701,424
Liabilities Derivatives – 17,007 – 17,007Total Liabilities – 17,007 – 17,007
Invesco Global Technology Fund Level 1 Level 2 Level 3 TotalFinancial assets designated at fair value through profit or loss at inception: $ $ $ $Equity securities 128,391,158 – – 128,391,158Total Investments 128,391,158 – – 128,391,158
Investments whose values are based on quoted market prices in active markets, and therefore classified within Level 1, include active listed equities, debt securities and exchange traded derivatives. The Funds do not adjust the quoted price for these instruments.
Financial instruments that trade in markets that are not considered to be active but are valued based on quoted market prices, dealer quotations or alternative pricing sources supported by observable inputs are classified within Level 2. These include, investment-grade corporate bonds listed and over-the-counter derivatives. As Level 2 investments include positions that are not traded in active markets and/or are subject to transfer restrictions, valuations may be adjusted to reflect illiquidity and/or non-transferability, which are generally based on available market information.
Investments classified within Level 3 have significant unobservable inputs, as they trade infrequently. Level 3 instruments include corporate debt securities. As observable prices are not available for these securities, the Funds have used valuation techniques to derive the fair value.
The Funds also consider original transaction price, recent transactions in the same or similar instruments and completed third-party transactions in comparable instruments. The Funds also consider other liquidity, credit and market risk factors. The Manager may, with the consent of the Depositary, adjust the model as deemed necessary.
Credit Risk The Funds minimise concentration of credit risk by undertaking transactions with a large number of customers and counterparties on recognised and reputable exchanges. The Funds takes exposure to credit risk, which is the risk that a counter party will be unable to pay amounts in full when due.
All transactions in listed securities are settled/paid for upon delivery using approved brokers. The risk of default is considered minimal, as delivery of securities sold is only made once the broker has received payments. Payment is made on a purchase once the securities have been received by the broker. The trade will fail if either party fails to meet its obligations.
The Investment Adviser continuously monitors the Funds’ credit position.
Depositary Risk The Funds’ Depositary is BNY Mellon Trust Company (Ireland) Limited, (“the Bank”). Substantially all the cash and investments in equities of the Funds are held by BNY Mellon Trust Company (Ireland) Limited at the year end. The Funds are exposed to credit risk through the use of the Bank for their cash and investments. Bankruptcy or insolvency of the Bank may cause the Funds’ rights with respect to its cash and investments in equities held by the Bank to be delayed or limited. The maximum exposure to the risk at 30 November 2016 and 30 November 2015 is the amount of cash and margin cash disclosed in Note 6 and the investments in collective investment schemes, securities, liquidity instruments and forwards disclosed in the relevant Funds’ Portfolio of Investments.
To mitigate the risks the Funds are exposed to from the use of sub-custodians, the Investment Adviser employs appropriate procedures to ensure that the counterparties are reputable institutions and that the credit risk is acceptable to the Funds. The Funds only transact with sub-custodians that are regulated entities subject to prudential supervision, or with high credit-ratings assigned by international credit-rating agencies. In addition, the Funds’ non-cash assets are segregated and protected and this further reduces counterparty risk. Cash held by sub-custodians are not protected from insolvency or bankruptcy and this further increases counterparty risk.
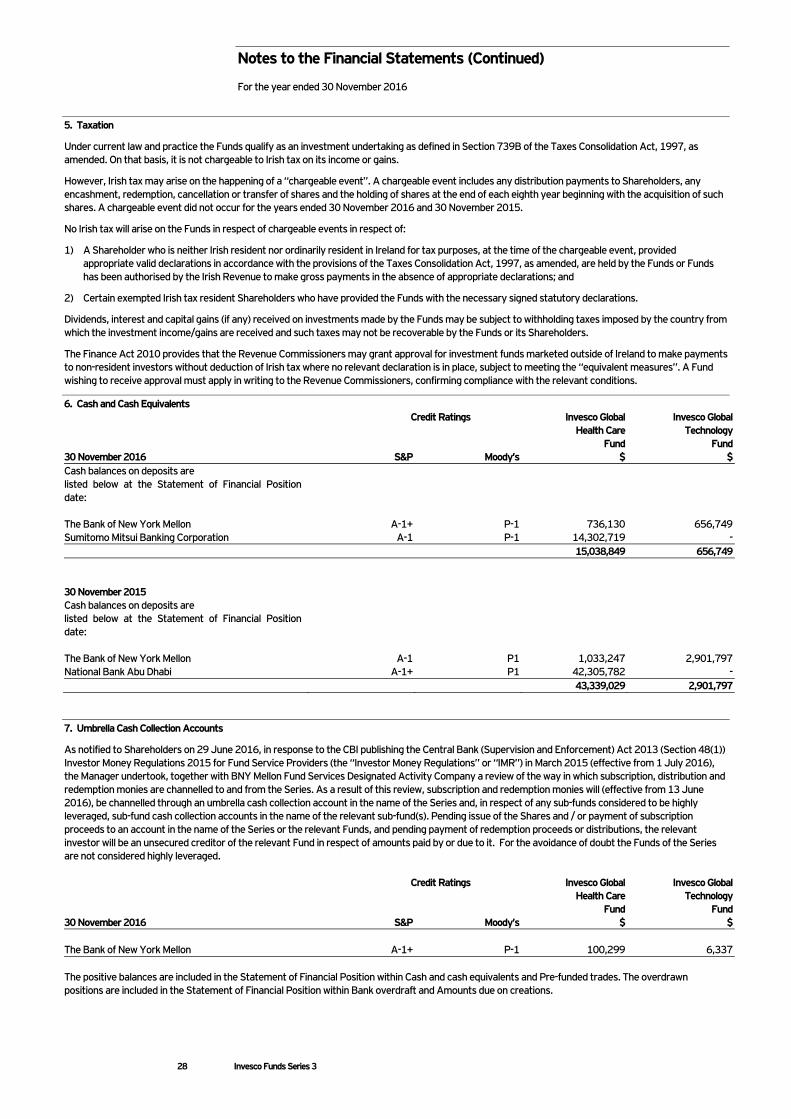
Notes to the Financial Statements (Continued) For the year ended 30 November 2016
28 Invesco Funds Series 3
5. Taxation
Under current law and practice the Funds qualify as an investment undertaking as defined in Section 739B of the Taxes Consolidation Act, 1997, as amended. On that basis, it is not chargeable to Irish tax on its income or gains.
However, Irish tax may arise on the happening of a “chargeable event”. A chargeable event includes any distribution payments to Shareholders, any encashment, redemption, cancellation or transfer of shares and the holding of shares at the end of each eighth year beginning with the acquisition of such shares. A chargeable event did not occur for the years ended 30 November 2016 and 30 November 2015.
No Irish tax will arise on the Funds in respect of chargeable events in respect of:
1) A Shareholder who is neither Irish resident nor ordinarily resident in Ireland for tax purposes, at the time of the chargeable event, provided appropriate valid declarations in accordance with the provisions of the Taxes Consolidation Act, 1997, as amended, are held by the Funds or Funds has been authorised by the Irish Revenue to make gross payments in the absence of appropriate declarations; and
2) Certain exempted Irish tax resident Shareholders who have provided the Funds with the necessary signed statutory declarations.
Dividends, interest and capital gains (if any) received on investments made by the Funds may be subject to withholding taxes imposed by the country from which the investment income/gains are received and such taxes may not be recoverable by the Funds or its Shareholders.
The Finance Act 2010 provides that the Revenue Commissioners may grant approval for investment funds marketed outside of Ireland to make payments to non-resident investors without deduction of Irish tax where no relevant declaration is in place, subject to meeting the “equivalent measures”. A Fund wishing to receive approval must apply in writing to the Revenue Commissioners, confirming compliance with the relevant conditions.
6. Cash and Cash Equivalents Credit Ratings Invesco Global
Health Care Fund
Invesco Global Technology
Fund 30 November 2016 S&P Moody’s $ $ Cash balances on deposits are listed below at the Statement of Financial Position date: The Bank of New York Mellon A-1+ P-1 736,130 656,749 Sumitomo Mitsui Banking Corporation A-1 P-1 14,302,719 - 15,038,849 656,749 30 November 2015 Cash balances on deposits are listed below at the Statement of Financial Position date: The Bank of New York Mellon A-1 P1 1,033,247 2,901,797 National Bank Abu Dhabi A-1+ P1 42,305,782 - 43,339,029 2,901,797 7. Umbrella Cash Collection Accounts
As notified to Shareholders on 29 June 2016, in response to the CBI publishing the Central Bank (Supervision and Enforcement) Act 2013 (Section 48(1)) Investor Money Regulations 2015 for Fund Service Providers (the “Investor Money Regulations” or “IMR”) in March 2015 (effective from 1 July 2016), the Manager undertook, together with BNY Mellon Fund Services Designated Activity Company a review of the way in which subscription, distribution and redemption monies are channelled to and from the Series. As a result of this review, subscription and redemption monies will (effective from 13 June 2016), be channelled through an umbrella cash collection account in the name of the Series and, in respect of any sub-funds considered to be highly leveraged, sub-fund cash collection accounts in the name of the relevant sub-fund(s). Pending issue of the Shares and / or payment of subscription proceeds to an account in the name of the Series or the relevant Funds, and pending payment of redemption proceeds or distributions, the relevant investor will be an unsecured creditor of the relevant Fund in respect of amounts paid by or due to it. For the avoidance of doubt the Funds of the Series are not considered highly leveraged. Credit Ratings Invesco Global
Health Care Fund
Invesco Global Technology
Fund 30 November 2016 S&P Moody’s $ $ The Bank of New York Mellon A-1+ P-1 100,299 6,337 The positive balances are included in the Statement of Financial Position within Cash and cash equivalents and Pre-funded trades. The overdrawn positions are included in the Statement of Financial Position within Bank overdraft and Amounts due on creations.
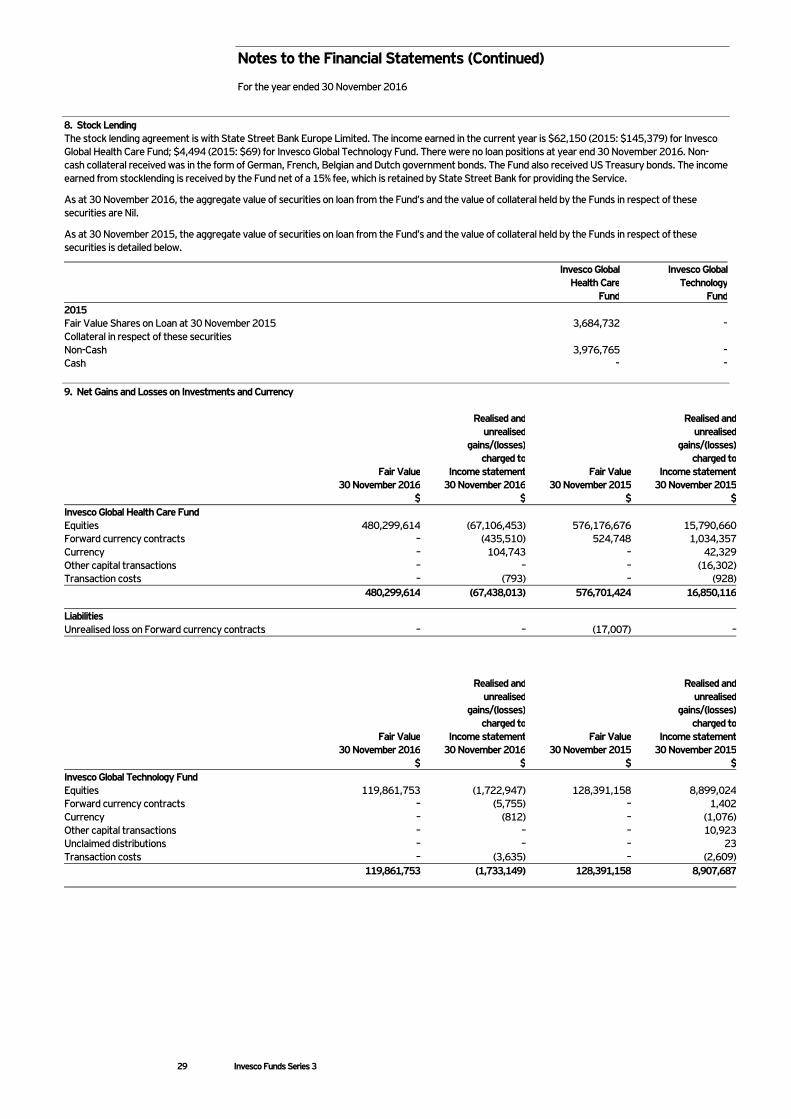
Notes to the Financial Statements (Continued) For the year ended 30 November 2016
29 Invesco Funds Series 3
8. Stock Lending The stock lending agreement is with State Street Bank Europe Limited. The income earned in the current year is $62,150 (2015: $145,379) for Invesco Global Health Care Fund; $4,494 (2015: $69) for Invesco Global Technology Fund. There were no loan positions at year end 30 November 2016. Non-cash collateral received was in the form of German, French, Belgian and Dutch government bonds. The Fund also received US Treasury bonds. The income earned from stocklending is received by the Fund net of a 15% fee, which is retained by State Street Bank for providing the Service.
As at 30 November 2016, the aggregate value of securities on loan from the Fund’s and the value of collateral held by the Funds in respect of these securities are Nil.
As at 30 November 2015, the aggregate value of securities on loan from the Fund’s and the value of collateral held by the Funds in respect of these securities is detailed below.
Invesco Global Health Care
Fund
Invesco Global Technology
Fund2015 Fair Value Shares on Loan at 30 November 2015 3,684,732 –Collateral in respect of these securities Non-Cash 3,976,765 –Cash – – 9. Net Gains and Losses on Investments and Currency
Fair Value30 November 2016
$
Realised andunrealised
gains/(losses)charged to
Income statement30 November 2016
$
Fair Value30 November 2015
$
Realised andunrealised
gains/(losses)charged to
Income statement30 November 2015
$Invesco Global Health Care Fund Equities 480,299,614 (67,106,453) 576,176,676 15,790,660 Forward currency contracts – (435,510) 524,748 1,034,357 Currency – 104,743 – 42,329 Other capital transactions – – – (16,302) Transaction costs – (793) – (928) 480,299,614 (67,438,013) 576,701,424 16,850,116
Liabilities Unrealised loss on Forward currency contracts – – (17,007) –
Fair Value30 November 2016
$
Realised andunrealised
gains/(losses)charged to
Income statement30 November 2016
$
Fair Value30 November 2015
$
Realised andunrealised
gains/(losses)charged to
Income statement30 November 2015
$Invesco Global Technology Fund Equities 119,861,753 (1,722,947) 128,391,158 8,899,024 Forward currency contracts – (5,755) – 1,402 Currency – (812) – (1,076) Other capital transactions – – – 10,923 Unclaimed distributions – – – 23 Transaction costs – (3,635) – (2,609) 119,861,753 (1,733,149) 128,391,158 8,907,687

Notes to the Financial Statements (Continued) For the year ended 30 November 2016
30 Invesco Funds Series 3
10. Distribution to ‘A-AD’, ‘B-AD’, ‘C-AD’ and ‘Z-AD’ Shareholders
There were no distributions on Invesco Global Health Care Fund and Invesco Global Technology Fund for the years ended 30 November 2016 and 30 November 2015.
11. Efficient Portfolio Management
Forward foreign currency exchange contracts may be used to hedge against anticipated future changes in exchange rates which otherwise might either adversely affect the value of the Funds’ portfolio securities or adversely affect the price of securities which the Funds intend to purchase at a later date. Forward currency contracts are fair valued at the prevailing forward rate at the reporting date. The resulting unrealised gains and losses for the year are included in the Statement of Financial Position and the Income Statement. Realised gains or losses on maturity are presented in the Income Statement.
The Funds may also engage in forward currency transactions and utilise futures and options for efficient portfolio management or hedging purposes under the conditions and within the limits laid down by the Central Bank and, if more restrictive, the Securities and Futures Commission.
There were no forward currency contracts, futures or options held at the year ended 30 November 2016 and 30 November 2015.
Please refer to Note 8 for details relating to Stock Lending.
12. Transaction Costs
Transaction costs incurred by the Funds relating to purchase or sale of transferable securities, money market instruments, derivatives or other eligible assets are mainly composed of sub-custodian fees and broker commissions. Transaction fees are included in the transaction price used to calculate the realised and unrealised gain/(loss) on securities. Custody transaction costs are disclosed in Note 9. For the year ended 30 November 2016, custody transaction costs associated with Invesco Global Health Care Fund were $793 (2015: $928) and Invesco Global Technology Fund were $3,635 (2015: $2,609).
For the year ended 30 November 2016, other transactions costs amounted to:
Fund Ccy Transaction CostsInvesco Global Health Care Fund USD 271,253Invesco Global Technology Fund USD 82,332
For the year ended 30 November 2015, other transactions costs amounted to:
Fund Ccy Transaction CostsInvesco Global Health Care Fund USD 378,393Invesco Global Technology Fund USD 85,209 13. Significant Events During the Year
In accordance with the requirements of UCITS V: BNY Mellon Trust Company (Ireland) Limited was the Trustee for the Funds until 17 March 2016 and from 18 March 2016 assumed the role of Depositary for the Funds.
A new Consolidated Prospectus for Invesco Funds Series 1, 2, 3, 4, 5, 6, and Invesco Fund Series was issued on 29 July 2016.
Effective 29 July 2016, due to a change in the Distribution Policy of the Funds, for annual distributions made on the last Business Day of November, payments will now be made on 11 December.
There were no other significant events during the year ended 30 November 2016.
14. Subsequent Events
An updated Consolidated Prospectus for Invesco Fund Series 1, 2, 3, 4, 5, 6 and the Invesco Fund Series was issued on the 15 February 2017.
There were no other subsequent events since the year ended 30 November 2016, that could have an effect on these Financial Statements.
15. Approval of Financial Statements
The Financial Statements were approved by the Directors of the Manager on 21 March 2017.
Statement of the Manager’s and Depositary’s Responsibilities
31 Invesco Funds Series 3
The Manager is required under the European Communities (Undertakings for Collective Investment in Transferable Securities) Regulations 2015 (the “UCITS Regulations”), to prepare Financial Statements for each financial period reporting the financial position of each Fund in the Invesco Funds Series 3 (the “Series”) as at the end of the accounting period and of its income/excess of expenditure over income for the period. In preparing those Financial Statements, the Manager:
– ensures that the Financial Statements comply with the Trust Deed and FRS 102 applicable accounting standards subject to any material departures which are disclosed and explained in the Financial Statements;
– selects suitable accounting policies and then applies them consistently;
– makes judgements and estimates that are reasonable and prudent; – prepares the Financial Statements on the going concern basis unless
it – is inappropriate to presume that the Series will continue in operation;
and – is responsible for taking reasonable steps for the prevention and
detection of fraud, error, or non-compliance with laws or the UCITS Regulations, and other irregularities.
The Manager is required to keep proper accounting records and to manage the Series in accordance with the UCITS Regulations, the Hong Kong Code on Unit Trusts, Mutual Funds and the Trust Deed.
The Directors of the Manager of the Series are responsible for the maintenance and integrity of the information related to the Series on the Invesco website. Information on the internet is accessible in many countries with different legal requirements. Legislation in Ireland governing the preparation and dissemination of Financial Statements may differ from legislation in other jurisdictions.
The Directors of the Manager are satisfied that there are arrangements (evidenced by written procedures) in place, to ensure that the obligations set out in Notice 41(1) are applied to all transactions with connected persons. All transactions with connected persons are at arms length.
The Directors of the Manager are satisfied that transactions with connected persons entered into during the period complied with the obligations set out in Notice 41(1). A connected person is defined as the promoter, manager, depositary, investment adviser and/or associated or group companies of these.
The Depositary is required under the UCITS Regulations to:
1. ensure that the sale, issue, repurchase, redemption and cancellation of Shares effected by or on behalf of the Funds are carried out in accordance with the UCITS Regulations and in accordance with the Trust Deed.
2. ensure that the value of Shares is calculated in accordance with the UCITS Regulations and the Trust Deed.
3. carry out the instructions of the Manager unless they conflict with the UCITS Regulations or the Trust Deed.
4. ensure that where transactions involve the Funds’ assets, any consideration is remitted to the Fund within time limits which are acceptable market practice in the context of such transaction.
5. ensure that the Funds’ income is applied in accordance with the UCITS Regulations and the Trust Deed.
6. enquire into the conduct of the Manager in each annual accounting period and report thereon to the Shareholders. The Depositary’s report shall be delivered to the Manager in good time to enable the Manager to include a copy of the report in its Annual Report. The Depositary’s Report shall state whether in the Depositary’s opinion the Funds have been managed in that period:
(i) in accordance with the limitations imposed on the investment and borrowing powers of the Manager and Depositary by the Trust Deed and the UCITS Regulations; and
(ii) otherwise in accordance with the provisions of the Trust Deed and the UCITS Regulations.
If the Manager does not comply with (i) or (ii) above, the Depositary must state why this is the case and outline the steps which the Depositary has taken to rectify the situation.
The Depositary must notify the Central Bank of Ireland promptly of any material breach of the UCITS Regulations, conditions imposed by the Central Bank of Ireland or provisions of the Prospectus with regard to the Funds.
The duties provided for above may not be delegated by the Depositary to a third party. These duties must be carried out in the State.
The Depositary also takes into its custody or under its control all the assets of the Funds and holds them in safekeeping for the Shareholders. The Depositary will provide record keeping and ownership verification services in respect of assets of the Trust not held in custody in accordance with the provisions of the UCITS Directive and the UCITS Regulations. The Depositary will also provide cash monitoring services in respect of each Fund’s cash flows and subscriptions.
Report of the Independent Auditors to the Shareholders of Invesco Funds Series 3
32 Invesco Funds Series 3
Report on the financial statements
Our opinion In our opinion, Invesco Funds Series 3s’ financial statements (the “financial statements”):
• give a true and fair view of the Funds’ assets, liabilities and financial position as at 30 November 2016 and of their results for the year then ended;
• have been properly prepared in accordance with Generally Accepted Accounting Practice in Ireland; and
• have been properly prepared in accordance with the requirements of the European Communities (Undertakings for Collective Investment in Transferable Securities) Regulations 2011 (as amended).
What we have audited The financial statements, included within the Annual Report, comprise:
• the Statement of Financial Position as at 30 November 2016;
• the Income Statement for the year then ended;
• the Statement of Changes in Net Assets attributable to Holders of Redeemable Participating Shares for the year then ended;
• the Portfolio Statement for each of the Funds as at 30 November 2016; and
• the notes to the financial statements for each of its Funds which include a summary of significant accounting policies and other explanatory information.
The financial reporting framework that has been applied in the preparation of the financial statements is Irish law and accounting standards issued by the Financial Reporting Council and promulgated by the Institute of Chartered Accountants in Ireland (Generally Accepted Accounting Practice in Ireland), including FRS 102 “The Financial Reporting Standard applicable in the UK and Republic of Ireland”.
In applying the financial reporting framework, the manager has made a number of subjective judgements, for example in respect of significant accounting estimates. In making such estimates, the manager has made assumptions and considered future events. Responsibilities for the financial statements and the audit
Our responsibilities and those of the manager As explained more fully in the Statement of the Manager’s and Depositary’s Responsibilities set out on page 31 the manager is responsible for the preparation of the financial statements giving a true and fair view.
Our responsibility is to audit and express an opinion on the financial statements in accordance with Irish law and International Standards on Auditing (UK and Ireland). Those standards require us to comply with the Auditing Practices Board’s Ethical Standards for Auditors.
This report, including the opinion, has been prepared for and only for the unitholders of each of the Funds as a body and for no other purpose. We do not, in giving this opinion, accept or assume responsibility for any other purpose or to any other person to whom this report is shown or into whose hands it may come save where expressly agreed by our prior consent in writing.
What an audit of financial statements involves
We conducted our audit in accordance with International Standards on Auditing (UK and Ireland). An audit involves obtaining evidence about the amounts and disclosures in the financial statements sufficient to give reasonable assurance that the financial statements are free from material misstatement, whether caused by fraud or error. This includes an assessment of:
• whether the accounting policies are appropriate to the Funds’ circumstances and have been consistently applied and adequately disclosed;
• the reasonableness of significant accounting estimates made by the manager; and
• the overall presentation of the financial statements.
We primarily focus our work in these areas by assessing the manager’s judgements against available evidence, forming our own judgements, and evaluating the disclosures in the financial statements.
We test and examine information, using sampling and other auditing techniques, to the extent we consider necessary to provide a reasonable basis for us to draw conclusions. We obtain audit evidence through testing the effectiveness of controls, substantive procedures or a combination of both.
In addition, we read all the financial and non-financial information in the Annual Report to identify material inconsistencies with the audited financial statements and to identify any information that is apparently materially incorrect based on, or materially inconsistent with, the knowledge acquired by us in the course of performing the audit. If we become aware of any apparent material misstatements or inconsistencies we consider the implications for our report. PricewaterhouseCoopers Chartered Accountants and Registered Auditors One Spencer Dock North Wall Quay Dublin 1 Ireland Date: 21 March 2017 (a) The maintenance and integrity of the www.invesco.com website is the
responsibility of the manager; the work carried out by the auditors does not involve consideration of these matters and, accordingly, the auditors accept no responsibility for any changes that may have occurred to the financial statements since they were initially presented on the website.
(b) Legislation in the Republic of Ireland governing the preparation and dissemination of financial statements may differ from legislation in other jurisdictions.
The Financial Statements are published through www.invesco.com. The Directors of the Manager together with the Investment Adviser are responsible for the maintenance and integrity of the website as far as it relates to Invesco Funds Series 3. The work carried out by the auditors does not involve consideration of the maintenance and integrity of the website and accordingly, the auditors accept no responsibility for any changes that have occurred to the Financial Statements presented on the website. Legislation in the Republic of Ireland governing the presentation and dissemination of the Financial Statements may differ from legislation in other jurisdictions.

Report of the Depositary to the Shareholders
33 Invesco Funds Series 3
BNY Mellon Trust Company (Ireland) Limited (the “Depositary”, “us”, “we”, or “our”), has enquired into the conduct of the Manager in respect of Invesco Funds Series 3 (the “Series”)for the year ended 30 November 2016 , in our capacity as Depositary to the Series.
This report including the opinion has been prepared for and solely for the unitholders in the Trust, in accordance with Regulation 34 of the European Communities (Undertakings for Collective Investment in Transferable Securities) Regulations 2011 (S.I. No 352 of 2011), (The “Regulations”), and for no other purpose. We do not, in giving this opinion, accept or assume responsibility for any other purpose or to any other person to whom this report is shown.
Responsibilities of the Depositary Our duties and responsibilities are outlined in Regulation 34 of the Regulations. One of those duties is to enquire into the conduct of the Series in each annual accounting period and report thereon to the Unitholders.
Our report shall state whether, in our opinion, the management has managed the Series in that period in accordance with the provisions of the Series’ Trust Deed and the Regulations. It is the overall responsibility of the Manager to comply with these provisions. If the management of the Series has not done so, we as depositary must state in what respects it has not done so and the steps which we have taken in respect thereof.
Basis of Depositary Opinion The Depositary conducts such reviews as it, in its reasonable opinion, considers necessary in order to comply with its duties as outlined in Regulation 34 of the Regulations and to ensure that, in all material respects, the management has managed the Series (i) in accordance with the limitations imposed on its investment and borrowing powers by the provisions of its constitutional documentation and appropriate regulations and (ii) otherwise in accordance with the Series’ constitutional documentation and appropriate regulations.
Opinion In our opinion, the management has managed the Series during the year, in all material respects: (i) in accordance with the limitations imposed on the investment and
borrowing powers of the Manager and Depositary by the Trust Deed and by the Regulations; and
(ii) otherwise in accordance with the provisions of the Trust Deed and the
Regulations. For and on behalf of BNY Mellon Trust Company (Ireland) Limited Guild House, Guild Street, IFSC, Dublin 1, Ireland. Date: 21 March 2017

Additional Information (Unaudited)
34 Invesco Funds Series 3
Remuneration Policy
Following recent changes to the rules applicable to UCITS management companies (such as the Manager, Invesco Global Asset Management DAC), the Manager adopted on 18 March 2016 a revised remuneration policy which is consistent with the new remuneration principles applicable to UCITS management companies. Its purpose is to ensure that the remuneration of the staff of the Manager is consistent with and promote sound and effective risk management, does not encourage risk-taking which is inconsistent with the risk profiles, rules or instruments of incorporation of itself and the UCITS it manages (including the Company) and does not impair the Manager’s compliance with its duty to act in the best interests of the UCITS it manages. Further information is available in the Manager’s UCITS Remuneration Policy document which can be obtained from the website of the Manager (www.invescomanagementcompany.ie). A copy may be obtained, free of charge, at the registered office of the Manager.
The rules require the Manager to disclose in the Company’s annual report, certain quantitative disclosures concerning the Manager’s remuneration policy, including:
(i) the total and aggregate amount of remuneration paid by the Manager to its staff (including any amounts paid directly by the Company); (ii) the number of beneficiaries; (iii) a description of how the remuneration and benefits have been calculated; and (iv) certain information regarding the Manager’s oversight of its remuneration policy and details of any changes to the Manager’s remuneration policies since the previous annual report. However, as noted above, the revised policy has been in place for less than a full performance period. Consequently, in accordance with the relevant rules, the aforementioned disclosures are not included in this report as the available partial-year information would not provide materially relevant, reliable, comparable and clear information to investors. The Manager will disclose the quantitative UCITS remuneration data in the next annual report for the Company where information for a full performance year will be available.
Securities Financing Transactions Regulation
As at 30 November 2016, the aggregate value of securities on loan from the Funds and the value of collateral held by the Funds in respect of these securities was Nil.
General Information
35 Invesco Funds Series 3
Directors of the Manager L. Schmidt - (American) C. O Sullivan - (Irish) D. Sharp (Canadian) S. Hofmann (German) W. Manahan (Irish, Independent Director)
Global Distributor, Manager and Administrator Invesco Global Asset Management DAC** Registered Office (effective from 29 March 2016) Central Quay Riverside IV Sir John Rogersons Quay Dublin 2 Ireland
Registered Office (until 29 March 2016) George’s Quay House 43 Townsend Street Dublin 2 Ireland
Correspondence address for Global Distributor c/o International Financial Data Services (Ireland) Limited Bishop’s Square Redmond’s Hill Dublin 2 Ireland
Registrar and Transfer Agent International Financial Data Services (Ireland) Limited Bishop’s Square Redmond’s Hill Dublin 2 Ireland
Sub-Administrator BNY Mellon Fund Services (Ireland) Designated Activity Company* Guild House Guild Street International Financial Services Centre Dublin 1 Ireland
Secretary Invesco Asset Management Limited Perpetual Park, Perpetual Park Drive Henley-on-Thames Oxfordshire RG9 1HH United Kingdom
Depositary*** BNY Mellon Trust Company (Ireland) Limited Guild House Guild Street International Financial Services Centre Dublin 1 Ireland
Hong Kong Sub-Distributor and Representative Invesco Asset Management Asia Limited 41/F Champion Tower 3 Garden Road, Central Hong Kong
Swiss Representative Invesco Asset Management (Switzerland) Limited Talacker 34 8001 Zurich Switzerland
German Information Agent Invesco Asset Management Deutschland GmbH Registered Office An der Welle 5 D-60322 Frankfurt am Main Germany
United Kingdom Representative Invesco Global Investment Funds Limited Perpetual Park, Perpetual Park Drive Henley-on-Thames Oxfordshire RG9 1HH United Kingdom
Independent Auditors of the Fund and Management Company Auditors PricewaterhouseCoopers Chartered Accountants One Spencer Dock North Wall Quay Dublin 1 Ireland
Investment Advisers Invesco Advisers, Inc. 1555 Peachtree Street N.E. Atlanta Georgia GA 30309 USA
Austrian Distributor Invesco Asset Management Österreich GmbH Rotenturmstraße 16-18 A-1010 Vienna, Austria
Austrian Paying Agent Erste Bank der oesterreichischen Sparkassen AG Am Belvedere 1 A–1100 Wien Austria
German Paying Agent BNP Paribas Securities Services S.C.A. Zweigniederlassung Frankfurt am Main Europa-Allee 12 D-60327 Frankfurt Germany
Legal Advisor Matheson 70 Sir John Rogerson’s Quay Dublin 2 Ireland The latest Financial Statements are also available through Invesco’s Internet site www.invesco.com. For Shareholders in Hong Kong please refer to www.invesco.com.hk * Effective 27 January 2016, the Sub-Administrator converted to a Designated Activity Company pursuant to the Companies Act 2014 and changed its name from BNY Mellon Fund Services (Ireland) Limited to BNY Mellon Fund Services (Ireland) Designated Activity Company. ** Effective 12 May 2016, the Manager converted to a Designated Activity Company pursuant to the Companies Act 2014 and updated its name from Invesco Global Asset Management Limited to Invesco Global Asset Management DAC (Designated Activity Company). *** In accordance with the requirements of UCITS V: BNY Mellon Trust Company (Ireland) Limited was the Trustee for the Funds until 17 March 2016 and from 18 March 2016 assumed the role of Depositary for the Funds. Invesco Limited Representative Offices Austria Invesco Asset Management Österreich GmbH Rotenturmstraße 16 -18 A-1010 Vienna Austria Tel: +43 1 316 20 00 Fax: +43 1 316 20 20 Belgium, Norway, Denmark, and Finland Invesco Asset Management S.A Belgium Branch 235 Avenue Louise 1050 Brussels Belgium Tel: +322 641 0170 Fax: +322 641 0175 France Invesco Asset Management S.A. 18, rue de Londres 75009 Paris France Tel: +33 1 56 62 43 00 Fax: +33 1 56 62 43 83/43 20
Germany Invesco Asset Management Deutschland GmbH An der Welle 5 D-60322 Frankfurt am Main Germany Tel: +49 69 29807 0 Fax: +49 69 29807 159 Hong Kong and Macau Invesco Asset Management Asia Limited 41/F Champion Tower 3 Garden Road, Central Hong Kong Tel: +852 3128 6000 Fax: +852 3128 6001 Ireland Invesco Global Asset Management DAC Central Quay Riverside IV Sir John Rogerson’s Quay Dublin 2 Ireland Tel: +353 1 439 8000 Fax: +353 1 439 8400 Italy and Greece Invesco Asset Management S.A Sede Secondaria Piazza Tommaso Edison, 1 20123 Milano Italy Tel: +39 02 88074 1 Fax: +39 02 88074 391 The Netherlands Invesco Asset Management S.A. Dutch Branch J.C. Geesinkweg 999 1096 AZ Amsterdam The Netherlands Tel: +31 205 61 62 61 Fax: +31 205 61 68 88 Spain and Latin America Invesco Asset Management S.A. Sucursal en España C/ Recoletos, 15 28001 Madrid, Spain Tel: + 34 91 781 3020 Fax: + 34 91 576 0520 Sweden Invesco Asset Management S.A. (France) Swedish Filial Stureplan 4c 4th Floor, Stockholm 11435 Sweden Tel: +46 8 463 11 06 Fax: +46 2 641 01 75

Contact Us
Invesco Global Asset Management DAC Manager/Global Distributor, Registered Office (effective from 29 March 2016) Central Quay Riverside IV Sir John Rogersons Quay, Dublin 2, Ireland Telephone: +353 1 439 8000 Website: www.invesco.com Registered Office (until 29 March 2016) George’s Quay House 43 Townsend Street, Dublin 2 Ireland Invesco Asset Management Asia Limited Hong Kong Sub-Distributor and Representative 41/F Champion Tower 3 Garden Road, Central Hong Kong Telephone: +852 3128 6000 Facsimile: +852 3128 6001 Website: www.invesco.com.hk


