University of Nebraska - Lincoln DigitalCommons@University of Nebraska - Lincoln Nebraska Department of Transportation Research Reports Nebraska LTAP 9-2005 Investigating Binder Flushing of SP-2 Mixes Magdy A. Abdelrahman Follow this and additional works at: hp://digitalcommons.unl.edu/ndor Part of the Transportation Engineering Commons is Article is brought to you for free and open access by the Nebraska LTAP at DigitalCommons@University of Nebraska - Lincoln. It has been accepted for inclusion in Nebraska Department of Transportation Research Reports by an authorized administrator of DigitalCommons@University of Nebraska - Lincoln. Abdelrahman, Magdy A., "Investigating Binder Flushing of SP-2 Mixes" (2005). Nebraska Department of Transportation Research Reports. 24. hp://digitalcommons.unl.edu/ndor/24
Transcript
University of Nebraska - LincolnDigitalCommons@University of Nebraska - LincolnNebraska Department of Transportation ResearchReports Nebraska LTAP
9-2005
Investigating Binder Flushing of SP-2 MixesMagdy A. Abdelrahman
Follow this and additional works at: http://digitalcommons.unl.edu/ndor
Part of the Transportation Engineering Commons
This Article is brought to you for free and open access by the Nebraska LTAP at DigitalCommons@University of Nebraska - Lincoln. It has beenaccepted for inclusion in Nebraska Department of Transportation Research Reports by an authorized administrator of DigitalCommons@University ofNebraska - Lincoln.
Abdelrahman, Magdy A., "Investigating Binder Flushing of SP-2 Mixes" (2005). Nebraska Department of Transportation ResearchReports. 24.http://digitalcommons.unl.edu/ndor/24
List of FiguresFigure 1-1: Map of Nebraska with Locations of Flushed Sections ........................... 20Figure 1-2: Comparisons of Extracted Cores and Original Asphalt by WRI (5)..... 20Figure 1-3: Frequency of Maximum Daily Pavement Temperature, Highway-56..21Figure 1-4: Comparisons of QA/QC Data with Field Cores for Highway-56.......... 22Figure 1-5: Effects of Traffic Loads on Flushing Severity.......................................... 23
Investigating Binder Flushing of SP-2 Mixes iv
List of Tables
Table 1-1: Superpave Mix Level-2 in Nebraska............................................................. 16Table 1-2: Considered SP-2 Sections .............................................................................. 16Table 1-3: Summary of Thermal Analysis of the Highway-43 Samples.................. 16Table 1-4: Testing on Extracted Binders at 58 degrees C .......................................... 17Table 1-5: Testing on Extracted Binders at 19 degrees C .......................................... 18Table 1-6: Average Maximum Seven Day Pavement Temperature, Highway-56 ... 18Table 1-7: Mix Design and Parameters for Flushed and Non-Flushed Sections.... 19
Investigating Binder Flushing of SP-2 Mixes v
Acknowledgement
The author would like to thank the Nebraska Department of Roads for
sponsoring this research. Special acknowledgement is to Mr. Mukunda
Gopalakrishna in performing some tables and graphs required, and to Mr.
Udit Molakatalla, to Mr. Larry Koves and to Mr. John Dageforde in perform-
ing the required testing.
Toward Development of a Steel Bridge System 1
IntroductionMix bleeding, or binder flushing, is migration of the bitumen to the surface
of the flexible pavement, with or without fines. Krishnan and Rao (1, 2)
indicated that migration can happen by means of two mechanisms: first,
by the diffusion of asphalt into the air voids when it is subjected to tem-
perature exceeding its softening point and second by the movement of
asphalt due to pressure gradient developed in asphalt. The development of
this pressure gradient is due to the reduction of air voids under traffic
loads. Both mechanisms can occur simultaneously and the contribution of
each depends very much on the temperature-stiffness relationship of the
binder, the air voids distribution in the mix and the traffic loads to which
the pavement is subjected to. Literature (3, 4) lists mix segregation and
binder contamination during the construction process as possible causes
of binder flushing.
ObjectivesThe objective of this study is to analyze available data on early flushing
sections of Superpave mixes in Nebraska and to have a better understand-
ing of the possible causes.
Superpave Flushing Cases in NebraskaBinder flushing was observed in pavement sections with Superpave level-2
mixes (SP-2) in Nebraska. The sections were constructed between 1999 and
2000 and flushing was observed from 2000 to 2002. At the time of con-
struction, quality assurance (QA) data by the Nebraska Department of
Roads (NDOR) and quality control (QC) data by the contractors showed
compliance with the then current specifications of SP-2 mixes. Figure 1
shows a map of the State of Nebraska with the locations of flushed sec-
Investigating Binder Flushing of SP-2 Mixes 2
tions. The distribution shown indicates that flushing was not region spe-
cific. SP-2 is a county road mix with a majority of natural aggregate
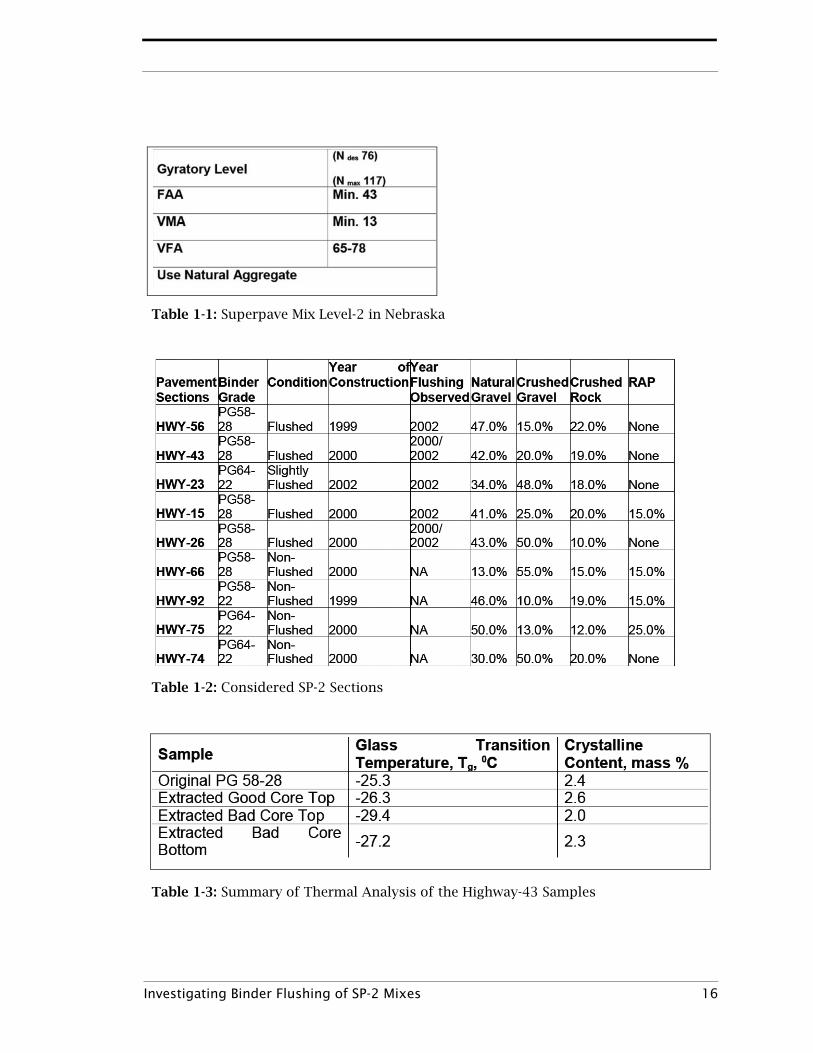
components. Table 1 shows current design criteria for SP-2 mixes. Values
shown in the table may be slightly different from the specifications at the
time the flushed sections were constructed. NDOR provided records of
thirty five projects with SP-2 mixes. Eleven sections had PG58-28 binders.
Five of the PG58-28 sections were flushed. Twenty four sections had PG 64-
22 binders with only one case exhibiting low severity flushing in limited
areas. Table 2 shows a list of the sections considered in this study. The
flushed sections were reported to have an Average Daily Truck Traffic
(ADTT) from 190 to 230, both ways.
The most rapid onset of flushing occurred within few weeks after construc-
tion. That was in the summer of 2000 on Highway-43. Because of the high
severity of flushing, the surface was milled late 2000 with no further reha-
bilitation actions. Flushing was observed again in the same section in late
summer 2002, but with a much lower severity. During the 2000 flushing
case, field cores were obtained and analyzed by the Western Research Insti-
tute (WRI) for chemical and physical properties on the binder and by NDOR
for mix parameters (5). Table 3 and Figure 2 from the report by WRI provide
sample results of testing on the original and extracted binders. The study
by WRI did not find any conclusive evidence as to the cause of the flushing
problem on Highway-43 but the analysis showed very unusual chemical
properties of the extracted asphalt that were significantly different from
the original asphalt and most likely contributed to the problem. Results by
WRI showed lower boiling point materials in the extracted cores that did
not exist in the original binder. Extracted binders were substantially softer
than the original binder. There were indications of low compatibility
asphalt that may suffer separation and behave as an oily material. The orig-
inal mix design called for 5% asphalt by weight while flushed cores showed
higher asphalt content with an average value of 6.99% by weight. Non-
Investigating Binder Flushing of SP-2 Mixes 3
flushed cores showed an average value of 4.92% asphalt content. The
report by WRI also indicated that similar problems were experienced in
other states at about the same time.
More flushing cases were observed between 2000 and 2002. The condition
ranged from medium to severe. Flushing usually started with a few spots
of asphalt on the pavement surface. The number of asphalt spots contin-
ued to increase during the hot summer days. The spots gathered to form
a distressed area and the size of the affected areas continued to increase
during the summer time. All sections had scattered flushed areas, up to
200 feet long with one, or both, wheel paths flushed. None of the affected
sections were fully flushed. No significant rutting was reported in any of
the flushed sections and surface conditions were very good with no indica-
tion of any defects. Cores taken from the flushed areas showed no signs of
moisture-related distresses.
Study PlanA study plan was developed that included comparisons with selected non-
flushed sections, analysis of QA/QC data for both flushed and non-flushed
sections and randomly drilling cores in and adjacent to the flushed sec-
tions and in the non-flushed sections. A few hypotheses on the interaction
of the aggregate sources with the asphalt sources were considered at the
beginning of the research program. To examine these hypotheses, specific
non-flushed sections were selected by NDOR for comparisons based on
similarity of asphalt sources, principle contractors of both flushed and
non-flushed sections, year of construction and aggregate sources. The
comparisons helped examine specific factors in the design and construc-
tion of SP-2 mixes. The selected sections are listed in Table 2. As shown in
the table, all severely flushed sections were associated with PG58-28 bind-
ers that were supplied by different suppliers. Only a single case with PG64-
22 in Highway-23 had low severity flushing. Visits to each of the flushed
Investigating Binder Flushing of SP-2 Mixes 4
sections revealed that the flushing of Highway-23 was insignificant as com-
pared to the other flushed sections. It was also clear there is no evidence
that natural gravel contributes to the flushing problem. The non-flushed
sections contain higher percentages of natural gravel than the flushed sec-
tions. The same applied to the RAP content. More non-flushed sections,
than flushed sections, had RAP. Only one flushed section was found with a
15% RAP content. Possibilities of moisture-related causes were also mini-
mized. QA/QC data indicated that tensile strength ratio (TSR) on flushed
sections were passing specification requirements. Anti-strip additives were
used in some of the flushed sections. None of the drilled cores in flushed
sections showed any moisture-related damage due to the adhesion
between asphalt and aggregate. To examine the possibility of moisture
damage due to failure in the cohesion of the asphalt paste, attention was
paid to the binder extraction process (ASTM D 1856-95a). None of the
binder extraction cases of the flushed sections reported the existence of
water in the solvent-asphalt solutions.
More than eighty cores were drilled from both flushed and non-flushed sec-
tions. Selected cores were tested as needed. Testing included binder phys-
ical properties and mix design parameters. Overlays were one lift of 2.0 in.
for all sections except for Highway-56 that has two lifts, each with 2.0 in.
thickness. Cores were obtained with 6.0 in. depth. The most recent top 2.0
in. overlays were split into two 1.0 in. layers. Mix parameters were deter-
mined for each 1.0 in. layer. Average values were used in the analysis of mix
parameters as no significant differences were found between the two 1.0
in. thick halves. Binder physical properties did not include extracted mate-
rial from the top 1.0 in. half because it was subjected to further oxidation,
contamination and other causes of aging that prevented an accurate esti-
mation of true binder properties. Binder content was based on the average
of the two 1.0 in. halves. For Highway-56 the bottom 2.0 in. layer was
treated separately from the upper layer and was not further separated into
Investigating Binder Flushing of SP-2 Mixes 5
two parts. It was recognized that each of the original 2.0 in. layers belonged
to a different construction lot as they were not constructed at the same
time. As will be presented in a next section, testing on cores, QA/QC data
and calculations of pavement temperature indicated that flushing occurred
in the upper 2.0 in. layer.
Results and DiscussionConsidering the report by WRI, inspecting the flushed locations, reviewing
QA/QC data on mix components, the study was focused on few main
aspects: the binder nature and physical properties, the mix design param-
eters including the use of local materials and the suitability of SP-2 mix for
traffic conditions, mix variability and in-situ mix quality. Summary and
examples of the testing results are listed in this report. A complete list of
all testing results including binder and mix parameters are listed in the
attached appendices. Appendix A presents plots illustrating the variability
of the binder and mix parameters within and between construction lots.
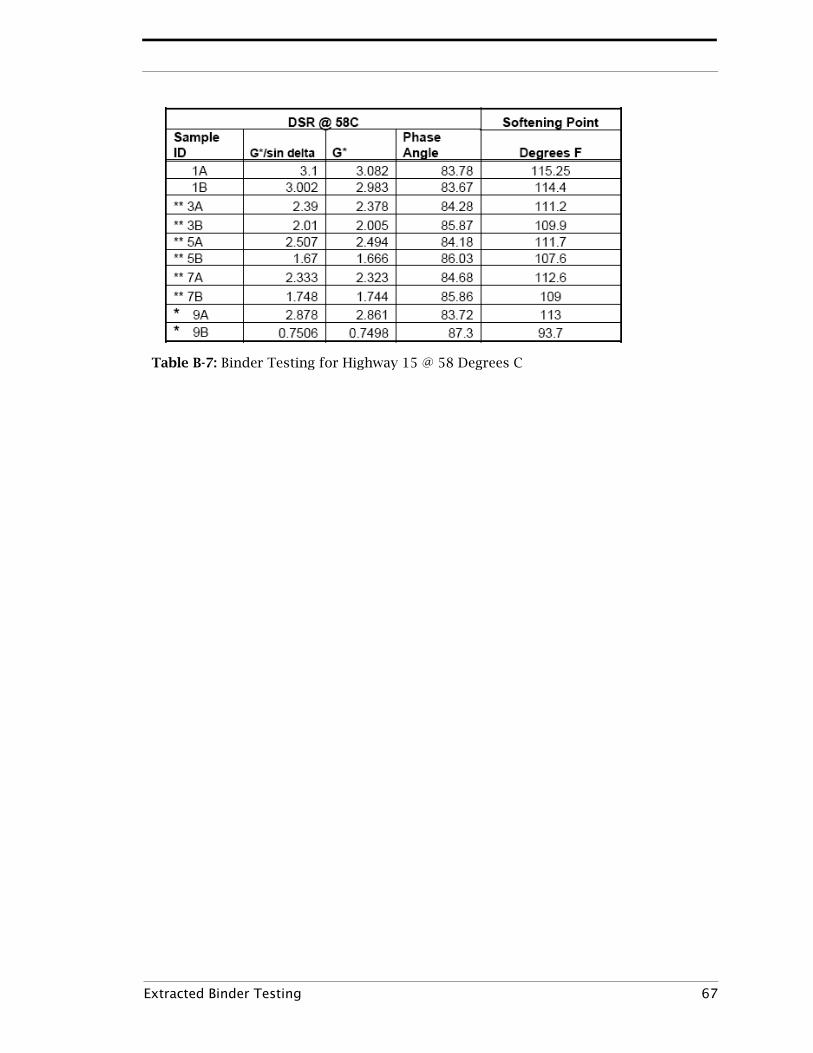
Appendix B lists testing results on the extracted binders from field sam-
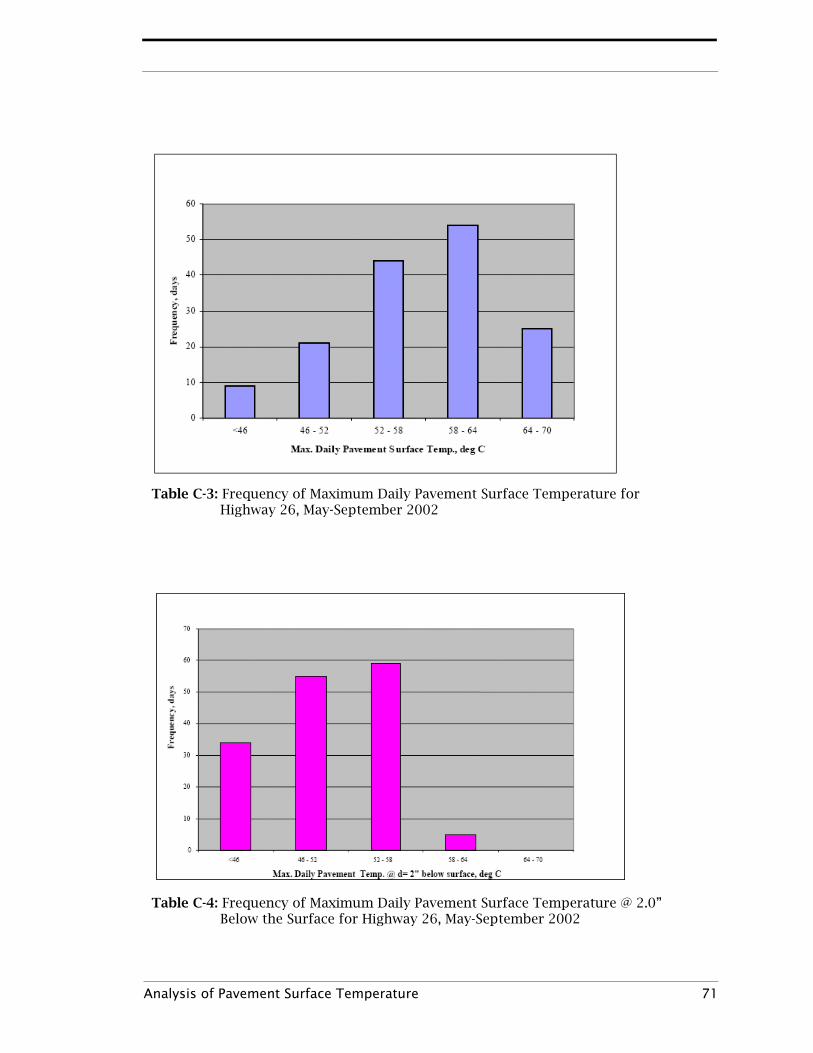
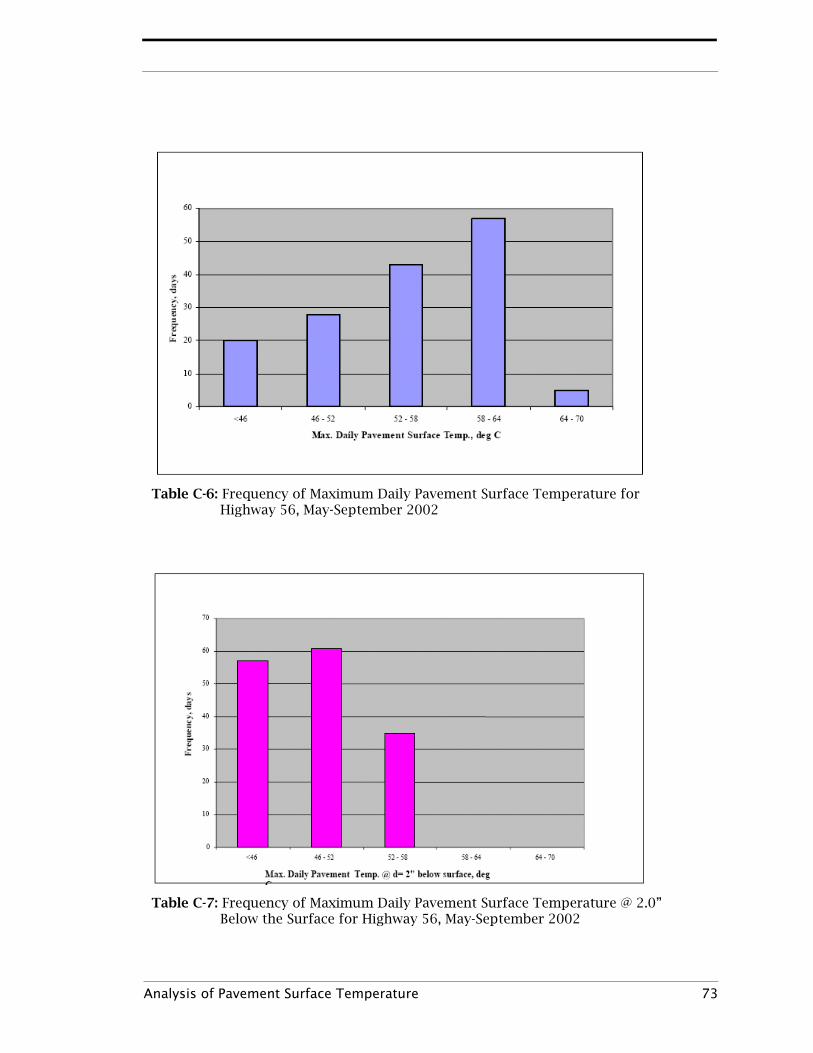
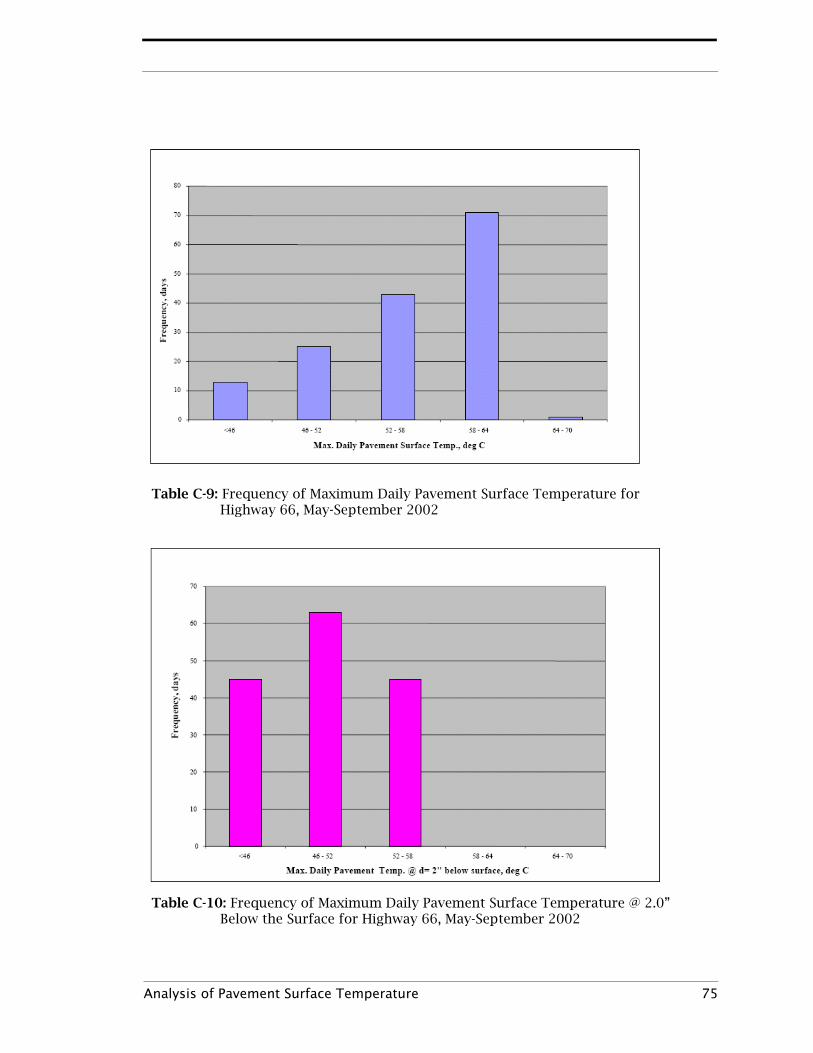
ples. Appendix C presents an analysis of the pavement surface tempera-
tures as a potential factor, combined with the asphalt PG grade, affecting
binder flushing.
Analysis of Binder Properties
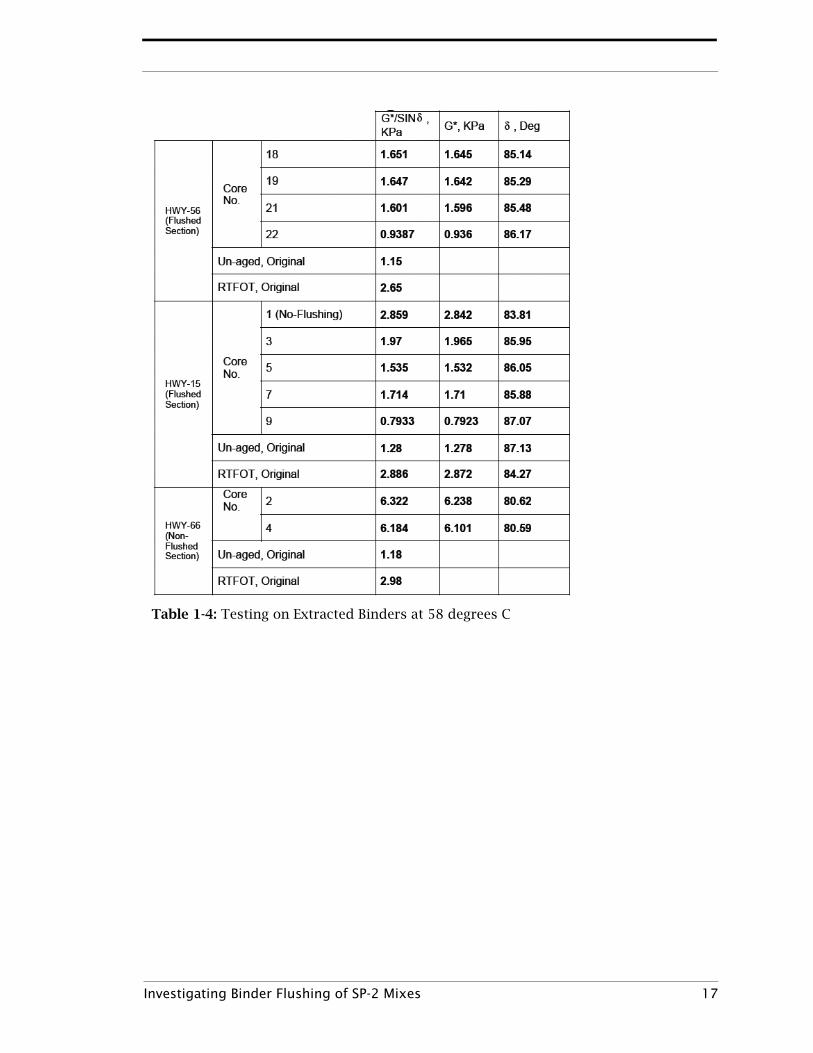
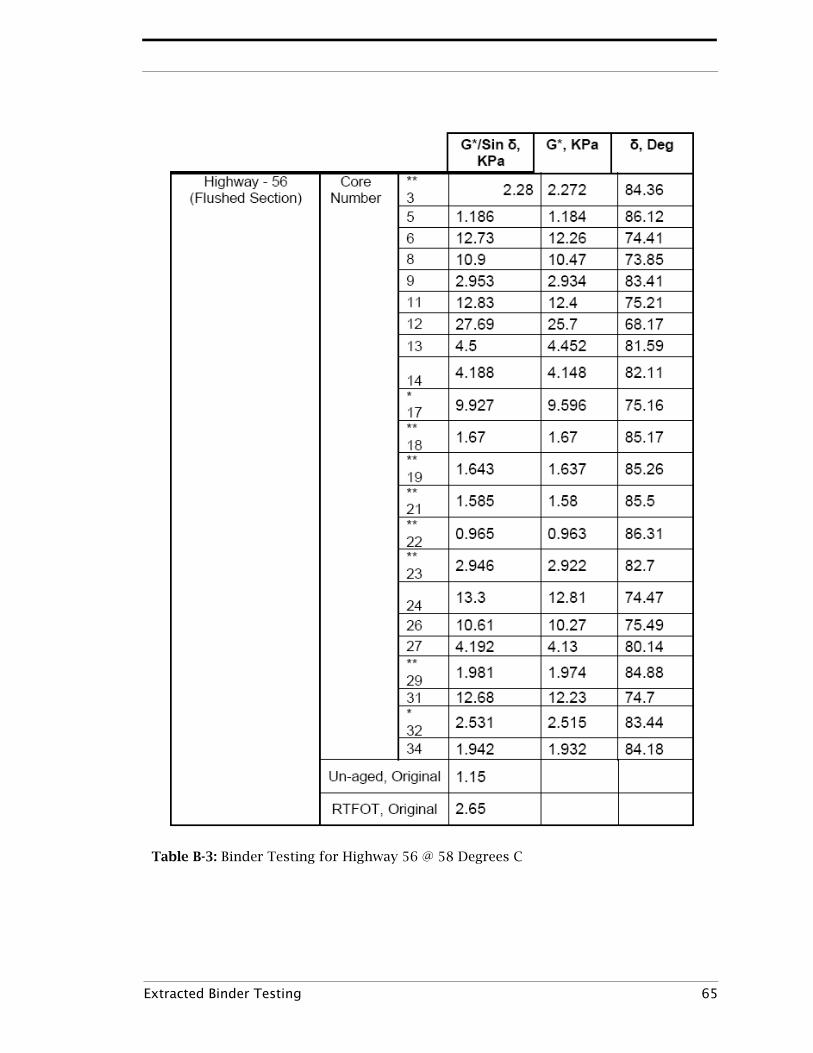
Table 4 and Table 5 show the properties of extracted binders from field
cores as compared to QA/QC data on original binders. The listed values
were verified through additional extraction and testing. Flushed sections
were three to four years in service. Original materials were PG58-28 with
testing at 58 °C for RTFOT and at 19 °C for PAV parameters. One would
expect extracted binders to be stiffer than RTFOT but may be softer than
PAV materials. Results showed extracted binders vary in stiffness but are
all softer than RTFOT materials and significantly softer than PAV materi-
als. In two cases, extracted binders were softer than the original, un-aged,
Investigating Binder Flushing of SP-2 Mixes 6
material. Similar results were obtained by WRI in the 2000 Highway-43
flushing problem. The chemical analysis by WRI on the Highway-43 sam-
ples indicated compatibility concerns with the extracted binders. Thermal
analysis showed a lower molecular weight material than the original
asphalt in the extracted binder. It is known that asphalt compatibility
progresses with aging and may lead to phase separation producing a solid,
asphaltene-like material, dispersed in a relatively fluid medium. The sepa-
rated solid material may not be extracted with solvents. Hence, the soft
extracted binder might not include the separated solid part. The analysis
on binder separation minimized the possibility of contamination as a cause
of softer extracted binders. It is to be noted that NDOR does not apply any
QA testing on binder separation. QA testing on binder separation is not
common in HMA construction. PG binders are purchased with a certifica-
tion from the suppliers.
G* Sin d @ 19 °C and G*/Sin d @ 58 °C values as obtained from QA/QC
records were based on average testing results at the time of construction.
It was not possible to refer cores data to exact construction lots due to data
availability. All QA/QC data showed compliance with the then current spec-
ifications on binder grade. Recovered binders from drilled cores showed
significant variability in properties that were not present in the QA/QC
data. That variability could be attributed to the construction process
including possible segregation of mix components. It is believed that addi-
tional QA measures are needed to ensure more consistent SP-2 mix quality.
The selection of asphalt grade for SP-2 mixes in Nebraska was questioned.
All sections with significant flushing had PG58-28 binders. Only one sec-
tion with PG64-22 showed insignificant flushing, Highway-23. Reports by
district engineers indicated that flushing was associated with high summer
temperature times. An analysis of pavement temperature for the past four
years was conducted for all flushed locations. The objective was not to
examine the current PG grade system in Nebraska but rather to study if
Investigating Binder Flushing of SP-2 Mixes 7
exceptional pavement temperature was a factor in the flushing problem.
Flushing occurs when pavement temperature is high enough to cause soft-
ening of the binder so that it can flow under the effect of traffic loads. The
analysis of pavement temperature can help determine the depth of pave-
ment to consider as a source of flushed binder. SHRP procedures for Super-
pave specifications (6) were applied to the temperature analysis. Data on
maximum daily air temperature and section longitude and latitude was col-
lected from local sources. All basic assumptions that were documented in
the original SHRP reference were applied in this study. One of the critical
assumptions in the SHRP procedures was the maximum temperature dif-
ference between the surface and a 2.0 in. (50.0 mm) depth during hot
summer days. That was assumed in the SHRP report between 10 °F and 20
°F. Table 6 presents the average maximum seven days pavement tempera-
ture, 20.0 mm below surface, for Highway-56 over the past four years. The
table presents two cases; the first case is for a difference of 15 °F, d (0-50)
= 8.3 °C. The second case is for a difference of 10 °F, d (0-50) = 5.6 °C. In
both cases; pavement temperature was higher than what was expected for
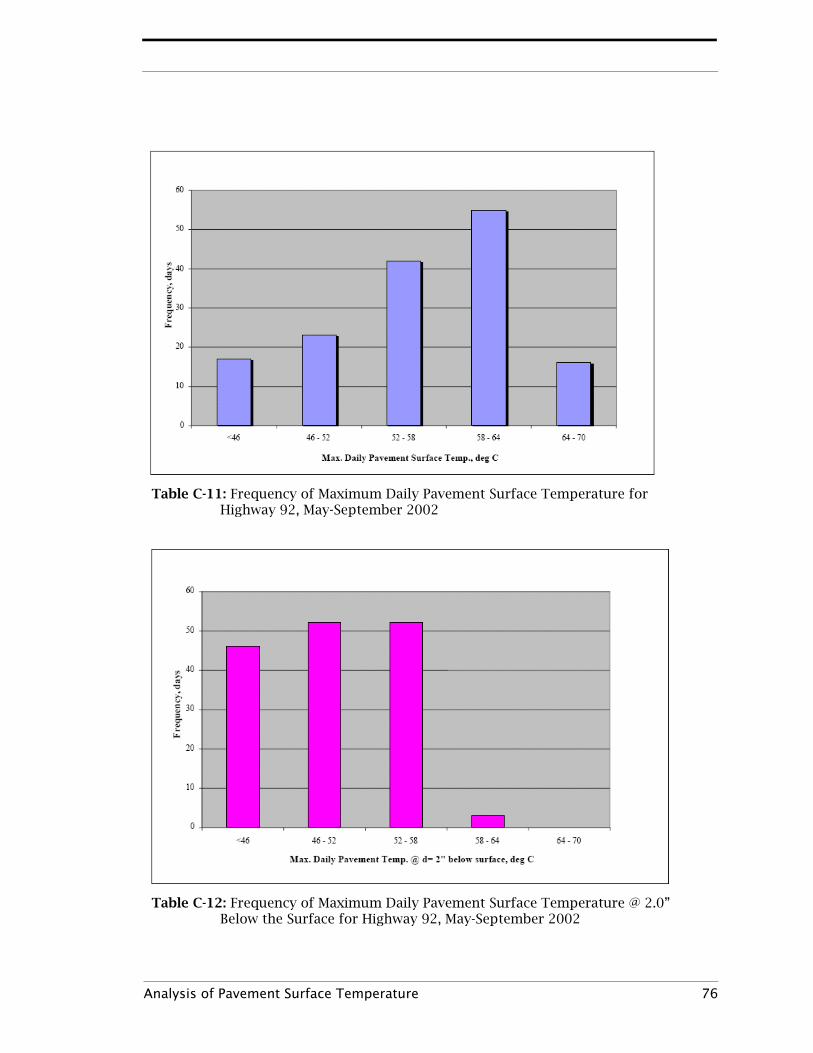
a PG58 grade mix with the second case being more critical. Figure 3 pre-
sents a frequency, in days, of maximum daily temperature based on the
assumption of d (0-50) = 5.6 °C for Highway-56. The figure shows that pave-
ment temperature, 20.0 mm below surface, was higher than 58 °C for about
sixty days in each of the past three years. The presented data shows that a
PG64 binder would be a better choice for the Highway-56 location. Same
conclusions were reached for the locations of the other flushed sections. It
is to be noted that NDOR stopped using PG58 grade binders in Superpave
mixes since the 2001 construction season. While the pavement maximum
temperature was higher than what was assumed for all flushed sections, it
was concluded that temperature at the 4.0 in. depth was not sufficient to
soften the existing binder enough to flow. Testing on extracted materials
confirmed this finding. The above discussion on binder quality suggests
that an adhesion problem that may have been caused by binder separation
Investigating Binder Flushing of SP-2 Mixes 8
has contributed to the flushing problem. The damage due to asphalt-aggre-
gate adhesion is accelerated in mixes with softer binders.
Effects of Mix Parameters
Having air voids in an asphalt mix is unavoidable but it is necessary to engi-
neer specific related parameters. About 4% voids in the total compacted
mix at optimum asphalt content is acceptable. This void content must be
achieved in the field during construction through compacting effort and
not by adding asphalt cement to fill up the voids. Besides, a balanced
amount of dust, material passing the #200 sieve, is required to regulate the
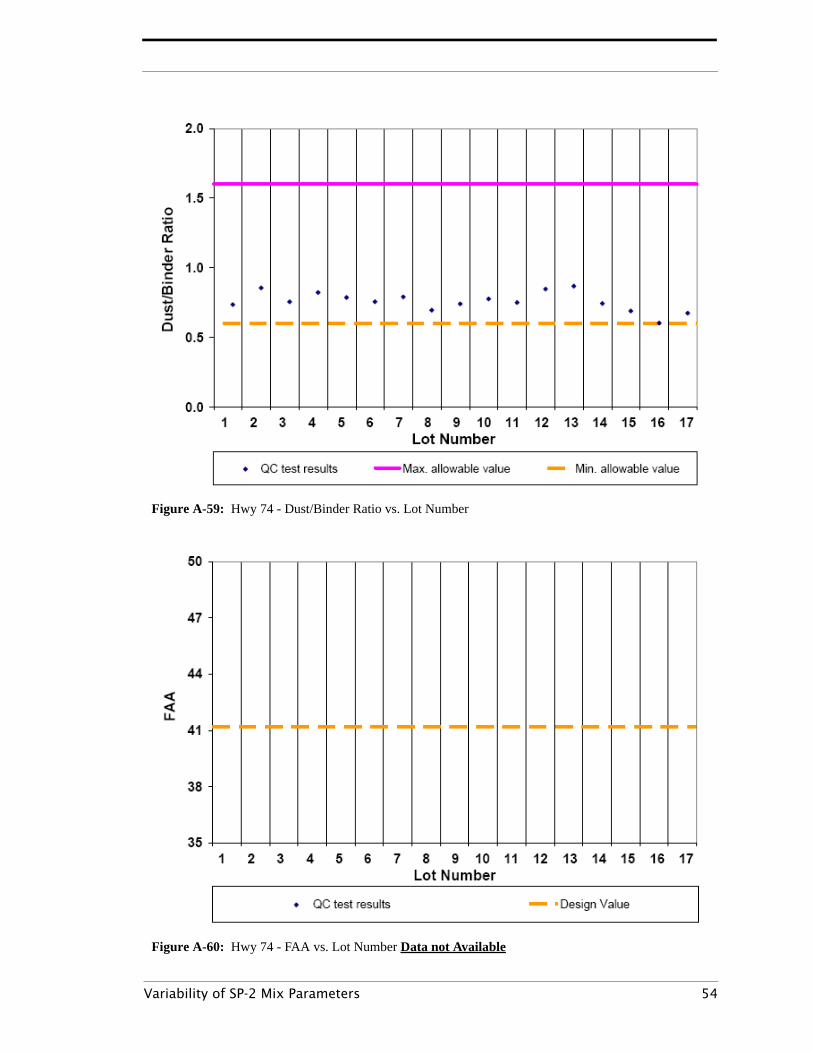
function of the binder in the mix. Low dust to binder ratio (D/B) results in
excessive binder content and can lead to softening of the mix and/or flush-
ing of the binder. But high D/B may lead to fatigue cracking. The parame-
ters related to the voids in asphalt mix are; asphalt content, D/B ratio, total
voids and voids filled with asphalt (VFA). Table 7 presents average values
of these parameters as obtained from the records of the original mix
design, QA/QC testing, and testing on flushed and non-flushed cores.
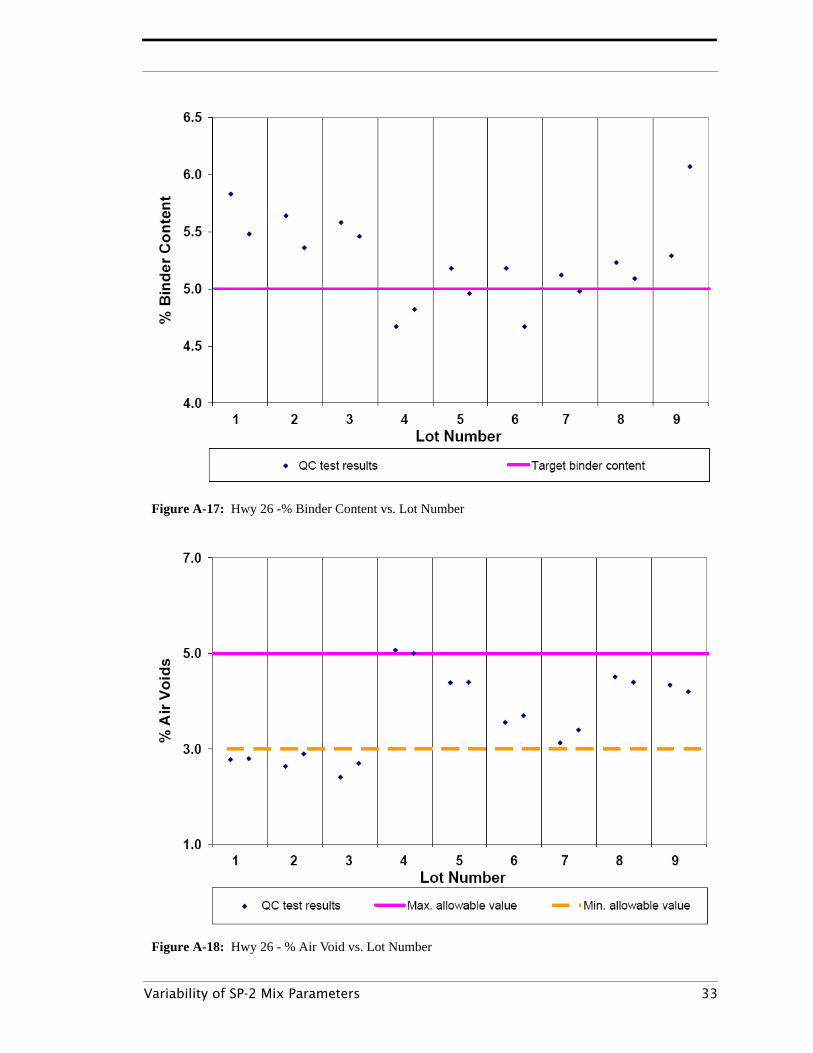
Flushed sections had high asphalt contents (AC). In some cases the AC was
higher than what was originally determined in the mix design. In the case
of Highway-56, mix design was based on 5.0% AC but flushed cores were
showing an average of 5.9%. In the case of Highway-43 the mix design was
based on 5.0% AC but flushed cores were showing an average of 5.7% AC,
with some values as high as 7.0%. In other cases the original mix designs
were based on high AC. In the case of Highway-15 the original design called
for 5.7% AC and Highway-26 specified 5.7% AC. On the other hand, all mix
designs of non-flushed sections were based on an AC of 4.7% to 5.2%. Cores
and QA/QC records of non-flushed sections showed 4.4% to 5.1% AC. Table
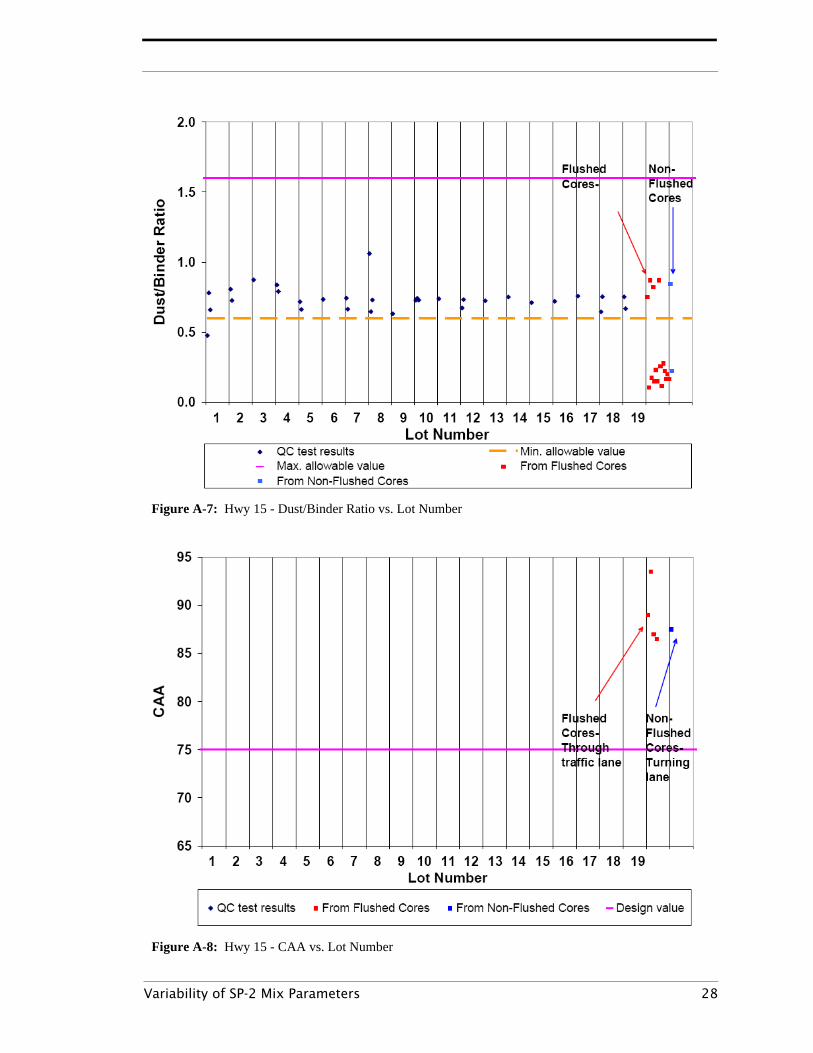
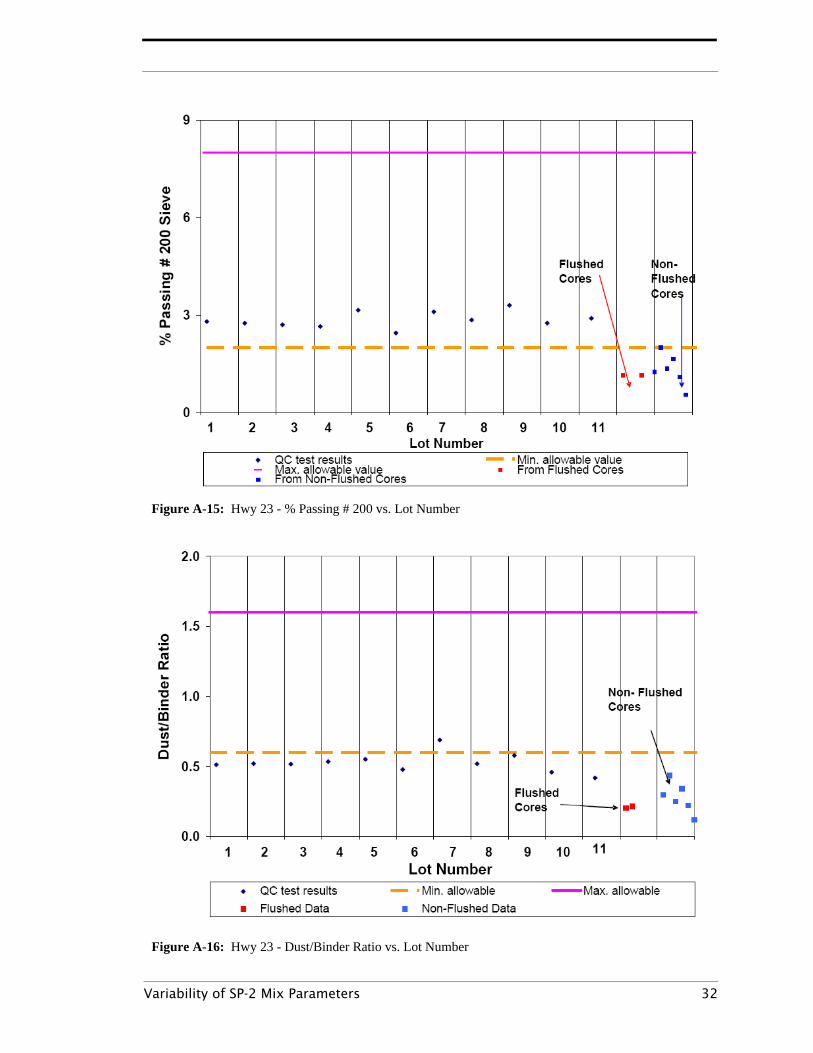
7 shows that D/B ratios of flushed sections were significantly lower than
those of non-flushed sections. All flushed sections were originally
designed with D/B of 0.5 to 0.6. Values from QA/QC records and from
flushed cores showed a slightly higher value of (0.8) for both Highway-56
Investigating Binder Flushing of SP-2 Mixes 9
and Highway-15 and a lower values of 0.3 for Highway-43 and 0.4 for High-
way-26. Non-flushed sections had D/B ratios as high as 1.2 with no signs
of fatigue cracking after three to four years of service. It is clear that the
high AC coupled with the low D/B ratio were factors in this flushing prob-
lem. The earliest two sections to flush after construction, Highway-43 in
few weeks and Highway-26 in few months, had the lowest D/B ratios.
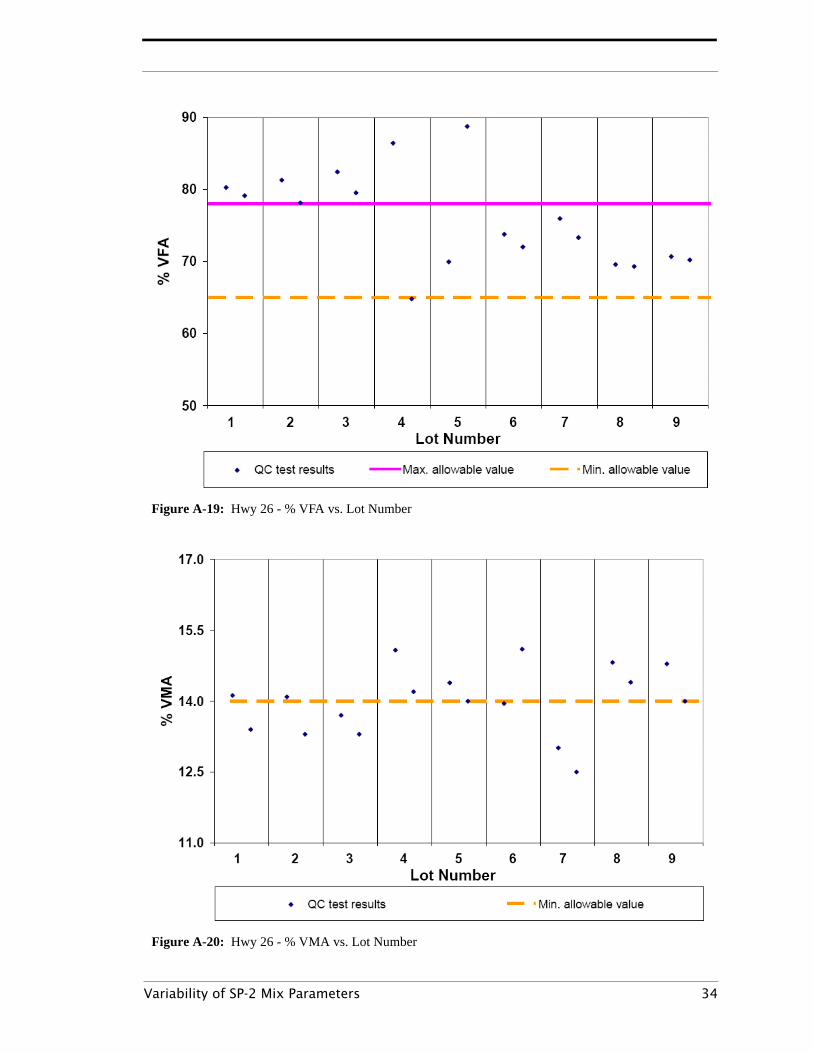
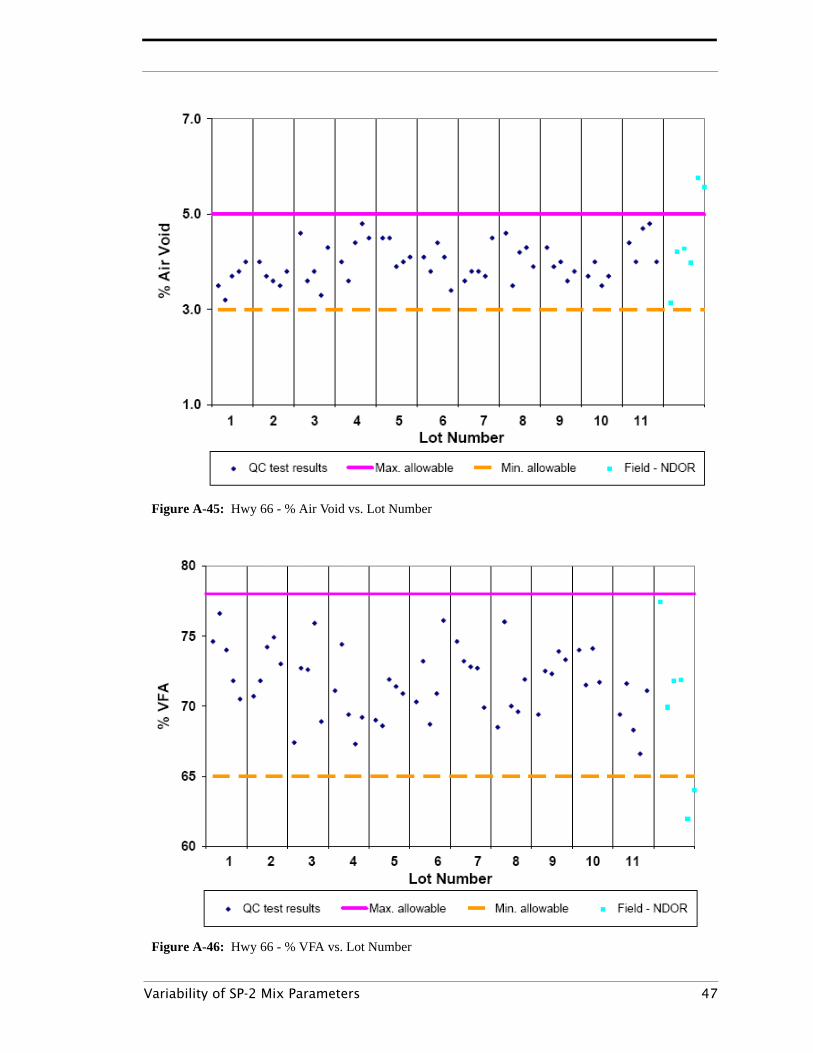
Theoretically, binder flushes if VFA reaches unity (1, 2). The VFA value
depends on the volume of air voids and the effective binder content in the
mix. It can be seen that most of the cores had higher VFA values as com-
pared to the mix design or the QA/QC values but none of the flushed sec-
tions had a VFA close to unity. Depending on how the air voids are
structured and connected, the voids can be effective in containing the
binder when flowing and flushing may be avoided. The numbers from
Table 7 show that air voids values for both flushed and non-flushed sec-
tions remain close to 4.0% so that a conclusion on the effect of the volume
of air voids on this flushing problem can not be reached. This argument
supports the literature on the effectiveness of the structure, or distribu-
tion, of air voids in preventing binder flushing.
No meaning conclusions on the causes of the flushing problem can be
reached without considering the aggregate effects. But aggregate contribu-
tion to the flushing cases is tied to the binder content. Testing shows the
binder contents of few flushed sections are on the low side but even more
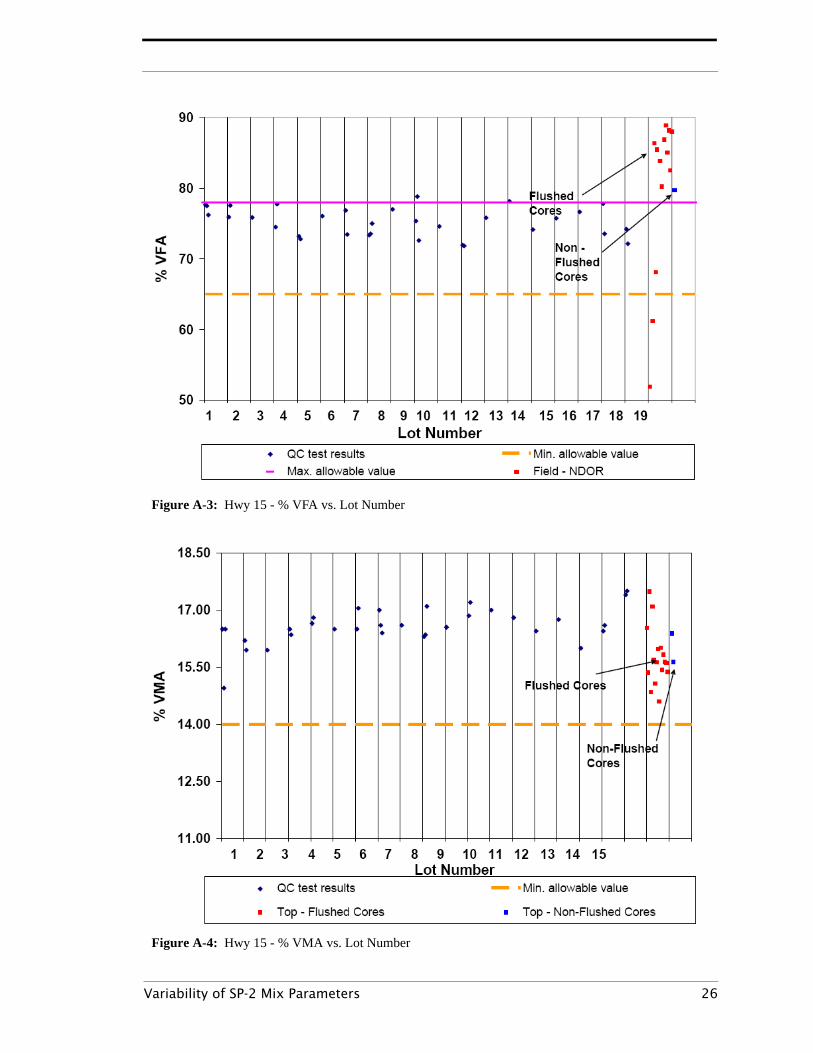
so the passing sieve #200 materials. VFA values were all on the low side for
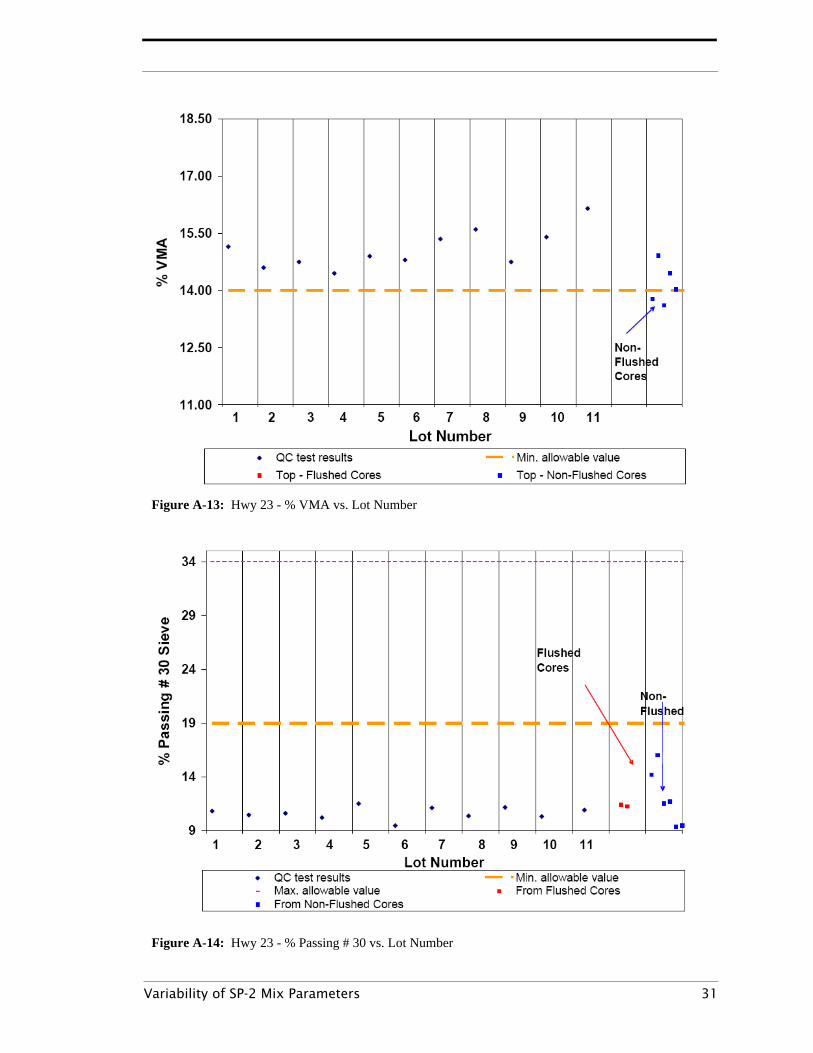
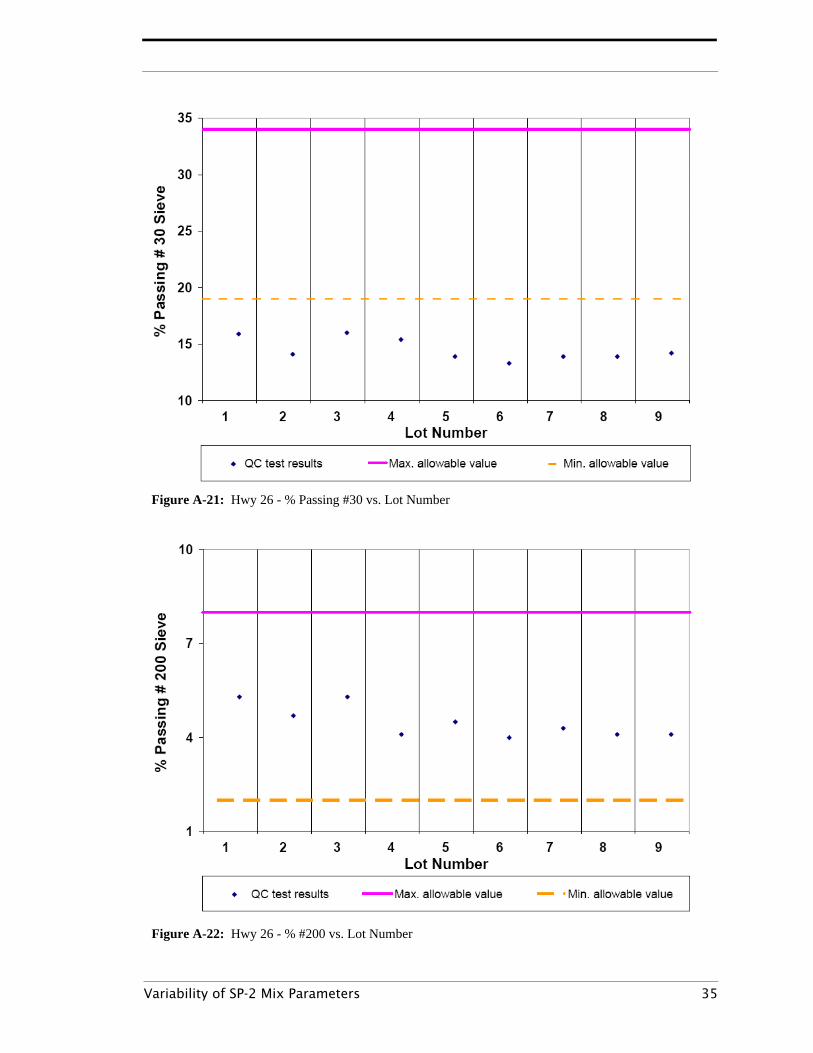
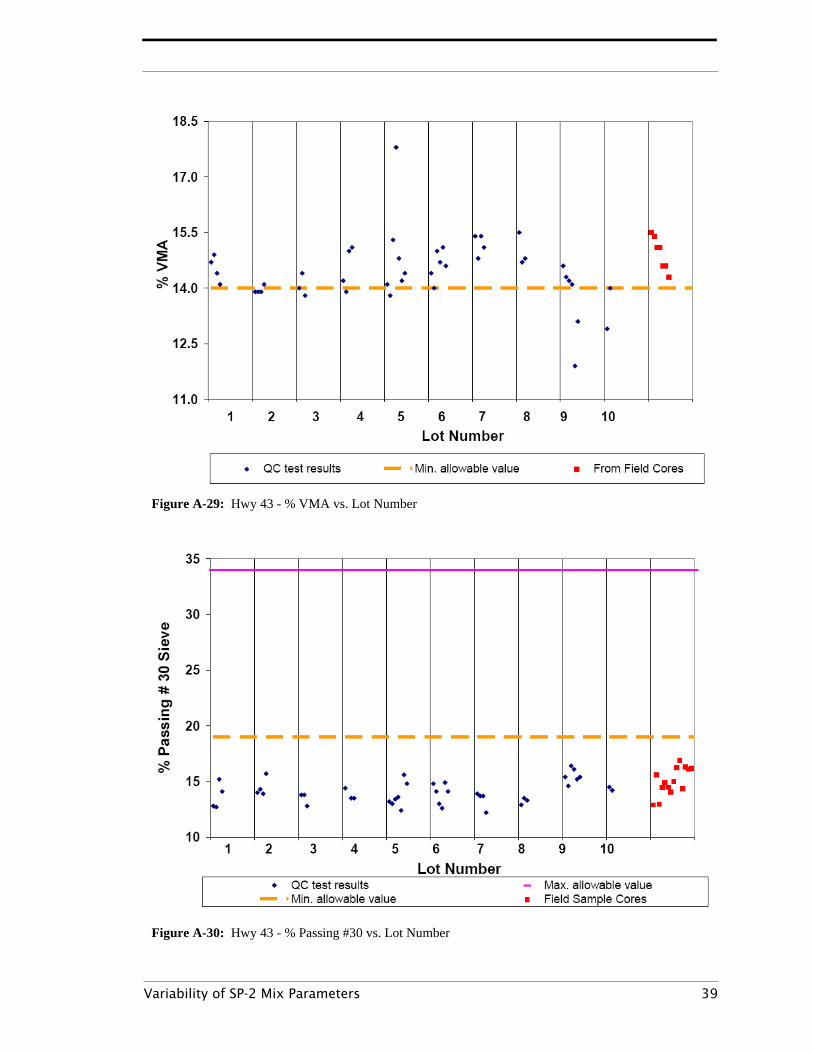
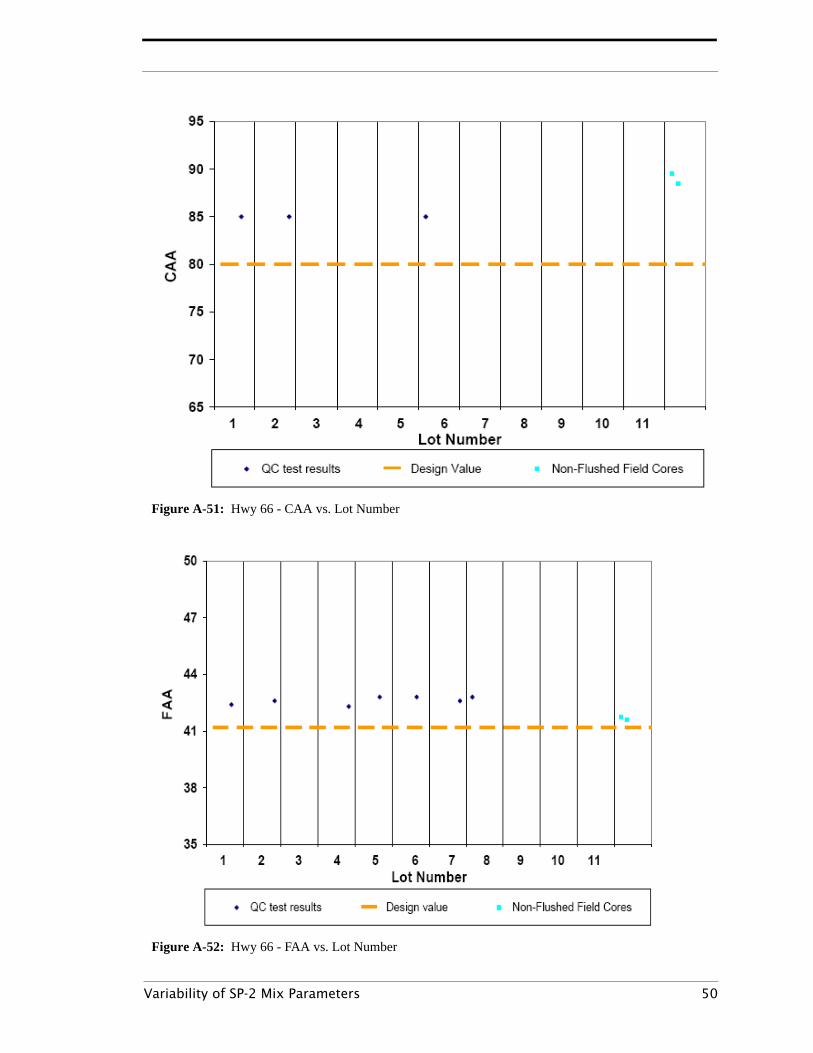
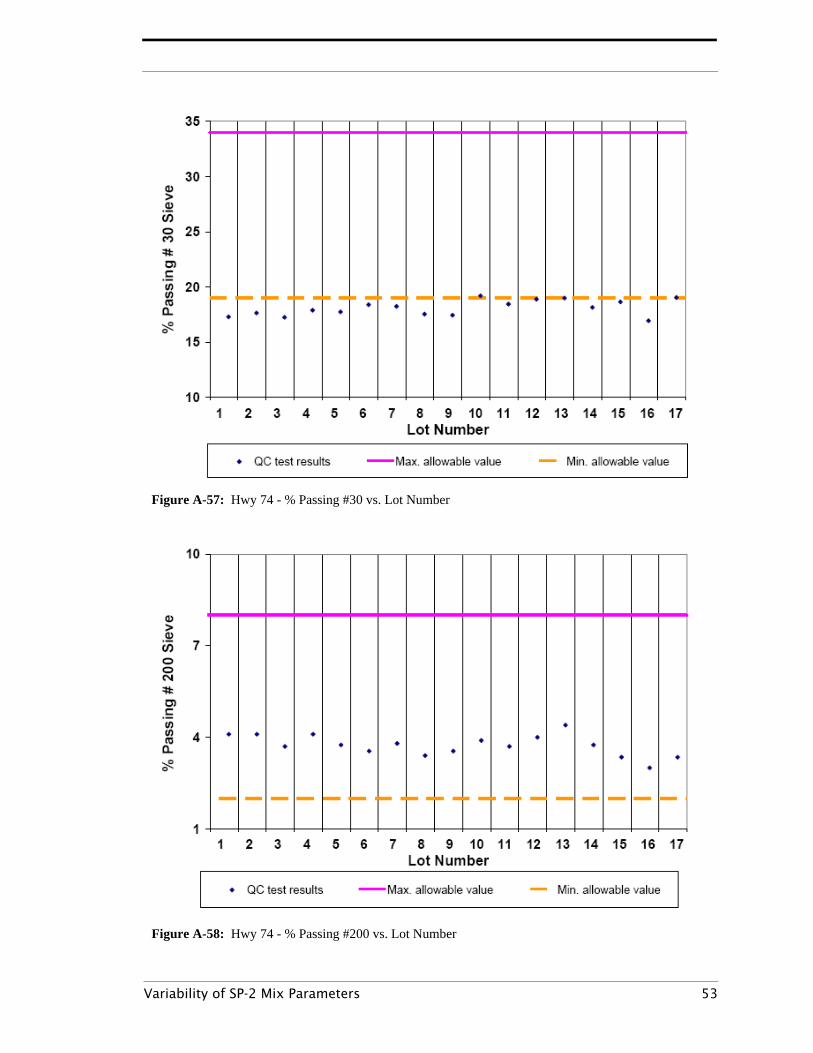
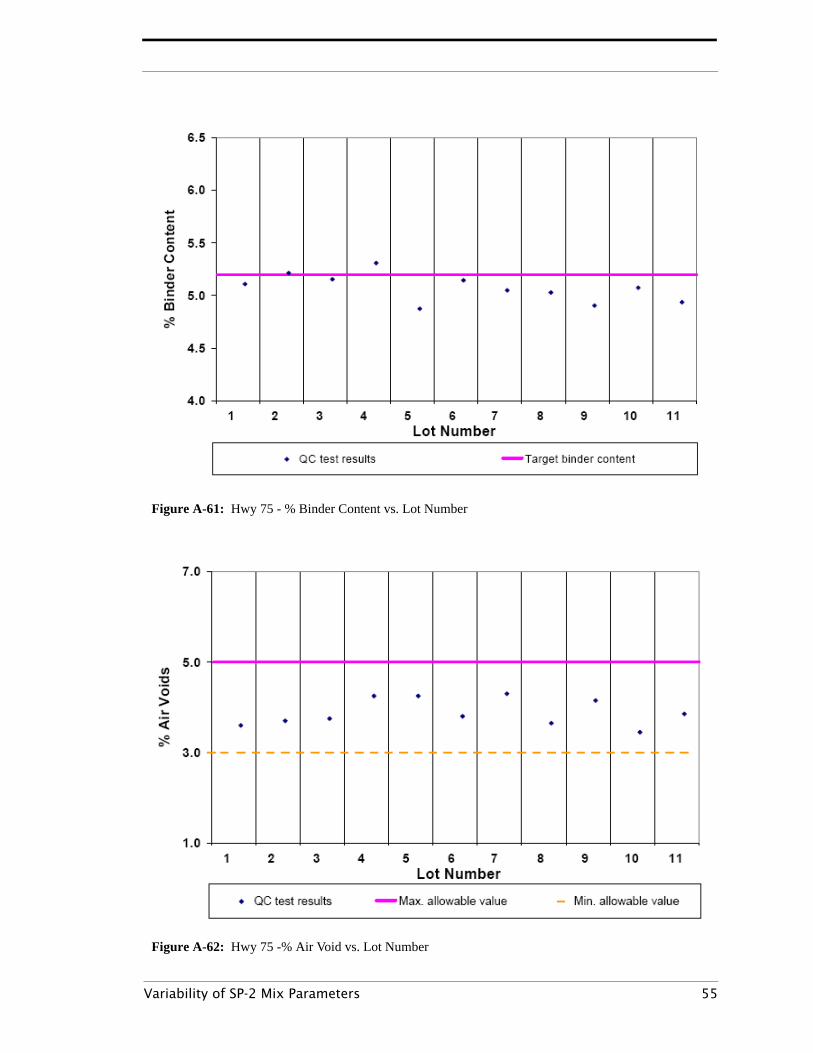
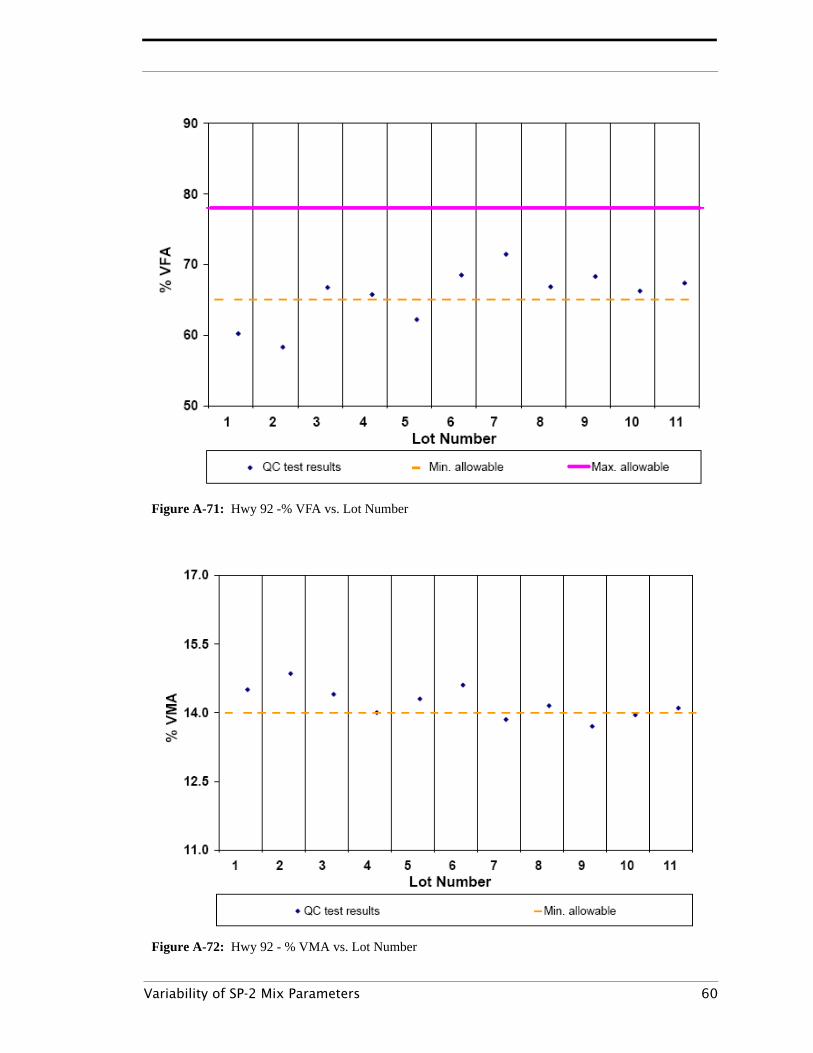
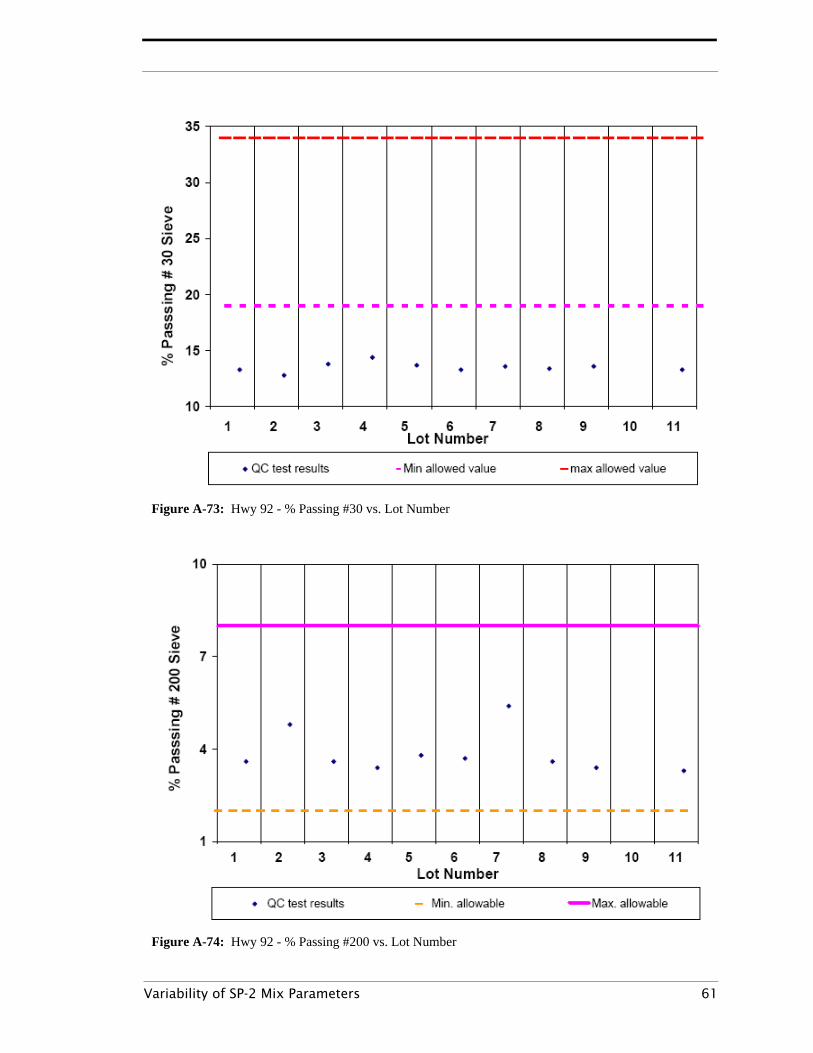
the traffic levels using the researched sections. As shown in Appendix A,
contents of aggregate sizes passing sieve #30 were relatively low, may be
because of the restricted-zone rule applied to the SP-2 mix designs. This
significantly decreases the surface area of fine aggregate and allows extra
binder contents to exist in the matrix and hence flushing occurs when
other conditions including high pavement temperature and softer, or
Investigating Binder Flushing of SP-2 Mixes 10
lighter, binder quality exist. Again, the use of natural gravel was not a main
cause of the flushing distress as researched in this study.
QA/QC Considerations
The figures presented in Appendix A suggest that a primary cause of the
flushing distress is the variation of properties of the plant produced mix.
Temperature within a pavement section that flushed should not be differ-
ent from the temperature within a pavement section that did not flush.
Temperature, alone, is not a cause of flushing unless something else is con-
tributing the problem. The nature of this flushing problem as non-contin-
uous distressed areas can be attributed to the variability in mix parameters
and binder properties. As shown for extracted binder properties, mix
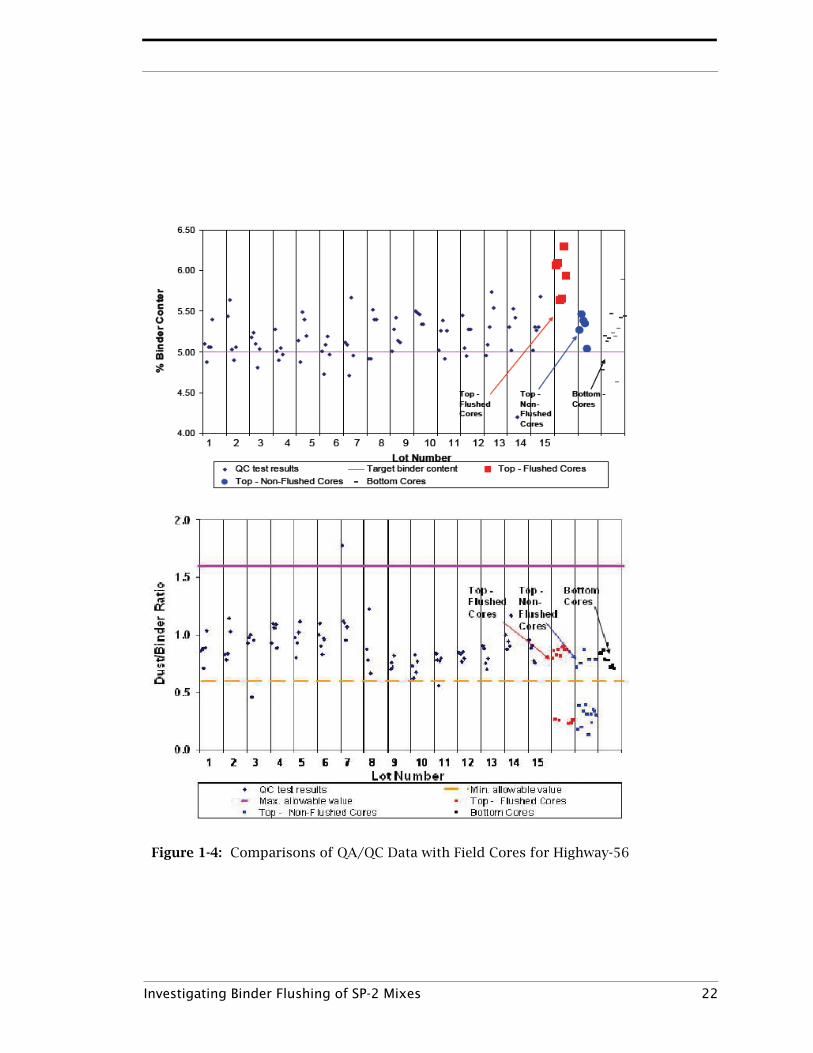
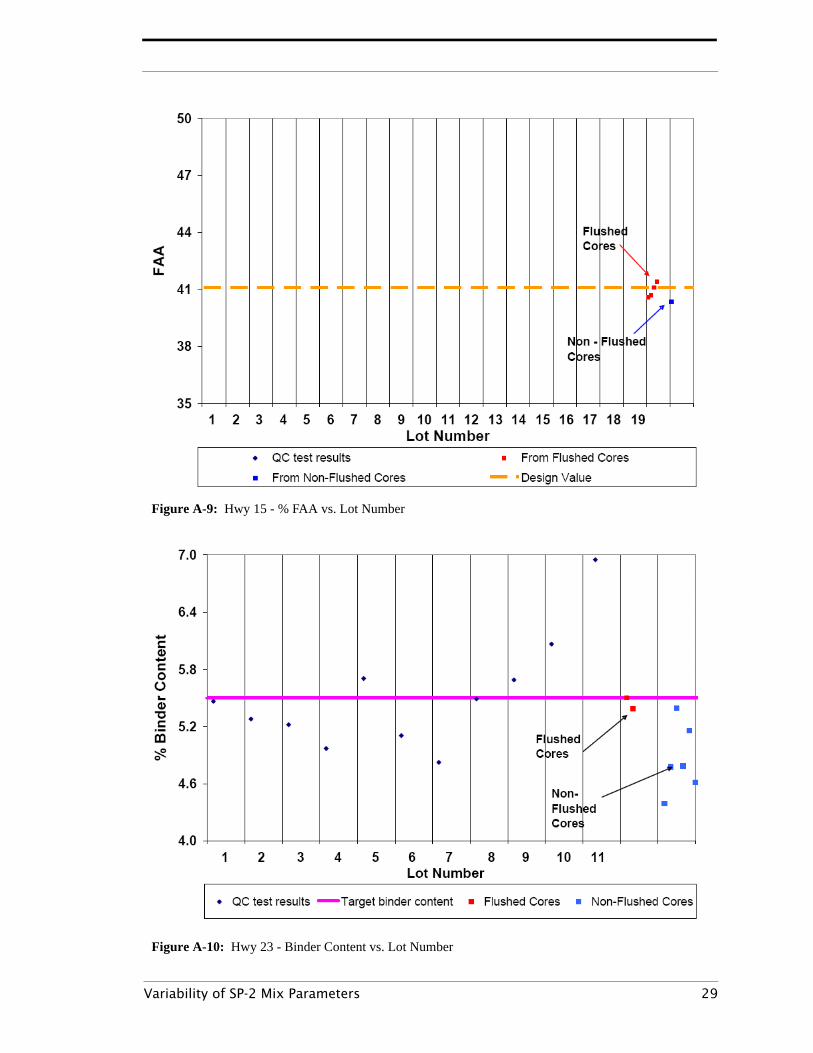
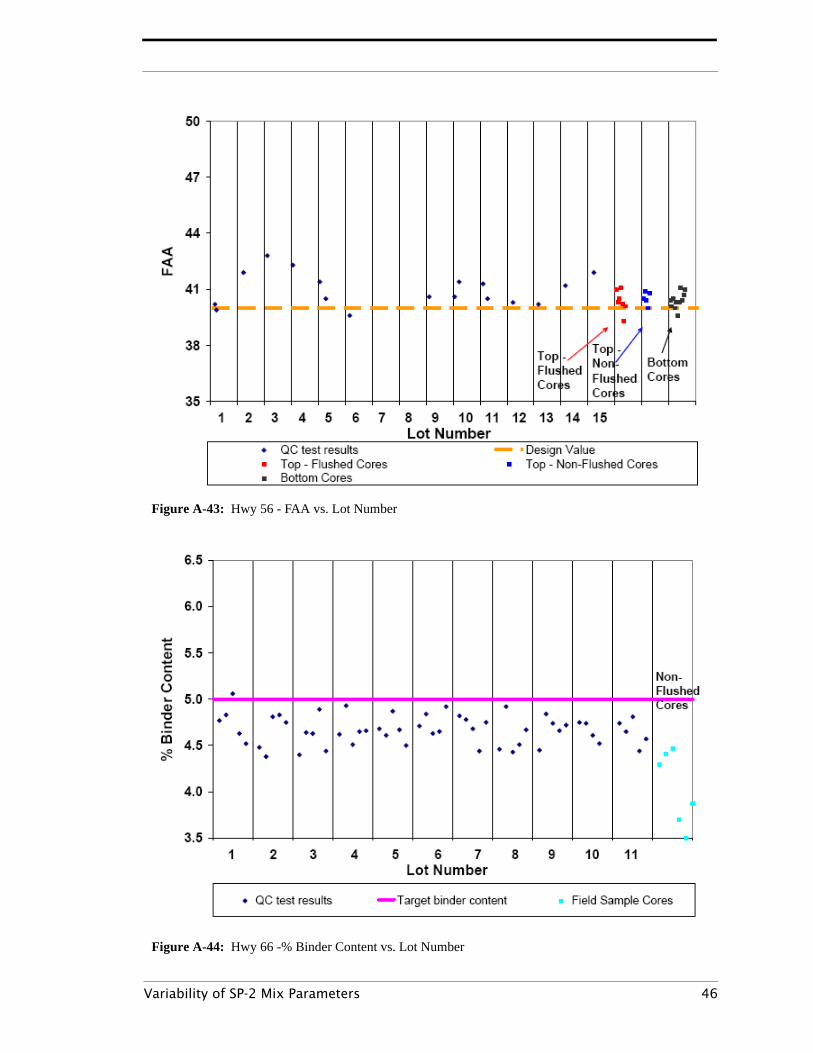
parameters varied in both QA/QC records and in core testing. Figure 4 pre-
sents an example of a lot-by-lot binder content and D/B ratio for Highway-
56. As can be seen in the figure, significant variability existed within a lot
and between lots. Recovered binder samples were almost 2.0% higher than
the design binder content and in cases softer than the original binders. As
discussed earlier, softer field binders can be attributed to a separation
problem. However, QA testing on binder separation is not common in HMA
construction. PG binders are purchased with a certification from the sup-
pliers. Records do not confirm if a tack coat was used on the flushed sec-
tions? If so, that might account for some of the bleeding.
Effect of Traffic
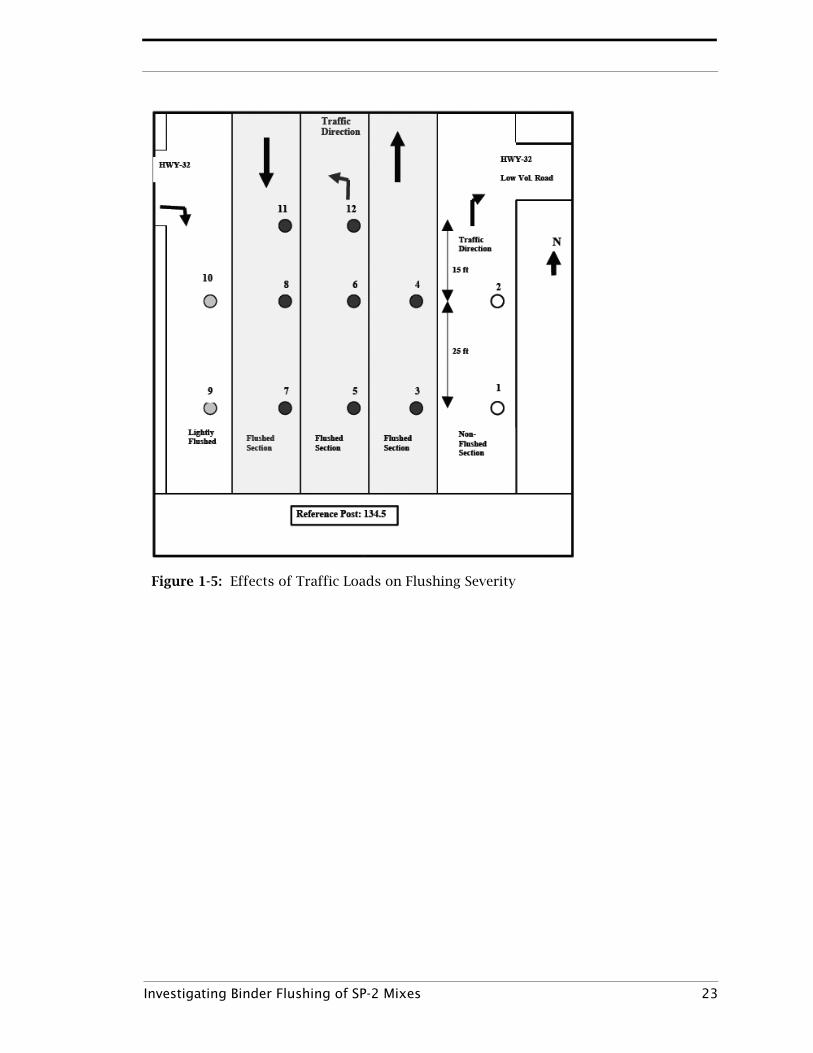
Figure 5 illustrates an example of the effect of traffic on the severity of
flushing. The figure shows one coring location of the intersection of High-
way-15 with Highway-32. Note the extension of Highway-32 as a farmer-
market unpaved road to the right. Highway-15 is a two-lane road. In this
location, cores 1 and 2 were drilled in the right-turn lane to the low-volume-
road with low or no heavy traffic. Cores 3 and 4 were drilled in the through
Investigating Binder Flushing of SP-2 Mixes 11
north-bound heavy traffic lane. Cores 5, 6 and 12 were drilled in the left-
turn lane to Highway-32 with heavy traffic. Cores 7, 8 and 11 were drilled
in the south-bound lane with heavy traffic. Cores 9 and 10 were drilled in
the right-turn from Highway-32 into Highway-15 with a lower heavy traffic
volume than that of a through traffic lane. AC and D/B parameters were not
significantly different between flushed and non-flushed cores in this loca-
tion. Binder properties were even softer for low flushing severity than for
high severity flushing. This case shows that flushing severity can be related
to traffic volumes.
Summary of Findings and RecommendationsThis study presents cases of Superpave mix bleeding caused by the com-
bined effects of both asphalt properties and mix design parameters. Binder
flushing, or mix bleeding, depends very much on the temperature-stiffness
relationship of the asphalt used, air voids distribution in the pavement and
traffic loads to which the pavement is subjected to. Extracted binder sam-
ples from flushed sections varied in their physical and chemical properties
but were all significantly softer than what would be expected. It is believed
that problems in the asphalt source, mostly related to compatibility,
caused the separation of the light fractions of the binder in the top pave-
ment layers. High pavement temperatures and heavy traffic accelerated the
flushing process. It was also noted that flushed sections had a softer
asphalt grade than non-flushed sections. This indicates that a stiffer binder
would have been less likely to flush. All flushed sections had excessive
binder content and insufficient dust. The above discussion on binder qual-
ity suggests that an adhesion problem that may have been caused by
binder separation has contributed to the flushing problem.
Additional measures in the QA process are needed to ensure more consis-
tency in the construction process. That need was demonstrated by the vari-
Investigating Binder Flushing of SP-2 Mixes 12
ability in the properties of extracted binders and in the mix parameters
from field cores and QA/QC records.
Flushing occurred in spite of the fact that an acceptable percentage of air
voids was present. Voids in the mix were mostly filled with high asphalt
content in the asphalt-dust paste. An appropriate D/B ratio is critical to
balance the mix performance between mix softening or binder flushing on
one hand and fatigue cracking on the other hand. It is critical to further
study the role of air voids in the mechanism of mix bleeding, or binder
flushing. Two aspects are to be considered; first is the nature, structure
and/or distribution, of air voids in an asphalt mix as related to binder
flushing. Second is examining that nature during the mix design process.
Investigating Binder Flushing of SP-2 Mixes 13
References[1] Krishnan, J. M. and Rao, C. L. Permeability and Bleeding of Asphalt Concrete
Using Mixture Theory. International Journal of Engineering Science 39 (2001) 611-627.
[2] Krishnan, J. M. and Rao, C. L. Mechanics of Air Voids Reduction of Asphalt Con-crete Using Mixture Theory. International Journal of Engineering Science 38 (2000)1331-1354.
[3] Brown, R. E., Cross, S. A. and J. K. Gehler. Evaluation of Pavement Bleeding on I-55 in Illinois. In Transportation Research Record 1300, TRB, National ResearchCouncil, Washington D.C., 1991, pp. 56-62.
[4] Christensen, W. L. and Powers, D. B. 1999 Premature Flushing Study. Ohio Depart-ment of Transportation, 1999.
[5] Western Research Institute, Special Study for the Nebraska Department of Roads,May 2001.
[6] Solaimanian, M. and Kennedy, T. W. Predicting Maximum Pavement Surface Tem-perature Using Air Temperature and Hourly Solar Radiation. In TransportationResearch Record 1417, TRB, National Research Council, Washington D.C., 1994,pp. 5-10.
Additional References-"Effects of Material Properties, specimen Geometry, and Specimen Preparation Variables
on Asphalt Concrete Tests for Rutting", John Harvey, Irwin Guada, Fenella Long, Jour-
nal of the Association of Asphalt Paving Technologists, Volume 69, 2000.
-Martin McCann and Peter E. Sebaaly, "Evaluation of Moisture Sensitivity and Performance
of Lime in Hot-Mix Asphalt", Transportation Research Record 1832.
-"Comparison of Fundamental and Simulative Test Methods for evaluating Pavement
Deformation of Hot-Mix Asphalt"
Investigating Binder Flushing of SP-2 Mixes 14
-"Mixture Testing, Analysis and Field performance of the Pilot Superpave Projects: The
1999 SPS-9 Mixtures", R. Michael Anderson, Gerald A. Huber, Dwight E. Walker, Xishun
Zhang, Journal of Asphalt Association of Pavement Technologists.
-"Evaluation of Pavement Bleeding on I-55 in Illinois" Brown, E.R., S.A., Cross, and J.G.,
Gehler. Transportation Research Record.
-"Estimating Permeability of Asphalt-Treated Bases.", Lindly, J.K., and Ashraff, S.E., Trans-