The author hereby grants to MIT permission to reproduce anddistribute publicly paper and electronic copies of this thesis document
in whole or in part.
Author .. -
Department of PhysicsMay 7, 2004
Certified by ......................................Arshad Kudrolli
Associate ProfessorThesis Supervisor
Accepted by.............
MASSACHUSETTS INSTIUTEOF TECHNOLOGY
JUL 0 7 2004
I I A ' lg'"r'
David E. PritchardThesis Coordinator
I .A l/-i'iV l
.... ..
ARCHIVES
Investigating the Angle of Repose and Maximum Stability of
a Cohesive Granular Pile
by
Sarah Alice Nowak
Submitted to the Department of Physicson May 7, 2004, in partial fulfillment of the
requirements for the degree ofBachelor of Science in Physics
AbstractIn this thesis, I investigate the static and dynamic properties of a granular heapmade cohesive by an interstitial fluid. I present the results of experimental workmeasuring the maximum angle of stability and the angle of repose of such a pile ina rotating drum geometry. I discuss existing models for the stability of a cohesivegranular pile and present a new model that predicts the maximum angle of stabilityfrom the pile's geometry and from the cohesive forces between grains. This modelagrees well with experiment and suggests that friction is insignificant in determiningthe maximum angle of stability. In addition, I investigate the effect of the viscosityof the interstitial fluid on the dynamic properties of a granular pile. In particular,I examine the transition from stick-slip motion to continuous motion as well as theeffect of viscosity on the angle of repose of the granular pile. I offer a qualitativeexplanation for my observations of these phenomena.
Thesis Supervisor: Arshad KudrolliTitle: Associate Professor
3
4
Acknowledgments
Over the course of the past year, I have had the privilege of working under the
guidance of Prof. Arshad Kudrolli. I have benefited tremendously from his patient
advice and I am grateful for his extensive knowledge and understanding of granular
materials. He provided many helpful discussions throughout the project, including
those that led to the development of the model presented in this thesis.
In addition, I am indebted to Dr. Azadeh Samadani who introduced me to this
project and whose work was the basis for my own. Dr. Samadani generously pro-
vided me with her experimental apparatus, data, thoughtful insight and guidance
throughout the course of my research.
I would also like to thank Jaehyuk Choi for his constant willingness to help me
with any technical difficulty I encountered. Prof. John Bush and Prof. Tom Peacock's
courses on fluid dynamics and physical mathematics proved invaluable in my research,
and I would like to acknowledge Prof. Rodolfo Rosales for helping my project to run
smoothly.
There are a number of people who have supported me in undergraduate career. I
would like to thank my academic advisor, Prof. Alan Guth, for his caring guidance
as well as Prof. Pritchard for his advice, mentorship, and confidence in me.
Since my freshman year, my friends and fellow house members at WILG have
given me an incredible amount of moral support. They provided perspective and
balance that has kept me sane and happy throughout the past four years.
Finally, I would not be where I am without my family. My parents could not have
been more supportive or encouraging and I cannot thank them enough.
Many months of my research were supported through UROP funding.
Table 2.1: The fluids used in our experiments allowed us to examine a range ofviscosities and surface tensions.
17
otating mdI caiera i
Figure 2-1: The experimental setup consists of a transparent cylinder into whichgrains are placed.
E
Figure 2-2: The cylinder was backlit to produce images showing a dark heap againsta white background.
to a clock motor. The second rod was able to rotate freely. We used four motors to
vary the drum's rotation rate from 9x 10- 4 rpm to 0.56 rpm. An initial obstacle in
measuring the surface slope of a pile was that the wet particles stuck to the drum
walls. To overcome this, the drum was backlit brightly enough that the light could
pass through the thin layer of grains that accumulated on the sides of the drum. The
light was unable to pass through the 14.5 cm-thick bulk of the pile. This produced
images with a sharp contrast between the granular heap and the background. See
Figure 2-2. Images were acquired with a Photron Fastcam-X digital camera model
number 1280PCI and were taken at a rate of three frames per second. At this rate, the
slope of the pile changed no more than 0.2 degrees between frames. This introduced
insignificant error considering that within a run, measured values of 0 m typically
18
24.0
23.8
C,,a) 23.6a)0)En
a) 23.4v.
23.2
23.0
0 2 4 6 8 10 12
t(seconds)31 .U -
30.5 -
C,,a)
30.0-0)
29.5-
29.0I I I I I
0 2 4 6 8t (seconds)
Figure 2-3: We observe two regimes in the rotating drum geometry. (a) The inclina-tion of the pile increases with the rotation at the drum until m is reached at whichpoint the heap avalanches to r. This data was taken at w = 0.028 rpm and the grainsused were dry. (b) The grains flow continuously and the inclination of the heap isrelatively constant. Here, w = 0.56 rpm, Vf = 0.008, and the mixing fluid was siliconeoil with = 100 centistokes
varied by about two degrees.
Images were analyzed using Matlab code that found the boundary that marked
the surface of the pile by locating large gradients in pixel value. The slopes of the pile
were calculated from the successive images and stored in a vector for later analysis.
2.2 Observations
We observed two main regimes of behavior. In the stick-slip regime, the slope of
the pile increased with w, until the heap reached Sm. At this point, the grains were
19
(b)
observed to avalanche and the pile's angle decreased until the grains stopped flowing.
The angle to which the pile relaxed after an avalanche the angle of repose, or 0 r. This
process then repeated. In the continuous regime, the grains were observed to flow
continuously and the slope of the pile was constant. Now that we have presented
an overview of the experimental logistics, we will leave the remainder of observations
to be discussed in their appropriate chapters and present experiment and theory
together.
20
Chapter 3
Stability of a Static Pile
In this chapter, we will present experimental observations of the maximum angle of
stability. Then, we will attempt to model 0m in a dry system. Finally, we will use
the insight we gain from this analysis to study 0m for a cohesive heap and compare
various models with our experimental results.
3.1 Observations
We wish to confirm that our drum is rotating slowly enough that we can approximate
the pile as static. That is, we must show that the drum's rotation does not effect 9 m.
We find that this is the case. The maximum angle of stability was observed to not
depend on the rotation speed of the drum as long as the system was in the stick-slip
regime. See Figure 3-1.
Particle Diameter (mm) F(de1 20
1 70
0.5 700.1 706.0 70
0m (degrees)30.837.2
45.1*50.6*28.4
Table 3.1: The maximum angle of stability for spherical particles premixed with fluiddepends dramatically on the surface tension of the fluid, particle size, and the materialof the particles. *Unpublished data courtesy A. Samadani.
21
GlassGlassGlassGlassPlastic
- - w
===
33-
32-
31 -
CD,u)
U)a)
a)
30-
29-
28-
27-
26-'1
0.001
I I 111111 I I I III I I I I I2 4 68 2 4 68 2 4
0.01 0.1
() (rpm)
Figure 3-1: The maximum angle of stability was observed not to fluctuate significantlyor systematically as a function of w in the stick-slip regime.
30
o 28U)0)a)
26
24
1 2 3 4 5 6Vf x10-3
Figure 3-2: As the we increase the volume fraction, 0 m rapidly increases and saturates.The fluid used in this experiment was silicone oil. v = 5 centistokes. w=0.028 rpm
22
Stick-Slip Regirr
I I '
ne
*' i!Continuous
Regime
ii
GlassGlassGlassPlastic
Particle Diameter (mm) 0m
0.90.50.16.0
(degrees)
23.924.0*25.8*24.3
Table 3.2: The maximum angle of stability for dry, spherical particles is measured tobe approximately 24° regardless of the size or material of the particle. *Unpublisheddata courtesy A. Samadani. Higher observed angle for 0.1mm particles likely due toambient humidity.
Figure 3-3: The stability of a dry grain on the surface of a pile is determined by thethree spheres that support it.
We found that as a function of volume fraction, the angle of maximum stability
rises rapidly and saturates [1]. See Figure 3-2. Table 3.1 shows that the saturation
value of m changes with surface tension of the liquid, the particle size, and the size of
the system. However, for dry spherical particles, 0m is approximately 24° regardless
of the particle size or the material from which the particles are made [8]. See Table
3.2
In this chapter, we will present two existing models used to predict the maximum
angle of stability of a dry or cohesive pile. We will then present a new model for
predicting Orn.
23
=
3.2 The Dry Case
3.2.1 Geometrical Arguments
One approach to predicting the maximum angle of stability in a dry pile of spheres
was proposed in 1997 by Albert, et al [8]. This model uses only geometrical arguments
and states the following. If a particle is added to the surface of a pile of randomly
packed spheres, its stability will depend on only the arrangement of the three base
spheres which support this top sphere. See Figure 3-3. The local slope at this point
on the surface is defined as the slope of a plane passing through the centers of the
base spheres. To simplify the calculations, we may assume that all three of the base
spheres touch each other [8]. In order for the top sphere to be stable, a vertical
line that passes through the center of the top sphere must pass through the triangle
formed by connecting the three centers of the base spheres. See Figure 3-4. The
maximum local angle 0 of a base that can support an additional sphere is a function
of the orientation of the base spheres on the plane, q, and is given by the following:
10 = arctan cos (3.1)
CocoCs
The critical angle 9c for a frictionless, adhesionless pile is given by the average of this
local maximum stable angle over q.
/ = A arctan v os= 23.8° . (3.2)C1 A/ cos X
This calculated critical value is in excellent agreement with the value of m for a
dry pile that we obtain experimentally from both glass and plastic spheres ( 24°).
See Table 3.2. This consistency between experiment and theory of frictionless, adhe-
sionless particles leads us to conclude that friction is of minor importance, if any, in
determining the angle of maximum stability of a dry pile.
24
Figure 3-4: The corners of the tetrahedron represent the centers of spheres. (a) Theconfiguration is stable if the projection of the center of the top sphere straight downis within the base of the tetrahedron. (b) When we increase the slope of the planepassing through the base spheres to a sufficiently high angle, the projection of the topsphere lies outside of the tetrahedron's base. This corresponds with the configurationbecoming unstable.
25
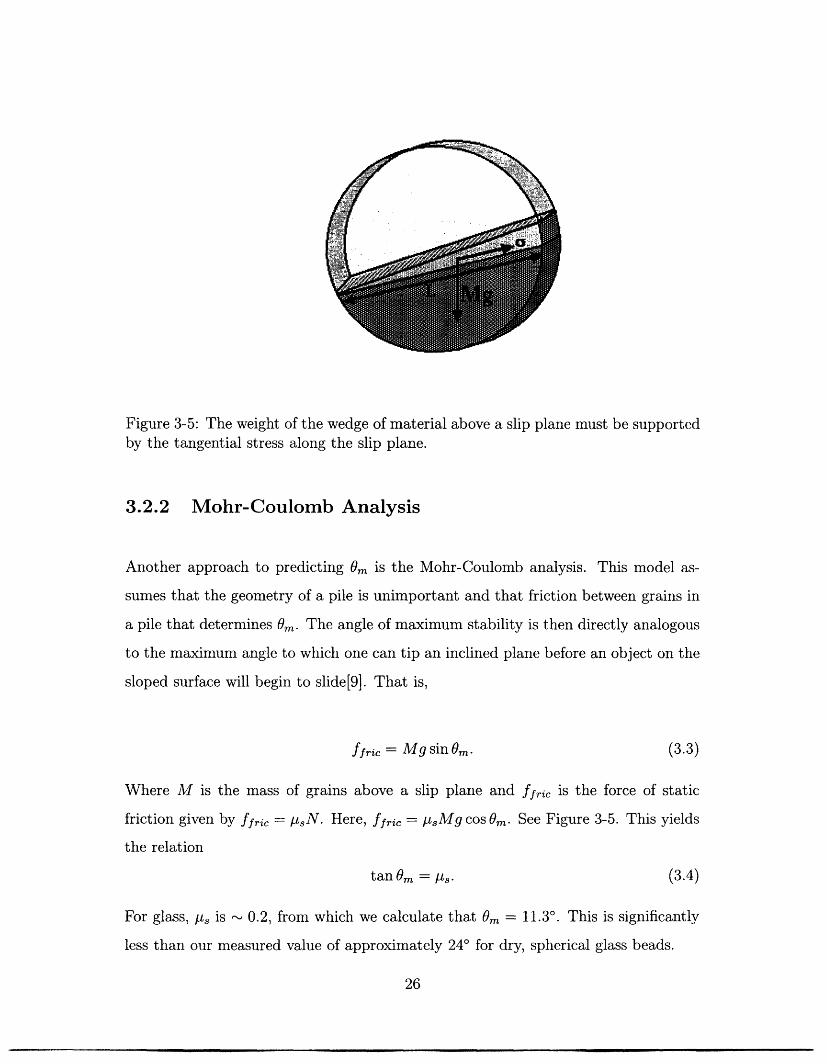
Figure 3-5: The weight of the wedge of material above a slip plane must be supportedby the tangential stress along the slip plane.
3.2.2 Mohr-Coulomb Analysis
Another approach to predicting 0m is the Mohr-Coulomb analysis. This model as-
sumes that the geometry of a pile is unimportant and that friction between grains in
a pile that determines 0m. The angle of maximum stability is then directly analogous
to the maximum angle to which one can tip an inclined plane before an object on the
sloped surface will begin to slide[9]. That is,
f fric = Mg sin 0m. (3.3)
Where M is the mass of grains above a slip plane and ffric is the force of static
friction given by ffric = utN. Here, ffric = gsMg cos Om. See Figure 3-5. This yields
the relation
tan m = As (3.4)
For glass, ps is - 0.2, from which we calculate that m = 11.3° . This is significantly
less than our measured value of approximately 24° for dry, spherical glass beads.
26
3.3 The Cohesive Case: Saturation Regime
3.3.1 Geometrical Arguments
In their 1997 paper, Albert et al. extended their geometrical model for 0m in a dry
pile to a wet one [8]. They again examined the stability of a single grain on top of a
heap of spheres, this time with an additional cohesive force F, where the top sphere
meets any of the three base spheres. They assumed that each of the spheres has a
weight G and found the following relations:
G sin 2 sin 'y 2 sin a1+ COS 02, ~~~~(3.5)Fc sin + 2 tan 3 -f + tan3f- ) - 2 (3.)
where 1,2 and 'Y1,2 are defined in the following way:
cos i = - V['cosO - sin 0 + ai sin 0], (3.6)3
sOS '/I2sisin sin2 sin 01 l7)2 + sin 2
2 + sin 02 sin 0 2 2 sin sin 2 (
sin /322 + sin /332 - cos 0 sin 2cOSY2 = 2 sin 3+ 6 sinb2 (3.8)
additionally, i = 1,2,3, al =-, 2 = , and 3
This model implies that m is ninety degrees if () is of order one or greater [8].
For 1 mm glass beads mixed with silicon oil at Vf = 0.008, the bond number' is of
order 5. We do not see 0m reach ninety degrees; our piles typically avalanche when
0 exceeds 31°. We believe that this discrepancy arises from the assumption that a
wet granular pile fails at the surface. This led us to re-examine the Mohr-Coulomb
model, which assumes failure at a depth for cohesive materials.
'The quantity Fj is the bond number. It is the ratio of the forces in a system that depend onsurface tension to the forces that arise from gravity.
27
3.3.2 Mohr-Coulomb Analysis
The addition of a cohesive force between particles such as that provided by liquid
bridges modifies the Mohr-Coulomb analysis by increasing the normal force along the
slip plane [6]. The total normal force becomes
N = mgcos m + FA. (3.9)
where FA is an adhesive force generated by the liquid bridges. Such an analysis leads
to the result
tan 0m = /Is (1 + Dd cos m). (3.10)pgDd
z is an effective number of liquid bridges per particle, d is the diameter of the particles,
g is acceleration due to gravity, p is the density of the particles, and D is the depth
at which failure occurs.
Using formula 3.10, and taking z to be six2 [10], we calculate the maximum angle
of stability for mm particles mixed with silicone oil Vf = 0.008 to be 23.7° , sub-
stantially less than our measured value of 31° . We also conclude that static friction
is not strong enough to be solely responsible for the maximum angle of stability of a
cohesive granular heap.
3.4 Liquid Bridge Model
We now propose the liquid bridge model, which assumes that failure occurs at a depth
and that liquid bridges stabilize the pile when its slope exceeds 23.8° , the dry Om.
We will draw on the idea of a slip plane from the Mohr-Coulomb analysis. We
claim that just before failure, the bridges that spanned the slip plane exactly sup-
ported the weight of the material in the wedge above this plane not supported by the
normal force. Our analysis differs from the Mohr-Coulomb analysis here, because we
2 Roughly, when particles are randomly packed in the bulk of a pile, each is held in a stableposition by three particles to its right and three to its left. In the saturation regime, there is liquidbridge at each contact between two particles.
28
believe it is the force of the liquid bridges, not static friction, that supports the wedge.
We will assume that on average, each particle feels a force equal to the strength of
one liquid bridge parallel to the slip plane. Ideally, one would find the component
FC that is directed along the slip plane. However, we know that a particle will have
either one or two liquid bonds that will increase its stability. The number of bonds
and the magnitude of their relevant components will depend on A, the orientation of
the base spheres, but this magnitude should be on the order of the strength of a single
liquid bridge. The net maximum force per unit area that the particles below the slip
plane may exert on the particles above the slip plane is proportional to the force of a
single liquid bridge times the number' of particles per unit area that intersect the slip
plane. One estimates the numiber of particles per unit volume to be
4 P (3.11)
3
Here, the radius of a particle is r, and fp is the packing fraction. This is the ratio of
the sum of the volumes of all of the individual particles of grains to the total volume
occupied by the granular pile. For a randomly packed granular heap of spheres, fp is
0.64. The number of particles per unit area is equal to the number of particles per2unit volume to the power. Thus, we find that the force exerted by liquid bridges
along the slip plane is:
Fc( 4 )2/3 (3.12)3
Where we assume F to be 27rFr in the saturation regime [1]. The stress given in
equation (3.12) must balance the shear stress from the weight of the wedge given by:
sin ( - Od)Mg (3.13)WL
where d is the critical angle of dry heap from 3.1, and M is the mass of the wedge.
We take ( -- d) for the following reason. A sphere can be supported by normal
forces of three spheres forming a triangular base below it up to a dry critical angle
of d = 23.8° . To support angles greater than 23.8° on the surface, it is necessary
29
to supply a force directed up along the slip plane with magnitude of mg sin ( - d),
where 0d is the dry critical angle and m is the particle's mass. Within the pile, normal
forces exerted by the base spheres can support a top particle for angles up to 23.8°.
Beyond this angle, we need a force equal to Mg sin ( - Od).
The pressure that this wedge exerts on the slip plane is proportional to the depth
of the wedge times the mass density of the wedge times gravity. If we use the small
angle approximation, the height of the wedge is ( - Od)L. The mass density of the
wedge is the mass density of the particles times the fraction of space that the particles
occupy. We find that the pressure on the slip plane from the weight of the wedge is
L(O - Od)pgfp, (3.14)
where p is the density of the particles.
Thus, at the maximum angle of stability, our pile satisfies the equation
Fc( 1 P ) 2/3 = L(Om Od) 2pgfp (3.15)
This implies that
(Ore - Od) 27rrr (3.16)(4irr3)2pfp3gL
We have a proportionality here and not an equality because we ignored the orienta-
tions of the liquid bridges with respect to the slip plane, but we expect the constant
of proportionality to be of order one. Table 3.3 shows theoretical and experimental
values of 0m. We found good agreement between experiment and theory for particles
with wetting surfaces that produced piles with constant slope.
30
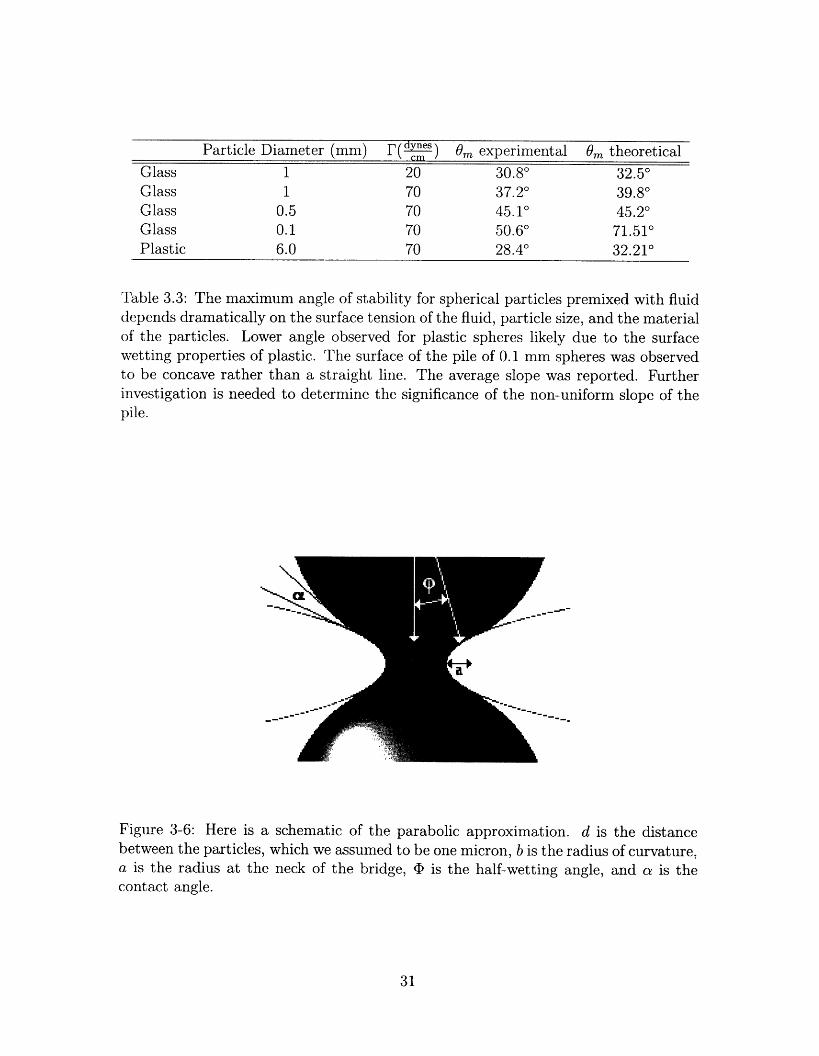
Particle Diameter (mm) F( dYes) m experimental Om theoreticalcm
Glass 1 20 30.8 ° 32.5 °
Glass 1 70 37.2 ° 39.8 °
Glass 0.5 70 45.10° 45.2 °
Glass 0.1 70 50.6 ° 71.510°
Plastic 6.0 70 28.4 ° 32.21 °
Table 3.3: The maximum angle of stability for spherical particles premixed with fluiddepends dramatically on the surface tension of the fluid, particle size, and the materialof the particles. Lower angle observed for plastic spheres likely due to the surfacewetting properties of plastic. The surface of the pile of 0.1 mm spheres was observedto be concave rather than a straight line. The average slope was reported. Furtherinvestigation is needed to determine the significance of the non-uniform slope of thepile.
N
Figure 3-6: Here is a schematic of the parabolic approximation. d is the distancebetween the particles, which we assumed to be one micron, b is the radius of curvature,a is the radius at the neck of the bridge, 45 is the half-wetting angle, and is thecontact angle.
31
3.U -
2.5-
2.0-
IL 1.5-
1.0-
0.5-
0.0 -
0 2 V 4 6 8f x103
Figure 3-7: We calculated the dimensionless force of a liquid bridge binding twoparticles assuming a separation distance of one micron and a contact angle of 40°
3.5 The Cohesive Case: Small Volume Fraction
3.5.1 Bridge Force
Next, we wish to describe the increase in the maximum angle of stability that occurs
from Vf = 0 to 5 x 10 - 4 . This requires us to find Fc as a function of volume fraction.
We needed to determine the shape of the bridges in order to calculate this force.
The force of a liquid bridge between two particles may be calculated using either
the toroidal or the parabolic approximation [11]. Both approximations work well
for calculating F as a function of the separation distance; however, the parabolic
approximation was slightly more accurate [11]. When we calculated Fc as a function
of volume fraction, the toroidal approximation broke down at Vf = 5 x 10 - 4, which
is one fortieth of the smallest volume fraction studied previously [11].
We decided to use the parabolic approximation because of this breakdown. We
assumed that the separation between our particles was the order of a micrometer,
based on the particle roughness measured by direct observation with a microscope
[10]. These observations also led us to assume that all of our liquid was contained
within liquid bridges and that there were, on average, six liquid bridges per particle.
We used the following equation to calculate the force of the liquid bridge from the
32
I
I
II
I , , , . . , . , .. . , , 1 . . . .
A A
shape:
F = rr sin 02Ap + 2rr sin 0. (3.17)
The capillary (Laplace) pressure is equal to
Ap = y(1/a + 1/b). (3.18)
We then defined the non-dimensional force [14]
F*, - (3.19)?y2r
We assumed a contact angle of 40 degrees. This angle contact angle has been found
to be most accurate for calculating the strength of a liquid bridge to determine the
tensile strength of wet granular material [13].
These assumptions lead us to predict that the maximum angle of stability reaches
its saturation point at Vf = 2 x 10- 4, which we can estimate from Figure 3-7. Exper-
imentally, we find that the maximum angle of stability saturates at Vf = 5 x 10- 4 .
See Figure 3-2. While the parabolic approximation allows us to predict within an
order of magnitude where saturation occurs, it predicts a more rapid increase than
we observe. This is not entirely surprising. We assumed a coordination number of
6 for all volume fractions; however it has been experimentally determined that at
very low volume fractions the coordination number is less than 6 [14]. Fewer liquid
bridges could result in a lower cohesive stress. Further investigations need to be done
to include the statistical distribution of number of liquid bridges per particle the
maximum angle of stability.
33
34
Chapter 4
A Dynamic Pile
4.1 Stick-Slip to Continuous Motion Transition
As discussed in chapter 2, there are two general regimes of motion for grains in a
rotating drum. The pile undergoes stick-slip motion at slow rotations rates up to wt.
Past this transition, the surface undergoes continuous motion. Roughly speaking, the
transition from stick-slip to continuous motion occurs because if we rotate the drum
fast enough, the rate at which the flowing grains decrease the slope of the pile will
equal the angular velocity of the rotating drum, and the system will be in equilibrium.
We studied this transition by observing the behavior of a granular heap at different
rotation rates.
We expect that in a dynamic system, the viscosity of the interstitial fluid will
have a significant effect on the particles' dynamics. For this reason, we studied grains
mixed with silicone oils having viscosities v of 10, 100, and 1000 centistokes. Figure
4-1 shows our results. All data were taken in the saturation regime, at a volume
fraction of 0.008. We measured 0m and 0r in the stick-slip regime. In the continuous
regime, the slope of the system remained constant, and this single angle was plotted
as m and Or If we plot the maximum angles stability and repose as a function of w,
we find that St decreases as viscosity of the interstitial liquid increases. Qualitatively,
we expect to find this shift because viscosity adds a frictional force to the system
proportional to the shearing of the fluid, which is related to the velocity of the fluid.
35
32 -
30 -
28 -
26 -
32-
CD0)a)
a)
30 -
28 -
26 -
32 -
30 -
28 -
26 -
2........ % 2.............2 46 2 46 2 4
).001 0.01 0.1
I I UITJI~ I~I 1 [1111 1 I E
T 2 46 2 4 2 40.001 0.01 ' 0.1
(c) '
w~~~~~~~~~
V=5cs*. .... .... ..1 .... ... I2 46 2 46
0.001 0.01 0.1() (rpm)
2 4
Figure 4-1: We observe that the transition from stick-slip to continuous motion occursat slower rotation rates for higher viscosities. 9m was plotted open triangles and 9r
was plotted with filled triangles. This data was obtained with silicone oil, whichallowed us to vary the viscosity over several orders of magnitude.
36
%
V =1 000cs
(b)
V=1 00cs
I
32
28
24
20
32
1) 28()a))24
a)
20CD
1 2 3 4 5 6x10 -3
32 -
28 -
24-
20 -
I I I I I I1 2 3 4 5 6
V x10 3
Vf
Figure 4-2: \We observe that the transition from stick-slip to continuous motion occursat lower volume fractions for higher viscosities. 0 m was plotted with open trianglesand 0 r was plotted with filled triangles. Silicone oil was used to vary over threeorders of magnitude.
We expect that the more viscous the interstitial liquid, the stronger this viscous force,
and the slower the velocity of the avalanching grains. If the flow rate of the heap
decreases as we increase the viscosity, it is reasonable that the rotation rate needed
to enter the continuous regime decreases as well.
After investigating the effect of w on the transition from the stick-slip to the con-
tinuous regime, we investigated the effect of volume fraction at W = 0.028 rpm. We
will define V'i as the volume fraction at which the transition occurred. We found
a decrease in Vt with increasing viscosity. This is most likely due to the fact that
viscous dissipation is proportional to both fluid volume and viscosity. As this dissi-
pation increases, the energy (including the kinetic energy) of the system decreases.
37
V=-1 OCS
Eventually, the flow rate of our heap will match the rotation rate of our drum, and
the system will exhibit continuous motion. Because the viscous dissipation increases
with both volume and viscosity, it is reasonable that the flow rate of a highly viscous
liquid at a low volume fraction would meet the flow rate in a system with a less vis-
cous liquid at a higher volume fraction. While we have not developed a quantitative
description of this shift, it does provide a qualitative explanation for our observation
that Vt decreases in volume fraction with increasing viscosity.
4.2 The Continuous Regime
There are two main phenomena we notice in the continuous regime. First, we notice
that at a given viscosity, the slope of the pile increases with rotation rate. This effect
is particularly dramatic for the 1000 centistokes oil. See Figure 4-1. For the system
to be in a steady state, the flux of the grains must increase as w increases. In fact,
w vd. (4.1)
Where v is the velocity of the grains and d is the depth of the flow. The component
of the grains' weight that is tangential to the piles surface balances the viscous forces.
The viscous forces are proportional to the shearing rate, which goes as . This leads
to the relationV
sin -. (4.2)
We observe that increases as w increases. In order for equations 4.1 and 4.2 to
be consistent, we conclude that the velocity of the avalanching grains increases with
increasing w
We also notice that the slope at which the grains continuously avalanche increases
with increasing viscosity for a fixed w. See Figure 4-2. This is not surprising. As
we increase the viscosity at a given rotation rate, the particles experience a greater
viscous drag at the same velocity. Once again, the system balances this increased
viscous drag with an increased tangential weight component by increasing its slope.
38
4.3 The Stick-Slip Regime: The Angle of Repose
We will discuss the angle of repose in this section because it depends on the dynamic
properties of the system. Again, we expect to find that the viscosity of the liquid can
have an effect on the particles' motion and thus on 0.r Somewhat surprisingly, we
find that there are two regimes for Or. When Vf < 4 x 10 - 4 , the angle of repose does
not appear to significantly depend on the viscosity of an interstitial liquid. In this
regime, Or decreases rapidly. At these lower volume fractions, we find no significant
difference in the angles of repose over the three viscosities that we studied. As we
continue to increase the volume fraction, we find that the 0r depends strongly on
viscosity. The angle of repose begins to increase with volume fraction. See Figure
4-2. It then either saturates as is the case for silicon oil with viscosity 5 centistokes,
or rises to meet the angle of maximum stability and exhibiting continuous motion as
is the case for silicon oil with viscosity of 100 or 1000 centistokes. It is worthwhile
to note that our measurements of the r as a function of volume fraction differ from
those performed in a pouring geometry. When the angle of repose is studied in this
fashion, it increases linearly as a function of volume fraction [3] in contrast to our
observed initial sharp decrease. This will be addressed in our discussion on stick-slip
models.
4.4 Stick-Slip Models
The stick-slip behavior observed for granular material in a rotating drum geometry
displays similar properties to a block resting on a surface being pulled by a spring. In
this system, we pull on the spring until Kx, the force with which the spring pulls on
the block exceeds asN, the static friction. At this point, the block begins to accelerate
(this is the "slip"), overshoots its equilibrium position, compresses the spring, and
comes to rest (the "stick") until the spring is sufficiently extended once again. If the
block is pulled with a high enough velocity, the system will reach equilibrium and
the force of the spring will balance PdN, the dynamic friction of the system. In this
39
regime, the block will move at a velocity equal to the velocity with which the spring
is being pulled. The equation for such motion is [12]:
If
= V (4.3)
and
K7 < Mbgpus (4.4)
then
y=0. (4.5)
Where Mb is the mass of the block, y is the spring's compression or extension, K is
the spring constant, V is the velocity with which the spring is being pulled, and d
is the dynamic friction, which may be a function of V - 1. In all other cases,
Mb' + Ky = Mgld(V- ). (4.6)
These equations are subject to the initial condition:
y(t = 0) = V (4.7)
In the rotating drum system, we replace velocity with w. Static friction becomes
t9 m and weight acts like the restoring force in the spring. However, there is no obvious
analogy for kinetic friction. We can define an effective dynamic friction, od, the angle
at which = 0. This angle is complicated to predict because energy loss through
inelastic collisions, liquid bridge rupture, and viscous dissipation all resist motion in
a dynamic pile. We obtain the equation:
(4.8)= -YP9 + 7YPqd( (-) (4-8)
where is 2 , R is the radius of the drum, p is h , g is acceleration due to gravity,
w is the drum's rotation rate, and h is the flow depth. If we assume that the effective
dynamic friction is constant, and make the variable substitution a = 0 - qd, we find
40
the following:
& = -ypa. (4.9)
This is an equation that describes simple harmonic motion with the equilibrium po-
sition at d. This is to say that if we define Om = d + OZo, then r, the angle at
which the system comes to rest is given by d - aO0 . If we assume that for dry grains,
the friction does not depend on velocity, we find that qd is given by the average
0m and 0 r, or 23.5° . Our data for 0m and 0 r show that d for a system in which
Vf < 4 x 10 - -4 may be approximated by the value of d found in the dry case. This is
somewhat surprising considering that in this low volume fraction regime, 0 m cannot
be approximated by 0m for dry grains.
The only dependence of 0 r on Vf at low volume fractions arises from the depen-
dence of the static properties of the system on Vf, and not from any dependence of the
dynamic properties. We find that Or is partly governed by the state of the pile when
the avalanche begins. The discrepancy between our values of 0 r and those found in a
pouring geometry arise from the fact that the different experiments set up different
initial conditions.
We should note here that it is not entirely correct to assume that the q)d is con-
stant for dry materials and in the very low volume fraction regime. We know from
experiment that when w = 5 x 10⁻² rpm, flow become continuous for dry grains. We
can see from equation 4.9 that this is impossible if Od does not depend on rotation
rate unless we are able to start the system at exactly 0 = d, or more accurately
if Om = kd. We know from experiments at lower rotation rates that this is not the
case, so we must conclude that there is some term in kd that depends on 0 - w. In
fact, there is some friction in avalanching grains proportional to the velocity squared.
This term arises from the inelastic collisions of the grains in motion. To improve this
model, we need to inlude terms in O/d that account for liquid bridges between particles
and viscous forces.
41
8-
C,a)a):)c(D
co
'ECD
6-
4-
O-
0 -
00
0
·~~ 0 0 0 @00 @0 @I * 0 0
0 0@ 0
0 0 0.0
0* 0
es - 'theoretical curve'0TV * 0~~~ 'experimental values'
I0
22
I
4
23.5- 0 r(degrees)
66
I
88
Figure 4-3: Each point on this graph corresponds to the displacement of 0m and r
from 23.5° at a given viscosity at a given volume fraction less than 5 x 10 - 4
42
Chapter 5
Conclusions
5.1 Summary
In this thesis, we investigated the static and dynamic properties of a cohesive granular
heap. We made the pile cohesive by the addition of small amounts of liquid. In chapter
three, we examined existing models for the stability of a cohesive granular pile and
presented the liquid bridge model to predict Sm. This model had good agreement
with theory for particles made of wetting material when the surface of the pile was
observed to be linear. The liquid bridge model did not take friction in to account, so
we conclude that it is of minor importance compared to geometry in determining the
stability.
In addition, we investigated the effect of the viscosity of the interstitial fluid on
the dynamic properties of a granular pile. In particular, we examined the transition
from stick-slip motion to continuous motion in a rotating drum geometry as well as
the effect of viscosity on the angle of repose of the granular pile. We used scaling
arguments to predict that in the continuous regime, grains move with higher velocities
as we increase rotation rate.
Finally, we used a stick-slip model to infer information about the dynamic friction
in a pile from the maximum angle of stability and the angle of repose. We found that
it is possible to use the 0 m and 0 r to study and draw conclusions about the dynamic
friction of a granular pile.
43
In the final chapter we will conclude by proposing future research directions.
5.2 Future Investigations
In chapter 3, we presented a model for the relationship between cohesive inter-particle
forces and the maximum angle of stability. We would like to conduct further exper-
iments to either confirm or disprove this model. While we were able to vary the
particle size and the surface tension of the liquid somewhat, one would like to test
the model over a wider range of particle size. Additionally, one would like to test the
dependence we derived for 0 m on the system size, and the density of the particles. It
would also be informative to measure m for dry and wet piles of grains with very
different frictional properties to determine whether friction indeed has no effect on
Om.
Ideally, one would like to determine whether our drum is sufficiently large that we
may ignore the effects of the side walls. This can be tested by using an insert that
may be placed at different distances inside the drum to effectively reduce the depth
of the cylinder. This will be a crucial step experiment to justify the validity of the
results presented here.
In chapter 4, we predict that an increase in grain velocity, and not in flow depth
provides the necessary flux when w is increased. One could pursue this question using
a high-speed camera to study the velocity of the grains and the depth of flow in the
continuous regime.
In chapter 4 we also showed that it is possible to deduce information about the
forces in a dynamic pile from the angle of maximum stability and angle of repose of
a system. Finally, more work needs to be done to understand d in the saturation
regime and its dependence on viscosity and volume fraction.
44
Bibliography
[1] A. Samadani. Segregation, Avalanching and Metastability of Dry and Wet Gran-
ular Materials. PhD thesis, 2002.
[2] A. Samadani and A. Kudrolli. Segregation transitions in wet granular matter.
Physical Review Letters, 85: 5102-5105, 2000.
[3] A. Samadani and A. Kudrolli. Angle of repose and segregation in cohesive gran-
ular matter. Physical Review E, 64: 050301, 2001.
[4] P. Tegzes, T. Vicsek, and P. Schiffer. Development of correlations in the dynamics
of wet granular avalanches. Physical Review E, 67: 051303-1-17, 2003.
[5] T.G. Mason, A. J. Levine, D. Ertas, and T. C. Halsey. Critical angle of wet
sandpiles. Physical Review E, 60:5044-5047, 1999.
[6] T.C. Halsey and A. J. Levine. How sandcastles fall. Physical Review Letters, 80:
3141-3144, 1998.
[7] P. Tegzes, T. Vicsek, and P. Schiffer. Avalanche dynamics in wet granular ma-