Page 1
INVESTIGATING THE EFFECT OF WARM MIX ADDITIVE ON THE
PERFORMANCE OF ASPHALT MIXTURES
Xiomara Sanchez, Ph.D., P.Eng., Assistant Professor and
D.C. Campbell Chair in Highway Construction and Pavement Research
Department of Civil Engineering
University of New Brunswick, Fredericton, NB
[email protected]
Sina Varamini, Ph.D., P.Eng., Research and Development Manager
McAsphalt Industries Limited
Toronto, ON
[email protected]
Tyler Somers, Undergraduate Student
Department of Civil Engineering
University of New Brunswick, Fredericton, NB
[email protected]
Matthew Sweezie, P.Eng. Paving Engineer Construction Branch
New Brunswick Department of Transportation and Infrastructure
Fredericton, NB
Matthew. [email protected]
Susan L. Tighe, Ph.D., P.Eng., Professor and Canada Research Chair
Centre for Pavement and Transportation Technology (CPATT)
Department of Civil and Environmental Engineering
University of Waterloo, Waterloo, ON
[email protected]
Paper prepared for presentation
at the TESTING AND MODELING OF ROAD AND EMBANKMENT MATERIALS Session
of the 2017 Conference of the
Transportation Association of Canada
St. John’s, NL
Acknowledgements
The authors extend their gratitude to the New Brunswick Department of Transportation and
Infrastructure, in particular Doug Pyne and Jim McCrae (Central Lab), Ryan Barclay and Jason
Turnbull (Construction Branch). Appreciation is also extended to the Norman W McLeod Chair
in Sustainable Engineering at the University of Waterloo
Page 2
2
ABSTRACT
Warm mix asphalt (WMA) is a technology that has seen widespread growth in Canada since its
introduction to North America in 2002. Since this technology is relatively new, there are still
concerns about how these asphalt mixtures will perform over long-term, especially regarding
resistance to moisture damage. Moisture damage is the primary driver for the deterioration of
asphalt in the field, and can also exacerbate existing life-cycle stresses and cause premature
failure. The wide range of different techniques being used for this technology makes it difficult
to make broad generalizations, as some seem to perform much better than others in a laboratory
setting. With this in mind, a study comparing the results from plant produced WMA against a
known hot Mix Asphalt (HMA) will provide useful information on what can be expected from
the mixes currently in use. This study compared a WMA mix using a 0.3% Evotherm M1
additive and an HMA mix produced by a local provider in New Brunswick. These asphalt
mixtures were prepared using the same locally sourced binder and aggregate. The WMA mix
performed well compared to the control HMA mix in a Modified Lottman Test; both had tensile
strength ratio (TSR) values above the minimum of 75%, and it was found that there is no
difference between the WMA and HMA Tensile Strengths. Additional testing on the
performance of the mixtures using the Hamburg Wheel rutting test was performed, and the
mechanical response of the mixtures was characterized using the Dynamic Modulus Test.
Additionally, the impact on the life cycle and a comparison using the Mechanistic-Empirical
Design Method were analyzed and no difference was found in long-term performance of WMA
and HMA
INTRODUCTION
Warm Mix Asphalt (WMA) refers to a larger group of techniques and processes that increase the
workability of asphalt mixtures at lower temperatures than traditional hot mix asphalt (HMA)
(Sargand, Nazzal, Al-Rawashdeh, & Powers, 2012). These techniques can reduce the required
mixing and compaction temperatures of asphalt between 10°C to 40°C (Vaitkus, Cygas,
Laurinavicius, Vorobjovas, & Perveneckas, 2016; Sebaaly, Hajj, & Piratheepan, 2015),
depending on type of modification. This represents a substantial opportunity for decreasing both
energy costs, lowering greenhouse gas emissions as well as reductions in harmful gases (Kim, et
al., 2012; Rubio, Martínez, Baena, & Moreno, 2011), which is increasingly a priority for
governments and manufacturers.
One of the drivers of moisture related damage in asphalt mixtures is the presence of water under
the base course that is unable to drain and can start to strip away the asphalt coating from the
aggregate which can lead to fatigue cracking or rutting (Pavement Tools Consortium, 2011).
This action can take several different chemical routes (Emery & Seddik, 1997), but it leads to
premature failure and wear.
WMA mixtures are especially susceptible to moisture damage, as the lower mixing temperatures
may not completely dry the aggregates being used. Further, some WMA technologies depend on
a water-based emulsifier to work or foaming asphalt cement, which may also contribute to
stripping problems.
Page 3
3
Because the exact mechanisms for how moisture damage occurs is imperfectly understood,
several tests are used, each of which have been shown to be correlated with the potential for
moisture damage. This research study examined the effect of a WMA additive in the
performance of plant-produced mixtures samples of HMA and WMA collected from a local
provider in New Brunswick. This paper describes the test procedures followed and findings from
the comparison.
BACKGROUND
The New Brunswick Department of Transportation and Infrastructure (NBDTI) was one of the
early adopters of Warm Mix Asphalt Technology in Canada. At the time, warm mix was
developed to help reduce energy consumption and stack emissions during production. Warm
mix has allowed for longer haul distances, lower placement temperatures and improved
workability. NBDTI completed their first project of approximately 1100 tonnes of WMA in 2007
on Route 111 in Saint Martins. This project utilized an emulsion-based warm mix technology
(Evotherm DAT). Two more trial projects were completed in 2008 using chemical additive
(Evotherm-3G). After three successful trials, NBDTI began incorporating more WMA into the
capital paving program. In 2009, there were five separate projects accounting for 55,710 tonnes
WMA representing 7.2% of the paving program. This volume has been steadily increased over
the years to as much as 366,000 tonnes in 2015, which represented 52.1% of the total tonnage of
asphalt placed in the province. Over the last three construction seasons, NBDTI utilized WMA
on approximately half of paving projects over the province.
Currently, NBDTI has eleven approved WMA technologies, and continue to evaluate new warm
mix technologies and products on yearly basis. Of the approved technologies, there are six
chemical or powder additives and four foaming systems. NBDTI utilizes WMA as it has seen
number of benefits. Aside from benefits of being a green technology (reduction of emissions and
energy consumption during production) NBDTI has seen an improvement in compaction along
the longitudinal joint, resulting less longitudinal joint cracking within the first few years of a
projects life cycle. Warm mix technologies have allowed NBDTI to extended the paving season
in areas of the province that are relatively colder later in the paving season as well as allowing
for some longer haul distances. Additionally, NBDTI feels that durability is improved with
Warm Mix as there is less oxidation of the asphalt binder when compared to mixing at hot mix
temperatures.
A survey of other provinces shows that this is very similar to their findings with WMA. A study
done in Ontario (Esenwa, Davidson, & Kucharek, 2011) had laboratory WMA TSR of 84.5%
compared to their control TSR 81.2%. Both Manitoba (Porras, 2012) and Saskatchewan (Kelln,
Podborochynski, Haichert, & Berthelot, 2012) have reported tests with WMA having comparable
results from indirect tension tests. In 2015, a survey on Canadian usage of WMA conducted by
Varamini and Tighe found that the majority of Canadian provinces use some form of WMA on a
regular basis. The respondents reported chemical additives were among the most commonly
used warm mix technologies, including the type that was used for this study. Of the provinces
that do require testing of WMA asphalts, the majority use a Modified Lottman Test, and have an
acceptance range of 73% to 85% for these tests (Varamini & Tighe, 2015).
Page 4
4
Evotherm M1 is a warm mix technology that also have anti-stripping properties and does not
require a water emulsifier (Asphalt Innovations, 2010), a distinction that is important in some
studies done to date (Cucalon, et al., 2015). Other findings in the literature (Sargand, Nazzal, Al-
Rawashdeh, & Powers, 2012)) suggest that Evotherm has a positive impact on TSR tests, though
some tests have shown that the anti-stripping agent must be part of the mixture to achieve the
same kinds of results at the control HMA (Cucalon, et al., 2015). The Evotherm M1 and J1
technologies are the latest generation of additives also sold under the same Evotherm 3G, and
both contain an anti-stripping agent (Asphalt Innovations, 2010).
MATERIALS
The materials selected for this study correspond to NBDTI mixtures Type D/ WMA-D that are
Superpave mixtures with a maximum aggregate size of 12.5 mm, installed for the wearing course
of Provincial Roads in New Brunswick. The additive used for the WMA was Evotherm M1 in a
concentration of 0.3%. Both HMA and WMA were collected from the same plant, and were
prepared with the same locally sourced PG 58-28 binder and aggregate. The compaction
temperatures for WMA and HMA were 120°C and 135 °C, respectively.
Evotherm M1 has the potential to reduce the temperature by a higher range, however, in New
Brunswick the dosage rate and mixing/compaction temperatures are as per supplier’s
recommendations. The Asphalt Concrete End Result Specifications state that the minimum
temperature prior to initial compaction shall be 90°C for war mixed asphalt concrete, and that the
maximum temperature of the WMA behind the screed shall be 125°C.
The samples were collected in the fall of 2015, and were tested in the NBDTI Central lab over
the course of the Winter Term of 2016. Cylinders were prepared at the University of New
Brunswick using a Troxler 4141 Superpave Gyratory Compactor (SGC) and sent to the Centre
for Pavement and Transportation Technology (CPATT) at the University of Waterloo for
Dynamic Modulus and Hamburg Wheel Track Test which were completed during the summer of
2016.
TEST METHODS
Tensile Strength Ratio
The initial density and TSR tests were performed at the NBDTI labs. WMA and HMA samples
were subjected to an indirect tension test (IDT) to estimate the potential for rutting or cracking.
Additionally, the sample briquettes were tested to find the theoretical maximum density (TMD)
for the asphalt mixes using the ASTM D2041 process. The TMD for the asphalt samples were
found to be similar to other tests done on other highways using these batches of WMA and HMA
mixes. A series of Marshall (100 mm diameter) Briquettes were prepared, and trials were
performed to find the compaction effort (number of Marshall hammer blows) to get a desired air
void content of seven percent. Once this was established, several briquettes were prepared from
each of the asphalt samples.
The IDT test performed was a Modified Lottman Test, following the ASTM D4867 standard.
The briquettes were assigned to three groups: control, conditioned and freeze/thaw. The freeze
cycle is 24 hours, after which both they and the conditioned briquettes are placed in a 60°C bath.
Page 5
5
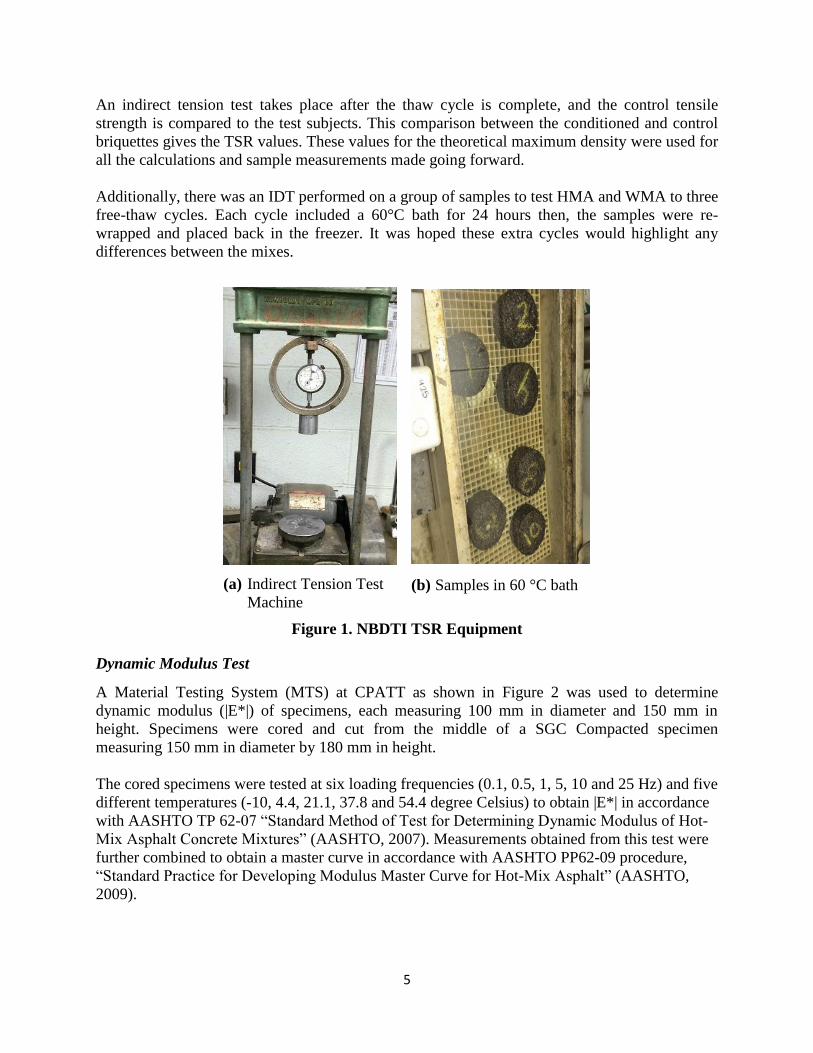
An indirect tension test takes place after the thaw cycle is complete, and the control tensile
strength is compared to the test subjects. This comparison between the conditioned and control
briquettes gives the TSR values. These values for the theoretical maximum density were used for
all the calculations and sample measurements made going forward.
Additionally, there was an IDT performed on a group of samples to test HMA and WMA to three
free-thaw cycles. Each cycle included a 60°C bath for 24 hours then, the samples were re-
wrapped and placed back in the freezer. It was hoped these extra cycles would highlight any
differences between the mixes.
Dynamic Modulus Test
A Material Testing System (MTS) at CPATT as shown in Figure 2 was used to determine
dynamic modulus (|E*|) of specimens, each measuring 100 mm in diameter and 150 mm in
height. Specimens were cored and cut from the middle of a SGC Compacted specimen
measuring 150 mm in diameter by 180 mm in height.
The cored specimens were tested at six loading frequencies (0.1, 0.5, 1, 5, 10 and 25 Hz) and five
different temperatures (-10, 4.4, 21.1, 37.8 and 54.4 degree Celsius) to obtain |E*| in accordance
with AASHTO TP 62-07 “Standard Method of Test for Determining Dynamic Modulus of Hot-
Mix Asphalt Concrete Mixtures” (AASHTO, 2007). Measurements obtained from this test were
further combined to obtain a master curve in accordance with AASHTO PP62-09 procedure,
“Standard Practice for Developing Modulus Master Curve for Hot-Mix Asphalt” (AASHTO,
2009).
(a) Indirect Tension Test
Machine (b) Samples in 60 °C bath
Figure 1. NBDTI TSR Equipment
Page 6
6
(c) 810 MTS loading frame and
651 MTS environmental chamber
(d) Inside view of the environmental
chamber
Figure 2. CPATT Dynamic Modulus Test Setup
Hamburg Wheel Tracking Device (HWTD)
The resistance of compacted asphalt mixtures to rutting and moisture damage was evaluated by
using a Hamburg Wheel Tracking Device (HWTD) in accordance with AASHTO T324-04
“Standard Method of Test for Hamburg Wheel-Track Testing of Compacted Hot Mix Asphalt
(HMA)” (AAHTO, 2011).
The device tracks a 705 N load hard-rubber wheel across the surface of gyratory compacted
specimens submerged in a hot water bath at 50°C. During the test, the deformation of specimens
under the wheel path was recorded as a function of the number of passes by using linear variable
differential transducers (LVDTs).
Mechanistic-Empirical (M-E) Design Method
The AASHTOWare’s M-E Software available to CPATT was used to investigate the effect of
warm mix additives on the long-term performance of a pavement structure designed for New
Brunswick climate and traffic conditions with WMA used as a surface course. For this purpose, a
level 1 design was performed for the surface course by using dynamic modulus results and
results of asphalt binder testing. All other inputs were retrieved from the Ministry of
Transportation Ontario recommended inputs (MTO, 2012) and were maintained constant in all
the designs for other layers.
Cored
Specimen
3 Epsilon©
Model 3909
Extensometers at
120º Interval
(Gauge Length
of 70 mm)
Loading
Frame
Environmental Chamber
Page 7
7
A typical pavement structure was selected from the New Brunswick Department of
Transportation and Infrastructure (NBDTI) asset management system. This structure was
selected to presents pavement structures that could be routinely surface or re-resurfaced with
WMA and HMA mixtures. The pavement structure comprised of a total asphalt thickness of 140
mm, underlain by 150 mm of Granular Base and 450 mm of Granular Subbase. The asphalt layer
was separated into two layers with a 40 mm surface course, 100 mm binder course. The subgrade
soils were clayey silt with the resilient modulus of 36 MPa. The granular base and subbase
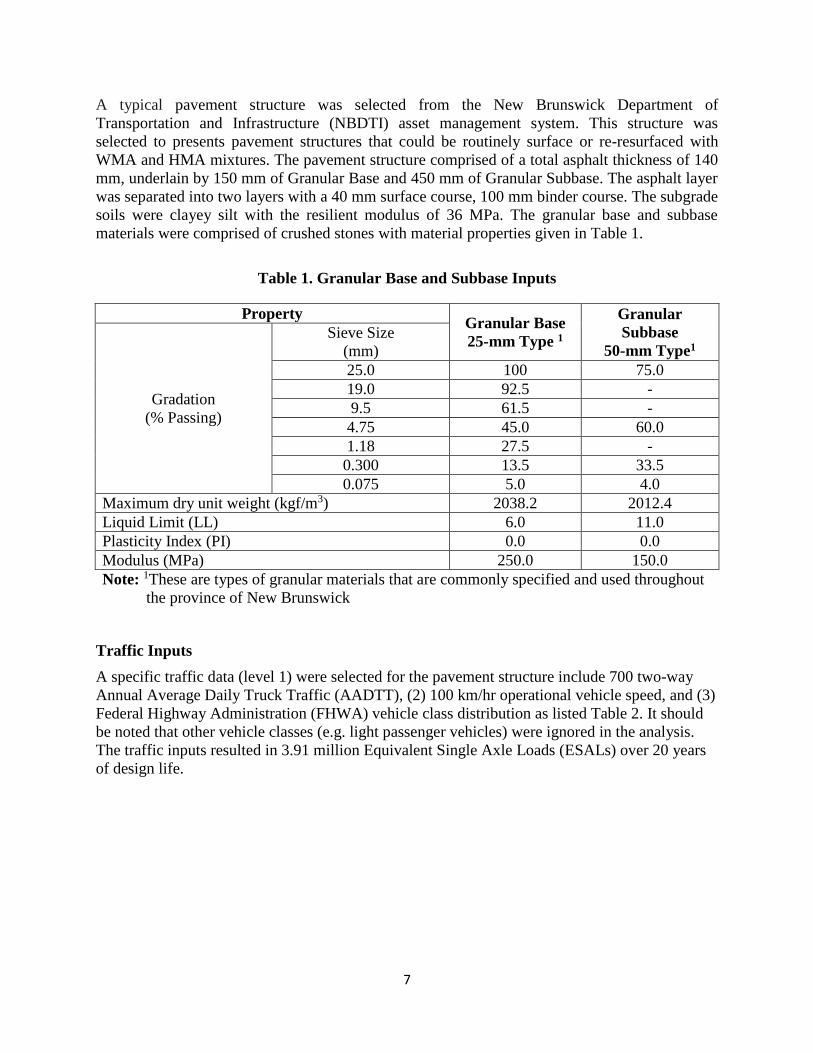
materials were comprised of crushed stones with material properties given in Table 1.
Table 1. Granular Base and Subbase Inputs
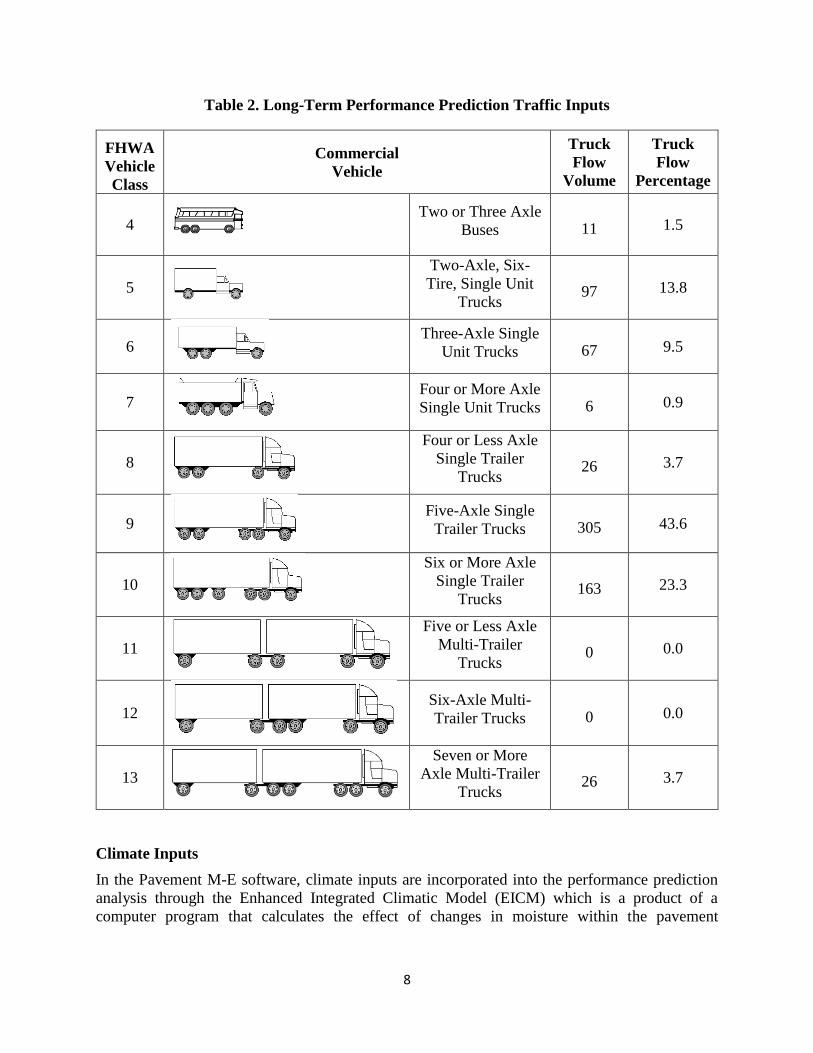
Traffic Inputs
A specific traffic data (level 1) were selected for the pavement structure include 700 two-way
Annual Average Daily Truck Traffic (AADTT), (2) 100 km/hr operational vehicle speed, and (3)
Federal Highway Administration (FHWA) vehicle class distribution as listed Table 2. It should
be noted that other vehicle classes (e.g. light passenger vehicles) were ignored in the analysis.
The traffic inputs resulted in 3.91 million Equivalent Single Axle Loads (ESALs) over 20 years
of design life.
Property Granular Base
25-mm Type 1
Granular
Subbase
50-mm Type1
Gradation
(% Passing)
Sieve Size
(mm)
25.0 100 75.0
19.0 92.5 -
9.5 61.5 -
4.75 45.0 60.0
1.18 27.5 -
0.300 13.5 33.5
0.075 5.0 4.0
Maximum dry unit weight (kgf/m3) 2038.2 2012.4
Liquid Limit (LL) 6.0 11.0
Plasticity Index (PI) 0.0 0.0
Modulus (MPa) 250.0 150.0
Note: 1These are types of granular materials that are commonly specified and used throughout
the province of New Brunswick
Page 8
8
Table 2. Long-Term Performance Prediction Traffic Inputs
FHWA
Vehicle
Class
Commercial
Vehicle
Truck
Flow
Volume
Truck
Flow
Percentage
4
Two or Three Axle
Buses 11 1.5
5
Two-Axle, Six-
Tire, Single Unit
Trucks 97 13.8
6
Three-Axle Single
Unit Trucks 67 9.5
7
Four or More Axle
Single Unit Trucks 6 0.9
8
Four or Less Axle
Single Trailer
Trucks 26 3.7
9
Five-Axle Single
Trailer Trucks 305 43.6
10
Six or More Axle
Single Trailer
Trucks 163 23.3
11
Five or Less Axle
Multi-Trailer
Trucks 0 0.0
12
Six-Axle Multi-
Trailer Trucks 0 0.0
13
Seven or More
Axle Multi-Trailer
Trucks 26 3.7
Climate Inputs
In the Pavement M-E software, climate inputs are incorporated into the performance prediction
analysis through the Enhanced Integrated Climatic Model (EICM) which is a product of a
computer program that calculates the effect of changes in moisture within the pavement
Page 9
9
materials over time and depth combined with the effect of freezing and thawing on the pavement
response.
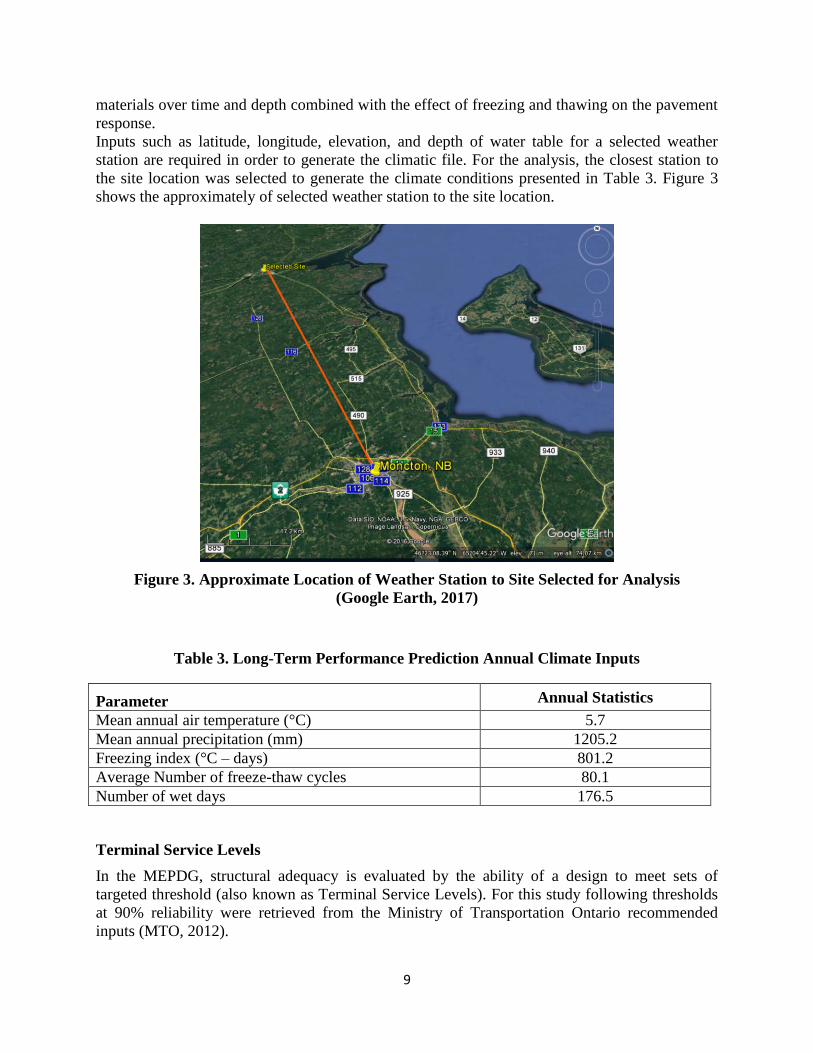
Inputs such as latitude, longitude, elevation, and depth of water table for a selected weather
station are required in order to generate the climatic file. For the analysis, the closest station to
the site location was selected to generate the climate conditions presented in Table 3. Figure 3
shows the approximately of selected weather station to the site location.
Figure 3. Approximate Location of Weather Station to Site Selected for Analysis
(Google Earth, 2017)
Table 3. Long-Term Performance Prediction Annual Climate Inputs
Parameter Annual Statistics
Mean annual air temperature (°C) 5.7
Mean annual precipitation (mm) 1205.2
Freezing index (°C – days) 801.2
Average Number of freeze-thaw cycles 80.1
Number of wet days 176.5
Terminal Service Levels
In the MEPDG, structural adequacy is evaluated by the ability of a design to meet sets of
targeted threshold (also known as Terminal Service Levels). For this study following thresholds
at 90% reliability were retrieved from the Ministry of Transportation Ontario recommended
inputs (MTO, 2012).
Page 10
10
Table 4. Warm Mix Asphalt Long-Term Performance Distress Prediction Target Values
Performance Criteria Targeted at 90%
reliability
Permanent Deformation - Total Pavement (mm) 19.00
AC Bottom-up Fatigue Cracking (%) 25.00
AC Thermal Fracture (m/km) 189.4
AC Top-down Fatigue Cracking (m/km) 378.8
Permanent Deformation – AC only (mm) 6.00
RESULT AND DISCUSSION
Moisture Induced Damage
Indirect Tensile Strength
The AASHTO T283 tests the ratio between the control and conditioned strengths. The results for
the Tensile Strength Ratio TSR are shown in Table 5. It was noticed that WMA mix performed
very well compared to the control HMA mix in a Modified Lottman Test, both had tensile
strength ratio (TSR) values above the minimum requirement. NBDTI specifies that the average
of the conditioned and Freeze-Thaw TSR values is above 80%. The strength of the samples was
examined to see if there is any difference between the samples that the ratio measure may not
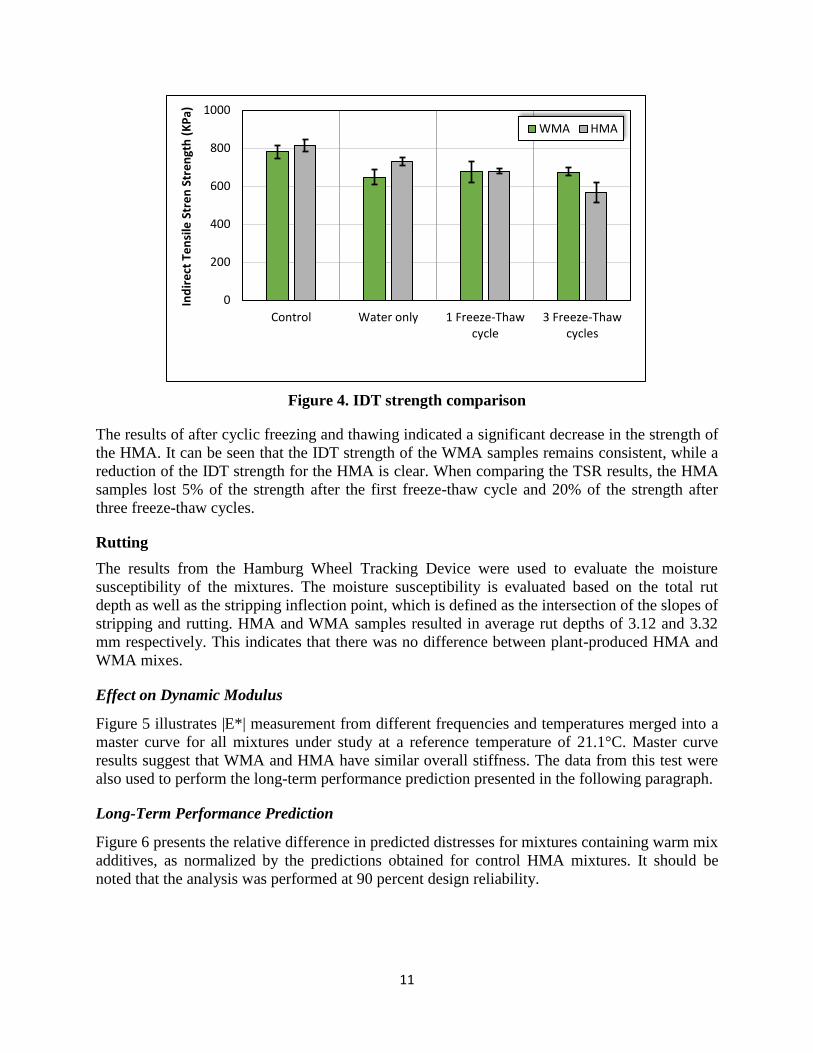
make obvious. A summary of the results can be found in Figure 4.
It was found that that there was no statistical difference between the WMA and HMA IDT
strengths. However, the average IDT strength of the conditioned WMA samples falls below 690
KPa, which Cucalon suggests as a secondary measure of moisture susceptibility for off-site plant
mixed laboratory compacted specimens (Cucalon, et al., 2015).
The indirect tension tests showed that the WMA samples did not appear to be suffering from any
stripping of the asphalt from the aggregate. It is worth noting that of the provinces that do not use
the Modified Lottman Test, the second choice for a moisture susceptibility test is the Hamburg
Wheel Test (Varamini & Tighe, 2015).
Table 5. TSR Results
Parameter Conditioning WMA HMA
TSR (%)
Water only 83.7 88.5
1 Freeze-Thaw
Cycle 86.6 84.2
3 Freeze-Thaw
Cycles 88.2 71.0
Page 11
11
Figure 4. IDT strength comparison
The results of after cyclic freezing and thawing indicated a significant decrease in the strength of
the HMA. It can be seen that the IDT strength of the WMA samples remains consistent, while a
reduction of the IDT strength for the HMA is clear. When comparing the TSR results, the HMA
samples lost 5% of the strength after the first freeze-thaw cycle and 20% of the strength after
three freeze-thaw cycles.
Rutting
The results from the Hamburg Wheel Tracking Device were used to evaluate the moisture
susceptibility of the mixtures. The moisture susceptibility is evaluated based on the total rut
depth as well as the stripping inflection point, which is defined as the intersection of the slopes of
stripping and rutting. HMA and WMA samples resulted in average rut depths of 3.12 and 3.32
mm respectively. This indicates that there was no difference between plant-produced HMA and
WMA mixes.
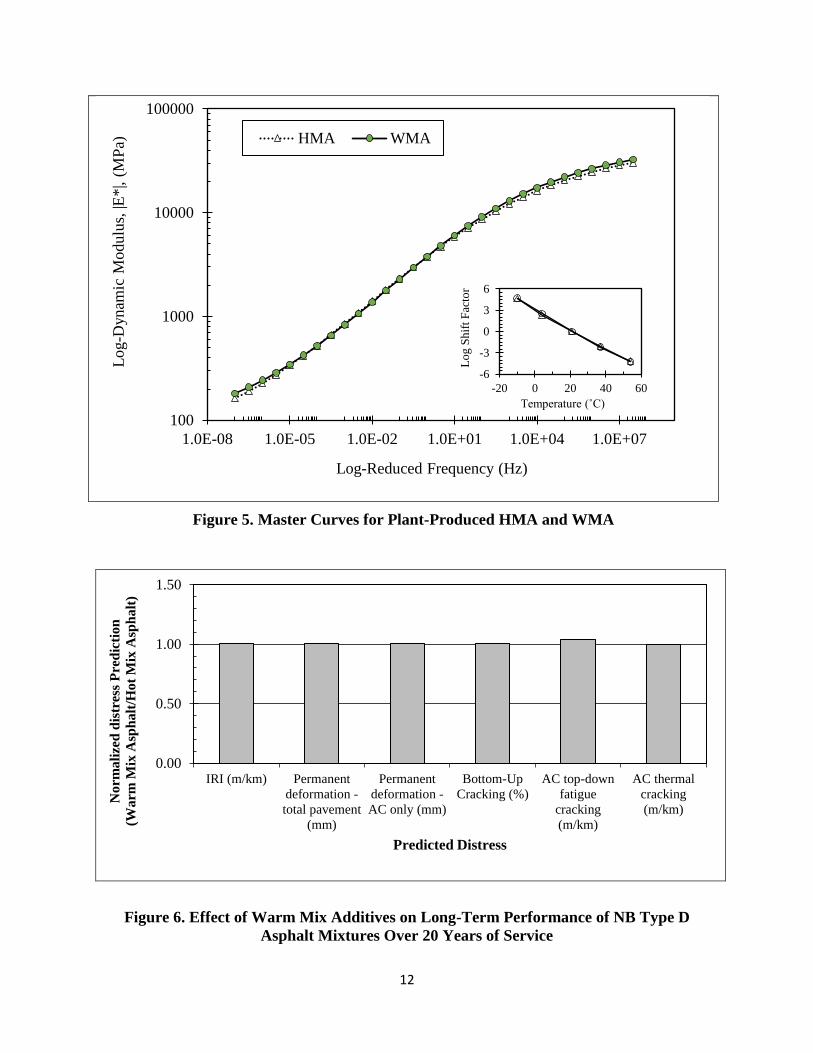
Effect on Dynamic Modulus
Figure 5 illustrates |E*| measurement from different frequencies and temperatures merged into a
master curve for all mixtures under study at a reference temperature of 21.1°C. Master curve
results suggest that WMA and HMA have similar overall stiffness. The data from this test were
also used to perform the long-term performance prediction presented in the following paragraph.
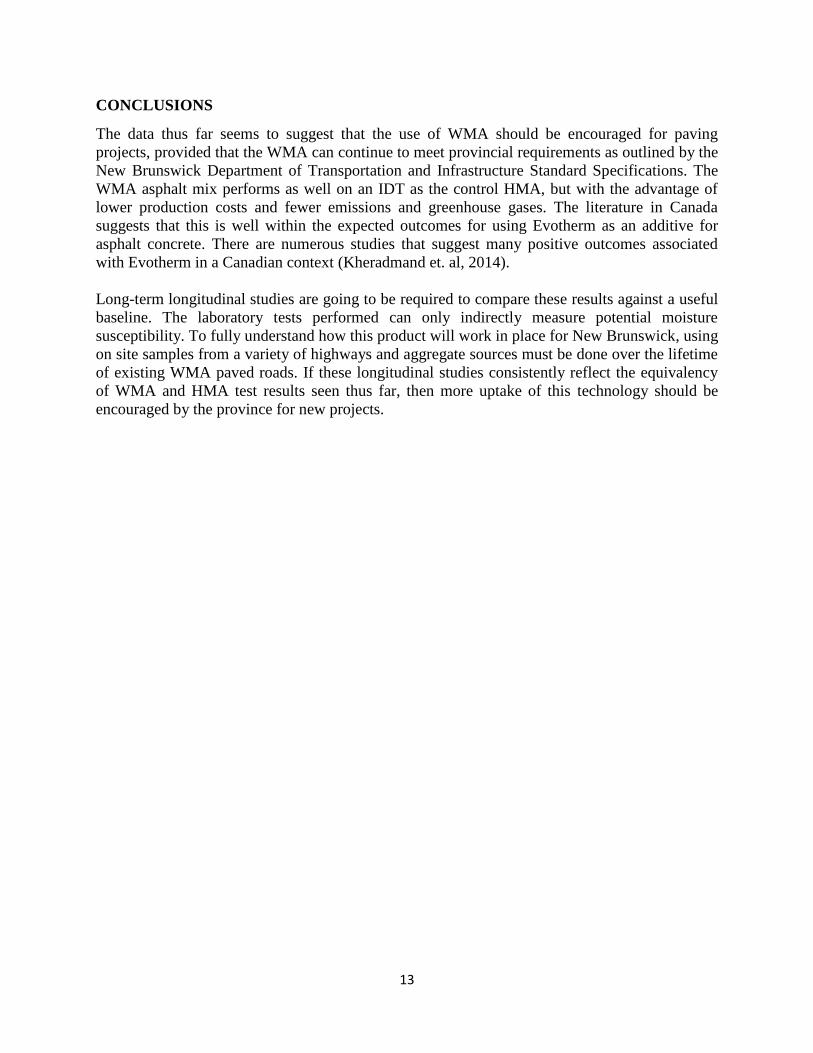
Long-Term Performance Prediction
Figure 6 presents the relative difference in predicted distresses for mixtures containing warm mix
additives, as normalized by the predictions obtained for control HMA mixtures. It should be
noted that the analysis was performed at 90 percent design reliability.
0
200
400
600
800
1000
Control Water only 1 Freeze-Thawcycle
3 Freeze-Thawcycles
Ind
ire
ct T
en
sile
Str
en
Str
en
gth
(K
Pa)
WMA HMA
Page 12
12
Figure 5. Master Curves for Plant-Produced HMA and WMA
Figure 6. Effect of Warm Mix Additives on Long-Term Performance of NB Type D
Asphalt Mixtures Over 20 Years of Service
100
1000
10000
100000
1.0E-08 1.0E-05 1.0E-02 1.0E+01 1.0E+04 1.0E+07
Log-D
ynam
ic M
odulu
s, |E
*|,
(MP
a)
Log-Reduced Frequency (Hz)
HMA WMA
0.00
0.50
1.00
1.50
IRI (m/km) Permanent
deformation -
total pavement
(mm)
Permanent
deformation -
AC only (mm)
Bottom-Up
Cracking (%)
AC top-down
fatigue
cracking
(m/km)
AC thermal
cracking
(m/km)
Norm
ali
zed
dis
tres
s P
red
icti
on
(Warm
Mix
Asp
halt
/Hot
Mix
Asp
halt
)
Predicted Distress
-6
-3
0
3
6
-20 0 20 40 60
Lo
g S
hif
t F
acto
r
Temperature (˚C)
Page 13
13
CONCLUSIONS
The data thus far seems to suggest that the use of WMA should be encouraged for paving
projects, provided that the WMA can continue to meet provincial requirements as outlined by the
New Brunswick Department of Transportation and Infrastructure Standard Specifications. The
WMA asphalt mix performs as well on an IDT as the control HMA, but with the advantage of
lower production costs and fewer emissions and greenhouse gases. The literature in Canada
suggests that this is well within the expected outcomes for using Evotherm as an additive for
asphalt concrete. There are numerous studies that suggest many positive outcomes associated
with Evotherm in a Canadian context (Kheradmand et. al, 2014).
Long-term longitudinal studies are going to be required to compare these results against a useful
baseline. The laboratory tests performed can only indirectly measure potential moisture
susceptibility. To fully understand how this product will work in place for New Brunswick, using
on site samples from a variety of highways and aggregate sources must be done over the lifetime
of existing WMA paved roads. If these longitudinal studies consistently reflect the equivalency
of WMA and HMA test results seen thus far, then more uptake of this technology should be
encouraged by the province for new projects.
Page 14
14
REFERENCES
American Association of State and Highway Transportation Officials (TP 62-07). (2007).
Standard Method of Test for Determining Dynamic Modulus of Hot-Mix Asphalt
Concrete Mixtures. In Standard Specifications for Transportation Materials and Methods
of Sampling and Testing. Washington, DC.
American Association of State and Highway Transportation Officials. (2009). Standard Practice
for Developing Dynamic Modulus Master Curves for Hot Mix Asphalt (HMA), AASHTO
PP 62. Washington, D.C.
American Association of State Highway and Transportation Officials (AASHTO) T 324. (2011).
Standard Method of Test for Hamburg Wheel-Track Testing of Compacted Hot-Mix
Asphalt. In Standard Specifications for Transportation Materials and Methods of
Sampling and Testing. Washington, D.C.
Asphalt Innovations. (2010). Product Data Bulletin. North Charleston: MeadWestvaco
Corporation. Cucalon, L. G., Yin, F., Martin, A. E., Arambula, E., Estakhri, C., & Park, E. S. (2015).
Evaluation of Moisture Susceptibility Minimization Strategies for Warm-Mix Asphalt:
Case Study. Journal of Materials in Civil Engineering, 9.
Emery, J., & Seddik, H. (1997). Moisture Damage of Asphalt Pavements and Antistripping
Additives: Background Document. Ottawa: Transportation Association of Canada.
Esenwa, M., Davidson, J. K., & Kucharek, A. (2011). Evaluation of Warm Mix Asphalt
Behaviour – Stability and Strength. Scarborough: Canadian Technical Asphalt
Association.
Kelln, R., Podborochynski, D., Haichert, R., & Berthelot, C. (2012). A review of sustainable
alternatives for asphalt materials in Saskatchewan. Proceedings, Annual Conference (p.
9). Edmonton: Canadian Society for Civil Engineering.
Kheradmand, B., Muniandy, R., Hua, L. T., Yunus, R., & Solouki, A. (2014). An overview of
the emerging warm mix asphalt technology. International Journal of Pavement
Engineering,, 15.
Kim, Y., Lee, J., Baek, C., Yang, S., Kwon, S., & Suh, Y. (2012). Performance Evaluation of
Warm- and Hot-Mix Asphalt Mixtures Based on Laboratory and Accelerated Pavement
Tests. Advances in Materials Science and Engineering, 9.
Material Engineering Research Office (Pavements & Foundations Section). (2012). Ontario’s
Default Parameters for AASHTOWare Pavement ME Design Interim Report. Ministry of
Transportation Ontario. Retrieved from https://www.raqsb.mto.gov.on.ca
Page 15
15
Pavement Tools Consortium. (2011, April 22). Pavement interative. Retrieved from
http://www.pavementinteractive.org/article/moisture-susceptibility/
Porras, J. J. (2012). Performance evaluation of field-produced warm-mix asphalt mixtures in
Manitoba, Canada. Transportation Research Record, 9.
Rubio, M. C., Martínez, G., Baena, L., & Moreno, F. (2011). Warm mix asphalt: an overview.
Journal of Cleaner Production, 9.
Sargand, S., Nazzal, M., Al-Rawashdeh, A., & Powers, D. (2012). Field Evaluation of Warm-
Mix Asphalt Technologies. Journal of Materials in Civil, 7.
Sebaaly, P., Hajj, E., & Piratheepan, M. (2015). Evaluation of selected warm mix asphalt
technologies. Road Materials and Pavement Design,, 11.
Vaitkus, A., Cygas, D., Laurinavicius, A., Vorobjovas, V., & Perveneckas, Z. (2016). Influence
of warm mix asphalt technology on asphalt physical and mechanical properties.
Construction and Building Materials, 7.
Varamini, S., & Tighe, S. L. (2015). Survey on current practices for evaluating Warm Mix
Asphalt. Conference of the Transportation Association of Canada (TAC), (p. 15).
Charlottetown.