Page 1
�
The�Asphalt�Pavement� Technology�Program�is�an� integrated,�national�effort�to� improve�the�longͲterm� performance�and�cost� effectiveness�of�asphalt� pavements.��Managed�by�the� Federal�Highway�Administration� through�partnerships�with�State� highway�agencies,�Industry�and� academia�the�program’s� primary�goals��are�to�reduce� congestion,�improve�safety,�and�foster�technology�innovation.�� The�program�was�established�to�develop�and�implement� guidelines,�methods,� procedures�and�other�tools�for� use�in�asphalt�pavement� materials�selection,�mixture� design,�testing,�construction� and�quality�control.�
�
�
�
Office�of�Pavement�Technology�
FHWAͲHIFͲ11Ͳ032�
December�2010�
SUPERPAVE�GYRATORY�COMPACTORS�
This�Technical�Brief�provides�an�overview�of�the�gyratory� issues�that�affects�the�performance�of�asphalt�pavements.�
� Background�� The�Superpave�mix�design�procedure�features�the�Superpave�gyratory�compactor�(SGC)�for�compacting�specimens�of�hot�mix�asphalt.��The� primary�operating�parameters�for�the�SGC�include�the�pressure� applied�to�the�specimen�during�compaction;�the�speed�of� gyration/rotation;�the�number�of�gyrations�applied�to�the�specimen;� and�the�angle�of�gyration.��Values�for�these�parameters�were� established�during�the�development�of�the�Superpave�system�under� the�Strategic�Highway�Research�Program.��It�is�correctly�and� commonly�assumed�that�gyratory�compactors�in�which�the�gyration� angle,�speed�of�gyration,�and�applied�pressure�are�properly�calibrated� will�produce�hot�mix�asphalt�specimens�having�similar�volumetric� properties.�
In�recent�years,�however,�this�basic�assumption�of�the�equivalency�of� properly�calibrated�compactors�has�been�called�into�question.�� Reports�of�replicate�specimens,�compacted�on�different�SGC�units,� exhibiting�significantly�varying�volumetric�properties�focused�scrutiny� on�the�angle�of�gyration.��Procedures�for�calibrating/validating�the� gyration�pressure�and�speed�may�be�considered�relatively�generic�and� universal;�however,�procedures�for�calibrating�the�angle�of�gyration� were�unique�to�specific�models�of�gyratory�compactor.��In�addition,� the�angle�of�gyration�was�measured�“externally”�(outside�the� specimen�mold)�and�relative�to�the�frame�of�the�SGC.��It�was� theorized�that�compliance�of�the�SGC�frame�under�load�detrimentally� affected�the�measurement�of�the�gyration�angle�–�thus,�rendering�the� calibration�of�the�SGC�suspect.�
�
�
�
�
�
TechBrief
Page 2
The�Federal�Highway�Administration�(FHWA)�led�an�effort�to�develop�technology�for�a�universal� method�for�measuring�the�angle�of�gyration�on�all�compactors�from�inside�the�specimen�mold.�� Subsequently,��
“internal�angle”�measurement�devices�were�refined�and�marketed�by�private�manufacturers.�� Associated�research�demonstrated�that�the�use�of�the�internal�angle�of�gyration�to�calibrate�SGC�units� could�result�in�replicate�specimens�having�more�consistent�volumetric�properties.�
However,�there�are�numerous�potential�sources�of�variability�related�to�the�production�of�a�laboratoryͲ compacted�hot�mix�asphalt�specimen.��It�is�important�that�practitioners�recognize�and�minimize�all� such�sources�of�variability�–�in�addition�to�the�use�of�internal�angle�of�gyration�to�calibrate�the�SGC.�� The�FHWA�Expert�Task�Group�on�Mixtures�and�Aggregates�(ETG)�developed�this�document�with�two� primary�goals:�(1)�to�help�practitioners�address�all�potential�sources�of�variability�in�producing� compacted�hot�mix�asphalt�specimens;�and�(2)�provide�a�brief�history�of�the�development�of�the� concepts,�practices,�and�equipment�for�measuring�the�internal�angle�of�gyration�and�the�development� of�specifications�for�implementing�the�use�of�the�internal�angle�into�routine�practice.�
Sources�of�Variability�in�Determining�the�Bulk�Specific�Gravity�(Gmb)�of�Hot� Mix�Asphalt�(HMA)� � It�is�important�to�recognize�that�variability�in�the�bulk�specific�gravity�(Gmb)�of�a�compacted�hot�mix� asphalt�(HMA)�specimen�can�stem�from�a�number�of�sources.��Prior�to�adjusting�settings�on�the� Superpave�gyratory�compactor�(SGC),�these�“external”�sources�of�variability�should�be�investigated.��If� problems�are�discovered,�these�issues�should�be�settled�insofar�as�possible.��A�brief�discussion�of�some� potential�sources�of�variability�follows.� �
SGC�Maintenance� � Studies�related�to�the�angle�of�gyration�applied�to�a�hot�mix�asphalt�specimen�have�indicated�that�the� physical�condition�of�a�given�SGC�affects�the�resulting�measured�angle�of�gyration.��At�a�minimum,� recommended�maintenance�items�listed�in�the�User’s�Manual�for�each�SGC�must�be�performed�at�the� recommended�task�frequencies.���� � In�addition�to�“routine”�maintenance�issues,�users�are�cautioned�that�parts�of�SGC�units�subject�to� wear,�i.e.�bearings,�rollers,�etc.,�should�be�periodically�checked�for�condition.��SGC�manufacturers�can� provide�information�related�to�specific�parts�and�indications�of�excessive�wear.��SGC�parts�showing� excessive�wear�should�be�replaced.� �
2�
�
Page 3
SGC�Cleanliness� � The�SGC�must�be�kept�as�clean�as�possible,�including�all�surfaces,�rollers,�plates,�and�molds.��Table�1� reports�the�results�of�a�small�study�to�demonstrate�the�effect�of�an�‘intrusion’�under�the�gyratory� compactor�mold�base�plate.��In�general,�the�data�in�Table�1�suggests�that�an�intrusion�under�the�base� plate�of�0.1�mm�could�decrease�the�effective�internal�angle�of�gyration�by�approximately�0.05�degrees;� given�current�specifications�related�to�the�internal�angle�of�gyration,�such�a�change�is�significant.�
Table�1.��Effect�of�Intrusions�Under�SGC�Base�Plate�on�Internal�Angle�of�Gyration� � �
Mold1�
�
Thickness�of� Intrusion2� Under�Base�
Plate3�
(mm)�
Average� Internal�Angle4�
(deg)�
A� 0.0� 1.145�
A� 0.19� 1.002�
A� 0.45� 0.860�
A� 0.62� 0.850�
B� 0.0� 1.155�
B� 0.18� 1.048�
B� 0.39� 0.915�
B� 0.61� 0.885�
C� 0.0� 1.153�
C� 0.21� 1.043�
C� 0.45� 0.892�
C� 0.61� 0.875�
D� 0.0� 1.150�
D� 0.19� 1.030�
D� 0.37� 0.883�
D� 0.58� 0.875� 1Four�SGC�Molds�were�used�in�the�study;�average�internal� mold�diameters�ranged�from�149.81�mm�to�149.96�mm� 2Intrusions�were�created�by�affixing�successive�1”�x�1”�squares� of�duct�tape�to�the�bottomͲcenter�of�the�baseplate� 3One�SGC�Base�Plate�was�used�in�the�study;�the�average� diameter�of�the�base�plate�was�149.66�mm� 4The�Average�internal�angle�represents�three�replicate� measurements�performed�with�a�RAM�device��
�
� 3�
�
Page 4
Molds� � The�FHWA�Expert�Task�Group�for�Mixtures�and�Aggregates�(ETG)�is�continuing�to�study�the�issue�of� excessive�mold�wear,�with�the�goal�of�recommending�possible�specification�limits�for�SGC�molds.�� Current�mold�diameter�specifications�included�in�AASHTO�T312�lists�the�inside�diameter�specification� as�149.90�to�150.00�mm;�however,�this�measurement�is�made�at�the�top�and�bottom�edges�of�the�mold� –�rather�than�in�the�area�in�which�compaction�occurs.��It�is�unclear�at�what�diameter�greater�than� 150.00�mm�(in�the�area�of�compaction)�mold�wear�becomes�‘excessive’�and�significantly�affects�the� volumetric�properties�of�the�HMA�specimen.��� � There�is�also�a�specification�regarding�the�diameter�of�the�bottom�mold�plate;�however,�the� specification�does�not�address�the�‘gap’�between�the�bottom�mold�plate�and�the�mold�itself�–�in�other� words,�the�difference�between�the�inside�mold�diameter�and�the�bottom�mold�plate.��There�has�been� speculation�that�this�gap,�if�excessive,�could�affect�the�internal�angle�measurement,�and�ultimately,�the� volumetric�properties�of�compacted�HMA�specimens.� � SGC�molds�should�be�checked�for�excessive�wear�by�measuring�the�inside�diameter�in�the�area�of�the� mold�wall�subject�to�compaction,�i.e.�1�to�5�inches�from�the�bottom.��Figure�1�shows�examples�of�inside� diameter�measurements.��AASHTO�T312�lists�the�inside�diameter�specification�as�149.9�to�150.0�mm,� measured�at�the�top�and�bottom�of�the�mold.��� �
6
5
4
3
2
1
0
�
Figure�1.��Example�of�SGC�Mold�Diameter�Measurement� �
Dis
tanc
e fro
m B
otto
m o
f Mol
d (in
)
This�mold�exhibits� wear.
149.80 149.85 149.90 149.95 150.00 150.05 150.10 150.15 150.20
Mold Inside Diameter (mm)
4�
�
Page 5
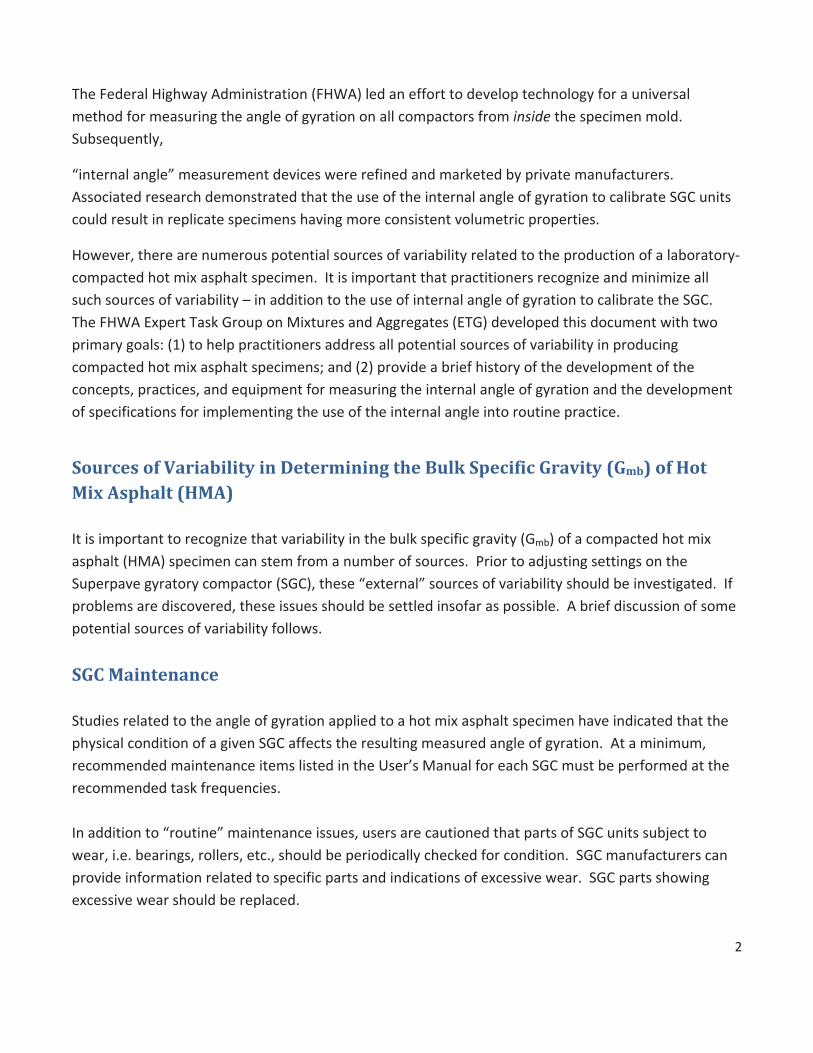
Figure�2�summarizes�data�collected�in�a�study�of�the�effect�of�the�base�plate�/�mold�‘gap’.��In�this�study,� various�combinations�of�mold�and�base�plates�were�used�with�four�models�of�gyratory�compactor.�� Replicate�measurements�of�internal�angle�were�obtained�using�the�Rapid�Angle�Measurement�(RAM)� device.��As�shown�in�Figure�2,�for�mold/plate�‘gaps’�ranging�from�0.24�mm�to�0.62�mm�there�was�no� consistent�effect�of�the�gap�size�on�internal�angle�–�although�the�data�does�suggest�a�potential� decrease�in�internal�angle�with�increasing�gap�size.� � � � �
�
�
�
�
�
�
�
1.10 1.12 1.14 1.16 1.18 1.20 1.22 1.24 1.26 1.28 1.30 1.32 1.34 1.36 1.38 1.40
0 0.2 0.4 0.6 0.8
Internal�Angle�(d
eg)
Difference�in�Base�Plate�and�Cylinder�Diameters�(mm)
T�4141
P125x
PG2
Brov
�
Figure�2.��Effect�of�SGC�Mold�Internal�Diameter�/�Base�Plate�‘Gap’�on�Internal�Angle�
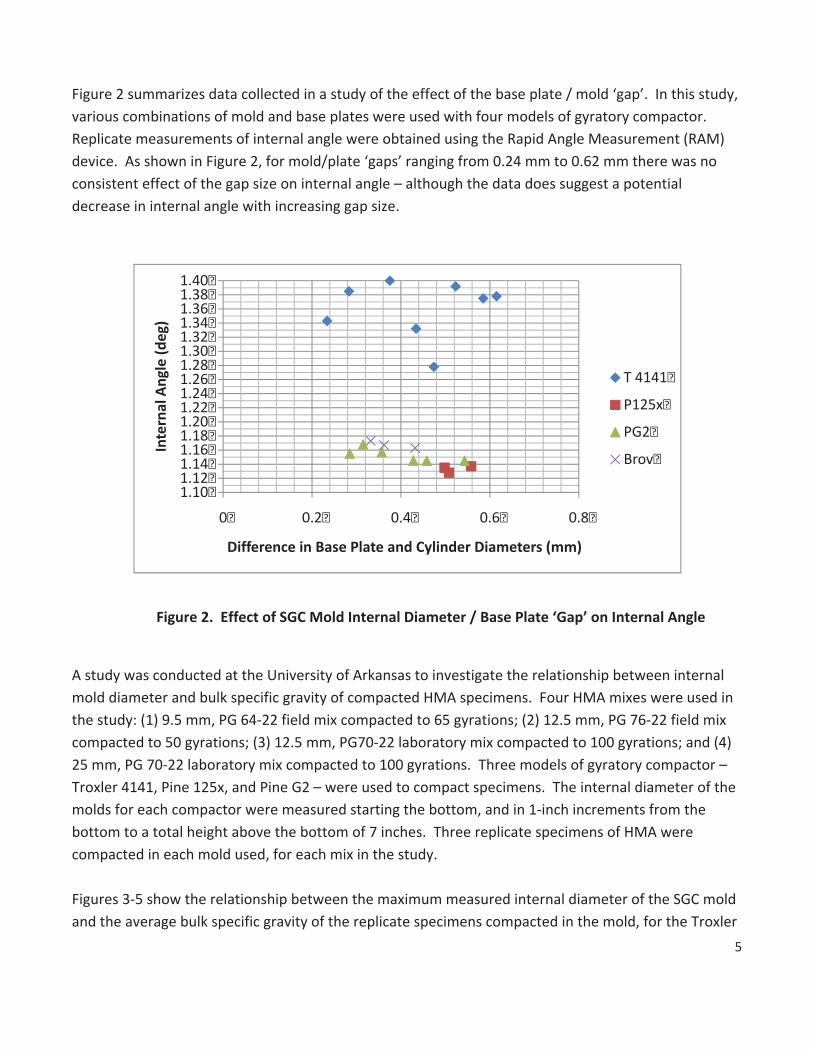
� A�study�was�conducted�at�the�University�of�Arkansas�to�investigate�the�relationship�between�internal� mold�diameter�and�bulk�specific�gravity�of�compacted�HMA�specimens.��Four�HMA�mixes�were�used�in� the�study:�(1)�9.5�mm,�PG�64Ͳ22�field�mix�compacted�to�65�gyrations;�(2)�12.5�mm,�PG�76Ͳ22�field�mix� compacted�to�50�gyrations;�(3)�12.5�mm,�PG70Ͳ22�laboratory�mix�compacted�to�100�gyrations;�and�(4)� 25�mm,�PG�70Ͳ22�laboratory�mix�compacted�to�100�gyrations.��Three�models�of�gyratory�compactor�–� Troxler�4141,�Pine�125x,�and�Pine�G2�–�were�used�to�compact�specimens.��The�internal�diameter�of�the� molds�for�each�compactor�were�measured�starting�the�bottom,�and�in�1Ͳinch�increments�from�the� bottom�to�a�total�height�above�the�bottom�of�7�inches.��Three�replicate�specimens�of�HMA�were� compacted�in�each�mold�used,�for�each�mix�in�the�study.� � Figures�3Ͳ5�show�the�relationship�between�the�maximum�measured�internal�diameter�of�the�SGC�mold� and�the�average�bulk�specific�gravity�of�the�replicate�specimens�compacted�in�the�mold,�for�the�Troxler�
5�
�
Page 6
4141,�Pine�125x,�and�Pine�G2,�respectively.��While�the�data�shown�in�Figures�3Ͳ5�hint�at�a�general�trend� of�increasing�bulk�specific�gravity�with�increasing�internal�mold�diameter,�there�is�not�a�significant� difference�in�bulk�gravity�values.��It�is�reasonable�to�conclude�that,�for�the�diameters�measured�in�this� study,�values�slightly�exceeding�the�maximum�specified�value�of�150.00�mm�do�not�appear�to� significantly�affect�the�bulk�specific�gravity�of�compacted�HMA�specimens.� �
�
2.360
2.380
2.400
2.420
2.440
2.460
2.480
2.500
2.520
2.540
149.90 149.92 149.94 149.96 149.98 150.00 150.02 150.04 150.06 150.08
Bulk�Spe
cific�Gravity,�G
mb
Maximum�SGC�Mold�Internal�Diameter�Measurement�(mm)
Troxler�4141
Figure�3.��Relationship�Between�Specimen�Density�and�SGC�Mold�Diameter,�Troxler�4141� �
� �
� � � � � � � � � � �
2.340 2.360 2.380 2.400 2.420 2.440 2.460 2.480 2.500 2.520 2.540
150.10 150.15 150.20 150.25 150.30 150.35 150.40 150.45 150.50 150.55
Bulk�Spe
cific�Gravity,�G
mb
Maximum�SGC�Mold�Internal�Diameter�Measurement�(mm)
Pine�125x
6�
�
Page 7
� Figure�4.��Relationship�Between�Specimen�Density�and�SGC�Mold�Diameter,�Pine�125x�
2.380
2.400
2.420
2.440
2.460
2.480
2.500
2.520
2.540
149.90 149.95 150.00 150.05 150.10 150.15 150.20 150.25
Bulk�Spe
cific�Gravity,�G
mb
Maximum�SGC�Mold�Internal�Diameter�Measurement�(mm)
Pine�G2
Figure�5.��Relationship�Between�Specimen�Density�and�SGC�Mold�Diameter,�Pine�G2�
�
Sampling�and�Testing� � A�potentially�significant�source�of�variability�in�Gmb�of�compacted�HMA�relates�to�sampling�and�testing.�� In�many�cases,�relatively�coarseͲgraded�HMA,�such�as�Superpave�and�StoneͲMatrix�Asphalt�(SMA)�may� increase�the�potential�for�segregation�during�sampling�and�subsequent�sample�handling/preparation� (i.e.�splitting,�SGC�mold�loading).��Industry�groups�such�as�the�National�Asphalt�Pavement�Association� (NAPA)�and�the�Asphalt�Institute�(AI)�provide�information�relating�to�“best�practices”�associated�with� sampling�and�handling.��Steps�must�be�taken�to�ensure�that�all�persons�involved�in�HMA�sampling�and� preparations�adhere�to�best�practices.� � It�should�be�recognized�that�any�material�test�contains�inherent�variability.��This�is�the�case�with�the� determination�of�bulk�specific�gravity�(Gmb).��AASHTO�and�ASTM�material�test�methods�typically� contain�statements�concerning�the�precision�of�the�method.��One�key�piece�of�information�in�the� “precision�and�bias”�statement�regards�the�D2s�–�the�acceptable�range�of�two�test�results.��For� example,�two�persons�should�be�able�to�determine�the�Gmb�of�the�same�HMA�specimen�so�that�the� difference�in�the�two�test�results�is�less�than�the�stated�D2s�limits�for�the�test�method.��If�this� consistently�proves�not�to�be�the�case,�a�thorough�examination�should�be�conducted�of�all�steps�
7�
�
Page 8
included�in�the�test�method�to�ensure�that�each�person�performing�the�test�is�indeed�performing�the� test�according�to�the�test�method.�
Addressing�all�the�potential�sources�of�variability�previously�discussed�should�be�the�first�step(s)� taken�by�a�laboratory�that�experiences�difficulties�in�obtaining�consistent,�verifiable�Gmb�values�for� compacted�hot�mix�asphalt�specimens.�
�
Determination�of�SGC�Bias� � For�laboratories�that�experience�difficulties�in�producing�consistent�Gmb�values�that�verify�among�two� or�more�gyratory�compactors�(and�have�investigated�and�addressed�those�sources�of�variability�listed� in�the�previous�Section),�a�second�step�in�defining�the�potential�problem�is�to�determine�whether�a�bias� exists�among�compactors.��To�do�this,�one�or�more�comparison�studies�may�be�performed.��A�brief� outline�of�those�steps�necessary�for�a�successful�comparison�study�follows.�It�is�assumed�in�the� discussions�that�all�SGCs�are�properly�calibrated�using�current�manufacturer’s�recommendations� and/or�applicable�specifications.� � Hot�Mix�Asphalt�(HMA)�–�to�compare�two�or�more�compactors,�a�consistent�mixture�is�vital.��Ideally,�a� plantͲproduced�mixture�is�sampled�at�the�hot�mix�plant�and�split�into�specimen�sizes�(generally�4500�to� 5000�g)�“on�site”�–�without�reheating�the�mix.��If�laboratoryͲprepared�HMA�is�used,�extreme�caution� must�be�used�to�ensure�that�each�separate�batch�is�prepared�–�aggregate�blending,�mixing,� aging/heating�–�as�consistently�as�possible.� � Number�of�Specimens/Mixes�–�comparison�studies�related�to�gyratory�compactors�may�be�performed� for�a�particular�HMA�mixture,�or�for�a�variety�of�mixtures.��A�higher�number�of�mixtures�included�in�a� comparison�study�provides�a�more�complete�picture�of�the�relationship�between�two�or�more� compactors.��In�addition,�mixture�variety�–�various�nominal�maximum�aggregate�sizes,�number�of� gyrations,�and�binder�grade�–�adds�to�the�completeness�of�the�comparison.��It�is�noted�that�AASHTO�PP� 35�(the�original�specification�used�to�validate�a�gyratory�compactor)�recommends�a�minimum�of�four� mixtures�for�the�SGC�validation�process.��A�minimum�of�six�(6)�HMA�specimens�should�be�compacted�in� each�SGC�for�each�mixture�used.� � Compaction�and�Testing�–�it�is�apparent�that�the�number�of�specimens�involved�in�a�comparison�study� ranges�from�a�minimum�of�12�to�a�potentially�very�large�value.��Great�care�must�be�taken�to�ensure� that�each�HMA�specimen�is�treated�as�“equally”�as�possible.��Some�issues�related�to�this�consideration� follow.� �
8�
�
Page 9
Randomness:��specimens�should�be�selected�for�compaction�and�testing�using�a�“blind”�random� process.��That�is,�each�individual�specimen�is�chosen�from�the�“pool”�of�specimens�using�a�random� process�and�assigned�to�a�particular�compactor.��It�is�also�recommended�that�compaction�and� testing�be�performed�randomly�–�that�is,�avoid�compacting�all�of�the�specimens�for�a�particular� compactor�at�one�time,�before�moving�to�the�next�compactor.��This�recommendation�holds�for�the� testing�sequence�–�all�of�the�specimens�produced�by�one�compactor�should�not�be�tested�as�a� group�prior�to�the�specimens�from�a�subsequent�compactor.� � Operator:��insofar�as�possible,�the�same�operator�should�perform�all�compaction�and�testing� activities.��This�is�particularly�important�for�testing,�to�avoid�or�limit�inherent�operatorͲrelated� variability�in�test�results.� � Data�Analysis:��two�numbers�related�to�Gmb�test�results�are�used�to�compare�compactors.��Brief� comments�related�to�the�comparison�follow.� � a. Mean:��the�mean�Gmb�of�specimens�compacted�on�subject�SGC�units�is�the�“bottom�line”�of�the�
comparison�effort.��Two�analyses�should�be�performed:�� � (1)�statistical�comparison,�in�which�mean�values�are�compared�using�statistical�tests�such�as�the� Student’s�tͲtest�or�an�analysis�of�variance,�or�FͲtest.��For�comparisons�of�mean�values,�the�“t”� test�is�typically�used.��These�analysis�tools�will�indicate�whether�a�statistical�difference�exists� between�the�data�sets.�� � (2)�practical�comparison,�in�which�the�mean�values�are�examined�to�estimate�the�practical� effect�a�difference�in�mean�values�will�have�on�determining�mixture�properties�such�as�air�voids,� VMA,�etc.��In�some�cases,�test�results�displaying�a�statistically�significant�difference�may�be� judged�to�be�“close�enough”�to�avoid�having�a�practical�effect�on�mixture�properties.� �
b. Standard�Deviation:��the�standard�deviation�of�Gmb�may�be�used�to�judge�the�variability�of�HMA� specimen�density�exhibited�by�a�compactor.��However,�persons�conducting�comparison�studies� are�strongly�cautioned�to�use�standard�deviation�results�with�care�–�the�standard�deviation�of� test�results�contains�the�variability�of�the�Gmb�test�method�itself.��An�Analysis�of�Variance� (ANOVA)�may�be�used�to�compare�standard�deviation�values.� �
Based�on�the�comparison�of�mean�Gmb�values,�a�quantifiable�bias�among�two�or�more�SGC�units�may�be� identified.��That�bias�may�be�taken�into�account�in�future�mixture�verification�activities,�or�further� investigations�into�reducing�or�eliminating�the�bias�may�be�pursued.� �
9�
�
Page 10
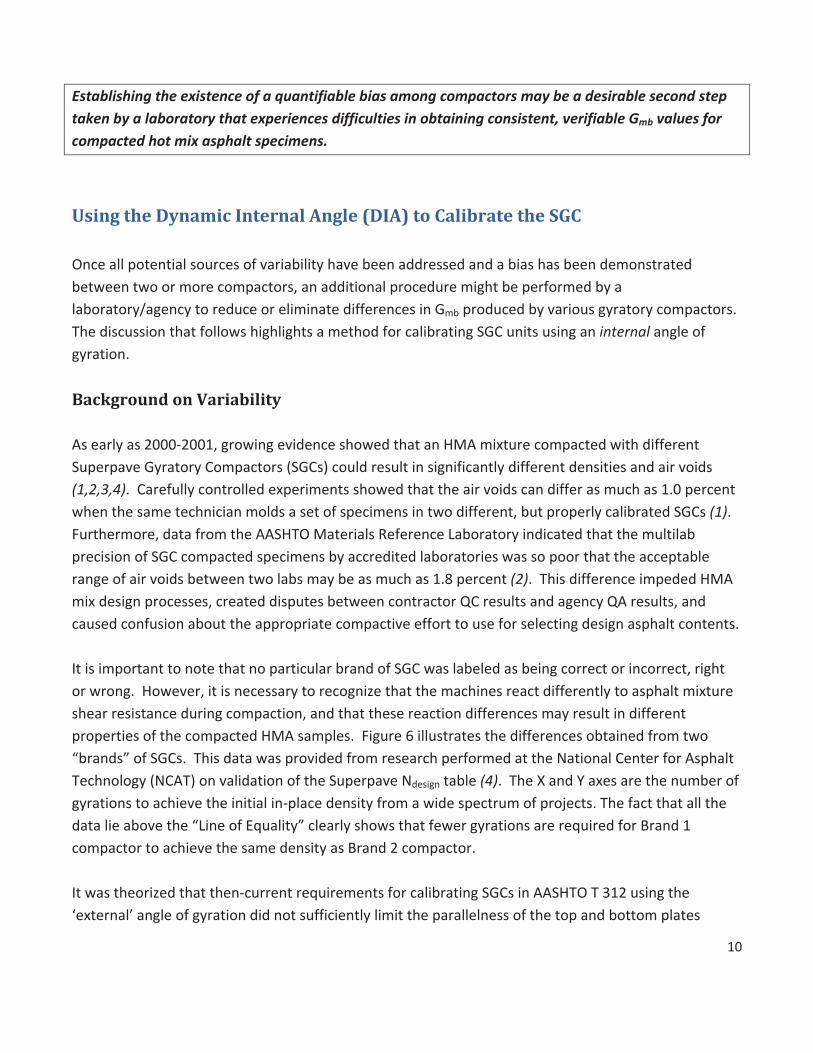
Establishing�the�existence�of�a�quantifiable�bias�among�compactors�may�be�a�desirable�second�step� taken�by�a�laboratory�that�experiences�difficulties�in�obtaining�consistent,�verifiable�Gmb�values�for� compacted�hot�mix�asphalt�specimens.�
�
Using�the�Dynamic�Internal�Angle�(DIA)�to�Calibrate�the�SGC� � Once�all�potential�sources�of�variability�have�been�addressed�and�a�bias�has�been�demonstrated� between�two�or�more�compactors,�an�additional�procedure�might�be�performed�by�a� laboratory/agency�to�reduce�or�eliminate�differences�in�Gmb�produced�by�various�gyratory�compactors.�� The�discussion�that�follows�highlights�a�method�for�calibrating�SGC�units�using�an�internal�angle�of� gyration.� �
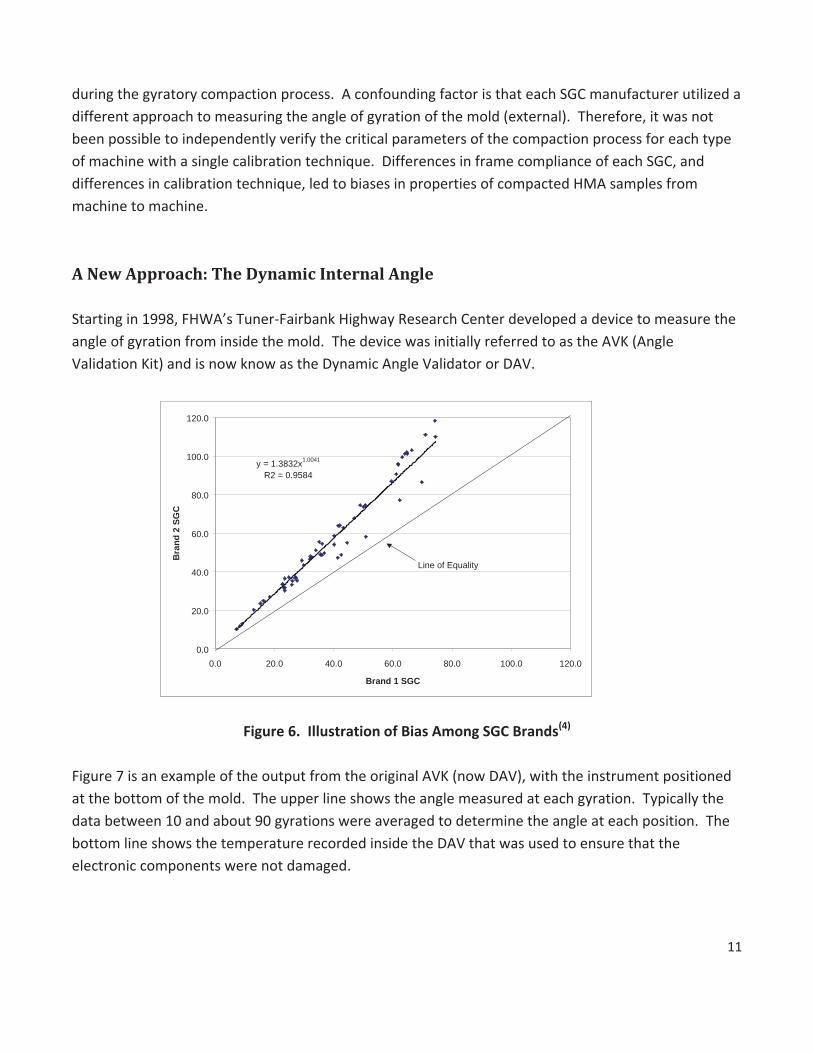
Background�on�Variability� � As�early�as�2000Ͳ2001,�growing�evidence�showed�that�an�HMA�mixture�compacted�with�different� Superpave�Gyratory�Compactors�(SGCs)�could�result�in�significantly�different�densities�and�air�voids� (1,2,3,4).��Carefully�controlled�experiments�showed�that�the�air�voids�can�differ�as�much�as�1.0�percent� when�the�same�technician�molds�a�set�of�specimens�in�two�different,�but�properly�calibrated�SGCs�(1).�� Furthermore,�data�from�the�AASHTO�Materials�Reference�Laboratory�indicated�that�the�multilab� precision�of�SGC�compacted�specimens�by�accredited�laboratories�was�so�poor�that�the�acceptable� range�of�air�voids�between�two�labs�may�be�as�much�as�1.8�percent�(2).��This�difference�impeded�HMA� mix�design�processes,�created�disputes�between�contractor�QC�results�and�agency�QA�results,�and� caused�confusion�about�the�appropriate�compactive�effort�to�use�for�selecting�design�asphalt�contents.� � It�is�important�to�note�that�no�particular�brand�of�SGC�was�labeled�as�being�correct�or�incorrect,�right� or�wrong.��However,�it�is�necessary�to�recognize�that�the�machines�react�differently�to�asphalt�mixture� shear�resistance�during�compaction,�and�that�these�reaction�differences�may�result�in�different� properties�of�the�compacted�HMA�samples.��Figure�6�illustrates�the�differences�obtained�from�two� “brands”�of�SGCs.��This�data�was�provided�from�research�performed�at�the�National�Center�for�Asphalt� Technology�(NCAT)�on�validation�of�the�Superpave�Ndesign�table�(4).��The�X�and�Y�axes�are�the�number�of� gyrations�to�achieve�the�initial�inͲplace�density�from�a�wide�spectrum�of�projects.�The�fact�that�all�the� data�lie�above�the�“Line�of�Equality”�clearly�shows�that�fewer�gyrations�are�required�for�Brand�1� compactor�to�achieve�the�same�density�as�Brand�2�compactor.� � It�was�theorized�that�thenͲcurrent�requirements�for�calibrating�SGCs�in�AASHTO�T�312�using�the� ‘external’�angle�of�gyration�did�not�sufficiently�limit�the�parallelness�of�the�top�and�bottom�plates�
10�
�
Page 11
Bra
nd 2
SG
C
120.0
100.0
80.0
60.0
40.0
20.0
0.0
y = 1.3832x1.0041
R2 = 0.9584
Line of Equality
0.0 20.0 40.0 60.0 80.0 100.0 120.0
Brand 1 SGC
�
during�the�gyratory�compaction�process.��A�confounding�factor�is�that�each�SGC�manufacturer�utilized�a� different�approach�to�measuring�the�angle�of�gyration�of�the�mold�(external).��Therefore,�it�was�not� been�possible�to�independently�verify�the�critical�parameters�of�the�compaction�process�for�each�type� of�machine�with�a�single�calibration�technique.��Differences�in�frame�compliance�of�each�SGC,�and� differences�in�calibration�technique,�led�to�biases�in�properties�of�compacted�HMA�samples�from� machine�to�machine.�� � �
A�New�Approach:�The�Dynamic�Internal�Angle� � Starting�in�1998,�FHWA’s�TunerͲFairbank�Highway�Research�Center�developed�a�device�to�measure�the� angle�of�gyration�from�inside�the�mold.��The�device�was�initially�referred�to�as�the�AVK�(Angle� Validation�Kit)�and�is�now�know�as�the�Dynamic�Angle�Validator�or�DAV.��� �
Figure�6.��Illustration�of�Bias�Among�SGC�Brands(4)� � Figure�7�is�an�example�of�the�output�from�the�original�AVK�(now�DAV),�with�the�instrument�positioned� at�the�bottom�of�the�mold.��The�upper�line�shows�the�angle�measured�at�each�gyration.��Typically�the� data�between�10�and�about�90�gyrations�were�averaged�to�determine�the�angle�at�each�position.��The� bottom�line�shows�the�temperature�recorded�inside�the�DAV�that�was�used�to�ensure�that�the� electronic�components�were�not�damaged.�� �
11�
�
Page 12
FHWA�used�the�DAV�to�determine�the�effective�internal�angle�of�the�original�“first�article”�SGCs�made� by�Pine�Instrument�Co.�and�Troxler�Electronics�Labs�(5).��These�machines�have�served�as�the� “standards”�to�which�other�makes�and�models�have�been�evaluated.��Their�measurements�showed�that� the�original�Pine�SGC�had�an�internal�angle�of�1.18°�when�set�to�an�external�angle�of�1.25°�as�required� by�AASHTO�T�312.��Likewise,�the�original�Troxler�SGC�had�an�internal�angle�of�1.14°�when�set�up�to�an� external�angle�of�1.25°.��The�target�for�the�effective�internal�angle�was�thus�set�as�1.16°,�the�average�of� those�two�machines.� �
1.00 1.02 1.04 1.06 1.08 1.10 1.12 1.14 1.16 1.18 1.20 1.22 1.24 1.26 1.28 1.30 1.32 1.34 1.36 1.38 1.40
0 10 20 30 40 50 60 70 80 90 100
Angle Count
Ang
le (d
eg.)
20
30
40
50
60
70
Tem
p (C
)
�
Figure�7.��Example�Output�from�Angle�Validation�Kit�(AVK)� � FHWA�initially�established�a�tolerance�of�the�effective�internal�angle�at�±�0.02°.�This�range�was� calculated�to�limit�the�effect�of�the�angle�on�selecting�asphalt�content�within�0.1�percent�(5).��� Tolerance�for�the�effective�internal�angle�was�consistent�with�the�angle�standard�based�on�external� mold�measurements,�was�shown�to�be�an�appropriate�range�in�the�1996�SGC�ruggedness�study�(6).� �
Early�Experimental�Results�Using�Internal�Angle�of�Gyration� � Proof�was�needed�that�changing�to�an�effective�internal�angle�calibration�procedure�would�remove�or� significantly�reduce�the�bias�between�results�from�different�SGCs.��Eight�laboratories�participated�in�an� experiment�to�assess�the�effectiveness�of�proposed�procedure.��This�volunteer�cooperative�effort� included�most�of�the�SGC�models�used�throughout�the�USA�and�a�wide�range�of�mixture�types.��Table�2� presents�the�general�scope�of�the�cooperative�research.�
12�
�
Page 13
Table�2.��Research�Scope�of�Initial�Internal�Angle�Cooperative�Study�
Laboratory Mix Sizes Superpave Gyratory Compactors Evaluated
Asphalt Institute 12.5mm, 25.0mm Pine AFGC125X, Trolxer 4140
APAC, Inc. 9.5mm Interlaken, Pine AFGC125X, Pine AFG1, Troxler 4140, Troxler 4141
NCAT 4.75mm Pine AFGC125X, Troxler 4140, Troxler 4141
FHWA 9.5 mm, 12.5 mm, 19.0 mm Troxler 4140, TestQuip Brovold
Florida DOT 12.5mm Pine AFGC125X, Trolxer 4140
Pine Instrument Co. 9.5mm, 12.5mm, 19.0mm, 25.0mm Pine AFGC125X, Pine AFG1, Pine AFGB
Troxler Electronic Labs 9.5mm, 19.0mm Troxler 4140, Troxler 4141
University of Arkansas 12.5mm Pine AFGC125X, Trolxer 4140
� The�primary�objective�of�this�research�effort�was�to�calibrate�SGCs�to�an�effective�internal�angle�of� 1.16±�0.02°�with�the�DAV,�and�then�make�comparisons�of�specimens�compacted�with�the�different� SGCs.��Comparisons�were�made�on�the�basis�of�air�void�contents.��An�example�of�a�plot�used�to�make� comparisons�among�the�results�from�different�SGCs�is�shown�in�Figure�8.��� �
Calibrated to 1.25 degrees External
Calibrated to 1.16 degrees Internal
4.0
4.0
4.53.5
3.5 4.5
Air Voids
Air Voids
Pine G1
Pine 125X
Troxler 4140
Troxler 4141
�
Figure�8.��Example�Results�from�Initial�Internal�Angle�Cooperative�Study�
13�
�
Page 14
� The�results�from�the�cooperative�study�generally�indicated�that�the�DAV�calibration�procedure� removed�some�of�the�bias�between�the�SGCs.��In�particular,�comparisons�of�data�from�Pine�and�Troxler� compactors�were�improved�20�to�100�percent.��The�average�reduction�in�the�bias�between�these�two� manufacturers�was�about�50�percent.��As�expected,�results�from�models�of�the�same�manufacturer� (Troxler�to�Troxler,�Pine�to�Pine)�continued�to�match�well�when�using�the�DAV�procedure.� �
Initial�Implementation�of�the�Dynamic�Internal�Angle�Calibration�Procedure� � The�initial�procedure�for�using�the�Dynamic�Angle�Validator�(DAV)�was�developed�as�AASHTO�PP�48.�� This�procedure�required�the�DAV�to�be�inserted�into�a�compaction�mold�with�hot�mix�asphalt,�to� provide�a�measure�of�the�dynamic�internal�angle�while�the�compactor�was�‘under�load’.��In�addition,� the�procedure�required�internal�angle�measurements�to�be�conducted�with�the�DAV�unit�“under”�the� mix�(for�the�“bottom”�internal�angle)�and�with�the�DAV�unit�“above”�the�mix�(for�the�“top”�internal� angle).��Procedures�for�calibrating�SGCs�via�the�internal�angle�of�gyration�using�hot�mix�asphalt� presented�a�number�of�potentially�significant�issues.��The�discussion�that�follows�here�was�adapted� from�information�provided�by�the�DAV�Task�Group�sponsored�by�the�Mixtures�and�Aggregates�ETG�and� ASTM�subcommittee�D04.25.� �
Time�Required�for�Angle�Determination�� Measurements�of�the�internal�angle�were�required�at�multiple�positions�in�the�molds.��Replicate� measurements�at�each�position�were�also�necessary�to�assure�greater�accuracy�of�the�data.��The�overall� time�to�complete�the�measurements�and�analysis�for�an�engineer�or�lab�technician�experienced�with� the�procedure�was�typically�four�to�eight�hours.��Notably,�a�secondͲgeneration�DAV�device�(the�“DAV� 2”)�was�introduced�in�the�summer�of�2004.��The�time�required�for�SGC�calibration�using�hot�mix�asphalt� was�subsequently�reduced;�however,�a�full�calibration�continued�to�require�a�number�of�hours�to� complete.�
�
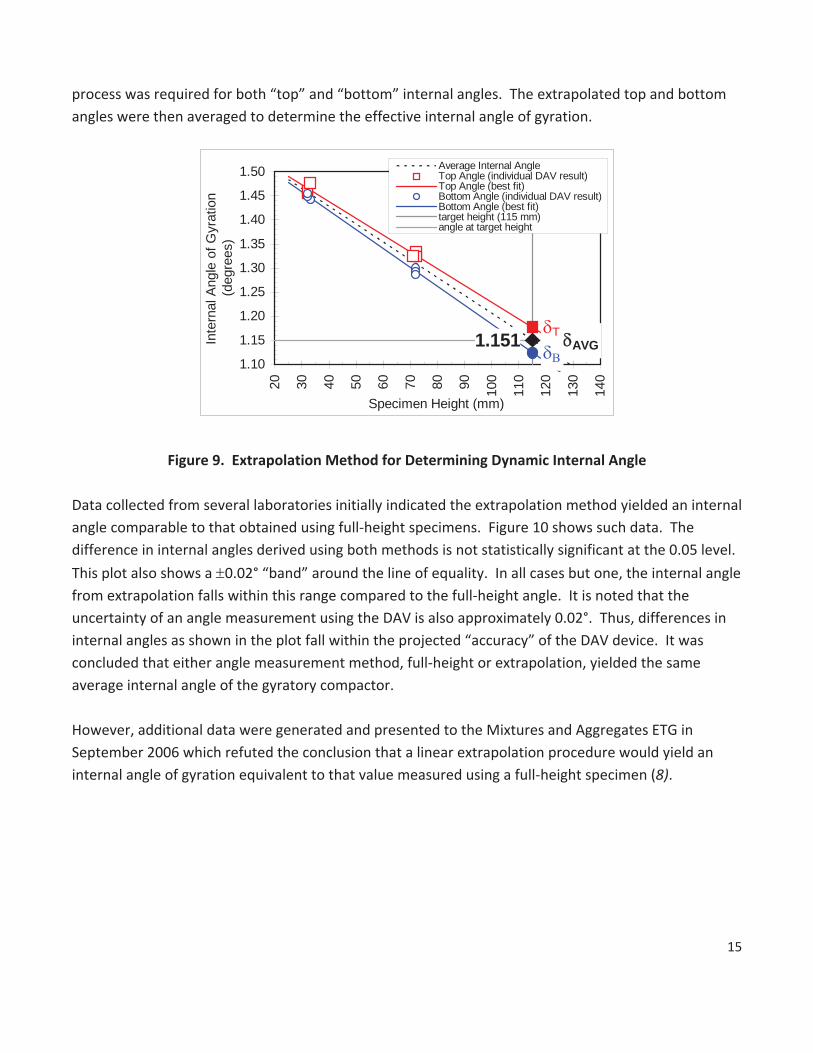
Extrapolation�and�FullǦHeight�Methods� � Some�Superpave�gyratory�compactor�molds�are�not�tall�enough�to�accommodate�the�DAV�and�the� volume�of�loose�mixture�for�a�standard�115�mm�HMA�specimen.��To�solve�this�problem,�a�method�was� developed�in�which�the�internal�angle�measurements�were�made�using�specimens�at�two�smaller� heights.��The�data�from�the�internal�measurements�at�the�two�smaller�heights�were�used�to� extrapolate�to�the�internal�angle�for�a�fullͲsized�specimen.��Figure�9�illustrates�the�concept.�� Independent�measurements�made�on�replicate�specimens�compacted�to�heights�of�approximately�30� mm�and�70�mm�are�used�to�linearly�extrapolate�to�the�angle�for�a�full�size�(115�mm)�specimen.��This�
14�
�
Page 15
process�was�required�for�both�“top”�and�“bottom”�internal�angles.��The�extrapolated�top�and�bottom� angles�were�then�averaged�to�determine�the�effective�internal�angle�of�gyration.� �
�
�
�
�
�
�
�
GAVG GT
G% 1.151
1.10
1.15
1.20
1.25
1.30
1.35
1.40
1.45
1.50
20 30 40 50 60 70 80 90 100
110
120
130
140
Specimen Height (mm)
Inte
rnal
Ang
le o
f Gyr
atio
n(d
egre
es)
Average Internal AngleTop Angle (individual DAV result)Top Angle (best fit)Bottom Angle (individual DAV result)Bottom Angle (best fit)target height (115 mm)angle at target height
�
Figure�9.��Extrapolation�Method�for�Determining�Dynamic�Internal�Angle� � Data�collected�from�several�laboratories�initially�indicated�the�extrapolation�method�yielded�an�internal� angle�comparable�to�that�obtained�using�fullͲheight�specimens.��Figure�10�shows�such�data.��The� difference�in�internal�angles�derived�using�both�methods�is�not�statistically�significant�at�the�0.05�level.��
This�plot�also�shows�a�r0.02°�“band”�around�the�line�of�equality.��In�all�cases�but�one,�the�internal�angle� from�extrapolation�falls�within�this�range�compared�to�the�fullͲheight�angle.��It�is�noted�that�the� uncertainty�of�an�angle�measurement�using�the�DAV�is�also�approximately�0.02°.��Thus,�differences�in� internal�angles�as�shown�in�the�plot�fall�within�the�projected�“accuracy”�of�the�DAV�device.��It�was� concluded�that�either�angle�measurement�method,�fullͲheight�or�extrapolation,�yielded�the�same� average�internal�angle�of�the�gyratory�compactor.� � However,�additional�data�were�generated�and�presented�to�the�Mixtures�and�Aggregates�ETG�in� September�2006�which�refuted�the�conclusion�that�a�linear�extrapolation�procedure�would�yield�an� internal�angle�of�gyration�equivalent�to�that�value�measured�using�a�fullͲheight�specimen�(8).� � � � � � �
15�
�
Page 16
Inte
rnal
Ang
le -
Extr
apol
ated
(deg
)
� 1.28
� 1.26
� 1.24
1.22� 1.20
� 1.18 � 1.16 � 1.14 �
1.12 �
1.10
"Best Fit" line: y = 0.9554 x + 0.0493
r2 = 0.916 AFG1A
AFGC 125X
Interlaken
Test Quip
1:1 Line
"+0.02" line
"-0.02" line
� 1.10 1.12 1.14 1.16 1.18 1.20 1.22 1.24 1.26 1.28 � Internal Angle - Full Height Specimen (deg) �
� Figure�10.��Comparison�of�Internal�Angle�Values�Using�FullͲHeight��
Specimens�and�the�Extrapolation�Procedure� �
HMA�Mix�for�SGC�Calibration� � Research�indicated�that�the�stiffness�of�the�mixture�used�during�the�internal�angle�measurements�had� an�effect�on�the�resulting�angle.��In�general,�stiffer�mixtures�develop�more�resistance�to�compaction� and�cause�more�strain�within�the�frame�of�the�SGC,�which�may�result�in�a�lower�effective�internal�angle.�� Therefore,�calibrating�two�or�more�SGC�units�using�a�particular�HMA�mixture�will�not�necessarily� ensure�that�those�units�will�produce�specimens�having�similar�Gmb�values�for�all�HMA�mixtures.� �
MEASUREMENT�OF�THE�DYNAMIC�INTERNAL�ANGLE�USING�SIMULATED� LOADING� � A�number�of�advancements�concerning�the�measurement�of�effective�internal�angle�occurred�from� 2003Ͳ2006.��The�original�internal�angle�device�and�procedure�(the�AVK,�later�DAV)�was�formalized�with� the�approval�of�AASHTO�PP�48,�and�was�included�as�an�option�in�AASHTO�T312Ͳ03,�the�specification�for� gyratory�compaction.��However,�a�number�of�significant�issues�were�identified�during�the� implementation�of�the�original�procedure,�as�detailed�earlier.��In�response�to�concerns�regarding�the� use�of�hot�mix�asphalt�for�determining�the�dynamic�internal�angle,�two�devices�have�been�developed� that�will�induce�a�load�in�a�Superpave�gyratory�compactor�similar�to�that�induced�by�HMA�during� compaction.��� �
16�
�
Page 17
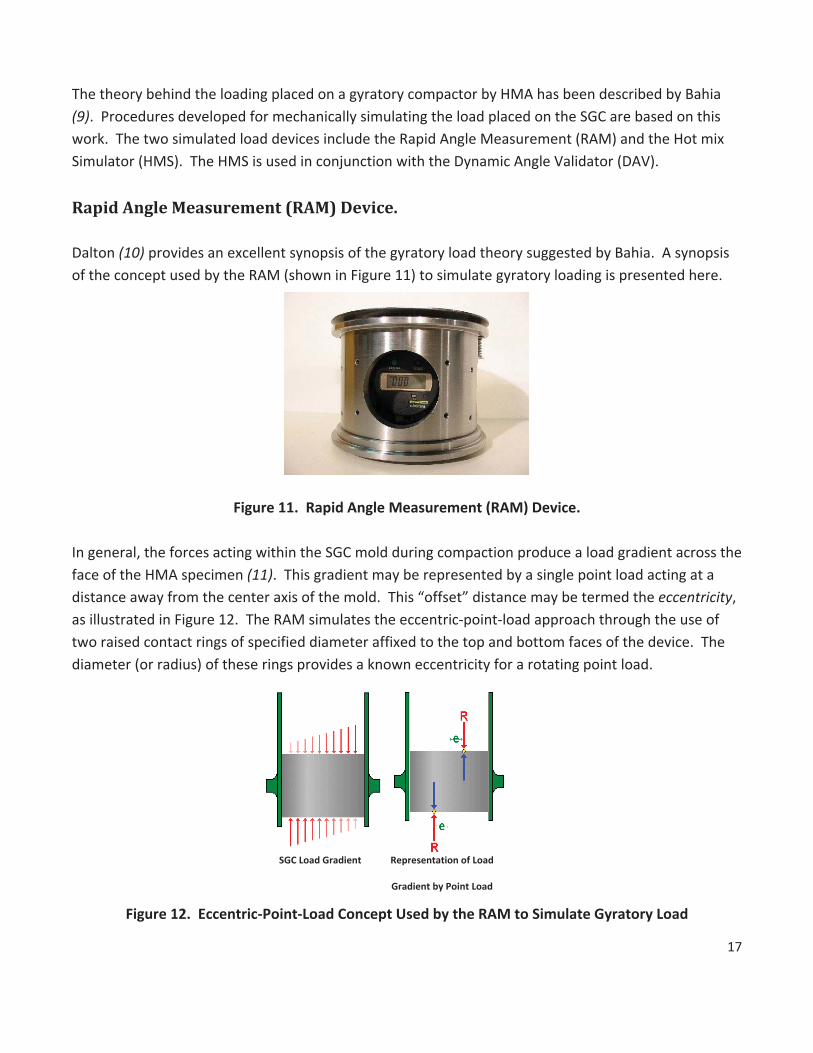
The�theory�behind�the�loading�placed�on�a�gyratory�compactor�by�HMA�has�been�described�by�Bahia� (9).��Procedures�developed�for�mechanically�simulating�the�load�placed�on�the�SGC�are�based�on�this� work.��The�two�simulated�load�devices�include�the�Rapid�Angle�Measurement�(RAM)�and�the�Hot�mix� Simulator�(HMS).��The�HMS�is�used�in�conjunction�with�the�Dynamic�Angle�Validator�(DAV).�
� Rapid�Angle�Measurement�(RAM)�Device.� � Dalton�(10)�provides�an�excellent�synopsis�of�the�gyratory�load�theory�suggested�by�Bahia.��A�synopsis� of�the�concept�used�by�the�RAM�(shown�in�Figure�11)�to�simulate�gyratory�loading�is�presented�here.� �
�
�
�
� � �
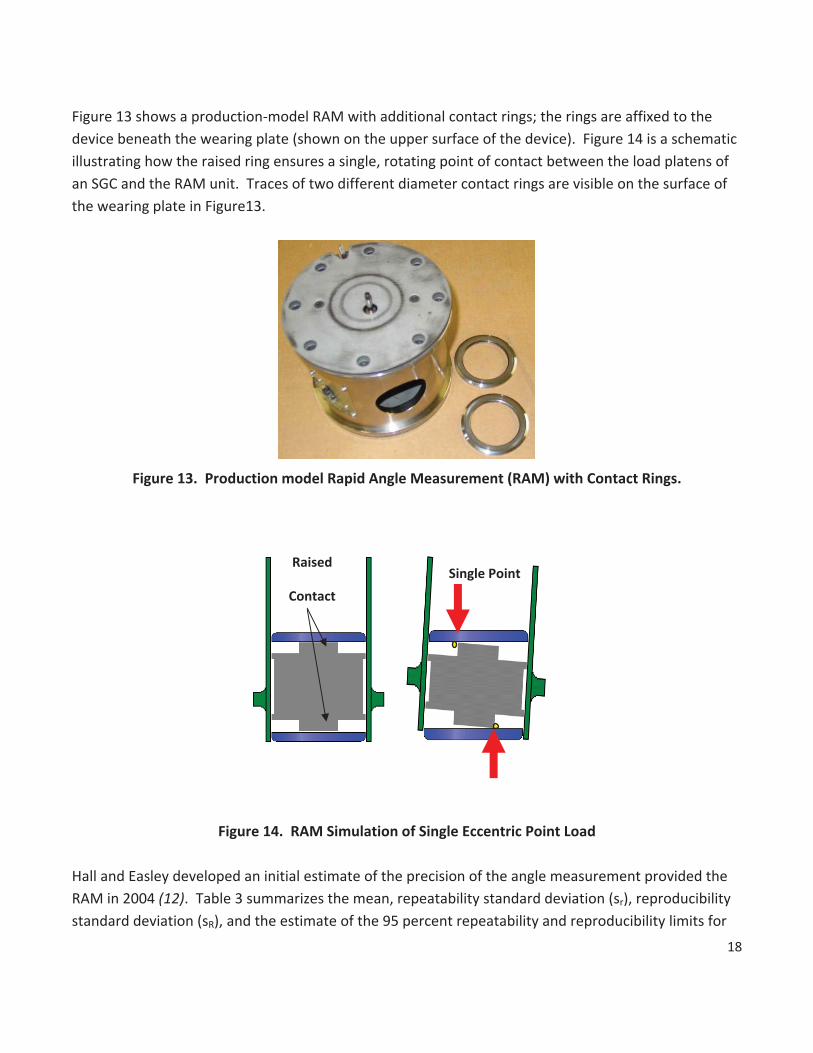
Figure�11.��Rapid�Angle�Measurement�(RAM)�Device.� � In�general,�the�forces�acting�within�the�SGC�mold�during�compaction�produce�a�load�gradient�across�the� face�of�the�HMA�specimen�(11).��This�gradient�may�be�represented�by�a�single�point�load�acting�at�a� distance�away�from�the�center�axis�of�the�mold.��This�“offset”�distance�may�be�termed�the�eccentricity,� as�illustrated�in�Figure�12.��The�RAM�simulates�the�eccentricͲpointͲload�approach�through�the�use�of� two�raised�contact�rings�of�specified�diameter�affixed�to�the�top�and�bottom�faces�of�the�device.��The� diameter�(or�radius)�of�these�rings�provides�a�known�eccentricity�for�a�rotating�point�load.� �
�
�
�
� � �
SGC�Load�Gradient Representation�of�Load
Gradient�by�Point�Load�� Figure�12.��EccentricͲPointͲLoad�Concept�Used�by�the�RAM�to�Simulate�Gyratory�Load�
17�
�
Page 18
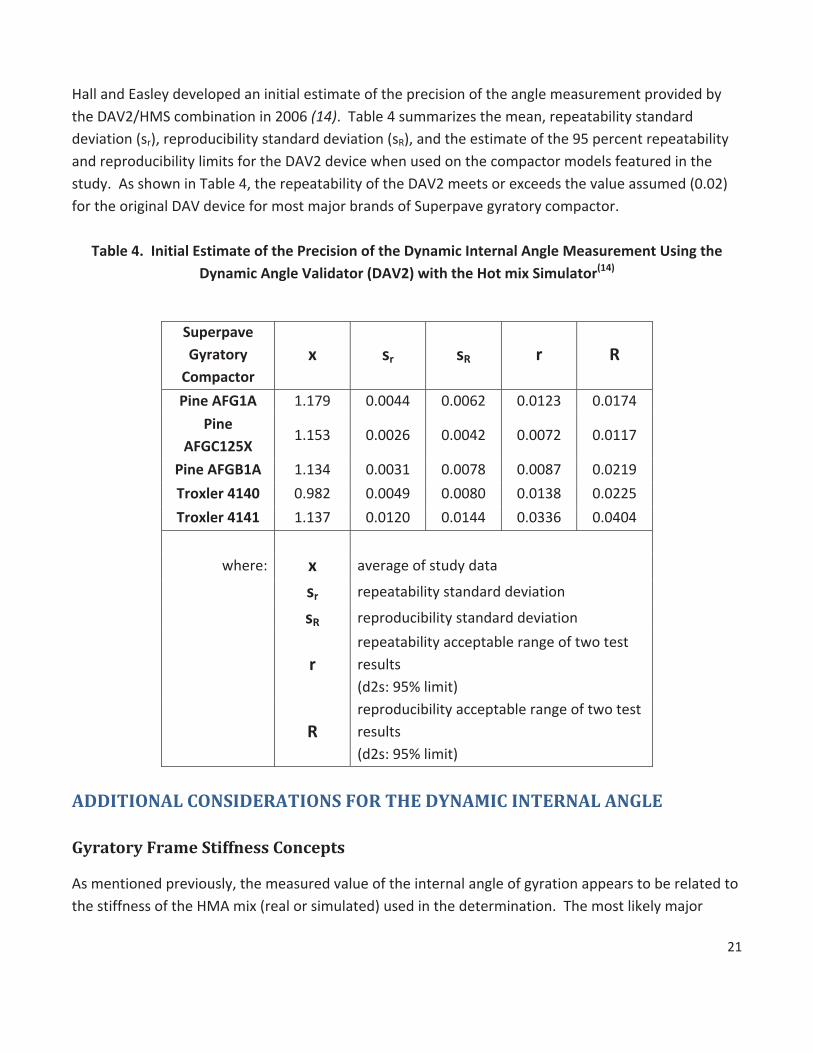
� Figure�13�shows�a�productionͲmodel�RAM�with�additional�contact�rings;�the�rings�are�affixed�to�the� device�beneath�the�wearing�plate�(shown�on�the�upper�surface�of�the�device).��Figure�14�is�a�schematic� illustrating�how�the�raised�ring�ensures�a�single,�rotating�point�of�contact�between�the�load�platens�of� an�SGC�and�the�RAM�unit.��Traces�of�two�different�diameter�contact�rings�are�visible�on�the�surface�of� the�wearing�plate�in�Figure13.� �
�
�
�
�
�
�
Figure�13.��Production�model�Rapid�Angle�Measurement�(RAM)�with�Contact�Rings.� �
�
�
�
�
�
�
�
�
Raised�
Contact
Single�Point�
� Figure�14.��RAM�Simulation�of�Single�Eccentric�Point�Load�
� Hall�and�Easley�developed�an�initial�estimate�of�the�precision�of�the�angle�measurement�provided�the� RAM�in�2004�(12).��Table�3�summarizes�the�mean,�repeatability�standard�deviation�(sr),�reproducibility� standard�deviation�(sR),�and�the�estimate�of�the�95�percent�repeatability�and�reproducibility�limits�for�
18�
�
Page 19
the�RAM�device�when�used�on�the�compactor�models�featured�in�the�study.��As�shown�in�Table�3,�the� repeatability�of�the�RAM�met�or�exceeded�the�value�assumed�(0.02)�for�the�original�DAV�device�for� most�major�brands�of�Superpave�gyratory�compactor.� �
Table�3.��Initial�Estimate�of�the�Precision�of�the�Dynamic�Internal�Angle�Measurement�� Using�the�Rapid�Angle�Measurement�(RAM)(12)�
Superpave� Gyratory� Compactor�
x� sr� sR� r� R�
Pine�AFG1A�
Pine�AFGC125X�
Pine�AFGB1A�
Troxler�4140�
Troxler�4141�
1.168�
1.147�
1.149�
1.054�
1.100�
0.0034�
0.0047�
0.0017�
0.0095�
0.0029�
0.0122�
0.0126�
0.0102�
0.0127�
0.0108�
0.0094�
0.0131�
0.0049�
0.0267�
0.0081�
0.0342�
0.0353�
0.0285�
0.0355�
0.0304�
where:�
x� sr� sR�
r�
R�
� �
average�of�study�data�
repeatability�standard�deviation�
reproducibility�standard�deviation�
repeatability�acceptable�range�of�two�test�results�(d2s:� 95%�limit)� reproducibility�acceptable�range�of�two�test�results� (d2s:�95%�limit)�
�
Hot�Mix�Simulator�(HMS)� � The�Hot�Mix�Simulator�(HMS)�was�introduced�in�the�Spring�of�2004.��The�HMS�is�a�fixture�that�is�used�in� conjunction�with�the�Dynamic�Angle�Validator�(DAV)�which�simulates�the�loading�placed�on�the� Superpave�gyratory�compactor�by�hot�mix�asphalt.��Figure�15�shows�the�HMS.��Brovold�(13)�provides� general�guidance�relating�to�the�theory�behind�the�method�of�simulating�shear�resistance�used�by�the� Hot�mix�Simulator�(HMS);�a�schematic�of�the�basic�mechanical�relationships�is�shown�in�Figure�16.� � Gyratory�force�is�transmitted�through�a�point�of�contact�between�the�surface�of�an�upper�dome�(of�the� HMS)�and�the�inside�of�a�coneͲshaped�depression�machined�into�the�HMS�upper�plate�(shown�in�Figure�
15).��A�shear�force�is�created�by�the�wedge�angle,�G.��This�shear�force�forms�one�moment�couple�acting� on�the�DAV/HMS�unit.��Another�moment�couple�is�created�through�the�gyratory�force�(F)�acting�at�a�
19�
�
Page 20
distance�away�from�the�center�of�the�mold�(recall�that�the�point�of�force�contact�is�on�the�outside�of� the�dome�structure).��� � Resolution�of�forces�(and�resulting�moments)�leads�to�an�expression�for�the�eccentricity,�shown�as��
Equation�1.� � � e�=�tan�G�*�115�/�2�����������������������������������������������������Eq.�1� where:���e�=�eccentricity�(mm)� G�=�angle�of�depression�in�upper�HMS�plate�(rad)�
Figure�15.��The�Hot�mix�Simulator�(HMS)�Attachment�to�the�Dynamic�Angle�Validator�(DAV)�
�
�
�
�
�
�
�
�
�
�
Figure�16.��Operational�schematic�of�the�Hot�mix�Simulator�(HMS)�
e
e
d
L
H
mold
115
mm
F
Shear Force
Eccentric loading on cone with angle G
20�
�
Page 21
Hall�and�Easley�developed�an�initial�estimate�of�the�precision�of�the�angle�measurement�provided�by� the�DAV2/HMS�combination�in�2006�(14).��Table�4�summarizes�the�mean,�repeatability�standard� deviation�(sr),�reproducibility�standard�deviation�(sR),�and�the�estimate�of�the�95�percent�repeatability� and�reproducibility�limits�for�the�DAV2�device�when�used�on�the�compactor�models�featured�in�the� study.��As�shown�in�Table�4,�the�repeatability�of�the�DAV2�meets�or�exceeds�the�value�assumed�(0.02)� for�the�original�DAV�device�for�most�major�brands�of�Superpave�gyratory�compactor.� �
Table�4.��Initial�Estimate�of�the�Precision�of�the�Dynamic�Internal�Angle�Measurement�Using�the� Dynamic�Angle�Validator�(DAV2)�with�the�Hot�mix�Simulator(14)�
�
Superpave� Gyratory� Compactor�
x� sr� sR� r� R�
Pine�AFG1A� 1.179� 0.0044� 0.0062� 0.0123� 0.0174�
Pine� AFGC125X�
1.153� 0.0026� 0.0042� 0.0072� 0.0117�
Pine�AFGB1A� 1.134� 0.0031� 0.0078� 0.0087� 0.0219�
Troxler�4140� 0.982� 0.0049� 0.0080� 0.0138� 0.0225�
Troxler�4141� 1.137� 0.0120� 0.0144� 0.0336� 0.0404�
� � �
where:� x� average�of�study�data�
� sr� repeatability�standard�deviation�
� sR� reproducibility�standard�deviation�
repeatability�acceptable�range�of�two�test� � r� results�
(d2s:�95%�limit)� reproducibility�acceptable�range�of�two�test�
� R� results� (d2s:�95%�limit)�
�
ADDITIONAL�CONSIDERATIONS�FOR�THE�DYNAMIC�INTERNAL�ANGLE� �
Gyratory�Frame�Stiffness�Concepts� As�mentioned�previously,�the�measured�value�of�the�internal�angle�of�gyration�appears�to�be�related�to� the�stiffness�of�the�HMA�mix�(real�or�simulated)�used�in�the�determination.��The�most�likely�major�
21�
�
Page 22
contributing�factor�to�this�phenomenon�is�the�stiffness�of�the�frame�of�the�SGC.��Simulated�loading� devices�such�as�the�RAM�and�HMS�allow�the�control�of�load�eccentricity�(simulating�the�shear� resistance�offered�by�HMA�mixes�of�varying�stiffness)�to�create�a�known�tilting�moment�coupling�on�the� device�inside�the�SGC�mold.��A�plot�of�the�applied�tilting�moment�versus�the�measured�internal�angle� provides�a�representation�of�the�“frame�stiffness”�for�a�given�SGC.��The�general�relationship�between� tilting�moment�and�eccentricity�is�shown�in�Equation�4.� �
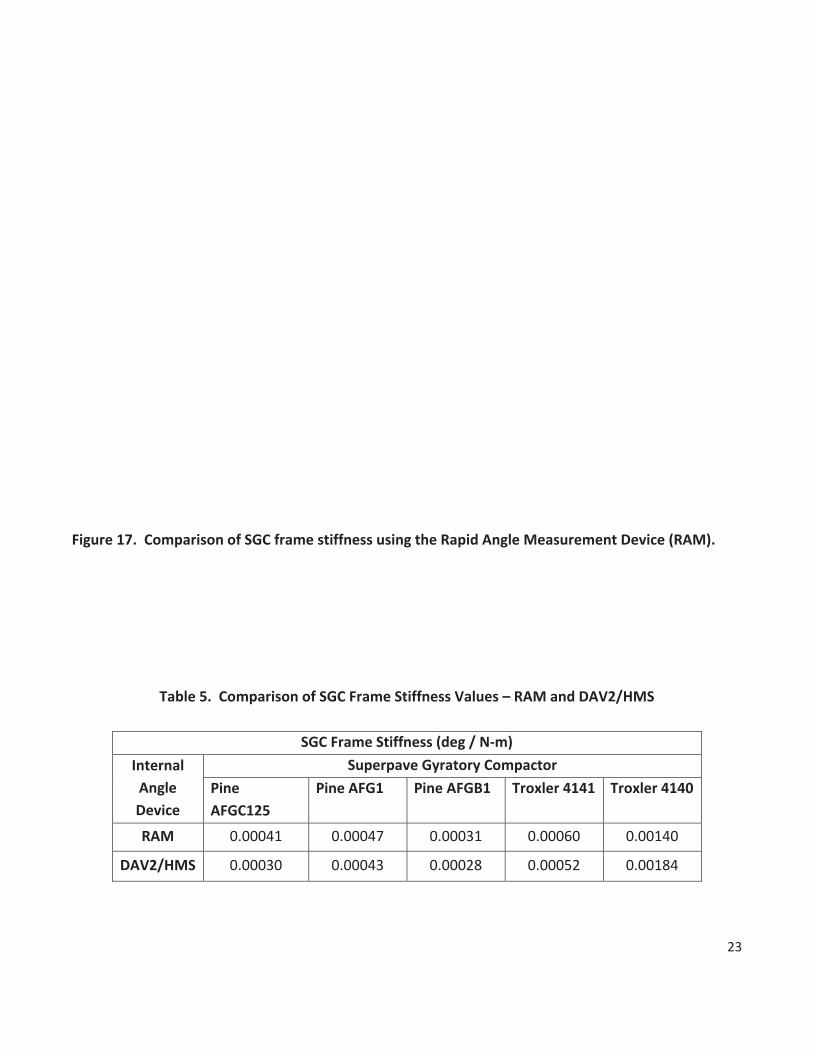
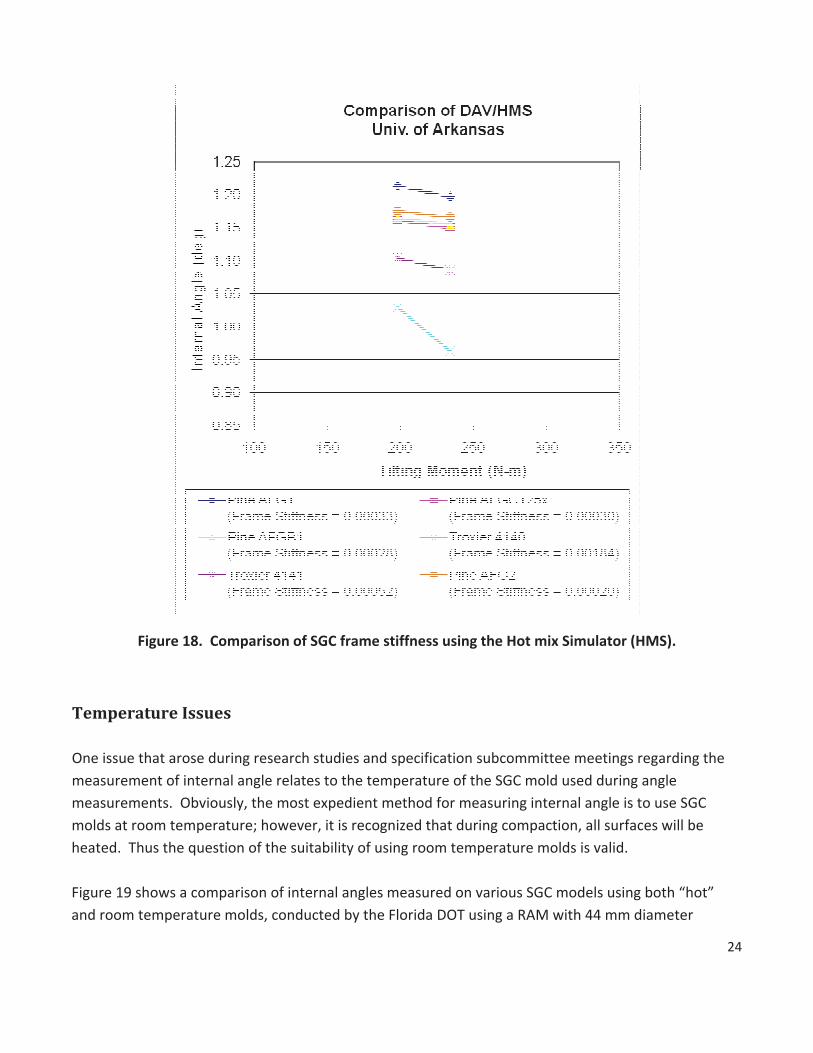
Moment�(NͲm)�=�eccentricity�(mm)�*�SGC�Force�(N)�/�1000���������������������������Eq.�4� � A�typical�value�for�SGC�Force�(at�600�kPa�pressure)�is�approximately�10,602�N.� � Figures�17�and�18�are�plots�of�tilting�moment�versus�measured�internal�angle�for�five�models�of� Superpave�gyratory�compactor,�from�ongoing�studies�being�performed�by�the�University�of�Arkansas� using�“production�model”�RAM�and�DAV2/HMS�units.�Relative�frame�stiffness�is�assessed�by�comparing� the�slope�of�the�lines�shown�on�the�graph.��For�ease�of�comparison,�the�slope�for�each�data�set�(in� deg/NͲm)�is�shown�in�the�legend�of�the�figure.��It�is�apparent�that�real�differences�occur�in�the� measured�internal�angle,�for�the�same�compactor,�when�using�different�simulated�loads.��These� differences�in�internal�angle�can�be�significant,�considering�the�original�internal�angle�specification�for� compaction�is�1.16±0.02�degrees�(AASHTO�T312).� � Table�5�summarizes�the�“frame�stiffness”�(slope�of�the�internal�angleͲversusͲtilting�moment�line)�as� evaluated�by�the�RAM�and�DAV2/HMS�for�the�five�SGC�units�in�the�University�of�Arkansas�study.��It�is� noted�that�the�single�point�shown�for�each�angle�in�Figures�17�and�18�represents�the�average�of�three� angle�measurements.� �
The�frame�stiffness�phenomenon�complicates�the�comparison�of�dynamic�internal�angle�values� measured�using�simulated�loading�devices�with�those�measured�using�hot�mix�asphalt.��For�a�direct� comparison,�an�“equivalent�eccentricity”�must�be�determined�for�the�hot�mix�asphalt�used�in�the� measurement.��Research�to�characterize�hot�mix�asphalt�mixtures�in�terms�of�equivalent�eccentricity� (to�allow�such�comparisons)�has�not�successfully�identified�any�such�relationships�suitable�for� implementation�into�routine�practice�(15).� �
22�
�
Page 23
�
� Figure�17.��Comparison�of�SGC�frame�stiffness�using�the�Rapid�Angle�Measurement�Device�(RAM).� � � �
� � �
Table�5.��Comparison�of�SGC�Frame�Stiffness�Values�–�RAM�and�DAV2/HMS� �
SGC�Frame�Stiffness�(deg�/�NͲm)
Internal� Angle� Device�
Superpave�Gyratory�Compactor
Pine� AFGC125�
Pine�AFG1 Pine�AFGB1 Troxler�4141� Troxler�4140
RAM� 0.00041� 0.00047� 0.00031� 0.00060� 0.00140�
DAV2/HMS� 0.00030� 0.00043� 0.00028� 0.00052� 0.00184�
�
23�
�
Page 24
�
Figure�18.��Comparison�of�SGC�frame�stiffness�using�the�Hot�mix�Simulator�(HMS).�
�
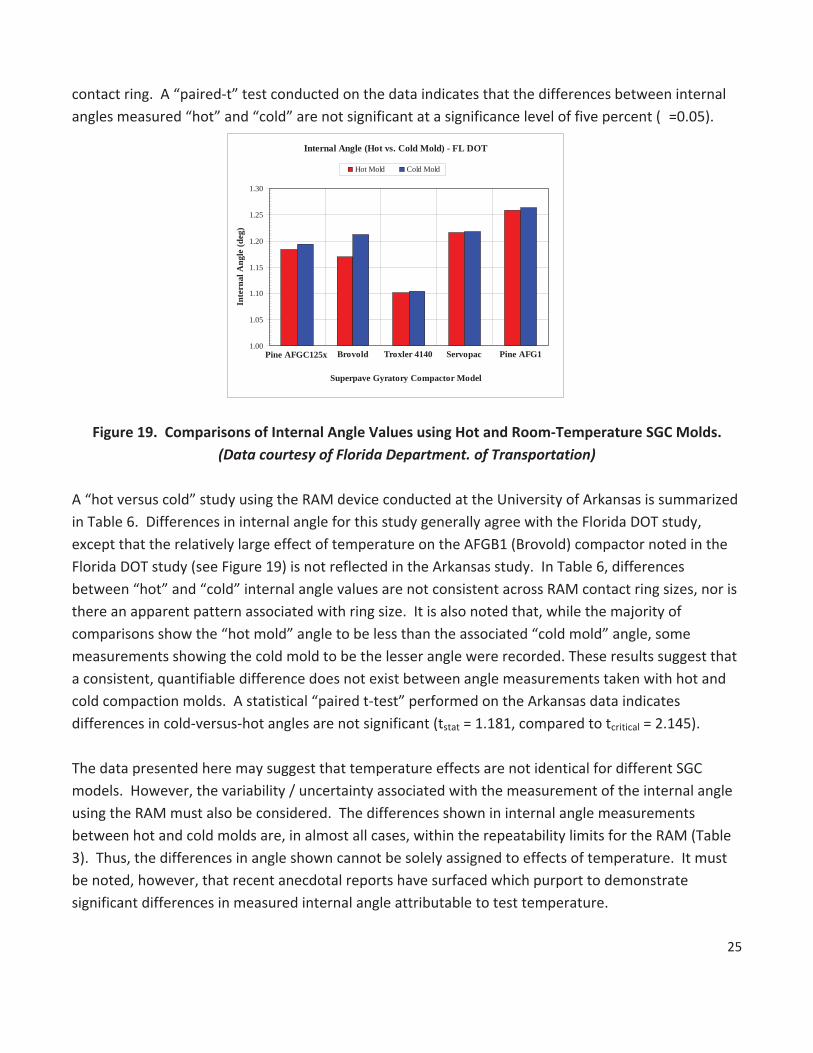
Temperature�Issues� � One�issue�that�arose�during�research�studies�and�specification�subcommittee�meetings�regarding�the� measurement�of�internal�angle�relates�to�the�temperature�of�the�SGC�mold�used�during�angle� measurements.��Obviously,�the�most�expedient�method�for�measuring�internal�angle�is�to�use�SGC� molds�at�room�temperature;�however,�it�is�recognized�that�during�compaction,�all�surfaces�will�be� heated.��Thus�the�question�of�the�suitability�of�using�room�temperature�molds�is�valid.� � Figure�19�shows�a�comparison�of�internal�angles�measured�on�various�SGC�models�using�both�“hot”� and�room�temperature�molds,�conducted�by�the�Florida�DOT�using�a�RAM�with�44�mm�diameter�
24�
�
Page 25
contact�ring.��A�“pairedͲt”�test�conducted�on�the�data�indicates�that�the�differences�between�internal� angles�measured�“hot”�and�“cold”�are�not�significant�at�a�significance�level�of�five�percent�(�=0.05).�
Internal Angle (Hot vs. Cold Mold) - FL DOT
Pine AFG1 Servopac Troxler 4140 Pine AFGC125x Brovold 1.00
1.05
1.10
1.15
1.20
1.25
1.30
Superpave Gyratory Compactor Model
Inte
rnal
Ang
le (d
eg)
Hot Mold Cold Mold
� Figure�19.��Comparisons�of�Internal�Angle�Values�using�Hot�and�RoomͲTemperature�SGC�Molds.��
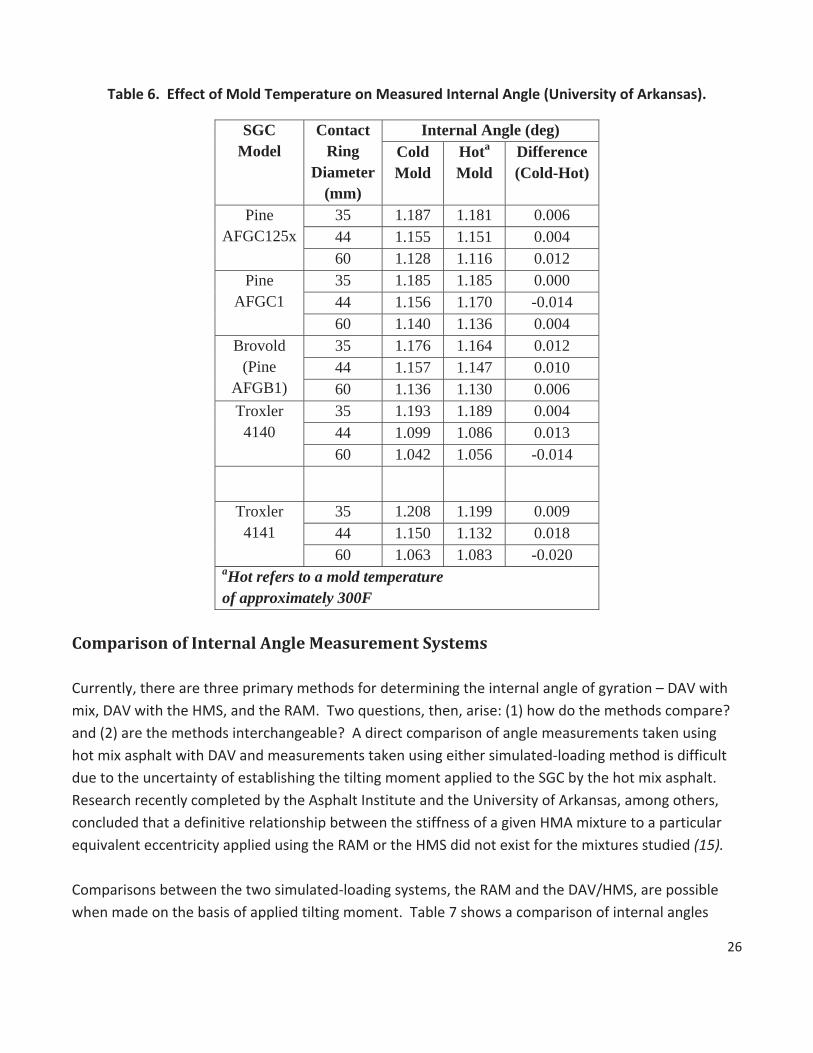
(Data�courtesy�of�Florida�Department.�of�Transportation)� � A�“hot�versus�cold”�study�using�the�RAM�device�conducted�at�the�University�of�Arkansas�is�summarized� in�Table�6.��Differences�in�internal�angle�for�this�study�generally�agree�with�the�Florida�DOT�study,� except�that�the�relatively�large�effect�of�temperature�on�the�AFGB1�(Brovold)�compactor�noted�in�the� Florida�DOT�study�(see�Figure�19)�is�not�reflected�in�the�Arkansas�study.��In�Table�6,�differences� between�“hot”�and�“cold”�internal�angle�values�are�not�consistent�across�RAM�contact�ring�sizes,�nor�is� there�an�apparent�pattern�associated�with�ring�size.��It�is�also�noted�that,�while�the�majority�of� comparisons�show�the�“hot�mold”�angle�to�be�less�than�the�associated�“cold�mold”�angle,�some� measurements�showing�the�cold�mold�to�be�the�lesser�angle�were�recorded.�These�results�suggest�that� a�consistent,�quantifiable�difference�does�not�exist�between�angle�measurements�taken�with�hot�and� cold�compaction�molds.��A�statistical�“paired�tͲtest”�performed�on�the�Arkansas�data�indicates� differences�in�coldͲversusͲhot�angles�are�not�significant�(tstat�=�1.181,�compared�to�tcritical�=�2.145).� � The�data�presented�here�may�suggest�that�temperature�effects�are�not�identical�for�different�SGC� models.��However,�the�variability�/�uncertainty�associated�with�the�measurement�of�the�internal�angle� using�the�RAM�must�also�be�considered.��The�differences�shown�in�internal�angle�measurements� between�hot�and�cold�molds�are,�in�almost�all�cases,�within�the�repeatability�limits�for�the�RAM�(Table� 3).��Thus,�the�differences�in�angle�shown�cannot�be�solely�assigned�to�effects�of�temperature.��It�must� be�noted,�however,�that�recent�anecdotal�reports�have�surfaced�which�purport�to�demonstrate� significant�differences�in�measured�internal�angle�attributable�to�test�temperature.� �
25�
�
Page 26
Table�6.��Effect�of�Mold�Temperature�on�Measured�Internal�Angle�(University�of�Arkansas).�
SGC Model
Contact Ring
Diameter (mm)
Internal Angle (deg) Cold Mold
Hota
Mold Difference (Cold-Hot)
Pine AFGC125x
35 1.187 1.181 0.006 44 1.155 1.151 0.004 60 1.128 1.116 0.012
Pine AFGC1
35 1.185 1.185 0.000 44 1.156 1.170 -0.014 60 1.140 1.136 0.004
Brovold (Pine
AFGB1)
35 1.176 1.164 0.012 44 1.157 1.147 0.010 60 1.136 1.130 0.006
Troxler 4140
35 1.193 1.189 0.004 44 1.099 1.086 0.013 60 1.042 1.056 -0.014
Troxler 4141
35 1.208 1.199 0.009 44 1.150 1.132 0.018 60 1.063 1.083 -0.020
aHot refers to a mold temperature of approximately 300F
�
Comparison�of�Internal�Angle�Measurement�Systems� � Currently,�there�are�three�primary�methods�for�determining�the�internal�angle�of�gyration�–�DAV�with� mix,�DAV�with�the�HMS,�and�the�RAM.��Two�questions,�then,�arise:�(1)�how�do�the�methods�compare?� and�(2)�are�the�methods�interchangeable?��A�direct�comparison�of�angle�measurements�taken�using� hot�mix�asphalt�with�DAV�and�measurements�taken�using�either�simulatedͲloading�method�is�difficult� due�to�the�uncertainty�of�establishing�the�tilting�moment�applied�to�the�SGC�by�the�hot�mix�asphalt.�� Research�recently�completed�by�the�Asphalt�Institute�and�the�University�of�Arkansas,�among�others,� concluded�that�a�definitive�relationship�between�the�stiffness�of�a�given�HMA�mixture�to�a�particular� equivalent�eccentricity�applied�using�the�RAM�or�the�HMS�did�not�exist�for�the�mixtures�studied�(15).��� � Comparisons�between�the�two�simulatedͲloading�systems,�the�RAM�and�the�DAV/HMS,�are�possible� when�made�on�the�basis�of�applied�tilting�moment.��Table�7�shows�a�comparison�of�internal�angles�
26�
�
Page 27
measured�using�a�production�model�RAM�(with�44�mm�contact�ring)�and�an�early� production/prototype�DAV/HMS�system�(with�a�21Ͳdeg�HMS�cone).��The�tilting�moment�for�each� system�is�calculated�using�equation�4.��For�purposes�of�comparison,�the�applied�SGC�force�for�each� system�is�taken�as�the�nominal�10,602�N.��The�calculated�tilting�moments�for�the�RAM�is�shown�as� Equation�5.��The�calculation�for�the�eccentricity�of�the�DAV/HMS�(with�a�21Ͳdeg�cone)�is�shown�in� Equation�6;�the�DAV/HMS�tilting�moment�calculation�is�shown�as�Equation�7�(taken�from�Equation�3).� �
RAM�Moment�(NͲm)�=�22�mm�*�10,602�N�/�1000�=�233.2�NͲm����������������������������(Equation�5)� �
DAV/HMS�eccentricity�=�tan(�(radians)�21�deg)�*�115�/�2�=�22.07�mm�����������������(Equation�6)� �
DAV/HMS�Moment�(NͲm)�=�22.07�mm�*�10,602�N�/�1000�=�234.0�NͲm�������������(Equation�7)� � Thus,�the�best�direct�comparison�of�the�internal�angle�values�generated�by�the�RAM�and�DAV/HMS� uses�the�44�mm�RAM�contact�ring�and�the�21�deg�HMS�cone.� � The�data�shown�in�Table�7�represent�the�average�of�three�replicate�tests�on�each�compactor�using�each� device.��The�two�simulated�loading�devices�do�not�appear�to�provide�the�same�value�for�internal�angle� at�a�similar�applied�tilting�moment.��SingleͲfactor�analysis�of�variance�(ANOVA)�tests�performed�on�the� data�indicate�the�differences�in�average�internal�angle�are�significant�for�the�Pine�G1�and�Pine�125x� compactors.�However,�an�examination�of�the�actual�differences�in�average�internal�angle�values� between�the�two�simulated�load�devices�suggests�that,�in�practical�terms,�the�differences�noted�may� not�be�significant.� �
ASTM�Comparison�Study�and�Current�AASHTO/ASTM�Specifications� � In�2007,�Dukatz�headed�a�comprehensive�study�focused�on�establishing�the�precision�and�bias�of�the� internal�angle�measurement�using�simulated�load,�sponsored�by�the�American�Society�for�Testing�and� Materials�(ASTM)�as�Interlaboratory�Study�(ILS)�151�(16).��This�study�also�provided�a�comprehensive� comparison�of�internal�angle�results�generated�by�the�two�simulated�load�devices.��The�study,�which� included�28�SGCs�representing�the�major�models�currently�in�service,�9�laboratories/agencies,�and�12� internal�angle�instruments�(6�RAM�devices�and�6�DAV/HMS�devices),�has�been�generally�acknowledged� as�likely�more�representative�of�routine�field�conditions�than�previous�efforts�by�Hall�and�others.� �
�
�
27�
�
Page 28
Table�7.��Comparison�of�RAM�(44�mm�contact�ring)�and�DAV/HMS�(21�deg�cone)�
Average Internal Angle, deg Std. Deviation, 3 replicates Difference
Compactor RAM DAV/HMS Significant?a
Pine G1 1.177 1.193 Yes 0.0076 0.0025
Pine 125x 1.143 1.157 Yes
0.0029 0.0020
Brovold 1.165 1.160 No 0.0087 0.0021
Troxler 4140
1.057 1.051 No 0.0029 0.0026
Troxler 4141
1.137 1.155 No 0.0161 0.0096
aANOVA (F-test) with level of significance D�= 0.05
� � The�major�findings�of�the�ILS�151�study,�as�reported�by�Dukatz,�are�summarized:� �
x The�acceptable�range�of�two�internal�angle�measurements�(d2s)�for�single�operators�is�0.03� degrees;� �
x The�acceptable�range�of�two�internal�angle�measurements�(d2s)�for�multiple�operators�is�0.04� degrees;� �
x There�is�no�consistent,�significant�difference�in�angle�measurements�generated�by�the�RAM�and� DAV/HMS�instruments,�across�the�major�SGC�brands/models�typically�in�service�in�the�U.S.�
� � � � � � � �
28�
�
Page 29
� � � Table�8�reproduces�the�summary�precision�statistics�from�the�ILS�151�study.�
� Table�8.��Summary�Statistics�from�the�ASTM�ILS�151�Study(16)�
� � The�complete�text�of�the�full�precision�statement�from�the�ILS�151�study�follows:� �
13.1�The�precision�is�based�on�an�Interlaboratory�Study�(ILS�#151)�that�was�conducted�in� 2007�using�ASTM�E691�Practice�for�Conducting�an�InterͲlaboratory�Study�to�Determine� the�Precision�of�a�Test�Method�and�ASTM�Practice�C�670�for�Preparing�Precision� Statements�for�Test�Methods�for�Construction�Materials.�ILS�#151�involved�27� laboratories,�which�featured�5�Troxler�(DAVIIͲHMS)�and�6�Pine�Instruments�AFLS1�(RAM)� internal�angle�instruments�and�the�following�SGC�models:�Troxler�Electronics�4140,� 4141,�and�414x;�Pine�Instruments�AFG1,�AFG2,�AFGB1,�AFGC125X;�IPC�ServoPac;�and� Interlaken.��Within�the�study�the�internal�angle�measurements�ranged�from�1.014�to� 1.290�degrees.����
SingleͲInstrument�Precision�—�the�single�operator�standard�deviation�of�a�single�test� result�has�been�found�to�be�0.011�degrees.�Therefore,�results�of�two�properly�conducted� measurements�by�the�same�operator�with�the�same�instrument�in�the�same�SGC�should� not�differ�by�more�than�0.03�degrees3.�
MultiͲInstrument�Precision�—�the�multiͲinstrument�standard�deviation�of�a�single�test� result�has�been�found�to�be�0.015�degrees.�Therefore,�the�results�of�properly�conducted� measurements�by�different�operators�using�different�instruments�in�the�same�SGC� should�not�differ�by�more�than�0.04�degrees3.���
29�
�
Page 30
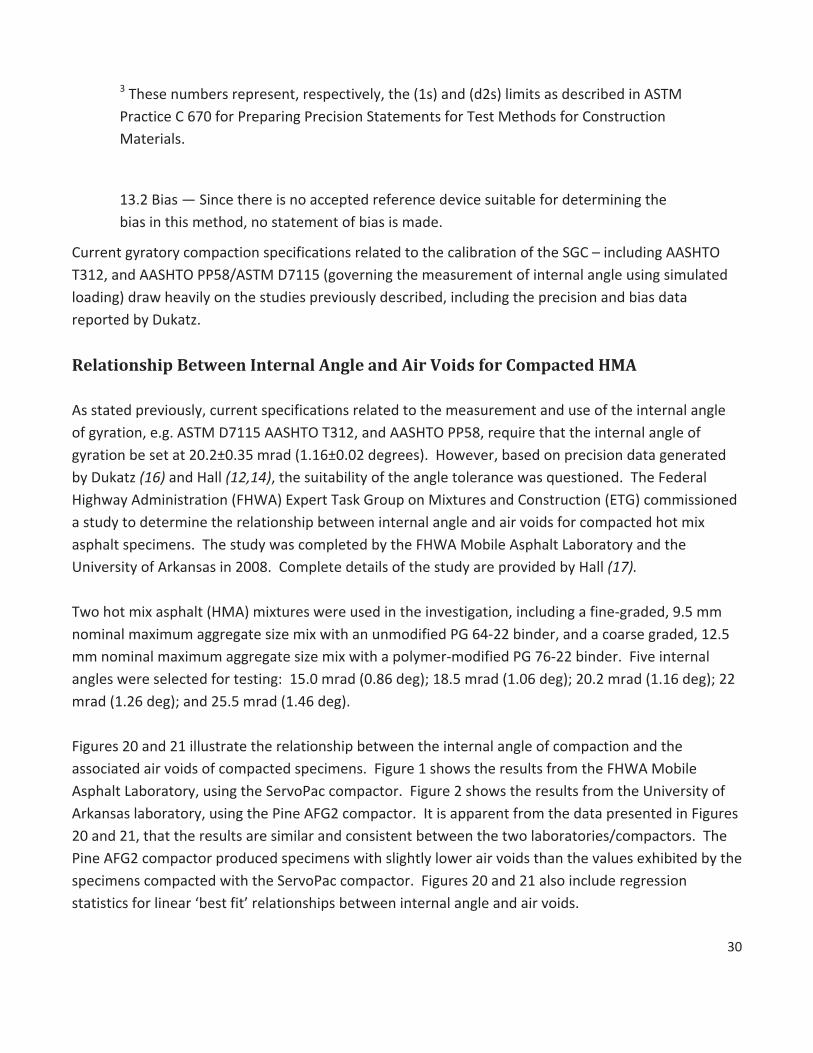
3�These�numbers�represent,�respectively,�the�(1s)�and�(d2s)�limits�as�described�in�ASTM� Practice�C�670�for�Preparing�Precision�Statements�for�Test�Methods�for�Construction� Materials.��
�
13.2�Bias�—�Since�there�is�no�accepted�reference�device�suitable�for�determining�the� bias�in�this�method,�no�statement�of�bias�is�made.�
Current�gyratory�compaction�specifications�related�to�the�calibration�of�the�SGC�–�including�AASHTO� T312,�and�AASHTO�PP58/ASTM�D7115�(governing�the�measurement�of�internal�angle�using�simulated� loading)�draw�heavily�on�the�studies�previously�described,�including�the�precision�and�bias�data� reported�by�Dukatz.� �
Relationship�Between�Internal�Angle�and�Air�Voids�for�Compacted�HMA� � As�stated�previously,�current�specifications�related�to�the�measurement�and�use�of�the�internal�angle� of�gyration,�e.g.�ASTM�D7115�AASHTO�T312,�and�AASHTO�PP58,�require�that�the�internal�angle�of� gyration�be�set�at�20.2±0.35�mrad�(1.16±0.02�degrees).��However,�based�on�precision�data�generated� by�Dukatz�(16)�and�Hall�(12,14),�the�suitability�of�the�angle�tolerance�was�questioned.��The�Federal� Highway�Administration�(FHWA)�Expert�Task�Group�on�Mixtures�and�Construction�(ETG)�commissioned� a�study�to�determine�the�relationship�between�internal�angle�and�air�voids�for�compacted�hot�mix� asphalt�specimens.��The�study�was�completed�by�the�FHWA�Mobile�Asphalt�Laboratory�and�the� University�of�Arkansas�in�2008.��Complete�details�of�the�study�are�provided�by�Hall�(17).��� � Two�hot�mix�asphalt�(HMA)�mixtures�were�used�in�the�investigation,�including�a�fineͲgraded,�9.5�mm� nominal�maximum�aggregate�size�mix�with�an�unmodified�PG�64Ͳ22�binder,�and�a�coarse�graded,�12.5� mm�nominal�maximum�aggregate�size�mix�with�a�polymerͲmodified�PG�76Ͳ22�binder.��Five�internal� angles�were�selected�for�testing:��15.0�mrad�(0.86�deg);�18.5�mrad�(1.06�deg);�20.2�mrad�(1.16�deg);�22� mrad�(1.26�deg);�and�25.5�mrad�(1.46�deg).� � Figures�20�and�21�illustrate�the�relationship�between�the�internal�angle�of�compaction�and�the� associated�air�voids�of�compacted�specimens.��Figure�1�shows�the�results�from�the�FHWA�Mobile� Asphalt�Laboratory,�using�the�ServoPac�compactor.��Figure�2�shows�the�results�from�the�University�of� Arkansas�laboratory,�using�the�Pine�AFG2�compactor.��It�is�apparent�from�the�data�presented�in�Figures� 20�and�21,�that�the�results�are�similar�and�consistent�between�the�two�laboratories/compactors.��The� Pine�AFG2�compactor�produced�specimens�with�slightly�lower�air�voids�than�the�values�exhibited�by�the� specimens�compacted�with�the�ServoPac�compactor.��Figures�20�and�21�also�include�regression� statistics�for�linear�‘best�fit’�relationships�between�internal�angle�and�air�voids.� �
30�
�
Page 31
Air�Voids�(%
)
6.0
5.0
4.0
3.0
2.0
1.0
0.0
FHWA�Mobile�Asphalt�Lab
0.8 0.9 1 1.1 1.2 1.3 1.4 1.5 1.6
Average�Internal�Angle�(deg) 9.5mm/64Ͳ22/N65 9.5mm/64Ͳ22/N100 12.5mm/76Ͳ22/N50
y�=�Ͳ3.9072x�+�8.4638 y�=�Ͳ3.2887x�+�6.4957 y�=�Ͳ5.6156x�+�10.308 R²�=�0.9998 R²�=�0.9763 R²�=�0.9702
�
Of�particular�interest�for�this�project�is�the�slope�of�the�angleͲversusͲvoids�relationship.��This�slope� quantifies�the�effect�of�changes�in�the�angle�of�gyration�on�the�air�voids�of�compacted�specimens.�� Table�9�summarizes�the�slope�values�recorded�in�this�study.� � � �
Figure�20.���Relationship�Between�Internal�Angle�and�Air�Voids�–�FHWA/ServoPac�Compactor� �
31�
�
Page 32
Air�Voids�(%
)
6.0
5.0
4.0
3.0
2.0
1.0
0.0
University�of�Arkansas
0.8 0.9 1 1.1 1.2 1.3 1.4 1.5 1.6
Average�Internal�Angle�(deg)
9.5mm/64Ͳ22/N65 9.5mm/64Ͳ22/N100 12.5mm/76Ͳ22/N50
y�=�Ͳ3.1528x�+�5.9717 y�=�Ͳ5.6032x�+�10.021 y�=�Ͳ4.0769x�+�7.8908
R²�=�0.9558 R²�=�0.9881R²�=�0.9957 �
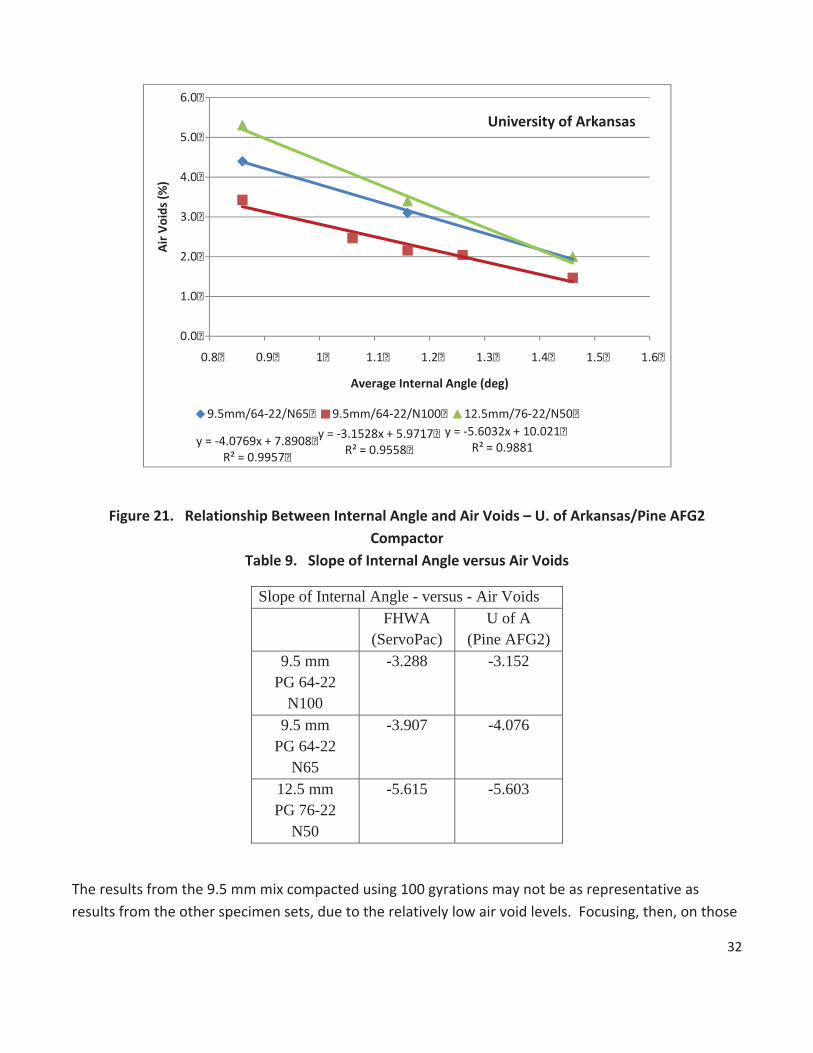
� Figure�21.���Relationship�Between�Internal�Angle�and�Air�Voids�–�U.�of�Arkansas/Pine�AFG2�
Compactor� Table�9.���Slope�of�Internal�Angle�versus�Air�Voids�
Slope of Internal Angle - versus - Air Voids FHWA
(ServoPac) U of A
(Pine AFG2) 9.5 mm
PG 64-22 N100
-3.288 -3.152
9.5 mm PG 64-22
N65
-3.907 -4.076
12.5 mm PG 76-22
N50
-5.615 -5.603
�
The�results�from�the�9.5�mm�mix�compacted�using�100�gyrations�may�not�be�as�representative�as� results�from�the�other�specimen�sets,�due�to�the�relatively�low�air�void�levels.��Focusing,�then,�on�those�
32�
�
Page 33
results�from�the�9.5�mm�mix�at�65�gyrations�and�the�12.5�mm�mix�at�50�gyrations,�the�slopes�shown�in� Table�9�range�from�Ͳ3.907�to�Ͳ5.615,�with�an�average�value�of�Ͳ4.800.��Thus,�on�average,�an�increase�in� internal�angle�of�0.01�degrees�would�result�in�a�decrease�of�0.048�percent�air�voids.��In�more�general� terms,�it�is�reasonable�to�express�the�relationship�as:��a�change�in�internal�angle�of�0.01�degrees�results� in�an�average�change�in�air�voids�of�0.05�percent.��However,�the�exact�relationship�between�internal� angle�and�air�voids�may�be�mixture�specific.� �
Summary�and�Recommendations�� In�many�states,�hot�mix�asphalt�(HMA)�specimens�compacted�using�different�Superpave�Gyratory� Compactors�(SGCs)�exhibit�different�densities�(or�air�voids).��A�number�of�factors�might�contribute�to�such�differences.��A�recommended�approach�to�identifying�and�minimizing�cause(s)�of�air�void� differences�among�compactors�is�summarized�as�follows:� � 1. Ensure�that�each�SGC�is�properly�maintained�in�good�working�order.��At�a�minimum,�all�
maintenance�activities�recommended�by�the�SGC�manufacturer�should�be�performed�at�the�specified�time�interval.��In�addition�to�“routine”�scheduled�maintenance�items,�each�SGC�should�be� thoroughly�inspected�for�mechanical�wear�by�a�qualified�service�technician�at�least�once�per�year�(or�more�often�if�the�unit�experiences�heavy�usage).��
2. Ensure�that�each�SGC�is�clean.��BuildͲup�of�binder�and�mix�on�the�working�surfaces�and�internal�mechanisms�of�a�compactor�may�lead�to�variations�in�the�compaction�effort�supplied�by�the�unit�to�the�hot�mix�specimen.��
3. Periodically�inspect�each�compaction�mold�for�each�SGC�unit�for�physical�defects,�pits,�etc.��Measure�the�internal�diameter�of�each�mold�in�the�region�where�mix�is�compacted�(approximately�2�to�6�inches�from�the�bottom).��Consider�removing�any�molds�used�for�preparing�specimens�for�acceptance�testing�that�show�an�internal�diameter�greater�than�150.0�mm.��Ensure�that�SGC�molds� are�cleaned.��BuildͲup�of�binder�and/or�hot�mix�asphalt�inside�a�compaction�mold�may�lead�to�variations�in�the�density�of�HMA�specimens.��
4. If�a�“bias”�between�two�SGC�units�is�suspected�(and�all�recommendations�in�items�1�through�3� above�have�been�completed),�perform�a�comparison�study�as�described�in�this�document.��
5. When�all�recommendations�in�items�1�through�4�(above)�have�been�completed�and�a�demonstrated�bias�exists�between�two�or�more�SGC�units,�differences�in�air�voids�among�HMA�specimens�may�be�reduced�by�calibrating�each�SGC�using�the�internal�angle�of�gyration.��Current�AASHTO�and�ASTM�test�methods�require�the�calibration�be�performed�using�simulated�load�techniques.�
�
� �
33�
�
Page 34
References�� 1. Buchanan,�S.,�Superpave�Gyratory�Compactor�Angle�Verification,�presentation�to�the�Mix�Design�
Task�Group�of�the�Southeast�Asphalt�User/Producer�Group,�Jackson,�MS,�November,�2001,��2. AASHTO�Materials�Reference�Laboratory,�preliminary�data�provided�from�NCHRP�9Ͳ26,�February�
2002.� 3. Harman,�T.,�An�Update�on�the�Angle�Validation�Kit,�presentation�given�to�the�TRB�Superpave�Mix�
and�Aggregates�Expert�Task�Group,�Denver�CO,�February�2002.�4. West,�R.,�Using�the�Dynamic�Angle�Validation�Kit�to�Calibrate�Superpave�Gyratory�Compactors,�
presentation�to�the�TRB�Superpave�Mix�and�Aggregates�Expert�Task�Group,�Denver�CO,�February� 2002.�
5. AlͲKhateeb,�G.,�C.�Paugh,�K.�Stuart,�T.�Harman,�and�J.�D’Angelo,�Target�and�Tolerance�Study�for�the� Angle�of�Gyration�Used�in�the�Superpave�Gyratory�Compactor�(SGC),�compendium�of�papers�(CDͲROM),�Annual�Meeting�of�the�Transportation�Research�Board,�Washington,�D.C.,�2002.�
6. Perdomo,�D.,�R.�McGennis,�T.�Kennedy,�and�V.�Anderson,�Ruggedness�Evaluation�of�AASHTO�TP4,�Experimental�Results,�prepared�for�the�FHWA�Office�of�Technology�Applications,�March�1996.�
7. Harman,�T.,�and�C.�Paugh,�Dynamic�Internal�Angle�(DIA)�Measurement�in�the�Troxler�Superpave� Gyratory�Compactor�–�Linearity�Study,�study�conducted�by�the�FHWA�Turner�Fairbank�Highway�Research�Center,�October�2001.�
8. Hall,�K.�D.,�Internal�Angle�of�Gyration�for�the�Superpave�Gyratory�Compactor�VI:�Judgment�Day,� presentation�to�the�FHWA�Expert�Task�Group�on�Mixtures�and�Aggregates,�Washington,�D.C.,�September�2006.�
9. Guler,�M.;�H.�Bahia,�P.J.�Bosscher,�and�M.E.�Plesha,�Device�for�Measuring�Shear�Resistance�of�Hot�Mix�Asphalt�in�Gyratory�Compactor,�Transportation�Research�Record�1723,�TRB,�National�Academy� of�Sciences,�Washington,�DC�(2000)�116Ͳ124.�
10. Dalton,�F.,�Comparison�of�Two�Internal�Angle�Measurement�Devices�for�Superpave�Gyratory�Compactors,�Report�2003Ͳ01,�Revision�A,�Pine�Instrument�Company,�Grove�City,�PA,�May�2003.�
11. Cominsky,�R.,�R.�Leahy,�and�E.�Harrigan,�Level�One�Mix�Design:�Materials�Selection,�Compaction,�and� Conditioning,�Strategic�Highway�Research�Program�Report�SHRPͲAͲ408,�National�Academy�of�Sciences,�Washington,�D.C.,�1994.�
12. Hall,�K.D.,�and�T.�Easley,�“Establishment�of�the�Precision�of�the�Rapid�Angle�Measurement�(RAM)�Device�for�Superpave�Gyratory�Compactors”,�Transportation�Research�Record�1929,�TRB,�National� Academy�of�Sciences,�Washington,�DC�(2005)�97Ͳ103.�
13. Brovold,�T.,�Technical�Discussion�of�Test�Quip’s�Hot�Mix�Simulator�Theory,�provided�to�the�author�by�T.�Brovold,�October,�2003.�
14. Hall,�K.D.,�and�T.�Easley,�“Establishment�of�the�Precision�of�the�Dynamic�Angle�Validation�(DAV)� Device�for�Superpave�Gyratory�Compactors”,�10th�Annual�Conference�on�Asphalt�Pavements,�International�Society�for�Asphalt�Pavements,�Quebec,�Canada,�2006.�
15. Anderson,�M.,�K.D.�Hall,�and�M.�Huner,�Using�Mechanical�Mixture�Simulation�Devices�for�Determining�and�Calibrating�the�Internal�Angle�of�Gyration�in�a�Superpave�Gyratory�Compactor,�Transportation�Research�Record�1970,�TRB,�The�National�Academies,�Washington,�D.C.�(2006),�99Ͳ105.�
34�
�
Page 35
16. Dukatz,�E.,�Interlaboratory�Study�to�Establish�Precision�Statements�for�ASTM�D7115�Standard�Test� Method�for�Measurement�of�Superpave�Gyratory�Compactor�(SGC)�Internal�Angle�of�Gyration�Using� Simulated�Loading,�Research�Report�RR:�D04Ͳ1028,�American�Society�for�Testing�and�Materials,� West�Conshohocken,�PA,�2008.�
17. Hall,�K.,�“Relationship�Between�Internal�Angle�of�Gyration�and�Air�Voids�for�the�Superpave�Gyratory� Compactor”,�compendium�of�papers�(CDͲROM),�Annual�Meeting�of�the�Transportation�Research� Board,�Washington,�D.C.,�2009.�
� � Acknowledgements� This�TechBrief�is�the�result�of�an�FHWA�Mixtures�Expert�Task�Group�activity�to�provide�the�latest� information�on�the�use�of�the�Superpave�Gyratory�Compactor.��Members�included�Kevin�Hall� (University�of�Arkansas),�Erv�Dukatz�(Mathy�Construction�Company),�Todd�Lynn�(Old�Castle�Company),� Roger�Pyle�(Pine�Instruments),�Tom�Brovold�(TestQuip),�Ken�Brown�(Troxler�Laboratories)�and�Randy� West�(National�Center�for�Asphalt�Technology).�
� Further�Information� Contact—For�information�related�to�asphalt�mixtures,�please�contact�the�following:� Federal�Highway�Administration�Asphalt�Pavement�Technology�Team��
John�Bukowski�Ͳ�[email protected] ��(Office�of�Pavement�Technology)� Jack�Youtcheff�Ͳ��[email protected] ��(Office�of�Infrastructure�R&D)� Tom�Harman�–�[email protected] �(Pavement�&�Materials�Technical�Service�Team)� �
This�TechBrief�was�developed�by�the�Office�of�Pavement�Technology�as�part�of�the�Federal�Highway� Administration’s�(FHWA’s)�Asphalt�Pavement�Technology�Program.� � Distribution—This�TechBrief�is�being�distributed�according�to�a�standard�distribution.�Direct� distribution�is�being�made�to�the�Resource�Centers�and�Divisions.� � Notice—This�TechBrief�is�disseminated�under�the�sponsorship�of�the�U.S.�Department�of� Transportation�in�the�interest�of�information�exchange.�The�TechBrief�does�not�establish�policies�or� regulations,�nor�does�it�imply�FHWA�endorsement�of�the�conclusions�or�recommendations.�The�U.S.� Government�assumes�no�liability�for�the�contents�or�their�use.� � FHWA�provides�highͲquality�information�to�serve�Government,�industry,�and�the�public�in�a�manner� that�promotes�public�understanding.�Standards�and�policies�are�used�to�ensure�and�maximize�the� quality,�objectivity,�utility,�and�integrity�of�its�information.�FHWA�periodically�reviews�quality�issues�and� adjusts�its�programs�and�processes�to�ensure�continuous�quality�improvement.� � �
35�
�