44
Investigation of a novel sorption heat pump system for heating, cooling and heat storage Seyed Aliakbar Mirmohammadi February 2014
Investigation of a novel sorption heat pump system for heating,
cooling and heat storage
Seyed Aliakbar Mirmohammadi February 2014

A catalogue record is available from the Eindhoven University of Technology Library
ISBN: 978-90-444-1267-3
(Eindverslagen Stan Ackermans Instituut ; 2014/009)
EINDHOVEN UNIVERSITY OF TECHNOLOGY
Stan Ackermans Institute
SMART ENERGY BUILDINGS & CITIES
INVESTIGATION OF A NOVEL SORPTION HEAT PUMP SYSTEM FOR HEATING, COOLING AND HEAT STORAGE
By
Seyed Aliakbar Mirmohammadi
A dissertation submitted in partial fulfillment of the requirements for the degree of
Professional Doctorate of Engineering
Eindhoven, the Netherlands
January 2014
This thesis has been established in collaboration with

©2014 Seyed Aliakbar Mirmohammadi
All Rights Reserved Eindhoven University of Technology
A dissertation submitted in partial fulfillment of the requirements for the degree of
Professional Doctorate of Engineering
INVESTIGATION OF A NOVEL SORPTION HEAT PUMP SYSTEM FOR HEATING, COOLING AND HEAT STORAGE
Seyed Aliakbar Mirmohammadi Approved: ________________ _________________ Prof. Björn Palm Prof. ir. Elphi Nelissen University Supervisor Scientific Director SEB&C, Head of the Department of Dean of the Department of Energy Technology, KTH the Built Environment ________________ _________________ Mr. Michael Norek Dr. ir. arch. Alexander Suma Project Manager Operational Director SEB&C ClimateWell AB
Abstract of a dissertation at the Eindhoven University of Technology. Dissertation accomplished in the Post-Ms program Smart Energy Buildings & Cities. ABSTRACT Depletion of fossil fuels and unsettled political disputes are some of the major concerns in recent years. Reducing energy use is one goal pursued by ClimateWell Company. Two products of the company are evaluated in this project, a water heater (WH) and an air-conditioning unit for heavy vehicles (VCU). Based on ClimateWell’s award-winning triple-state absorption technology, the VCU is a unique solution that consumes less fuel by converting heat to cooling power for the A/C. The technology has been successfully applied to a solar powered air-conditioning for residential use and also for energy efficient water heaters and boilers (WH). Regarding the VCU, some components of the prototype have been evaluated to choose the best ones for the assembly phase. Pressure drops along the distributor pipes, plate heat exchangers, and circular heat exchangers for boiler were assessed. In addition, heat transfer performances of a falling film evaporator and a heat rejecter have been investigated. Regarding the WH, heat transfer performance of grooved tubes were tested to select the best ones for the prototype. Log-term stability of the VCU and the WH was the second phase of the project. It is important to assure that the product has stable performance over the time. As a result, a test rig, with three major parts; feeders, plumbing unit (including a programmable control unit) and systems (evacuated chambers), has been built up. Each system is including two pairs of chambers, one as the reactor and the other as the condenser/evaporator , which are connected using a steam channel. The results prove that both systems are capable to produce constant power over time, i.e. they are quite stable.

This dissertation is dedicated to
SAINA DEHGHAN
with love and affection.

ACKNOWLEDGEMENTS In this opportunity, I would like to gratefully acknowledge Prof. Björn Palm for his enormous patience and consistent support in the SEBC program as well as the second year project. I also express my thanks to Prof. Elphi Nelissen and Dr. Alexander Suma for guiding me during the entire program. I also owe a great thanks to Michael Norek, my coach at ClimateWell Company, Dmitri Glebov, Olof Hallström, Corey Blackman and Göran Bolin for their support and assistance. I also would like to thank all the staffs of the company for their cooperation during the execution of this project. My deep sense of gratitude goes to my parents and family for their eternal support.
i
TABLE OF CONTENTS LIST OF FIGURES .................................................................................................................. ii
LIST OF TABLES ................................................................................................................... iii
1 INTRODUCTION ......................................................................................................... 1 2 BACKGROUND ........................................................................................................... 2 3 THE TECHNOLOGY OF CLIMATEWELL .................................................................. 2 4 OBJECTIVES ............................................................................................................... 3 5 SOCIAL RELEVANCE ................................................................................................. 3 6 METHODOLOGY ........................................................................................................ 4 7 PERFORMANCE EVALUATION ............................................................................ 5
7.1. Pressure Drop .................................................................................................................. 5 7.1.1. Distributor Pipes ...................................................................................................... 5 7.1.2. Z-type and U-type PHX ........................................................................................... 8 7.1.3. Circular Plate Heat Exchanger ............................................................................... 11
7.2. Heat Transfer Performance ........................................................................................... 13 7.2.1. Grooved Tubes ....................................................................................................... 13 7.2.2. Heat Rejecter.......................................................................................................... 16 7.2.3. Falling Film Evaporator ......................................................................................... 18
8 LONG-TERM STABILITY .................................................................................... 21
8.1. Test Rig ......................................................................................................................... 21
8.1.1. Feeder .................................................................................................................... 21 8.1.2. Plumbing Unit ........................................................................................................ 22 8.1.2.1. Valves ......................................................................................................... 24 8.1.2.2. Control unit .................................................................................................. 25
8.2. Specification Of The Rig .............................................................................................. 26 8.3. Filling Of The Chambers With Liquid .......................................................................... 27 8.4. Manual And Automatic Operation Mode ..................................................................... 28 8.5. Long-Term Test ............................................................................................................ 29
9 CONCLUSION ......................................................................................................... 31 10 REFERENCES ....................................................................................................... 32
ii
LIST OF FIGURES
Figure 1: The technology of the ClimateWell .......................................................................... 3
Figure 2: Test rig for measuring the pressure drop along distributor pipes .............................. 6
Figure 3: Variation of pressure drop by increasing volume flow rate along pipe 1 ................... 6
Figure 4: Variation of pressure drop by increasing volume flow rate along pipe 2 .................. 7
Figure 5: Variation of pressure drop by increasing volume flow rate along pipe 1 and pipe 2 . 7
Figure 6: Test rig for measuring the pressure drop over plate heat exchangers ........................ 8
Figure 7: Variation of pressure drop by increasing volume flow rate in heat exchanger 1 ....... 9
Figure 8: Variation of pressure drop by increasing volume flow rate in heat exchanger 2 ....... 9
Figure 9: Configuration of two heat exchangers, left side: U-Type arrangement, Right side: Z-Type arrangement .................................................................................................................... 10
Figure 10: Pressure drop of each plate versus volume flow rate of plates in both heat exchangers ............................................................................................................................... 10
Figure 11: Test rig for measuring the pressure drop over circular heat exchanger ................. 11
Figure 12: Variation of pressure drop by increasing volume flow rate in the heat exchanger 12
Figure 13: Test rig for measuring the heat transfer coefficient along grooved tubes ............. 13
Figure 14: EasyView screen shot from a test run. ................................................................... 14
Figure 15: Heat Transfer Coefficient vs. Evaporation pressure for four tubes ........................ 15
Figure 16: Heat Transfer Coefficient vs. Heating Load for four tubes .................................... 15
Figure 17: Test rig for evaluating the heat transfer performance of the heat rejecter ............. 17
Figure 18: Comparison between three heat exchangers by showing rejected powers as a function of the temperature difference between the inlet fluid and air .................................... 18
Figure 19: Test rig for evaluation of the falling film evaporator ............................................ 19
Figure 20: Tyfocor flow versus UA-value ............................................................................... 20
Figure 21: Test rig for evaluating the long-term stability ....................................................... 21
Figure 22: Feeders and main components of a truck A/C unit ............................................... 22
Figure 23: Control system box with flow meters and temperature sensor connectors ............ 23
Figure 24: Control system box and valves of the plumbing unit ............................................. 24
Figure 25: Valves panel for each barrel in the control system interface .................................. 25
Figure 26: Filling of the system ............................................................................................... 27
Figure 27: Long-term test result in 18 days ............................................................................. 29
Figure 28: Produced power of each cycle; absorption and desorption ................................... 29
iii
LIST OF TABLES
Table 1: Specification of tested tubes ...................................................................................... 14
Table 2: Simulation results of HEX1, HEX2 and HEX3 ........................................................ 16
Table 3: Fins’ dimension of heat rejecters ............................................................................. 17
Table 4: UA-value of heat rejecters ......................................................................................... 18
Table 5: P2 evaporator test results .......................................................................................... 20
Table 6: Description of Control system box with flow meters and temperature sensor connectors ................................................................................................................................ 23
Table 7: Description of the valves ........................................................................................... 24
Table 8: Primary test specifications of the system ................................................................... 26
Table 9: Secondary test specifications of the system ............................................................... 26
Table 10: System parameters in automatic mode .................................................................... 28
Table 11: Produced power in C/E of VCU and WH systems ................................................. 30
1
INTRODUCTION Scarcity of fossil fuels and the pollution caused by their utilization have encouraged many research activities in the field of energy. In addition, energy use has been increased in many sections, such as buildings and transportation, by the increasing world population. With the growing concerns about environmental conditions and expiring fossil energy resources, our society is increasingly becoming dependent on alternative energy sources and on careful orchestration of the use of these sources with respect to that of the traditional ones. Transportation and the built environment are currently the main consumers of fossil energy, but on the other hand also have the potential to switch to renewable energy supply. Therefore, exploring and developing sustainable methods for two main sections, i.e. built environment and transportation, are the key points to have sustainable buildings and cities. Cold production is an important segment with many applications. In terms of human comfort, it can be considered as one of the main applications. In this regard, many energy sources should be allocated to produce cold for human comfort purpose. Applying compression refrigeration system is the traditional method of producing cold. However, they have two major problems that are global increasing depletion of primary fuels and harmful refrigerants used in compression systems. As a result, absorption refrigeration systems have been introduced and developed over the decades. Research associations in Sweden, as one of the pioneer countries in research and development of energy related topics, are trying to discover novel methods of transforming energy. ClimateWell Company located in Stockholm, the capital city of Sweden, is one of the companies doing research in the field of absorption heating and cooling devices by developing several applications. Today’s air-conditioning systems (A/C) in vehicles draw energy directly from the main engine, thus it increases the total fuel consumption of the car drastically. The story is even more tragic when we consider heavy vehicles such as trucks and buses. Typically, truck drivers keep the engine idling to cool the sleeper cabin while they are resting, and this leads to high costs, fuel consumption and emissions. Based on ClimateWell’s absorption technology, Verdacc Cooling Unit (VCU) has developed into a unique solution to decrease the fuel consumption of air-conditioning units in vehicles. With the VCU, trucks with sleeper cabin can reduce the total fuel consumption by 12% and annual CO2 emissions by 30 tons [4]. The desired heating and cooling are obtained directly from the fuel or from the engine waste heat. In brief, the VCU is a heat-driven Air Conditioner based on ClimateWell’s patented technology. The system does not require the compressor that is the most expensive component of the A/C units. The system can be powered by a gas burner, a diesel heater or the exhaust gas heat. It is connected to a heat source and to the vehicle’s HVAC system either by air or water. Among building services, large portion of energy use is allocated to heating energy for tap water and space heating. They represent a significant share of a typical household’s monthly bill. Heatboost, ClimateWell component package, is a high-efficiency water heater using patented technology. The product is capable of reducing the energy use for hot water production by 50% and as a result reducing energy costs as well as environmental impacts. The heater uses the high quality energy of the fuel and mix it with renewable energy from the ambient or the ground. Thus, it can decrease the energy use promisingly. In this study, long-term stability and performance of two main applications of the company, the VCU and the WH, has been investigated. In the first step, measurements were taken to evaluate the performance of some components related to the VCU prototype. Afterwards, design and development of a test rig in order to evaluate the performance of both the WH and the VCU applications have been conducted.
2
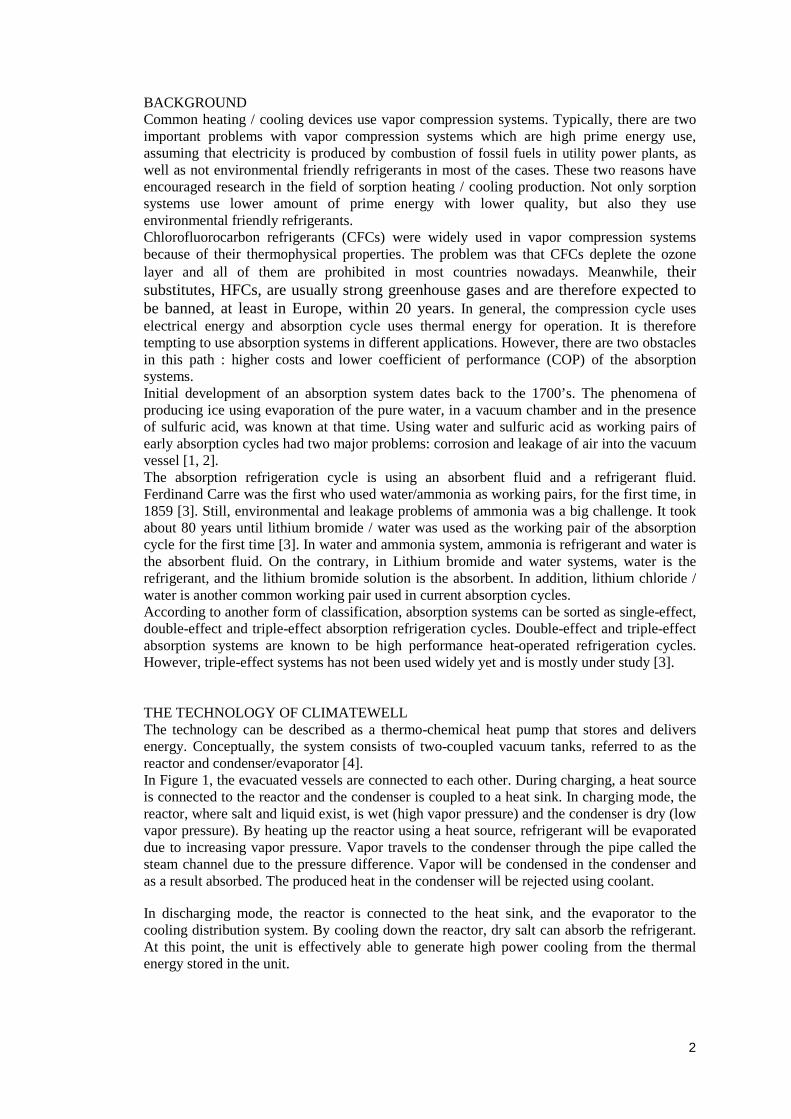
BACKGROUND Common heating / cooling devices use vapor compression systems. Typically, there are two important problems with vapor compression systems which are high prime energy use, assuming that electricity is produced by combustion of fossil fuels in utility power plants, as well as not environmental friendly refrigerants in most of the cases. These two reasons have encouraged research in the field of sorption heating / cooling production. Not only sorption systems use lower amount of prime energy with lower quality, but also they use environmental friendly refrigerants. Chlorofluorocarbon refrigerants (CFCs) were widely used in vapor compression systems because of their thermophysical properties. The problem was that CFCs deplete the ozone layer and all of them are prohibited in most countries nowadays. Meanwhile, their substitutes, HFCs, are usually strong greenhouse gases and are therefore expected to be banned, at least in Europe, within 20 years. In general, the compression cycle uses electrical energy and absorption cycle uses thermal energy for operation. It is therefore tempting to use absorption systems in different applications. However, there are two obstacles in this path : higher costs and lower coefficient of performance (COP) of the absorption systems. Initial development of an absorption system dates back to the 1700’s. The phenomena of producing ice using evaporation of the pure water, in a vacuum chamber and in the presence of sulfuric acid, was known at that time. Using water and sulfuric acid as working pairs of early absorption cycles had two major problems: corrosion and leakage of air into the vacuum vessel [1, 2]. The absorption refrigeration cycle is using an absorbent fluid and a refrigerant fluid. Ferdinand Carre was the first who used water/ammonia as working pairs, for the first time, in 1859 [3]. Still, environmental and leakage problems of ammonia was a big challenge. It took about 80 years until lithium bromide / water was used as the working pair of the absorption cycle for the first time [3]. In water and ammonia system, ammonia is refrigerant and water is the absorbent fluid. On the contrary, in Lithium bromide and water systems, water is the refrigerant, and the lithium bromide solution is the absorbent. In addition, lithium chloride / water is another common working pair used in current absorption cycles. According to another form of classification, absorption systems can be sorted as single-effect, double-effect and triple-effect absorption refrigeration cycles. Double-effect and triple-effect absorption systems are known to be high performance heat-operated refrigeration cycles. However, triple-effect systems has not been used widely yet and is mostly under study [3]. THE TECHNOLOGY OF CLIMATEWELL The technology can be described as a thermo-chemical heat pump that stores and delivers energy. Conceptually, the system consists of two-coupled vacuum tanks, referred to as the reactor and condenser/evaporator [4]. In Figure 1, the evacuated vessels are connected to each other. During charging, a heat source is connected to the reactor and the condenser is coupled to a heat sink. In charging mode, the reactor, where salt and liquid exist, is wet (high vapor pressure) and the condenser is dry (low vapor pressure). By heating up the reactor using a heat source, refrigerant will be evaporated due to increasing vapor pressure. Vapor travels to the condenser through the pipe called the steam channel due to the pressure difference. Vapor will be condensed in the condenser and as a result absorbed. The produced heat in the condenser will be rejected using coolant. In discharging mode, the reactor is connected to the heat sink, and the evaporator to the cooling distribution system. By cooling down the reactor, dry salt can absorb the refrigerant. At this point, the unit is effectively able to generate high power cooling from the thermal energy stored in the unit.
3
Figure 1: The technology of the ClimateWell
OBJECTIVES In the path of having sustainable buildings and cities, production of cooling and heating has been considered in this study. Improving novel efficient methods of heating/cooling production in built environment and transportation system is addressed in this study. ClimateWell’s absorption technology can be used in different applications. Two products of the company, a high-efficiency water heater as well as a heat-driven Air Conditioner for heavy vehicles, have been investigated in this project. We are focusing on important aspects of the product including performance, and long-term stability. In fact, whenever we become confident that the technology is working well, we need to conduct test in order to evaluate long-term stability of the performance before coming to the market. By developing such products, the approach of having sustainable building and cities could be achievable. Indeed, it is the vision of ClimateWell AB to have one billion tons less CO2. Besides, their mission is to make a global sustainable energy supply possible by applying ClimateWell’s unique heating and cooling technology. They are trying to decrease use of fossil fuels in built environment as much as possible [5]. SOCIAL RELEVANCE Preservation of energy resources while keeping human comfort might be the key issue of modern society. ClimateWell Company is trying to reduce the consumption of oil, electricity or gas for indoor services. Use of their products could result in less CO2-emissions and reduction of the fossil fuel consumption. Finding application for their technology is important to achieve these goals.
4
Thus, we can have greener environment for the society which means the earth would be healthier location to live. Besides, less amount of energy means lower costs for the energy that the society should pay. METHODOLOGY In the first step, some performance tests were made to evaluate the capability of some components in both products. In fact, some components should be used both in the VCU and the WH prototypes. There was more than one option for some components of the prototype which needed to be tested before installation on the prototype. Most of them were very similar but have had some technical differences. In most of the cases, the difference between theoretical and experimental values has been investigated. In some cases, components with different properties and characteristics were available and among them, one should be selected. The selection criteria was their capability of rejecting the heat, their lower pressure drop, etc. which were determined in individual tests. Afterwards, the one with the best performance was nominated to be installed in the main product. In the second step, a small prototype should designed to evaluate long-term stability of the products. Thus, a test rig was designed to undertake the measurements. During the process, three versions of the system were tested to find the best design and specifications for the test. Both products were under the study in terms of long term evaluation in this step.
5
PERFORMANCE EVALUATION As was already mentioned, results could be divided into two main sections. In the first part, performance tests regarding pressure drop and heat transfer performance of the VCU product will be discussed. In the second part, long-term evaluation of the WH and the VCU will be described:
1. Pressure Drop
In this step pressure drop along distributor pipes, Z-type and U-type plate heat exchanger as well as boiler are tested and described. 1.1. Distributor pipes Distribution pipes spray fluid in an evaporator for cooling purposes. It is important to know what the pressure drop is along the pipe as that can affect pumping power. Thus, the pressure drop along two pipes with different numbers of holes and their diameters have been measured. In this experiment, two goals are considered from different aspects. Focus is on consuming a lower amount of pumping power from one side and spraying adequate amount of water to the heat exchanger from the other side. The pressure drop along a liquid distributor can be calculated by applying following equation:
∆𝑝 = ∆𝑝𝑝𝑖𝑝𝑒 + ∆𝑝𝑜𝑟𝑖𝑓𝑖𝑐𝑒 = �𝑓4𝐿𝐷
.𝜌𝑢2
2𝑔�+ �
𝐺2
2𝑔𝜌(1 − 𝜎2 + 𝐾𝑐)�
Where L is the pipe length, g is the gravitational acceleration, u is the velocity of liquid at outlet, D is the pipe diameter, 𝜌 is the liquid density, 𝜎 is the liquid dynamic viscosity and f is the friction factor of the pipe. Moreover, G and Kc could be calculated as follow: 𝐾𝑐 = 0.5(1− 𝜎) and
𝐺 =4 �̇�𝜋𝐷2
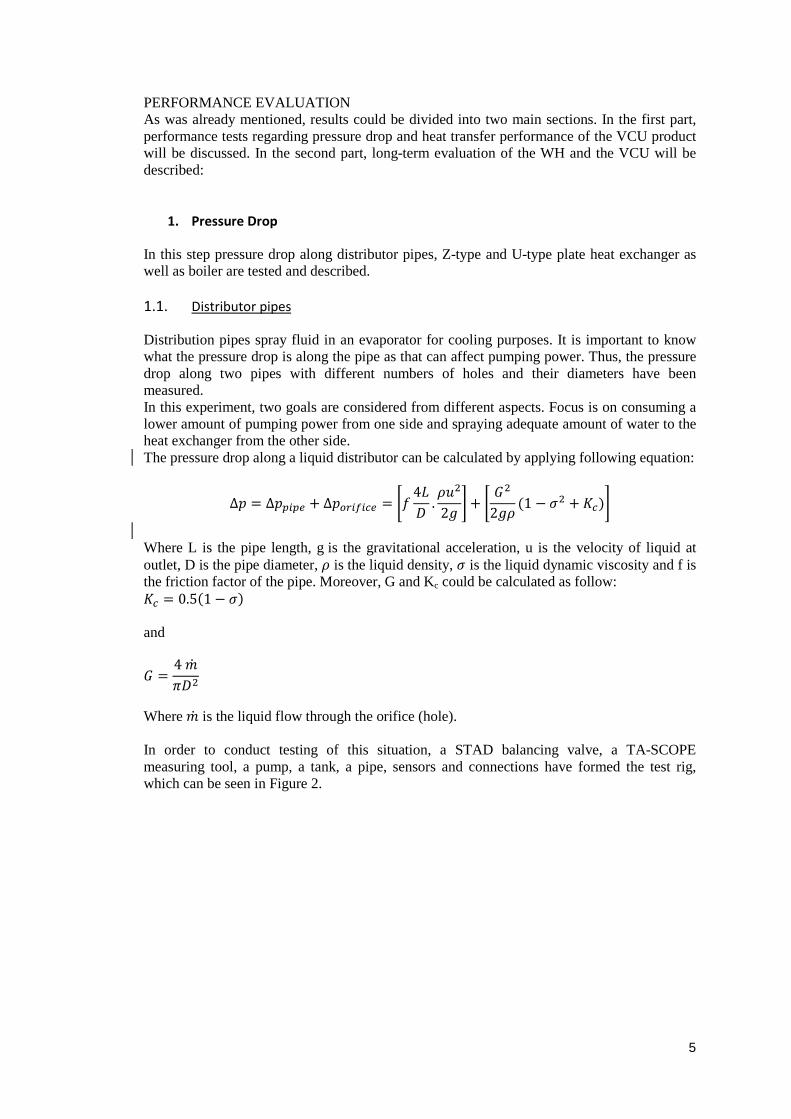
Where �̇� is the liquid flow through the orifice (hole). In order to conduct testing of this situation, a STAD balancing valve, a TA-SCOPE measuring tool, a pump, a tank, a pipe, sensors and connections have formed the test rig, which can be seen in Figure 2.
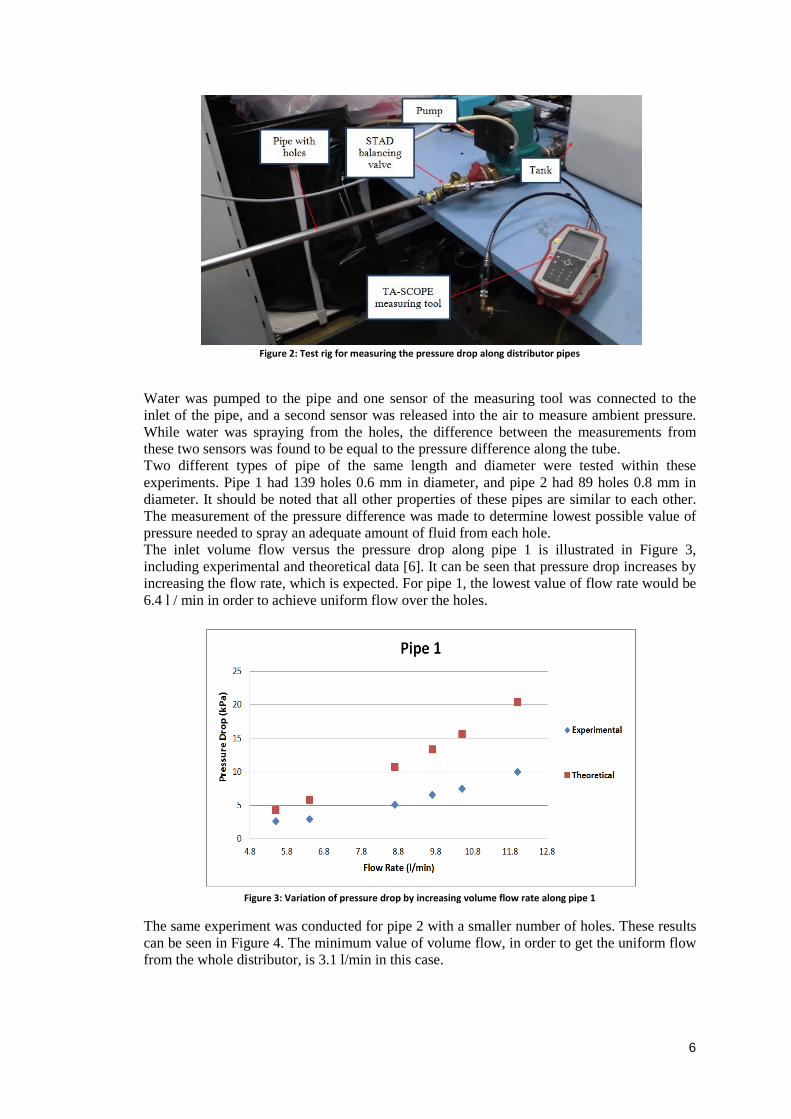
6
Figure 2: Test rig for measuring the pressure drop along distributor pipes
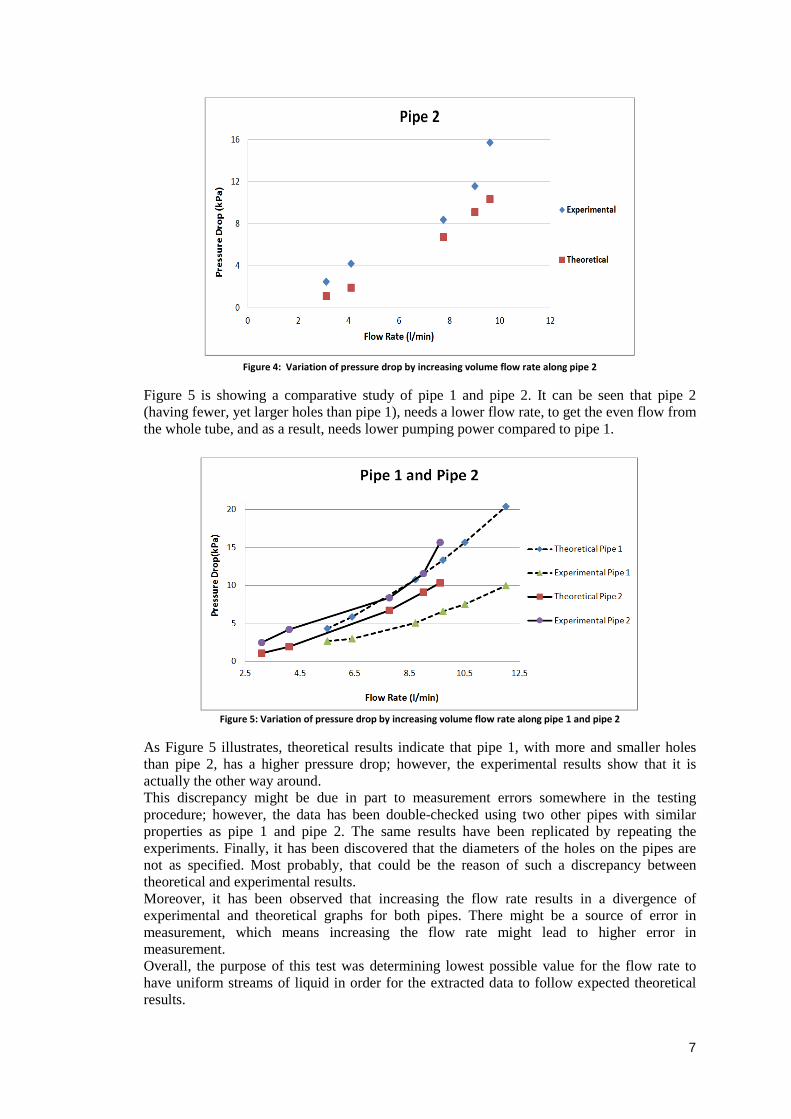
Water was pumped to the pipe and one sensor of the measuring tool was connected to the inlet of the pipe, and a second sensor was released into the air to measure ambient pressure. While water was spraying from the holes, the difference between the measurements from these two sensors was found to be equal to the pressure difference along the tube. Two different types of pipe of the same length and diameter were tested within these experiments. Pipe 1 had 139 holes 0.6 mm in diameter, and pipe 2 had 89 holes 0.8 mm in diameter. It should be noted that all other properties of these pipes are similar to each other. The measurement of the pressure difference was made to determine lowest possible value of pressure needed to spray an adequate amount of fluid from each hole. The inlet volume flow versus the pressure drop along pipe 1 is illustrated in Figure 3, including experimental and theoretical data [6]. It can be seen that pressure drop increases by increasing the flow rate, which is expected. For pipe 1, the lowest value of flow rate would be 6.4 l / min in order to achieve uniform flow over the holes.
Figure 3: Variation of pressure drop by increasing volume flow rate along pipe 1
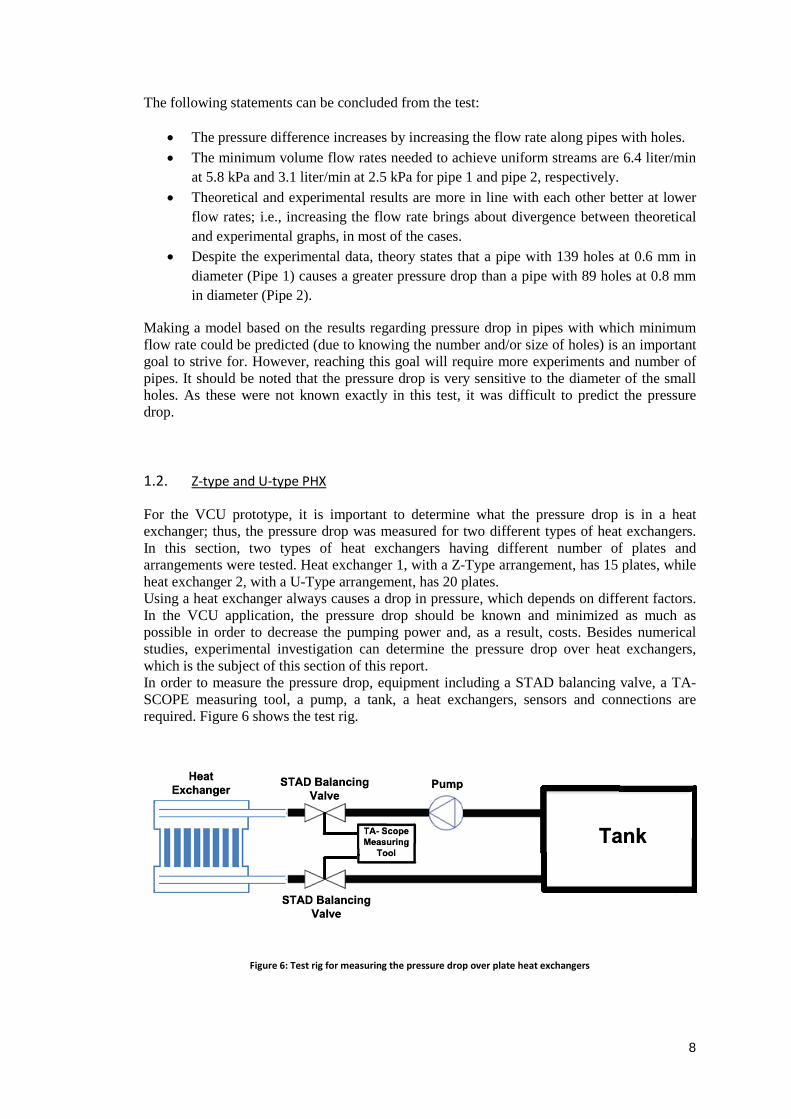
The same experiment was conducted for pipe 2 with a smaller number of holes. These results can be seen in Figure 4. The minimum value of volume flow, in order to get the uniform flow from the whole distributor, is 3.1 l/min in this case.
7
Figure 4: Variation of pressure drop by increasing volume flow rate along pipe 2
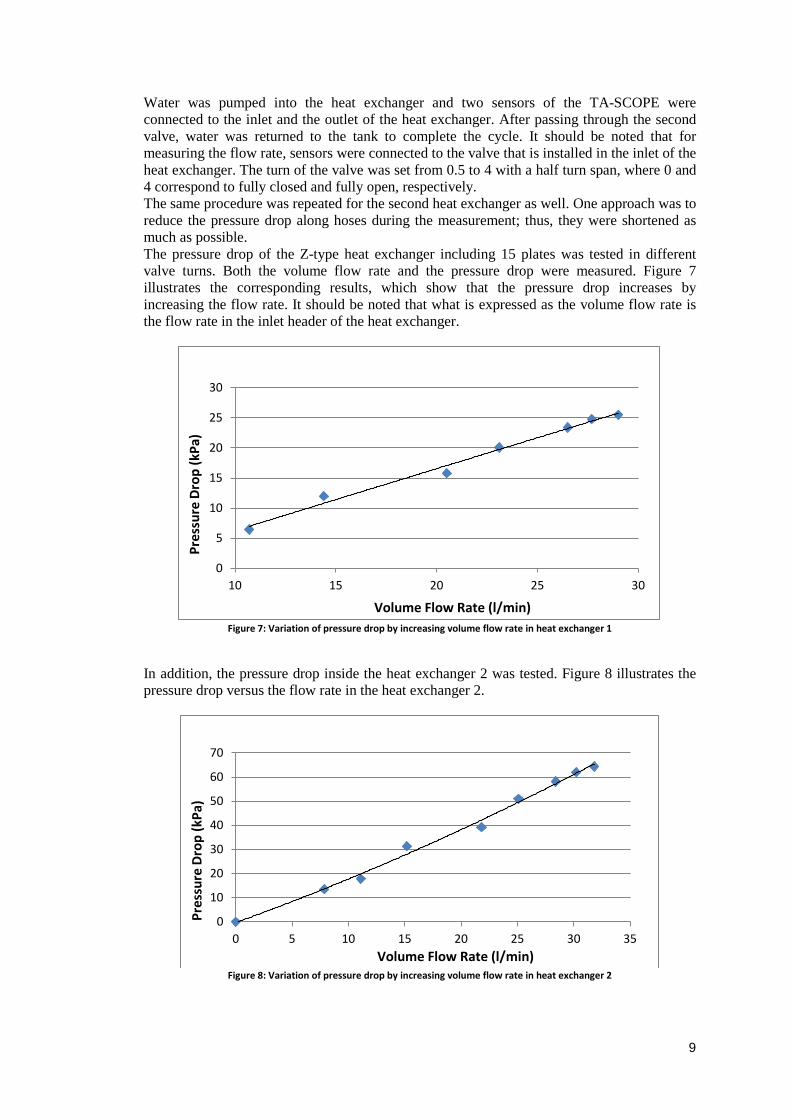
Figure 5 is showing a comparative study of pipe 1 and pipe 2. It can be seen that pipe 2 (having fewer, yet larger holes than pipe 1), needs a lower flow rate, to get the even flow from the whole tube, and as a result, needs lower pumping power compared to pipe 1.
Figure 5: Variation of pressure drop by increasing volume flow rate along pipe 1 and pipe 2
As Figure 5 illustrates, theoretical results indicate that pipe 1, with more and smaller holes than pipe 2, has a higher pressure drop; however, the experimental results show that it is actually the other way around. This discrepancy might be due in part to measurement errors somewhere in the testing procedure; however, the data has been double-checked using two other pipes with similar properties as pipe 1 and pipe 2. The same results have been replicated by repeating the experiments. Finally, it has been discovered that the diameters of the holes on the pipes are not as specified. Most probably, that could be the reason of such a discrepancy between theoretical and experimental results. Moreover, it has been observed that increasing the flow rate results in a divergence of experimental and theoretical graphs for both pipes. There might be a source of error in measurement, which means increasing the flow rate might lead to higher error in measurement. Overall, the purpose of this test was determining lowest possible value for the flow rate to have uniform streams of liquid in order for the extracted data to follow expected theoretical results.
8
The following statements can be concluded from the test:
• The pressure difference increases by increasing the flow rate along pipes with holes. • The minimum volume flow rates needed to achieve uniform streams are 6.4 liter/min
at 5.8 kPa and 3.1 liter/min at 2.5 kPa for pipe 1 and pipe 2, respectively. • Theoretical and experimental results are more in line with each other better at lower
flow rates; i.e., increasing the flow rate brings about divergence between theoretical and experimental graphs, in most of the cases.
• Despite the experimental data, theory states that a pipe with 139 holes at 0.6 mm in diameter (Pipe 1) causes a greater pressure drop than a pipe with 89 holes at 0.8 mm in diameter (Pipe 2).
Making a model based on the results regarding pressure drop in pipes with which minimum flow rate could be predicted (due to knowing the number and/or size of holes) is an important goal to strive for. However, reaching this goal will require more experiments and number of pipes. It should be noted that the pressure drop is very sensitive to the diameter of the small holes. As these were not known exactly in this test, it was difficult to predict the pressure drop.
1.2. Z-type and U-type PHX
For the VCU prototype, it is important to determine what the pressure drop is in a heat exchanger; thus, the pressure drop was measured for two different types of heat exchangers. In this section, two types of heat exchangers having different number of plates and arrangements were tested. Heat exchanger 1, with a Z-Type arrangement, has 15 plates, while heat exchanger 2, with a U-Type arrangement, has 20 plates. Using a heat exchanger always causes a drop in pressure, which depends on different factors. In the VCU application, the pressure drop should be known and minimized as much as possible in order to decrease the pumping power and, as a result, costs. Besides numerical studies, experimental investigation can determine the pressure drop over heat exchangers, which is the subject of this section of this report. In order to measure the pressure drop, equipment including a STAD balancing valve, a TA-SCOPE measuring tool, a pump, a tank, a heat exchangers, sensors and connections are required. Figure 6 shows the test rig.
Figure 6: Test rig for measuring the pressure drop over plate heat exchangers
9
Water was pumped into the heat exchanger and two sensors of the TA-SCOPE were connected to the inlet and the outlet of the heat exchanger. After passing through the second valve, water was returned to the tank to complete the cycle. It should be noted that for measuring the flow rate, sensors were connected to the valve that is installed in the inlet of the heat exchanger. The turn of the valve was set from 0.5 to 4 with a half turn span, where 0 and 4 correspond to fully closed and fully open, respectively. The same procedure was repeated for the second heat exchanger as well. One approach was to reduce the pressure drop along hoses during the measurement; thus, they were shortened as much as possible. The pressure drop of the Z-type heat exchanger including 15 plates was tested in different valve turns. Both the volume flow rate and the pressure drop were measured. Figure 7 illustrates the corresponding results, which show that the pressure drop increases by increasing the flow rate. It should be noted that what is expressed as the volume flow rate is the flow rate in the inlet header of the heat exchanger.
Figure 7: Variation of pressure drop by increasing volume flow rate in heat exchanger 1
In addition, the pressure drop inside the heat exchanger 2 was tested. Figure 8 illustrates the pressure drop versus the flow rate in the heat exchanger 2.
Figure 8: Variation of pressure drop by increasing volume flow rate in heat exchanger 2
0
5
10
15
20
25
30
10 15 20 25 30
Pres
sure
Dro
p (k
Pa)
Volume Flow Rate (l/min)
0
10
20
30
40
50
60
70
0 5 10 15 20 25 30 35
Pres
sure
Dro
p (k
Pa)
Volume Flow Rate (l/min)
10
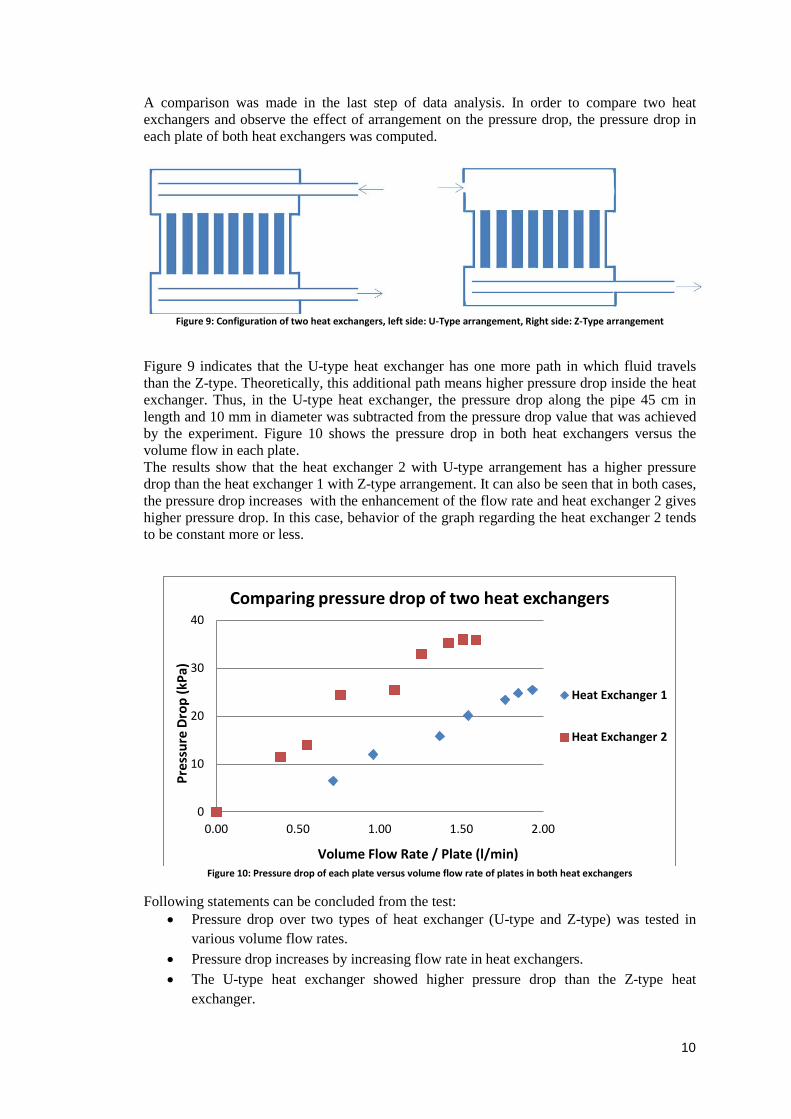
A comparison was made in the last step of data analysis. In order to compare two heat exchangers and observe the effect of arrangement on the pressure drop, the pressure drop in each plate of both heat exchangers was computed.
Figure 9: Configuration of two heat exchangers, left side: U-Type arrangement, Right side: Z-Type arrangement
Figure 9 indicates that the U-type heat exchanger has one more path in which fluid travels than the Z-type. Theoretically, this additional path means higher pressure drop inside the heat exchanger. Thus, in the U-type heat exchanger, the pressure drop along the pipe 45 cm in length and 10 mm in diameter was subtracted from the pressure drop value that was achieved by the experiment. Figure 10 shows the pressure drop in both heat exchangers versus the volume flow in each plate. The results show that the heat exchanger 2 with U-type arrangement has a higher pressure drop than the heat exchanger 1 with Z-type arrangement. It can also be seen that in both cases, the pressure drop increases with the enhancement of the flow rate and heat exchanger 2 gives higher pressure drop. In this case, behavior of the graph regarding the heat exchanger 2 tends to be constant more or less.
Figure 10: Pressure drop of each plate versus volume flow rate of plates in both heat exchangers
Following statements can be concluded from the test: • Pressure drop over two types of heat exchanger (U-type and Z-type) was tested in
various volume flow rates. • Pressure drop increases by increasing flow rate in heat exchangers. • The U-type heat exchanger showed higher pressure drop than the Z-type heat
exchanger.
0
10
20
30
40
0.00 0.50 1.00 1.50 2.00
Pres
sure
Dro
p (k
Pa)
Volume Flow Rate / Plate (l/min)
Comparing pressure drop of two heat exchangers
Heat Exchanger 1
Heat Exchanger 2
11
• Pressure drop difference between the heat exchanger 1 and the heat exchanger 2 increases by increasing the volume flow rate.
Analytical studies have introduced different parameters for the calculating pressure drop inside U-Type and Z-Type heat exchangers [7]. As a result, in order to do a complete investigation other parameters should be considered in the test. 1.3. Circular Plate Heat Exchanger
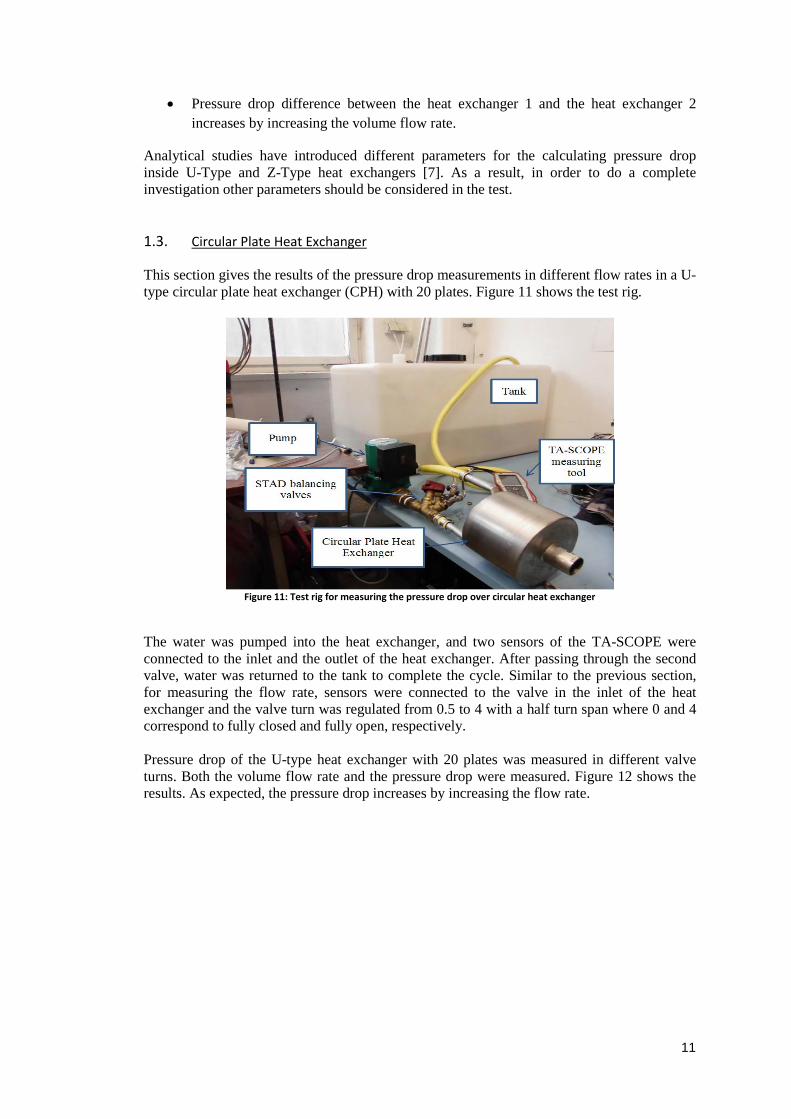
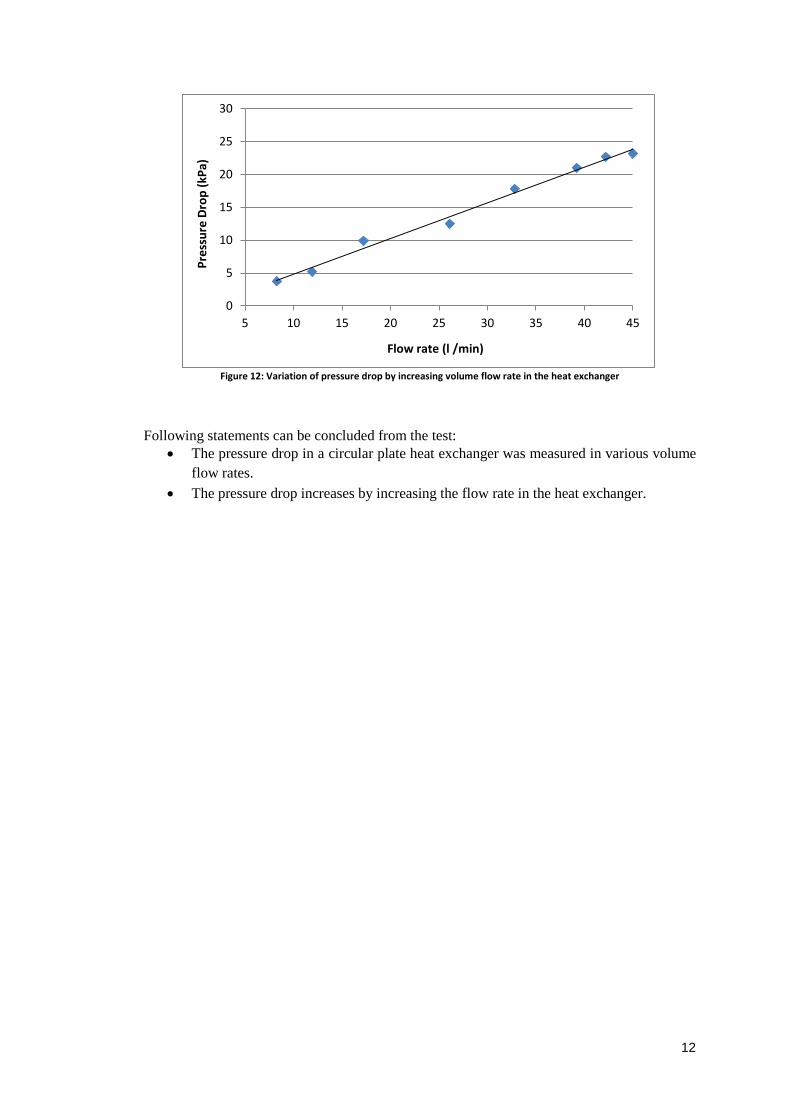
This section gives the results of the pressure drop measurements in different flow rates in a U-type circular plate heat exchanger (CPH) with 20 plates. Figure 11 shows the test rig.
Figure 11: Test rig for measuring the pressure drop over circular heat exchanger
The water was pumped into the heat exchanger, and two sensors of the TA-SCOPE were connected to the inlet and the outlet of the heat exchanger. After passing through the second valve, water was returned to the tank to complete the cycle. Similar to the previous section, for measuring the flow rate, sensors were connected to the valve in the inlet of the heat exchanger and the valve turn was regulated from 0.5 to 4 with a half turn span where 0 and 4 correspond to fully closed and fully open, respectively. Pressure drop of the U-type heat exchanger with 20 plates was measured in different valve turns. Both the volume flow rate and the pressure drop were measured. Figure 12 shows the results. As expected, the pressure drop increases by increasing the flow rate.
12
Figure 12: Variation of pressure drop by increasing volume flow rate in the heat exchanger
Following statements can be concluded from the test:
• The pressure drop in a circular plate heat exchanger was measured in various volume flow rates.
• The pressure drop increases by increasing the flow rate in the heat exchanger.
0
5
10
15
20
25
30
5 10 15 20 25 30 35 40 45
Pres
sure
Dro
p (k
Pa)
Flow rate (l /min)
13
2. Heat Transfer Performance
In this section, the heat transfer performance of grooved tubes, heat rejecters and falling film evaporator have been tested. 2.1. Grooved Tubes
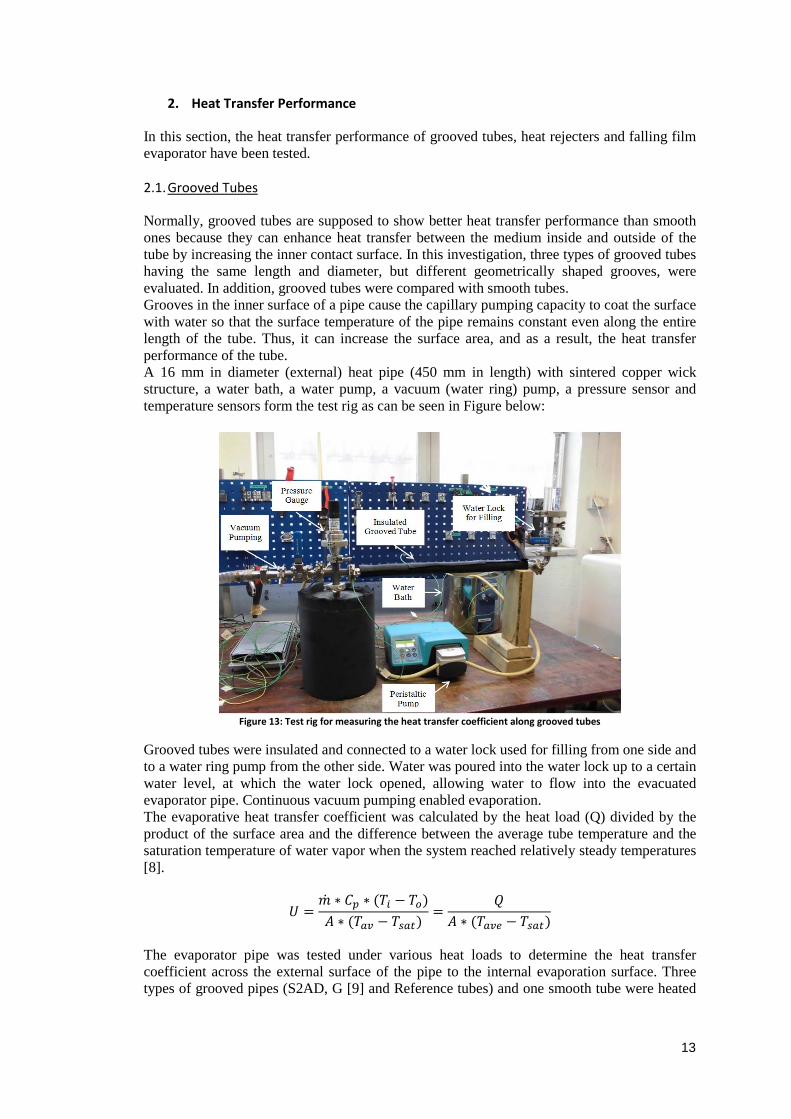
Normally, grooved tubes are supposed to show better heat transfer performance than smooth ones because they can enhance heat transfer between the medium inside and outside of the tube by increasing the inner contact surface. In this investigation, three types of grooved tubes having the same length and diameter, but different geometrically shaped grooves, were evaluated. In addition, grooved tubes were compared with smooth tubes. Grooves in the inner surface of a pipe cause the capillary pumping capacity to coat the surface with water so that the surface temperature of the pipe remains constant even along the entire length of the tube. Thus, it can increase the surface area, and as a result, the heat transfer performance of the tube. A 16 mm in diameter (external) heat pipe (450 mm in length) with sintered copper wick structure, a water bath, a water pump, a vacuum (water ring) pump, a pressure sensor and temperature sensors form the test rig as can be seen in Figure below:
Figure 13: Test rig for measuring the heat transfer coefficient along grooved tubes
Grooved tubes were insulated and connected to a water lock used for filling from one side and to a water ring pump from the other side. Water was poured into the water lock up to a certain water level, at which the water lock opened, allowing water to flow into the evacuated evaporator pipe. Continuous vacuum pumping enabled evaporation. The evaporative heat transfer coefficient was calculated by the heat load (Q) divided by the product of the surface area and the difference between the average tube temperature and the saturation temperature of water vapor when the system reached relatively steady temperatures [8].
𝑈 =�̇� ∗ 𝐶𝑝 ∗ (𝑇𝑖 − 𝑇𝑜)𝐴 ∗ (𝑇𝑎𝑣 − 𝑇𝑠𝑎𝑡)
=𝑄
𝐴 ∗ (𝑇𝑎𝑣𝑒 − 𝑇𝑠𝑎𝑡)
The evaporator pipe was tested under various heat loads to determine the heat transfer coefficient across the external surface of the pipe to the internal evaporation surface. Three types of grooved pipes (S2AD, G [9] and Reference tubes) and one smooth tube were heated
14
with varying thermal loads (Q), ranging from 35 to 310 W, corresponding to heat fluxes between approximately 1500 and 12500 W/m2. Tube specifications are shown on Table 1.
Table 1: Specification of tested tubes
Tube Inner surface External Diameter (mm)
Length (mm)
Cuprofin-S2AD Grooved 16 500 Cuprofin-G Grooved 16 500
Reference Tube Grooved 16 450 Smooth Tube Smooth 16 420
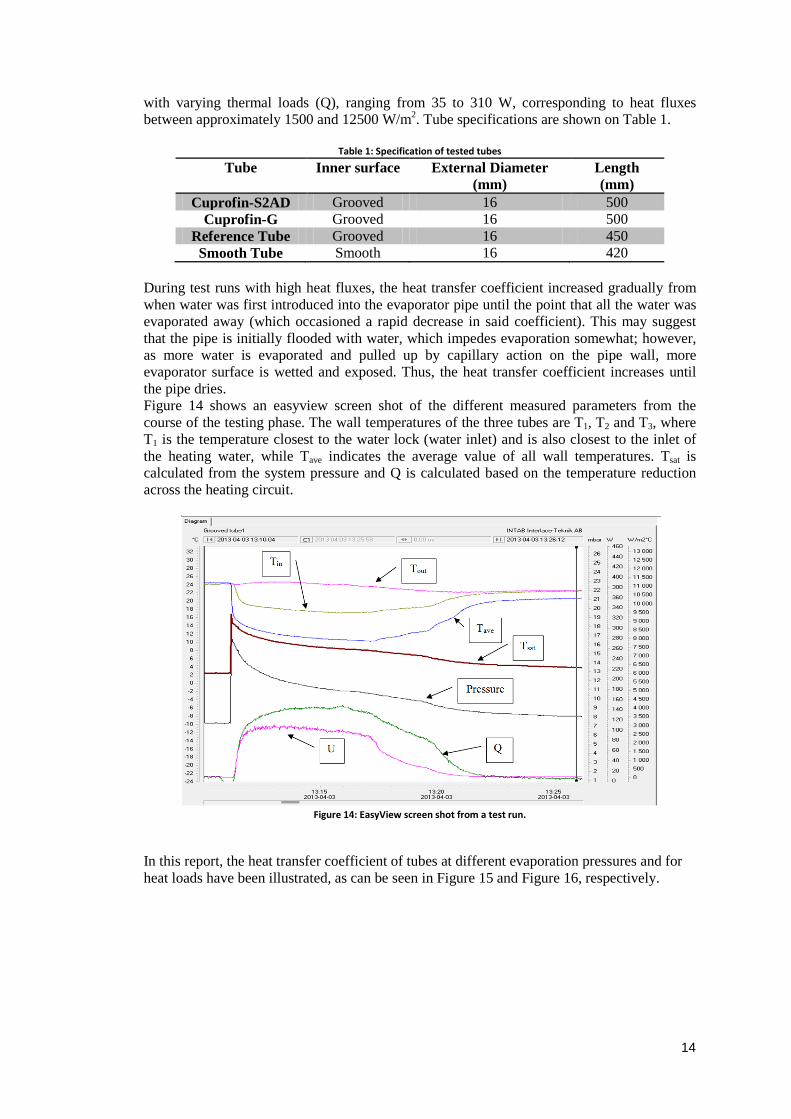
During test runs with high heat fluxes, the heat transfer coefficient increased gradually from when water was first introduced into the evaporator pipe until the point that all the water was evaporated away (which occasioned a rapid decrease in said coefficient). This may suggest that the pipe is initially flooded with water, which impedes evaporation somewhat; however, as more water is evaporated and pulled up by capillary action on the pipe wall, more evaporator surface is wetted and exposed. Thus, the heat transfer coefficient increases until the pipe dries. Figure 14 shows an easyview screen shot of the different measured parameters from the course of the testing phase. The wall temperatures of the three tubes are T1, T2 and T3, where T1 is the temperature closest to the water lock (water inlet) and is also closest to the inlet of the heating water, while Tave indicates the average value of all wall temperatures. Tsat is calculated from the system pressure and Q is calculated based on the temperature reduction across the heating circuit.
Figure 14: EasyView screen shot from a test run.
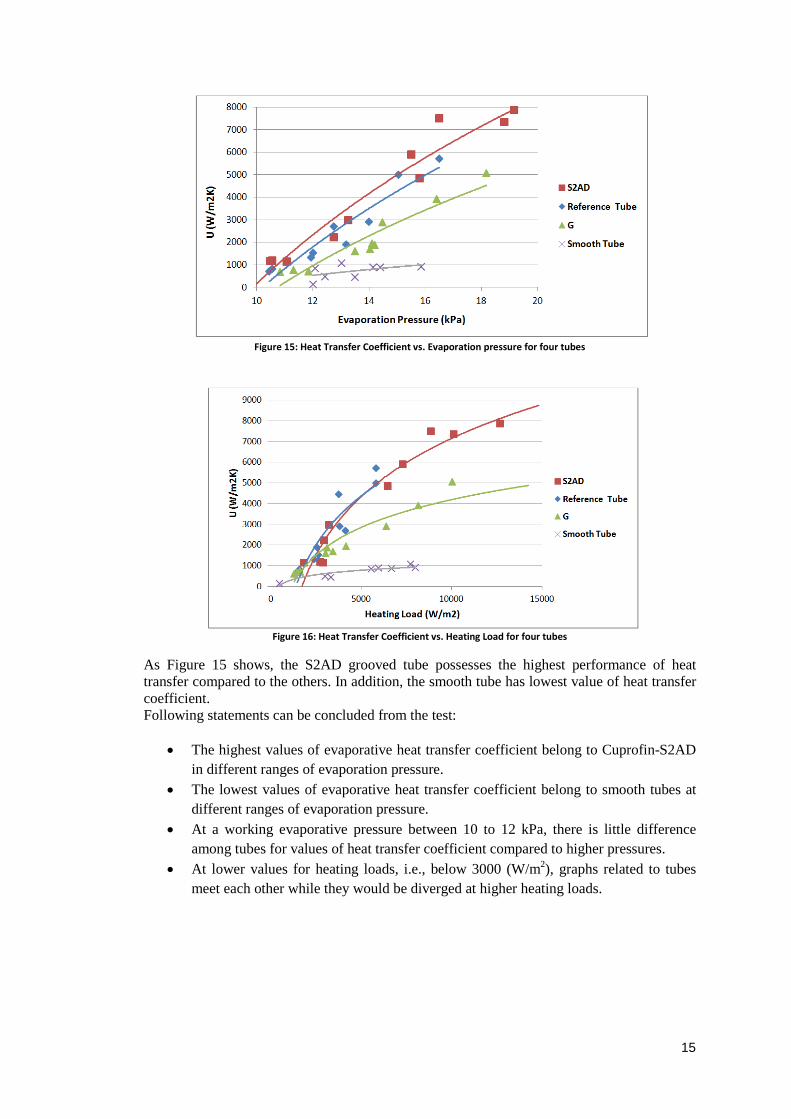
In this report, the heat transfer coefficient of tubes at different evaporation pressures and for heat loads have been illustrated, as can be seen in Figure 15 and Figure 16, respectively.
15
Figure 15: Heat Transfer Coefficient vs. Evaporation pressure for four tubes
Figure 16: Heat Transfer Coefficient vs. Heating Load for four tubes
As Figure 15 shows, the S2AD grooved tube possesses the highest performance of heat transfer compared to the others. In addition, the smooth tube has lowest value of heat transfer coefficient. Following statements can be concluded from the test:
• The highest values of evaporative heat transfer coefficient belong to Cuprofin-S2AD in different ranges of evaporation pressure.
• The lowest values of evaporative heat transfer coefficient belong to smooth tubes at different ranges of evaporation pressure.
• At a working evaporative pressure between 10 to 12 kPa, there is little difference among tubes for values of heat transfer coefficient compared to higher pressures.
• At lower values for heating loads, i.e., below 3000 (W/m2), graphs related to tubes meet each other while they would be diverged at higher heating loads.
16
2.2. Heat Rejecter
Normally, the VCU concept requires efficient rejection of heat from a glycol flow stream to ambient air. The heat exchanger and the fan are two important components that should be considered for optimizing the system and making it as efficient as possible. In this project, three types of heat exchangers from Olaer were tested with different number of fins. Based on simulations done by Olitech Mobile Calculation Program, the rejected heat by heat exchangers as well as UA-value should be as follow:
Table 2: Simulation results of HEX1, HEX2 and HEX3 Parameter Unit HEX1
Outlet fluid temperature °C 45,9 43,1 41,9 50,2 54 Outlet air temperature °C 41,5 39,5 38,3 45,1 48,4 Air flow m3/s 0,63 0,63 0,63 0,63 0,63 Rejected power kW 5,6 4,7 3,85 7,22 8,62 UA-value W/K 536
Parameter Unit HEX2
Outlet fluid temperature °C 41,1 43,8 47,7 53,2 57,4 Outlet air temperature °C 36,2 38,2 40,6 44,2 47 Air flow m3/s 0,63 0,63 0,63 0,63 0,63 Rejected power kW 3,44 4,14 5,12 6,73 8,2 UA-value W/K 404
Parameter Unit HEX3
Outlet fluid temperature °C 36,8 40,3 44,6 50 56,3 Outlet air temperature °C 32,7 36,2 38,8 42,2 45,9 Air flow m3/s 0,63 0,63 0,63 0,63 0,63 Rejected power kW 3,44 4,07 5,12 6,5 8,13 UA-value W/K 440
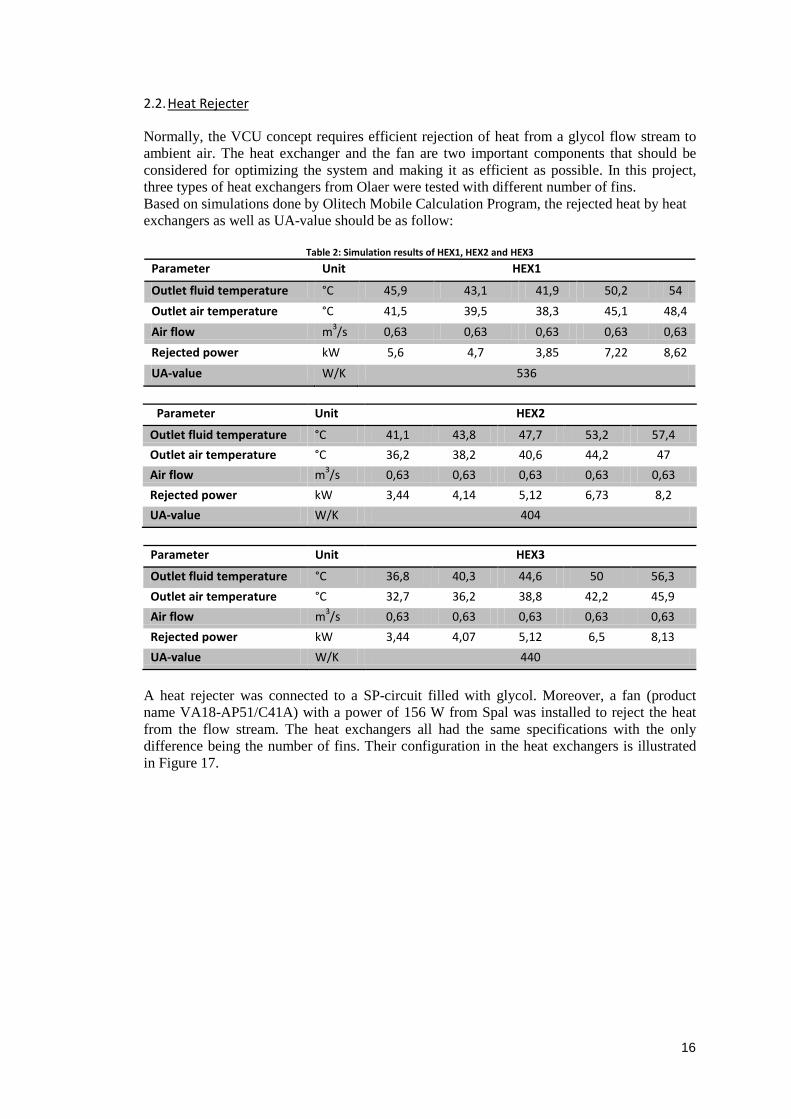
A heat rejecter was connected to a SP-circuit filled with glycol. Moreover, a fan (product name VA18-AP51/C41A) with a power of 156 W from Spal was installed to reject the heat from the flow stream. The heat exchangers all had the same specifications with the only difference being the number of fins. Their configuration in the heat exchangers is illustrated in Figure 17.
17
Figure 17: Test rig for evaluating the heat transfer performance of the heat rejecter
Table 3 shows specifications of fins for heat exchangers.
Table 3: Fins’ dimension of heat rejecters Heat Exchanger a (mm) b (mm)
HEX1 3 9.5 HEX2 4.5 9.5 HEX3 4.5 10.3
Tyfocor LS was circulated through the heat exchanger while its inlet and outlet temperature (as well as inlet and outlet temperature of airflow through the fan) were being measured continually. Rejected heat can be calculated using following equation.
�̇� = 𝑚�̇� ∗ 𝐶𝑝 ∗ (𝑇𝑖 − 𝑇𝑜) The test results for the three heat exchangers are shown in Figure 18, and are compared with the reference heat exchanger [10]. It should be mentioned that the reference heat exchanger has a similar configuration as the HEX2; however, it is about 20 mm thicker than the others.
18
Figure 18: Comparison between three heat exchangers by showing rejected powers as a function of the temperature
difference between the inlet fluid and air
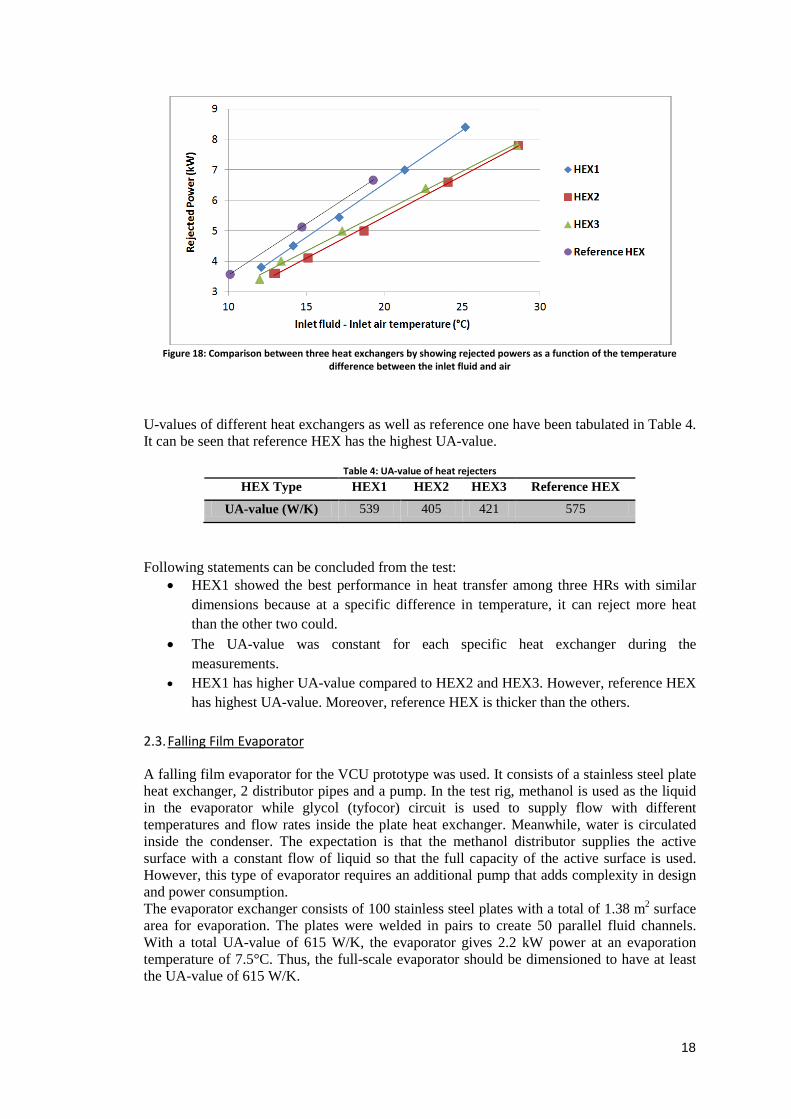
U-values of different heat exchangers as well as reference one have been tabulated in Table 4. It can be seen that reference HEX has the highest UA-value.
Table 4: UA-value of heat rejecters HEX Type HEX1 HEX2 HEX3 Reference HEX
UA-value (W/K) 539 405 421 575
Following statements can be concluded from the test:
• HEX1 showed the best performance in heat transfer among three HRs with similar dimensions because at a specific difference in temperature, it can reject more heat than the other two could.
• The UA-value was constant for each specific heat exchanger during the measurements.
• HEX1 has higher UA-value compared to HEX2 and HEX3. However, reference HEX has highest UA-value. Moreover, reference HEX is thicker than the others.
2.3. Falling Film Evaporator
A falling film evaporator for the VCU prototype was used. It consists of a stainless steel plate heat exchanger, 2 distributor pipes and a pump. In the test rig, methanol is used as the liquid in the evaporator while glycol (tyfocor) circuit is used to supply flow with different temperatures and flow rates inside the plate heat exchanger. Meanwhile, water is circulated inside the condenser. The expectation is that the methanol distributor supplies the active surface with a constant flow of liquid so that the full capacity of the active surface is used. However, this type of evaporator requires an additional pump that adds complexity in design and power consumption. The evaporator exchanger consists of 100 stainless steel plates with a total of 1.38 m2 surface area for evaporation. The plates were welded in pairs to create 50 parallel fluid channels. With a total UA-value of 615 W/K, the evaporator gives 2.2 kW power at an evaporation temperature of 7.5°C. Thus, the full-scale evaporator should be dimensioned to have at least the UA-value of 615 W/K.
19
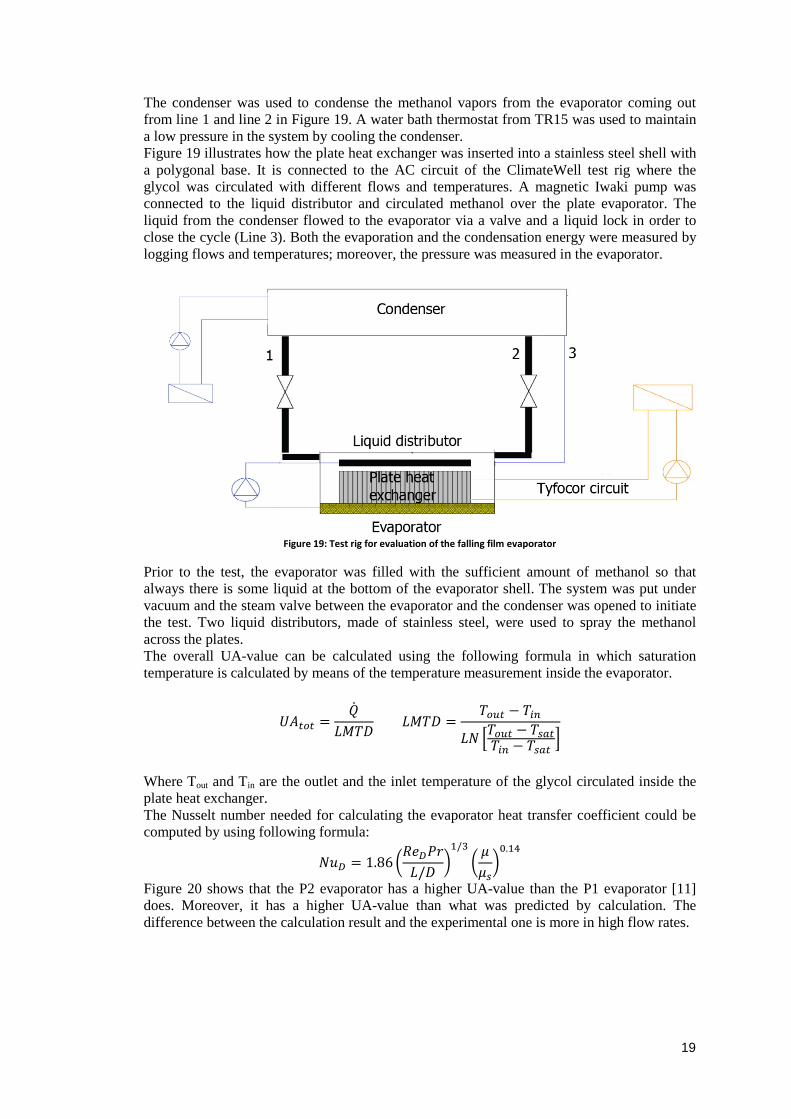
The condenser was used to condense the methanol vapors from the evaporator coming out from line 1 and line 2 in Figure 19. A water bath thermostat from TR15 was used to maintain a low pressure in the system by cooling the condenser. Figure 19 illustrates how the plate heat exchanger was inserted into a stainless steel shell with a polygonal base. It is connected to the AC circuit of the ClimateWell test rig where the glycol was circulated with different flows and temperatures. A magnetic Iwaki pump was connected to the liquid distributor and circulated methanol over the plate evaporator. The liquid from the condenser flowed to the evaporator via a valve and a liquid lock in order to close the cycle (Line 3). Both the evaporation and the condensation energy were measured by logging flows and temperatures; moreover, the pressure was measured in the evaporator.
Figure 19: Test rig for evaluation of the falling film evaporator
Prior to the test, the evaporator was filled with the sufficient amount of methanol so that always there is some liquid at the bottom of the evaporator shell. The system was put under vacuum and the steam valve between the evaporator and the condenser was opened to initiate the test. Two liquid distributors, made of stainless steel, were used to spray the methanol across the plates. The overall UA-value can be calculated using the following formula in which saturation temperature is calculated by means of the temperature measurement inside the evaporator.
𝑈𝐴𝑡𝑜𝑡 =𝑄
𝐿𝑀𝑇𝐷̇
𝐿𝑀𝑇𝐷 =𝑇𝑜𝑢𝑡 − 𝑇𝑖𝑛
𝐿𝑁 �𝑇𝑜𝑢𝑡 − 𝑇𝑠𝑎𝑡𝑇𝑖𝑛 − 𝑇𝑠𝑎𝑡
�
Where Tout and Tin are the outlet and the inlet temperature of the glycol circulated inside the plate heat exchanger. The Nusselt number needed for calculating the evaporator heat transfer coefficient could be computed by using following formula:
𝑁𝑢𝐷 = 1.86 �𝑅𝑒𝐷𝑃𝑟𝐿/𝐷
�1/3
�𝜇𝜇𝑠�0.14
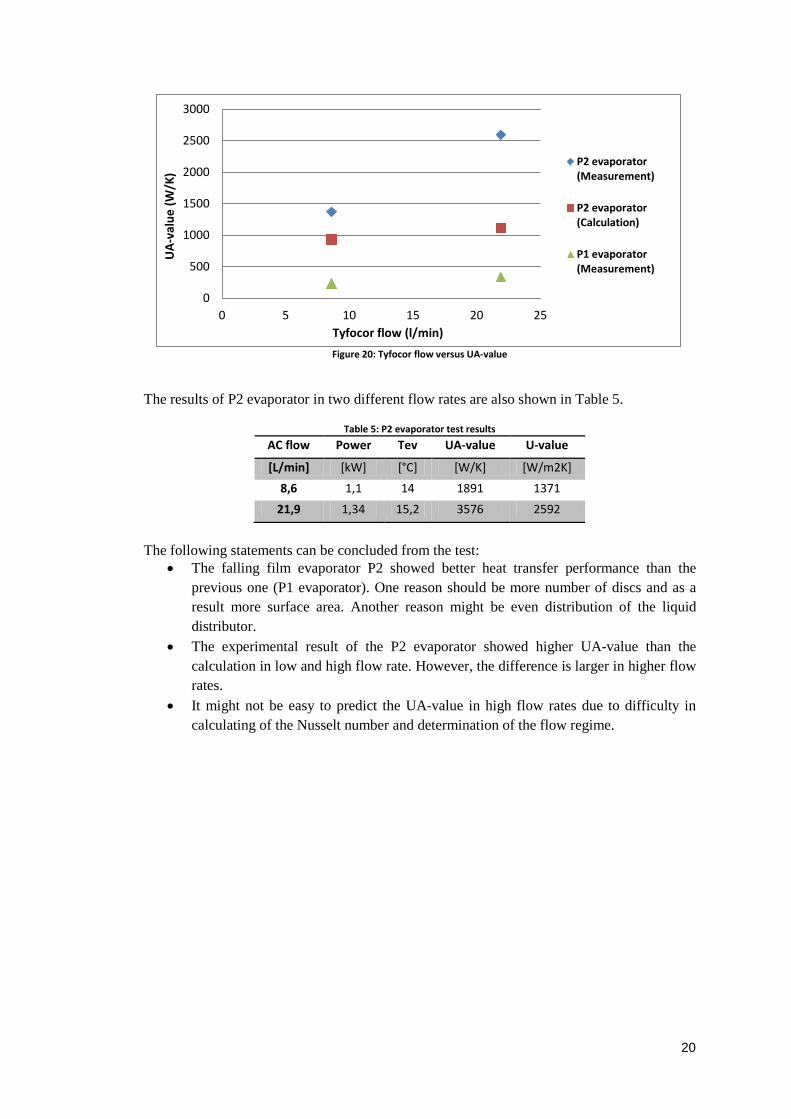
Figure 20 shows that the P2 evaporator has a higher UA-value than the P1 evaporator [11] does. Moreover, it has a higher UA-value than what was predicted by calculation. The difference between the calculation result and the experimental one is more in high flow rates.
20
Figure 20: Tyfocor flow versus UA-value
The results of P2 evaporator in two different flow rates are also shown in Table 5.
Table 5: P2 evaporator test results AC flow Power Tev UA-value U-value
[L/min] [kW] [°C] [W/K] [W/m2K] 8,6 1,1 14 1891 1371
21,9 1,34 15,2 3576 2592
The following statements can be concluded from the test:
• The falling film evaporator P2 showed better heat transfer performance than the previous one (P1 evaporator). One reason should be more number of discs and as a result more surface area. Another reason might be even distribution of the liquid distributor.
• The experimental result of the P2 evaporator showed higher UA-value than the calculation in low and high flow rate. However, the difference is larger in higher flow rates.
• It might not be easy to predict the UA-value in high flow rates due to difficulty in calculating of the Nusselt number and determination of the flow regime.
0
500
1000
1500
2000
2500
3000
0 5 10 15 20 25
UA-
valu
e (W
/K)
Tyfocor flow (l/min)
P2 evaporator (Measurement)
P2 evaporator (Calculation)
P1 evaporator (Measurement)
21
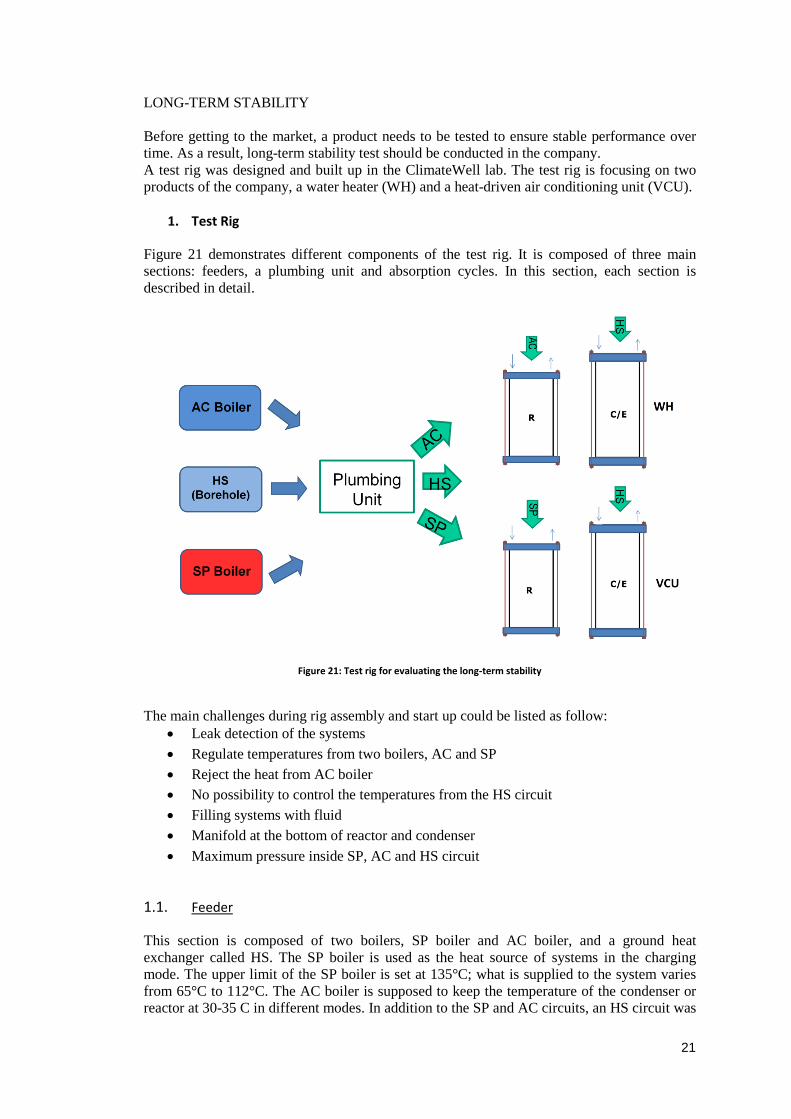
LONG-TERM STABILITY Before getting to the market, a product needs to be tested to ensure stable performance over time. As a result, long-term stability test should be conducted in the company. A test rig was designed and built up in the ClimateWell lab. The test rig is focusing on two products of the company, a water heater (WH) and a heat-driven air conditioning unit (VCU).
1. Test Rig
Figure 21 demonstrates different components of the test rig. It is composed of three main sections: feeders, a plumbing unit and absorption cycles. In this section, each section is described in detail.
Figure 21: Test rig for evaluating the long-term stability
The main challenges during rig assembly and start up could be listed as follow:
• Leak detection of the systems • Regulate temperatures from two boilers, AC and SP • Reject the heat from AC boiler • No possibility to control the temperatures from the HS circuit • Filling systems with fluid • Manifold at the bottom of reactor and condenser • Maximum pressure inside SP, AC and HS circuit
1.1. Feeder This section is composed of two boilers, SP boiler and AC boiler, and a ground heat exchanger called HS. The SP boiler is used as the heat source of systems in the charging mode. The upper limit of the SP boiler is set at 135°C; what is supplied to the system varies from 65°C to 112°C. The AC boiler is supposed to keep the temperature of the condenser or reactor at 30-35 C in different modes. In addition to the SP and AC circuits, an HS circuit was
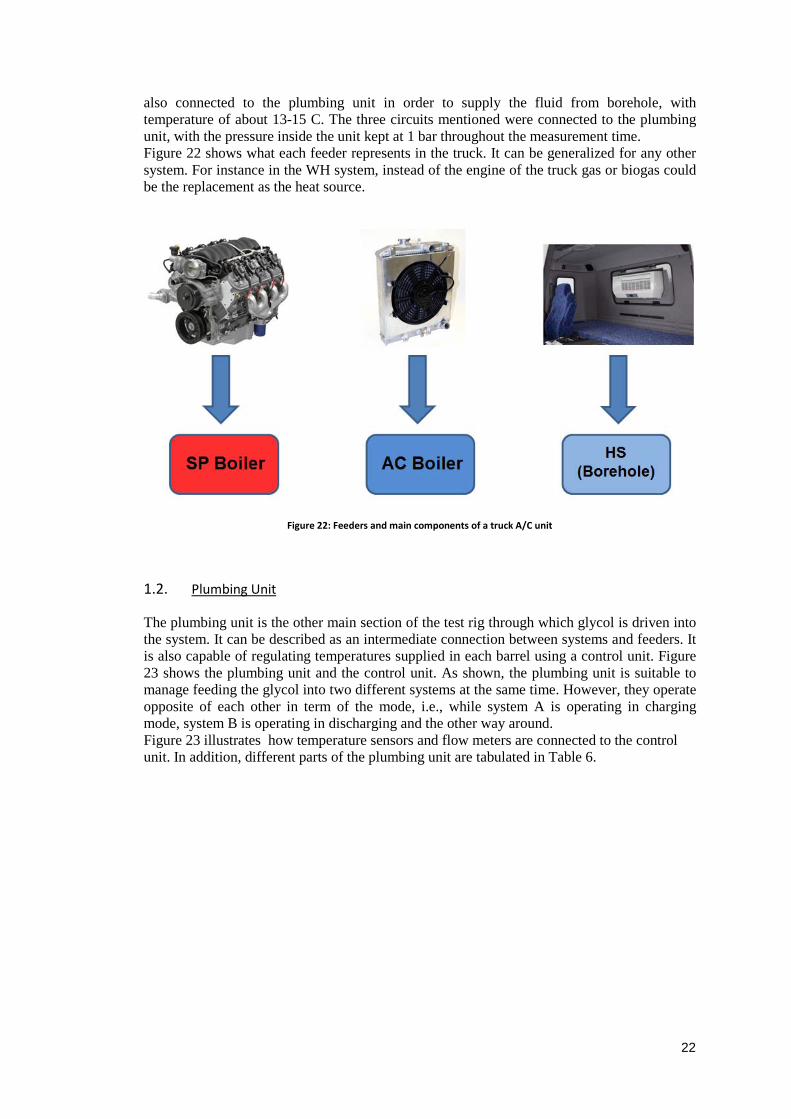
22
also connected to the plumbing unit in order to supply the fluid from borehole, with temperature of about 13-15 C. The three circuits mentioned were connected to the plumbing unit, with the pressure inside the unit kept at 1 bar throughout the measurement time. Figure 22 shows what each feeder represents in the truck. It can be generalized for any other system. For instance in the WH system, instead of the engine of the truck gas or biogas could be the replacement as the heat source.
Figure 22: Feeders and main components of a truck A/C unit
1.2. Plumbing Unit
The plumbing unit is the other main section of the test rig through which glycol is driven into the system. It can be described as an intermediate connection between systems and feeders. It is also capable of regulating temperatures supplied in each barrel using a control unit. Figure 23 shows the plumbing unit and the control unit. As shown, the plumbing unit is suitable to manage feeding the glycol into two different systems at the same time. However, they operate opposite of each other in term of the mode, i.e., while system A is operating in charging mode, system B is operating in discharging and the other way around. Figure 23 illustrates how temperature sensors and flow meters are connected to the control unit. In addition, different parts of the plumbing unit are tabulated in Table 6.
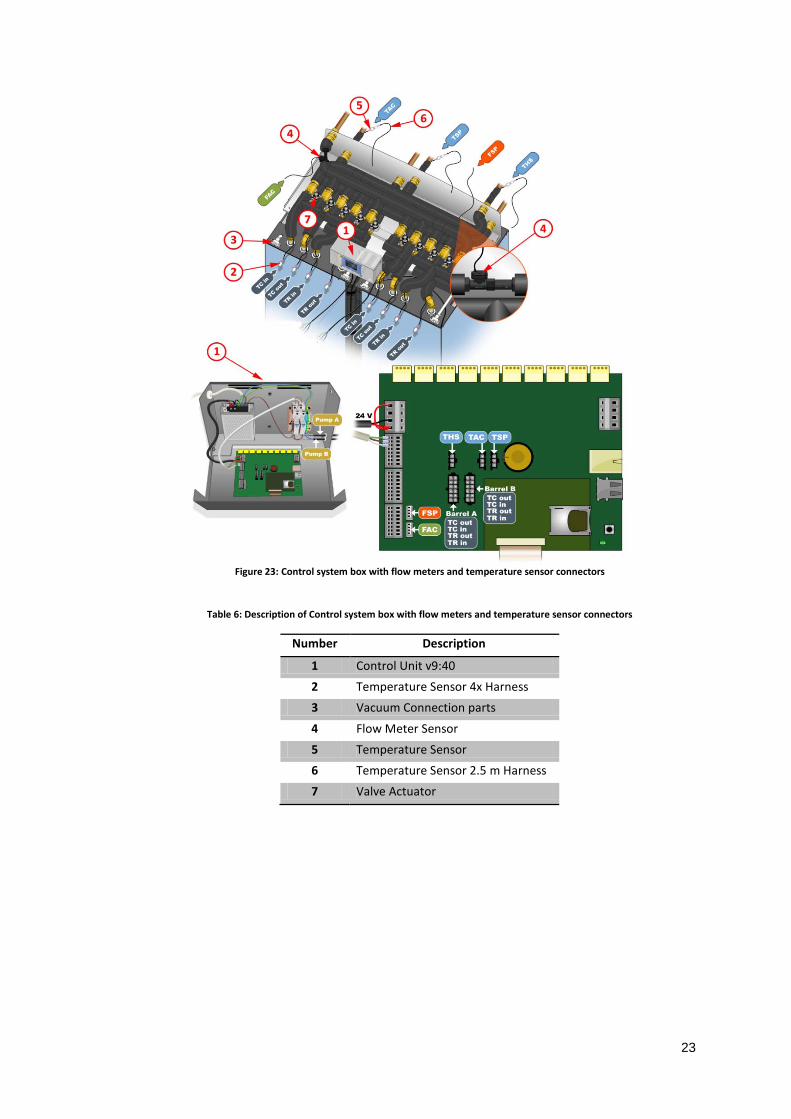
23
Figure 23: Control system box with flow meters and temperature sensor connectors
Table 6: Description of Control system box with flow meters and temperature sensor connectors
Number Description
1 Control Unit v9:40 2 Temperature Sensor 4x Harness 3 Vacuum Connection parts
4 Flow Meter Sensor 5 Temperature Sensor 6 Temperature Sensor 2.5 m Harness 7 Valve Actuator
24
1.2.1. Valves
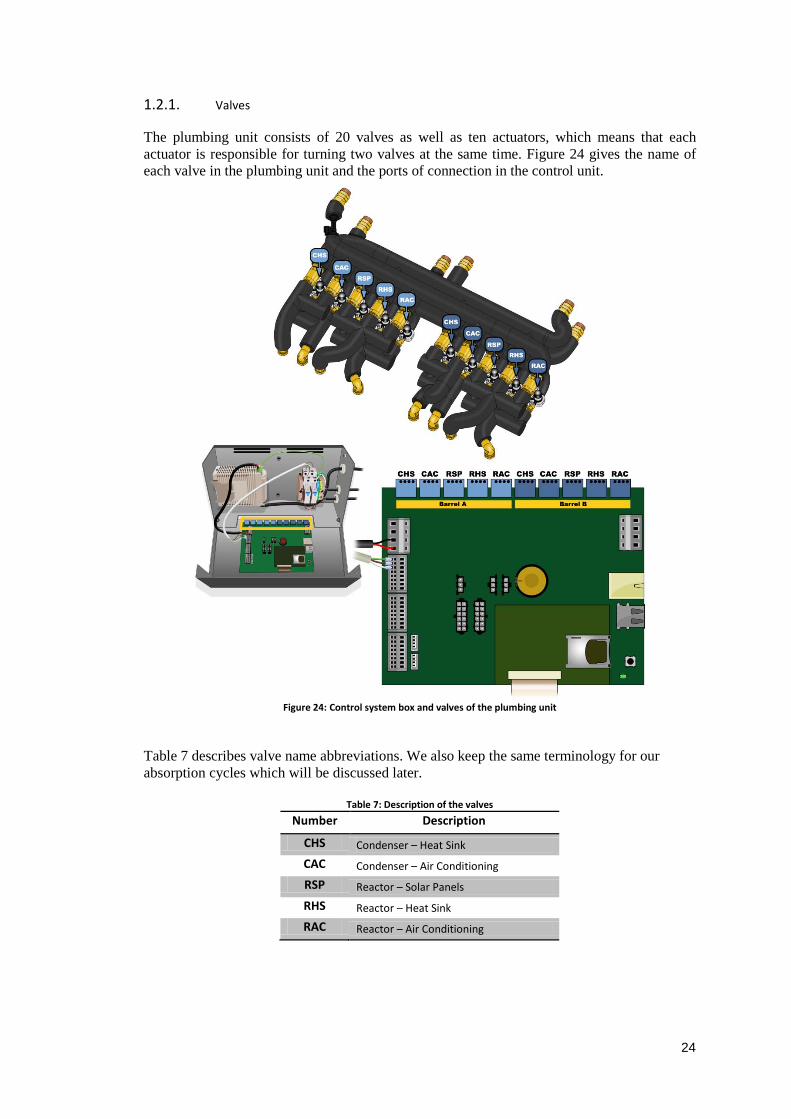
The plumbing unit consists of 20 valves as well as ten actuators, which means that each actuator is responsible for turning two valves at the same time. Figure 24 gives the name of each valve in the plumbing unit and the ports of connection in the control unit.
Figure 24: Control system box and valves of the plumbing unit
Table 7 describes valve name abbreviations. We also keep the same terminology for our absorption cycles which will be discussed later.
Table 7: Description of the valves Number Description
CHS Condenser – Heat Sink
CAC Condenser – Air Conditioning
RSP Reactor – Solar Panels
RHS Reactor – Heat Sink
RAC Reactor – Air Conditioning
25
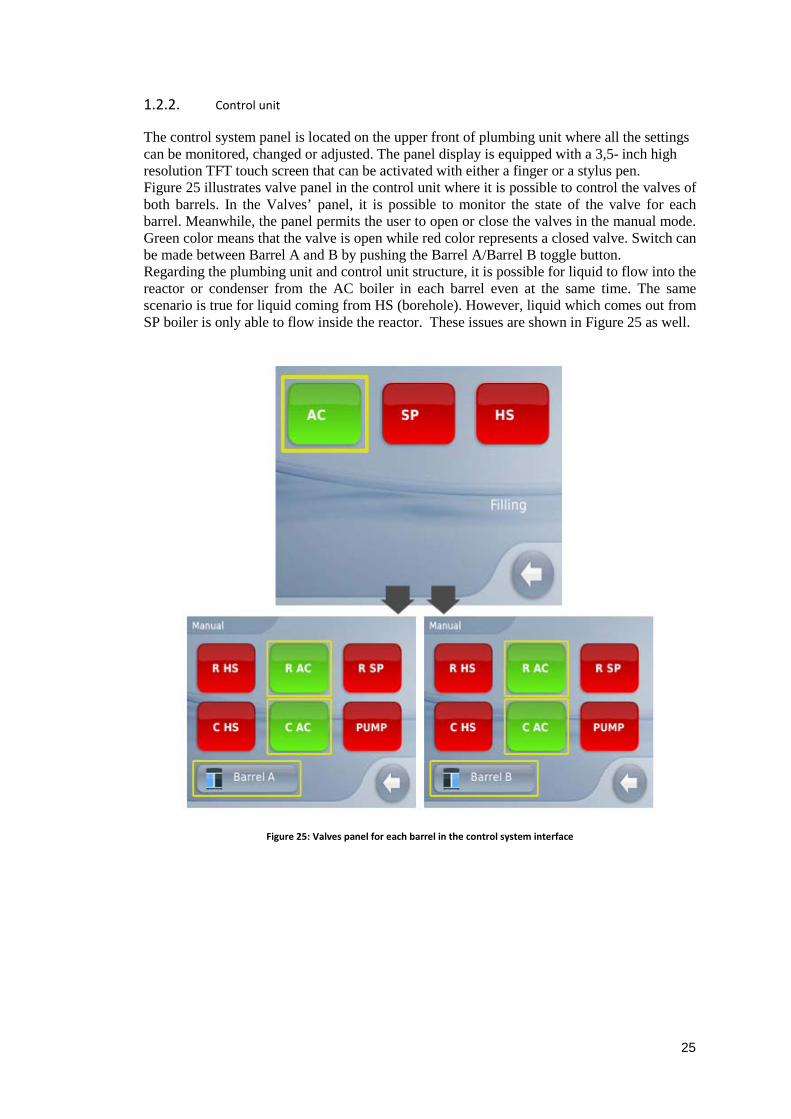
1.2.2. Control unit
The control system panel is located on the upper front of plumbing unit where all the settings can be monitored, changed or adjusted. The panel display is equipped with a 3,5- inch high resolution TFT touch screen that can be activated with either a finger or a stylus pen. Figure 25 illustrates valve panel in the control unit where it is possible to control the valves of both barrels. In the Valves’ panel, it is possible to monitor the state of the valve for each barrel. Meanwhile, the panel permits the user to open or close the valves in the manual mode. Green color means that the valve is open while red color represents a closed valve. Switch can be made between Barrel A and B by pushing the Barrel A/Barrel B toggle button. Regarding the plumbing unit and control unit structure, it is possible for liquid to flow into the reactor or condenser from the AC boiler in each barrel even at the same time. The same scenario is true for liquid coming from HS (borehole). However, liquid which comes out from SP boiler is only able to flow inside the reactor. These issues are shown in Figure 25 as well.
Figure 25: Valves panel for each barrel in the control system interface
26
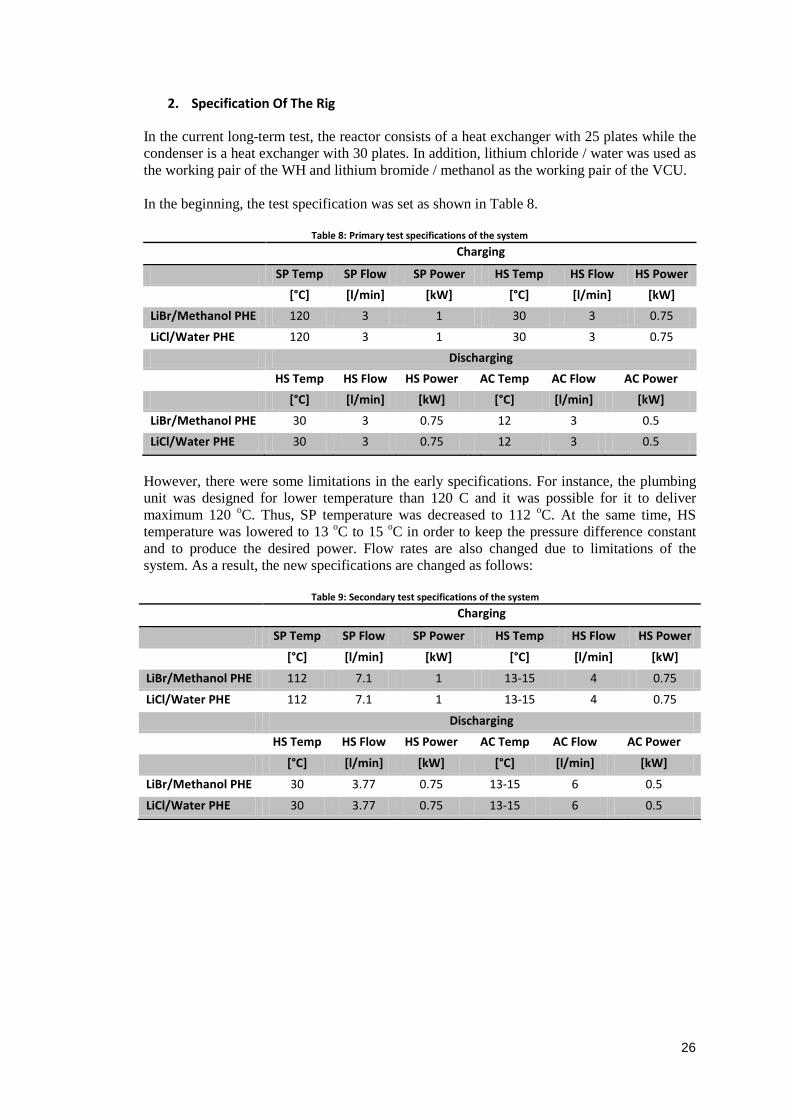
2. Specification Of The Rig
In the current long-term test, the reactor consists of a heat exchanger with 25 plates while the condenser is a heat exchanger with 30 plates. In addition, lithium chloride / water was used as the working pair of the WH and lithium bromide / methanol as the working pair of the VCU. In the beginning, the test specification was set as shown in Table 8.
Table 8: Primary test specifications of the system
Charging
SP Temp SP Flow SP Power HS Temp HS Flow HS Power [°C] [l/min] [kW] [°C] [l/min] [kW] LiBr/Methanol PHE 120 3 1 30 3 0.75
LiCl/Water PHE 120 3 1 30 3 0.75 Discharging HS Temp HS Flow HS Power AC Temp AC Flow AC Power [°C] [l/min] [kW] [°C] [l/min] [kW]
LiBr/Methanol PHE 30 3 0.75 12 3 0.5 LiCl/Water PHE 30 3 0.75 12 3 0.5
However, there were some limitations in the early specifications. For instance, the plumbing unit was designed for lower temperature than 120 C and it was possible for it to deliver maximum 120 oC. Thus, SP temperature was decreased to 112 oC. At the same time, HS temperature was lowered to 13 oC to 15 oC in order to keep the pressure difference constant and to produce the desired power. Flow rates are also changed due to limitations of the system. As a result, the new specifications are changed as follows:
Table 9: Secondary test specifications of the system
Charging
SP Temp SP Flow SP Power HS Temp HS Flow HS Power
[°C] [l/min] [kW] [°C] [l/min] [kW]
LiBr/Methanol PHE 112 7.1 1 13-15 4 0.75
LiCl/Water PHE 112 7.1 1 13-15 4 0.75
Discharging
HS Temp HS Flow HS Power AC Temp AC Flow AC Power
[°C] [l/min] [kW] [°C] [l/min] [kW]
LiBr/Methanol PHE 30 3.77 0.75 13-15 6 0.5
LiCl/Water PHE 30 3.77 0.75 13-15 6 0.5
27
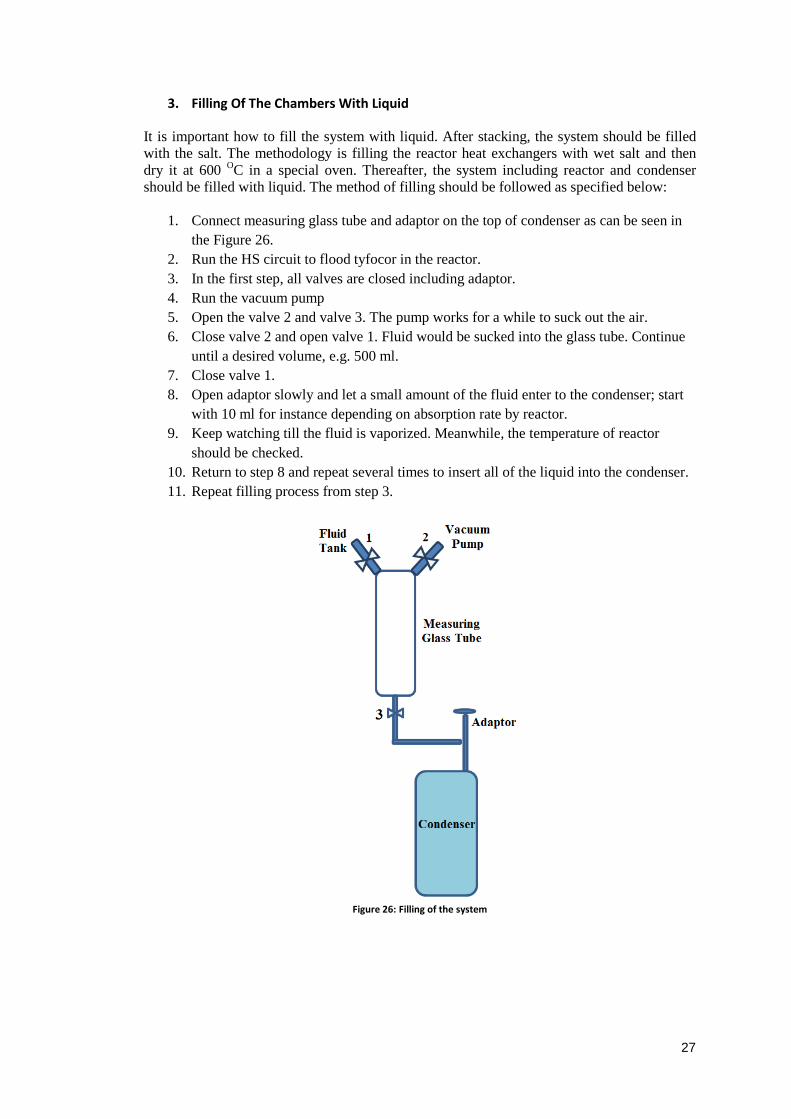
3. Filling Of The Chambers With Liquid
It is important how to fill the system with liquid. After stacking, the system should be filled with the salt. The methodology is filling the reactor heat exchangers with wet salt and then dry it at 600 OC in a special oven. Thereafter, the system including reactor and condenser should be filled with liquid. The method of filling should be followed as specified below:
1. Connect measuring glass tube and adaptor on the top of condenser as can be seen in the Figure 26.
2. Run the HS circuit to flood tyfocor in the reactor. 3. In the first step, all valves are closed including adaptor. 4. Run the vacuum pump 5. Open the valve 2 and valve 3. The pump works for a while to suck out the air. 6. Close valve 2 and open valve 1. Fluid would be sucked into the glass tube. Continue
until a desired volume, e.g. 500 ml. 7. Close valve 1. 8. Open adaptor slowly and let a small amount of the fluid enter to the condenser; start
with 10 ml for instance depending on absorption rate by reactor. 9. Keep watching till the fluid is vaporized. Meanwhile, the temperature of reactor
should be checked. 10. Return to step 8 and repeat several times to insert all of the liquid into the condenser. 11. Repeat filling process from step 3.
Figure 26: Filling of the system
28
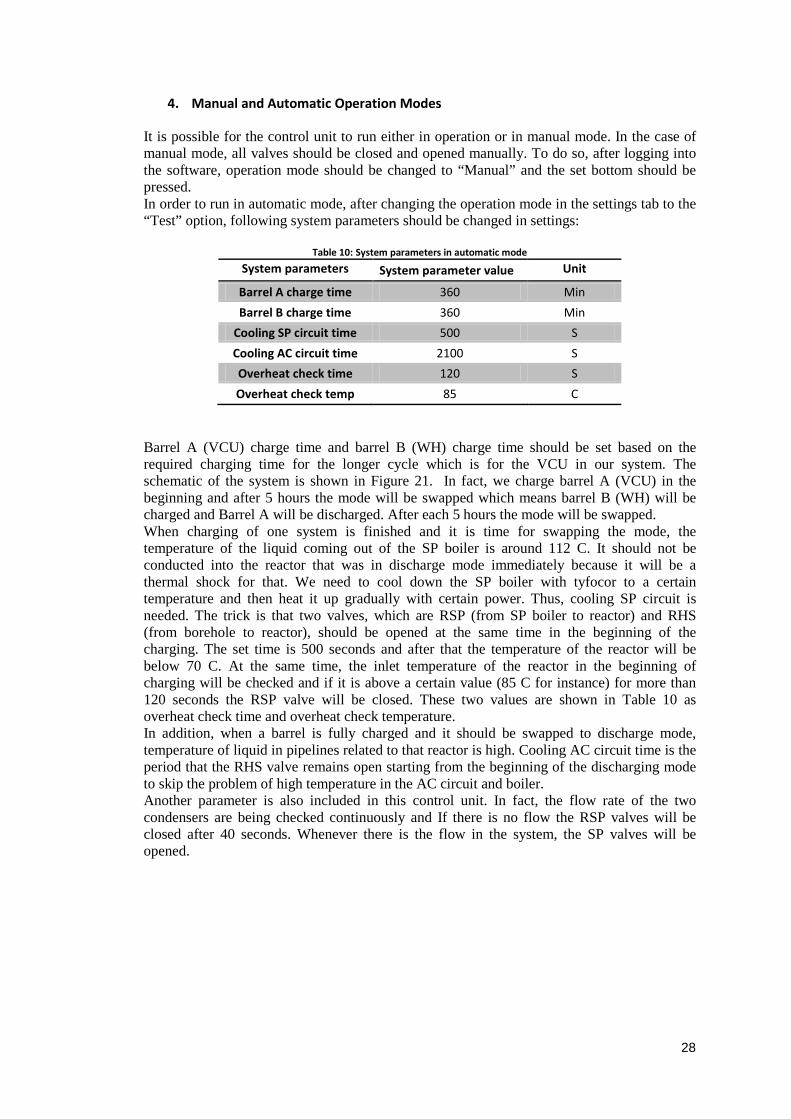
4. Manual and Automatic Operation Modes
It is possible for the control unit to run either in operation or in manual mode. In the case of manual mode, all valves should be closed and opened manually. To do so, after logging into the software, operation mode should be changed to “Manual” and the set bottom should be pressed. In order to run in automatic mode, after changing the operation mode in the settings tab to the “Test” option, following system parameters should be changed in settings:
Table 10: System parameters in automatic mode
System parameters System parameter value Unit
Barrel A charge time 360 Min Barrel B charge time 360 Min
Cooling SP circuit time 500 S Cooling AC circuit time 2100 S Overheat check time 120 S Overheat check temp 85 C
Barrel A (VCU) charge time and barrel B (WH) charge time should be set based on the required charging time for the longer cycle which is for the VCU in our system. The schematic of the system is shown in Figure 21. In fact, we charge barrel A (VCU) in the beginning and after 5 hours the mode will be swapped which means barrel B (WH) will be charged and Barrel A will be discharged. After each 5 hours the mode will be swapped. When charging of one system is finished and it is time for swapping the mode, the temperature of the liquid coming out of the SP boiler is around 112 C. It should not be conducted into the reactor that was in discharge mode immediately because it will be a thermal shock for that. We need to cool down the SP boiler with tyfocor to a certain temperature and then heat it up gradually with certain power. Thus, cooling SP circuit is needed. The trick is that two valves, which are RSP (from SP boiler to reactor) and RHS (from borehole to reactor), should be opened at the same time in the beginning of the charging. The set time is 500 seconds and after that the temperature of the reactor will be below 70 C. At the same time, the inlet temperature of the reactor in the beginning of charging will be checked and if it is above a certain value (85 C for instance) for more than 120 seconds the RSP valve will be closed. These two values are shown in Table 10 as overheat check time and overheat check temperature. In addition, when a barrel is fully charged and it should be swapped to discharge mode, temperature of liquid in pipelines related to that reactor is high. Cooling AC circuit time is the period that the RHS valve remains open starting from the beginning of the discharging mode to skip the problem of high temperature in the AC circuit and boiler. Another parameter is also included in this control unit. In fact, the flow rate of the two condensers are being checked continuously and If there is no flow the RSP valves will be closed after 40 seconds. Whenever there is the flow in the system, the SP valves will be opened.
29
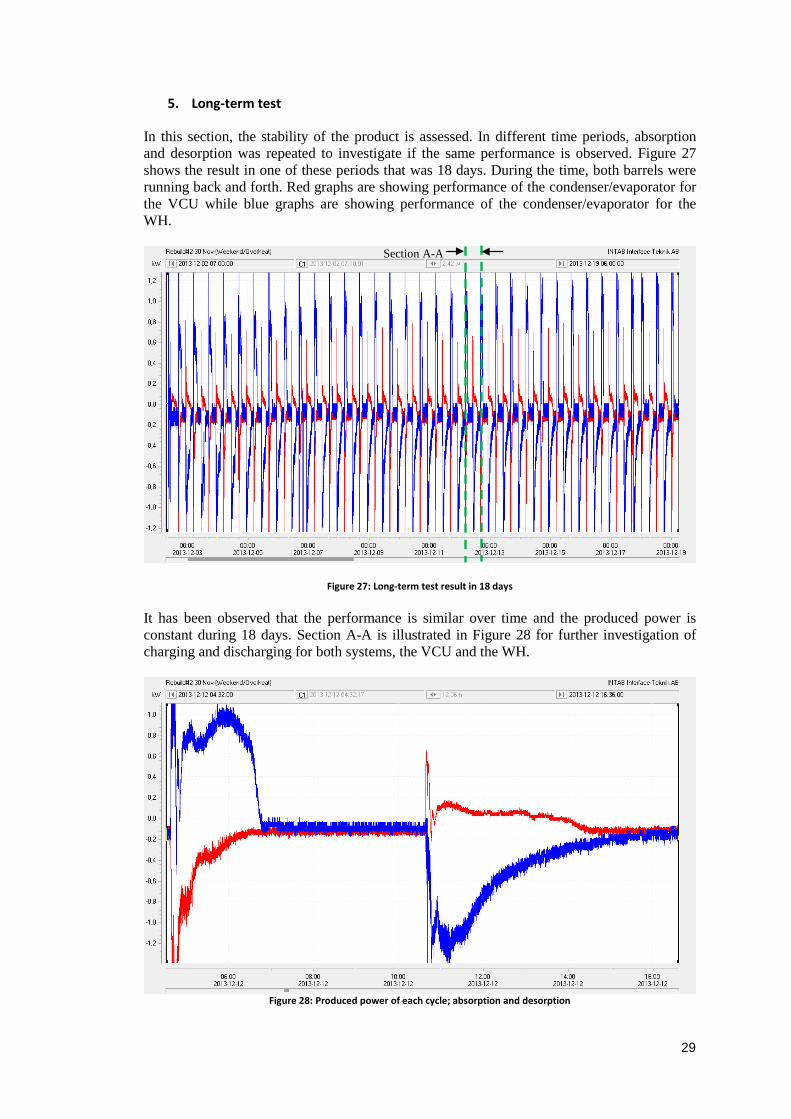
5. Long-term test
In this section, the stability of the product is assessed. In different time periods, absorption and desorption was repeated to investigate if the same performance is observed. Figure 27 shows the result in one of these periods that was 18 days. During the time, both barrels were running back and forth. Red graphs are showing performance of the condenser/evaporator for the VCU while blue graphs are showing performance of the condenser/evaporator for the WH.
Figure 27: Long-term test result in 18 days It has been observed that the performance is similar over time and the produced power is constant during 18 days. Section A-A is illustrated in Figure 28 for further investigation of charging and discharging for both systems, the VCU and the WH.
Figure 28: Produced power of each cycle; absorption and desorption
Section A-A
30
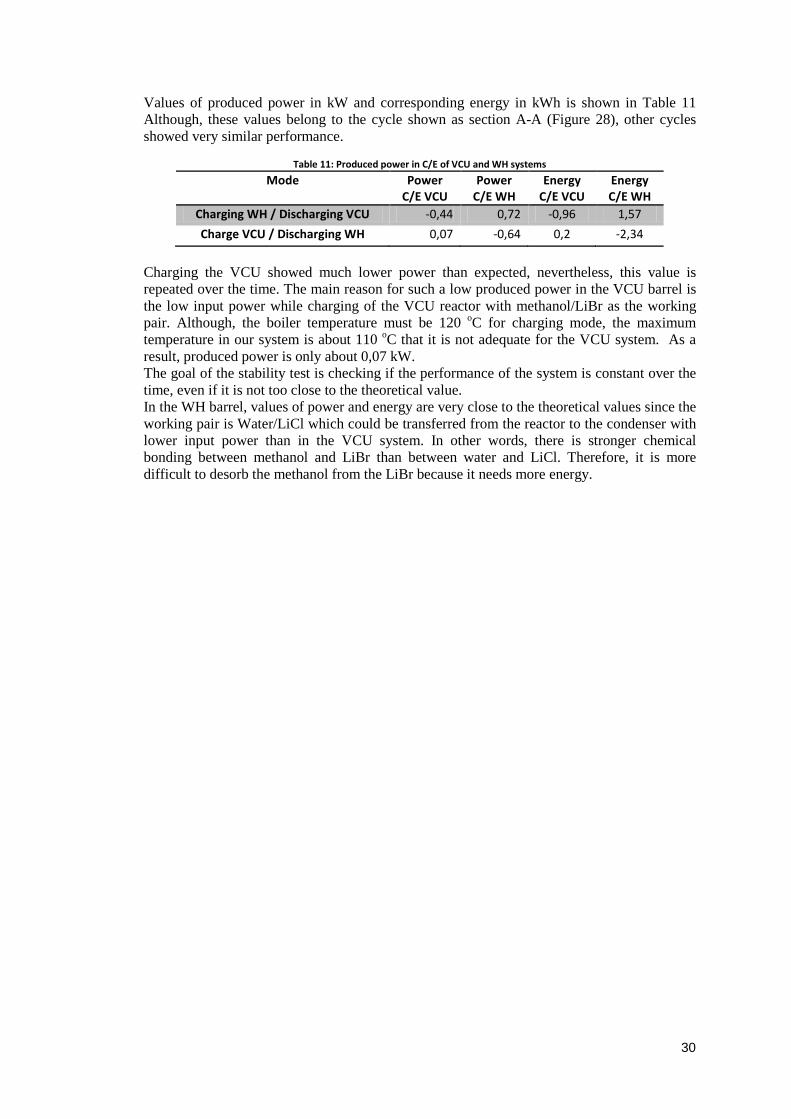
Values of produced power in kW and corresponding energy in kWh is shown in Table 11 Although, these values belong to the cycle shown as section A-A (Figure 28), other cycles showed very similar performance.
Table 11: Produced power in C/E of VCU and WH systems
Mode Power C/E VCU
Power C/E WH
Energy C/E VCU
Energy C/E WH
Charging WH / Discharging VCU -0,44 0,72 -0,96 1,57 Charge VCU / Discharging WH 0,07 -0,64 0,2 -2,34
Charging the VCU showed much lower power than expected, nevertheless, this value is repeated over the time. The main reason for such a low produced power in the VCU barrel is the low input power while charging of the VCU reactor with methanol/LiBr as the working pair. Although, the boiler temperature must be 120 oC for charging mode, the maximum temperature in our system is about 110 oC that it is not adequate for the VCU system. As a result, produced power is only about 0,07 kW. The goal of the stability test is checking if the performance of the system is constant over the time, even if it is not too close to the theoretical value. In the WH barrel, values of power and energy are very close to the theoretical values since the working pair is Water/LiCl which could be transferred from the reactor to the condenser with lower input power than in the VCU system. In other words, there is stronger chemical bonding between methanol and LiBr than between water and LiCl. Therefore, it is more difficult to desorb the methanol from the LiBr because it needs more energy.
31
CONCLUSIONS Moving away from fossil fuels is known as an essence in the current century for the energy use in buildings and cities. Two products of ClimateWell Company, located in Stockholm, Sweden, have been investigated in this project. The VCU is a product used for air conditioning of heavy vehicles with the capability of reducing about 90 percent of the fuel consumed for air conditioning. In addition, the WH is a thermo-chemical water heater which consumes the fuel about 50 percent lower than the current water heaters in the market. In this project, performance and stability test of the products were under consideration. The evaporator of the VCU and some of its components have been evaluated. Measuring the pressure drop along distributor pipes showed that between two pipes, called pipe 1 and pipe 2, pipe 1 has less pressure drop than pipe 2 at all flow rates. The length and diameter of pipe 1 and pipe 2 were same; however, the former had 139 holes 0.6 mm in diameter and the latter had 89 holes 0.8 mm in diameter. As a result, pipe 1 was used in the evaporator due to lower pressure drop. In order to select the best plate heat exchanger in the evaporator, a U-type heat exchanger and a Z-type heat exchanger have been tested. Although, U-type heat exchanger showed higher pressure drop, it was used in the evaporator due to better heat transfer performance. In the next step, the evaporator has been assembled and a test rig was set up to test the performance of the falling film evaporator. Measurement and calculation results showed that the new design has much better performance compared to evaporator used in previous prototype of the company called P1. One reason should be more number of discs and as a result more surface area. Another reason might be even distribution of the liquid by distributor pipe. The pressure drop over a circular heat exchanger for boiler was tested. Performance evaluation of a heat rejecter, which is a VCU prototype component, was done in the project as well. Regarding the heat rejecter, heat transfer coefficient of three types of heat exchanger, named as HEX1, HEX2 and HEX3, with different fin dimensions, was measured and they were compared with a reference heat exchanger. Moreover, the measurement data was validated using a simulation tool. It has been concluded that HEX1 has higher UA-value compared to HEX2 and HEX3. However, reference HEX has highest UA-value among all. Inasmuch as reference HEX is thicker and heavier, it is not suitable to be used in the vehicles and HEX1 was selected. Grooved tubes were supposed to be used in the water heater. Three types of grooved tubes with the same length and diameter and different groove geometries have been evaluated. Finally, Cuprofin-S2AD showed the best performance in different ranges of evaporation pressure. Long-term stability of both products has been investigated in this project as well. In the first step, a test rig, including three main parts called feeders, plumbing unit (with a programmable control unit) and chambers, has been designed. The VCU system is using methanol/LiBr as the working pair and the WH system is using Water/LiCl as the working pair. The stability results prove that performance data of the both systems are repeatable, i.e. the systems are stable and show a similar performance over the time.
32
REFERENCES
[1] Herold KE, Radermacher L. “Absorption heat pump”, Mech. Eng.; 68–73, Aug, 1989.
[2] Gosney WB. “Principle of refrigeration”. Cambridge Uni. Press, 1982. [3] P. Srikhirin *, S. Aphornratana, S. Chungpaibulpatana, “A review of absorption
refrigeration Technologies”, Renewable and Sustainable Energy Reviews, 5 (2001) 343–372
[4] ClimateWell, “Verdaac, gren power for cooling on the move”, Stockholm, August 2011
[5] G. Bolin, “Our Vision: One Billion tons less CO2”, http://www.climatewell.com, Sep. 2013.
[6] Pressure Drop Online-Calculator, http://www.pressure-drop.com/, 2012, Schifferstadt Germany
[7] M. K. BASSIOUNY and H. MARTINFLOW, “Flow distribution and pressure drop in plate heat exchanger-I & II”, Chemical Engineering Science, Vol. 39, No 4, pp. 701-704, 1984
[8] C. Blackman,“ V10mGE Evaporator test - Sintered Copper pipe 8 mm”, Released Project Documents, CW internal reports, Sep 2012, Stockholm, Sweden.
[9] Weiland“Inner Grooved Tubes”, http://www.wielandcopper.com/products_inner-groove, March 2013.
[10] O. Hallström, “DometicVCU TEST REPORT Performance Evaluation Olaer Heat Rejecter”, Released Project Documents, CW internal reports, Feb 2013, Stockholm, Sweden.
[11] O. Hallström,“DometicVCU TEST REPORT Performance evaluation of falling film evaporator in TR18”, Released Project Documents, CW internal reports, Dec 2012, Stockholm, Sweden.

33

![Sorption Studies of Heavy Metal Ions on a Novel Chelating Resin [Stripping of Mercury II]](https://static.documents.pub/doc/80x56/577d2d231a28ab4e1eaceff8/sorption-studies-of-heavy-metal-ions-on-a-novel-chelating-resin-stripping.jpg)


