Investigation of Investigation of Spatial Mosquito Spatial Mosquito Population Trends Population Trends Using Using EOF Analysis: Model EOF Analysis: Model Vs Count Data in Vs Count Data in Pasco County Florida Pasco County Florida Cory Morin Cory Morin
Transcript
Investigation of Spatial Investigation of Spatial Mosquito Population Trends Mosquito Population Trends
UsingUsingEOF Analysis: Model Vs EOF Analysis: Model Vs
Count Data in Pasco Count Data in Pasco County FloridaCounty Florida
Cory MorinCory Morin
Presentation OutlinePresentation Outline
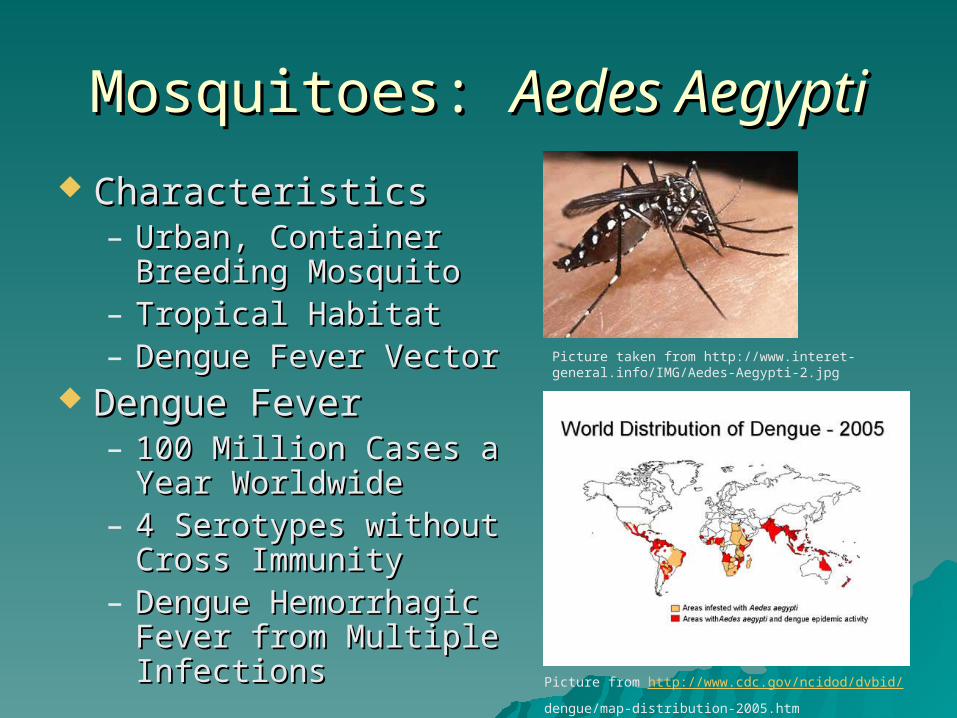
Outline of Objectives of StudyOutline of Objectives of Study Background of Research – Why Study Background of Research – Why Study
Mosquitoes?Mosquitoes? Introduction to DyMSiMIntroduction to DyMSiM Model Runs + Correlation and Model Runs + Correlation and
Regression CoefficientsRegression Coefficients EOF AnalysisEOF Analysis Conclusions and DiscussionConclusions and Discussion
ObjectivesObjectives
Validate Model (DyMSiM) with Validate Model (DyMSiM) with Mosquito Count DataMosquito Count Data– Using 25 Locations within Pasco County Using 25 Locations within Pasco County
Governing RulesGoverning Rules– Development Rates Development Rates – Death Rates Death Rates – Reproductive RatesReproductive Rates– Larval/Pupa CapacityLarval/Pupa Capacity– Water Flux (sources and sinks)Water Flux (sources and sinks)
Conceptual Model (DyMSiM) Dynamic Conceptual Model (DyMSiM) Dynamic Mosquito Simulation ModelMosquito Simulation Model
DataData Temperature Data was Temperature Data was
Obtained from the Obtained from the National Climate Data National Climate Data Center Center
Precipitation Data was Precipitation Data was Obtained from the Obtained from the National Climate Data National Climate Data Center and The Pasco Center and The Pasco County Vector and County Vector and Mosquito Control DistrictMosquito Control District
Mosquito Data was Mosquito Data was Obtained from the Pasco Obtained from the Pasco County Vector and County Vector and Mosquito Control DistrictMosquito Control District
Image from http://pix.epodunk.com/locatorMaps/fl/FL_8834.gif
Used to Analyze Spatial Patterns in a Used to Analyze Spatial Patterns in a DatasetDataset
The 1st EOF Shows the Largest The 1st EOF Shows the Largest Fraction of Variance Explained in a Fraction of Variance Explained in a DatasetDataset– Found from Eigenvalues and Found from Eigenvalues and
EigenvectorsEigenvectors– Only a limited number of EOFs are Only a limited number of EOFs are
Significant (North Test)Significant (North Test)
Spring North TestSpring North TestNorth Test: Spring Trap Data
0
0.1
0.20.3
0.4
0.5
0.6
0.70.8
0.9
1
0 1 2 3 4 5 6 7 8 9 10
Eigenvalue
Var
iance
Exp
lain
ed
Variance Explained
upper confidence 0.95
lower confidence -0.95
North Test: Spring Model Data
0
0.1
0.20.3
0.4
0.5
0.6
0.70.8
0.9
1
0 1 2 3 4 5 6 7 8 9 10
Eigenvalue
Variance E
xpla
ined
Variance Explained
upper confidence 0.95
lower confidence -0.95
- The first two EOFs in both Whisker Plots are Significant
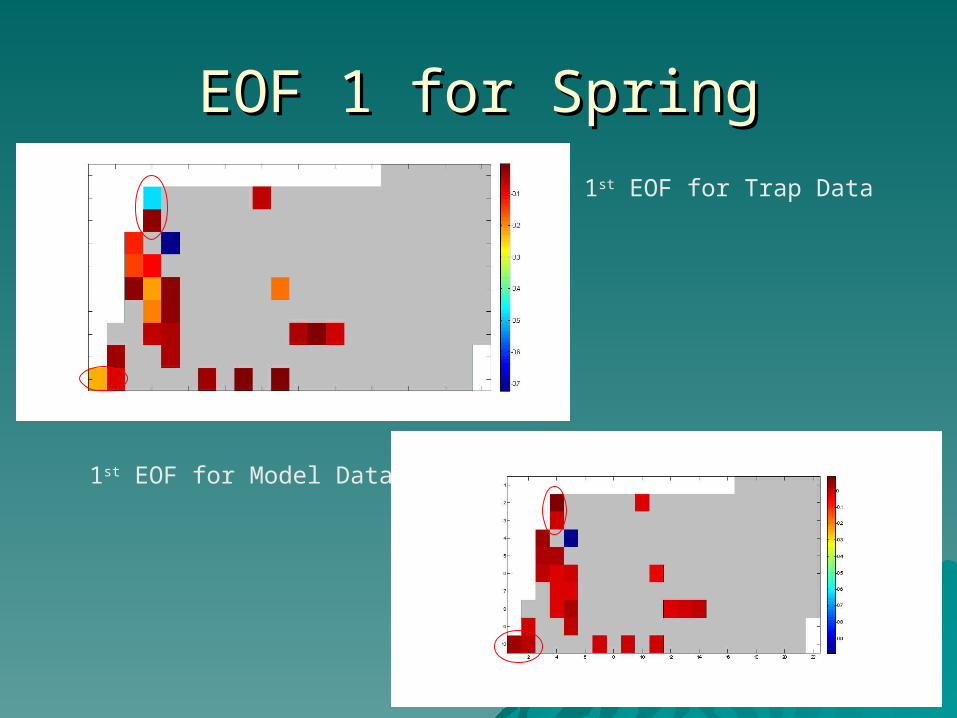
EOF 1 for SpringEOF 1 for Spring
1st EOF for Trap Data
1st EOF for Model Data
EOF 2 for SpringEOF 2 for Spring2nd EOF Trap Data
2nd EOF Model Data
Summer North TestSummer North Test
North Test: Summer Model Data
0
0.2
0.4
0.6
0.8
1
1.2
0 1 2 3 4 5 6 7 8 9 10
Eigenvalue
Variance E
xpla
ined
Variance Explained
upper confidence 0.95
lower confidence -0.95
North Test: Summer Trap Data
0
0.2
0.4
0.6
0.8
1
0 1 2 3 4 5 6 7 8 9 10
Eigenvalue
Variance E
xpla
ined
Variance Explained
upper confidence 0.95
lower confidence -0.95
Only EOF 1 is Significant for the Summer
EOF 1 for SummerEOF 1 for Summer
1st EOF for Trap Data
1st EOF for Model Data
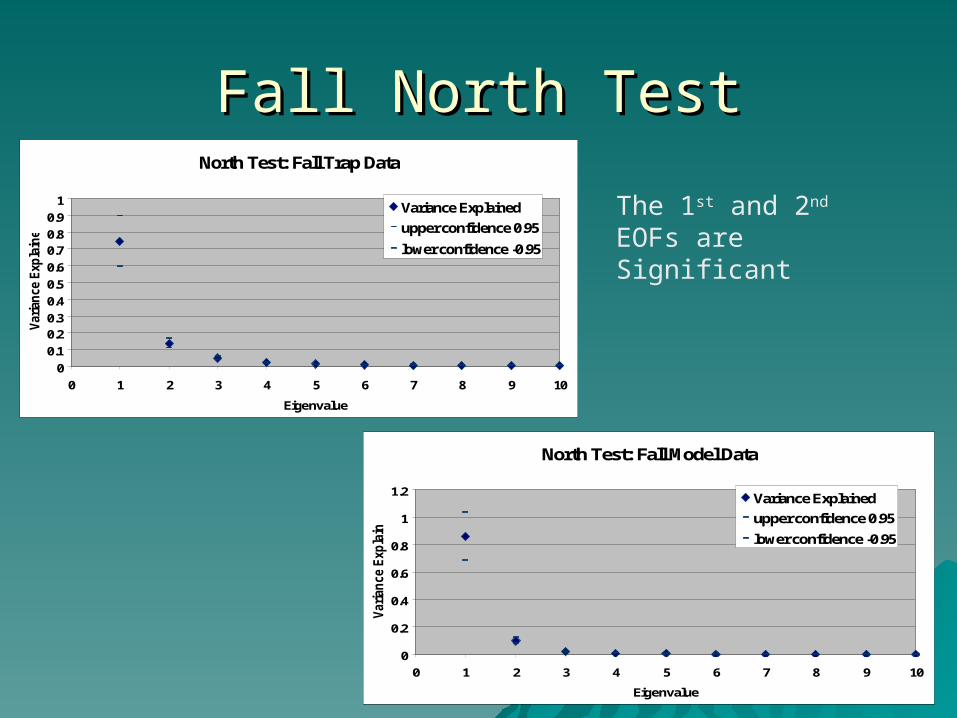
Fall North TestFall North TestNorth Test: Fall Trap Data
0
0.1
0.20.3
0.4
0.5
0.6
0.70.8
0.9
1
0 1 2 3 4 5 6 7 8 9 10
Eigenvalue
Var
iance
Exp
lain
ed
Variance Explained
upper confidence 0.95
lower confidence -0.95
North Test: Fall Model Data
0
0.2
0.4
0.6
0.8
1
1.2
0 1 2 3 4 5 6 7 8 9 10
Eigenvalue
Variance E
xpla
ined
Variance Explained
upper confidence 0.95
lower confidence -0.95
The 1st and 2nd EOFs are Significant
EOF 1 for FallEOF 1 for Fall
1st EOF for Trap Data
1st EOF for Model Data
EOF 2 for FallEOF 2 for Fall
2nd EOF for Trap Data
2nd EOF Model Data
ConclusionsConclusions 11stst EOF Dominates in Each Season for both EOF Dominates in Each Season for both
Trap and Model DataTrap and Model Data– One individual location sticks out in particular One individual location sticks out in particular
(Large Population)(Large Population) 22ndnd EOF: Model and Trap Data share some EOF: Model and Trap Data share some
common characteristics but are not common characteristics but are not identicalidentical
Physical Mechanisms Behind the EOFs Physical Mechanisms Behind the EOFs Need to be Analyzed (Surface Cover / Need to be Analyzed (Surface Cover / Precipitation Patters) Precipitation Patters)
Overall, the EOF Analysis Supports the Overall, the EOF Analysis Supports the Utility and Accuracy of DyMSiMUtility and Accuracy of DyMSiM
Model LimitationsModel Limitations ““All Models are Wrong, Some are Useful” All Models are Wrong, Some are Useful”
-George Box -George Box
The model only accounts for climate and The model only accounts for climate and land use factorsland use factors– Predation, Pesticides, Food Availability, Human Predation, Pesticides, Food Availability, Human
Behaviors, and Migration are not accounted forBehaviors, and Migration are not accounted for
Trap Data is Trap Data is NotNot Truth Truth– Trapping mosquitoes may largely effect Trapping mosquitoes may largely effect
population dynamics population dynamics – Microenvironments are important for Microenvironments are important for
mosquitoes but are not caught with climate mosquitoes but are not caught with climate datadata
Thank You for Your Thank You for Your AttentionAttention