INVESTIGATIONS OF THE SPRING SPAWNING FISH POPULATIONS IN THE ATHABASCA AND CLEARWATER RIVERS UPSTR.EAr-1 FROM FORT MCMURRAY Volume I by D.B. TRIPP P.J. MCCART Aquatic Environments Limited for ALBERTA OIL SANDS ENVIRONMENTAL RESEARCH PROGRJU1 Project WS 1.6.1 Decembe r 1979
Transcript
INVESTIGATIONS OF THE
SPRING SPAWNING FISH POPULATIONS
IN THE ATHABASCA AND CLEARWATER RIVERS
UPSTR.EAr-1 FROM FORT MCMURRAY
Volume I
by
D.B. TRIPP
P.J. MCCART
Aquatic Environments Limited
for
ALBERTA OIL SANDS ENVIRONMENTAL
RESEARCH PROGRJU1
Project WS 1.6.1
Decembe r 1979
powter
OSRIN Stamp
The Hon. J.W. (Jack) Cookson Minister of the Environment 222 Legistlative Building Edmon ton, Al be rta
and
The Hon. John Fraser Minister of the Environment Environment Canada Ottawa, Ontario
Sirs:
iii
Enclosed is the report "Investigations of the Spring Spawning Fish Populations in the Athabasca and Clearwater Rivers Upstream from Fort McMurray: Volume I".
This report was prepared for the Alberta Oil Sands Environmental Research Program, through its Water System, under the Canada-Alberta Agreement of February 1975 (amended September 1977) •
Respectfully,
W. Solodzuk, P.Eng. Chairman, Steering Committee, AOSERP Deputy Minister, Alberta Environment
A.H. Uacpherson, Ph.D Member, Steering Committee, AOSERP R~gional Director-General Environment Canada Western and Northern Region
iv
INVESTIGATIONS OF THE SPRING
SPAWNING FISH POPULATIONS IN THE ATHABASCA
AND CLEARWATER RIVERS UPSTREAM FROM FORT McMURRAY
DESCRIPTIVE SUMMARY
BACKGROUND
Previous AOSERP fisheries studies have documented critical
spawning habitats in the Athabasca River upstream of Fort McMurray
for lake whitefish from Lake Athabasca (see AOSERP Report #36). Knowledge of the fall spawning pattern of this important fish resource
through the current oil sands mining region is of paramount importance
for assessing and regulating industrial activity. However, a question
which remained regarded the extent to which the spawning habitat up
stream of Fort McMurray was utltzed by spring spawning species such
as northern pike, walleye, and goldeye. Answers to this question
would provide enough information to enable the refining of management
policies affecting the water and habitat qual ity of the mainstem
river system.
This study intended to describe the habitat and biology
of the major spring spawning fish populations of the Athabasca and
Clearwater rivers. Detailed objectives are found in the introduction
of the report.
ASSESSMENT
Results for this research project have been presented in
two volumes: the first volume contains the summary of results along
with discussion and conclusions and the second volume comprises
details of sampling locations and catches. Volume I received review
by scientists at Alberta Fish and Wildlife Division and the University
of Manitoba,whereas Volume I I remains as unedited material. These
reports detail fish utilization of the Athabasca and Clearwater
rivers immediately upstream of Fort McMurray during the spring season
and thus complete the fisheries picture for that important region.
v
The A1berta Oil Sands Environmental Research Program
accepts the two volume report "Investigations of the Spring Spawning
Fish Populations in the Athabasca and Clearwater Rivers Upstream
from Fort McMurray" as an important and val id document and thanks
the researchers, D.B. Tripp and P.J. McCart, for their contribution.
Volume I will receive wide distribution whereas Volume 11 will be
made avai1able thro~gh AOSERP open file.
S.B. Smith, Ph.D Prog ram 0 i recto r Alberta Oi1 Sands Environmental Research Program
THE STUDY AREA Discharge .•...•.........•..•....................• Dissolved Oxygen ............•.................... Temperature .•...............•......•............. Turbidi ty ............................... CII ••••••••
Water Quality ................................... .
1 1 4
6
13 14 14 16 16 16
RESULTS AND DISCUSSION . . . • • . . . . • • . . . . • . . . . . . . .• • . 18 Species Composition and Relative AbWldance .•....• 18 Life Histories of Major Species ..••...•.....••..• 22
Food Habits Flathead Chub Distribution and Movements .................... . Spawning ...................................... . Length - Frequency .............................. . Age and Growth ................................ . Age at Maturity ..................... 0 ••••••••••
Sex Ratios .................................... . Length-Weight Relationships ................... . Longnose Sucker ............................... . Distribution and Movements .................... . Spawning ...................................... . Fry Emergence and Downstream Migration ...•..... Juveniles ..................................... . Length-Frequency .............................. . Age and Growth ................................ . Age at Maturity ............................... . Sex Ratios ...........................•......... Length-Weight Relationships ................... . Fecundity ..................................... . Food Habits ................................... . Whi te Suckers ................................. . Distribution and Movements .................... . Spawning ...................•..........•........ Fry Emergence ................................. . Length-Frequency .............................. . Age and Growth ................................ . Age at Maturity ............................... . Sex Ratios .................................... . Length-Weight Relationships ................... . Fecundity ..................................... . Food Habits ................................... . Walleye ....................................... . Distribution and Movements .................... . Spawning ...................................... . Fry Emergence ................................. . Length-Frequency •........•..................... Age and Growth ................................ . Age at l\la turi ty ............................... . Sex Ratios .................................... . Length-Weight Relationships ..•................. Food Habits .......................•............ Other Species ................................. . Dolly Varden .................................. . Lake Whitefish ................................ . Mountain Whitefish .....•....................... Arctic Grayling ............................... .
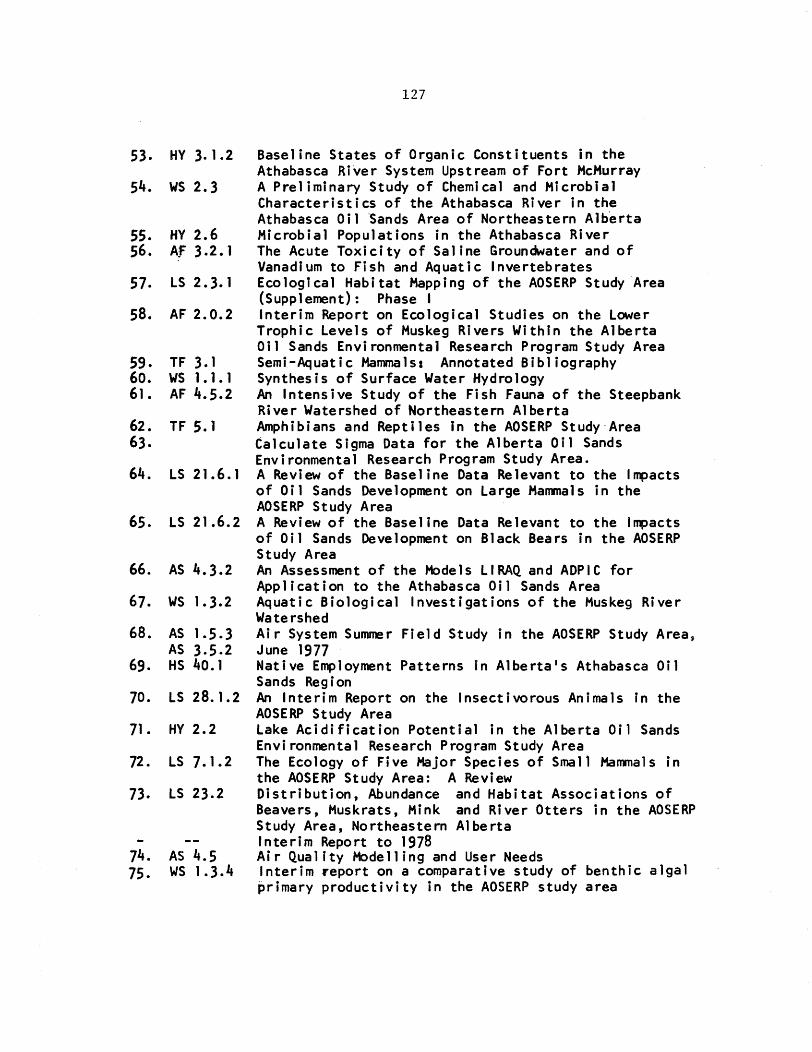
7. LIST OF AOSERP RESEARCH REPORTS ...•. o ••••••••••••••• 125
xii
LIST OF TABLES
Page
1. Water Quality in the Athabasca River 100 m Upstream of the Horse River, 13 June 1978 .......................... 17
2. List of Common and Scientific Names of Fish Species Captured in this Study with Four Letter Codes and a Catch Summary for Each Species ......................... 19
3. Relative Abundance of Fish Species in Gillnet, Beach Seine, and Minnow Seine Catches from the Athabasca River Upstream of the Cascade Rapids, the Athabasca Downstream of the Cascade Rapids to Fort McMurray, and the Clearwater River Including the Mouth of the Christina River, 28 April to 25 June 1978 .............. 21
4. Summary of Gillnetting, Beach Seining, and Minnow Seining Catch Per Unit Effort in the Present Study Area, 28 April to 25 June 1978 . . . . . . . . . . . . . . . . . . . . . . . . . 23
5. Age-Length Relationship with Age Specific Sex Ratios and Percent Maturity for Goldeye Taken from the Project Study Area, 28 April to 25 June 1978 ................... 28
6. Frequency of Occurrence of Food Items in Stomachs of Northern Pike, Goldeye, and Walleye Taken from the Present Study Area, 28 April to 25 June 1978 ........... 30
7. Spawning Condition of Northern Pike from the Athabasca and Clearwater Rivers, 28 April to 23 June 1978 ........ 34
8. Age-Length Relationship with Age Specific Sex Ratios and Percent Maturity for Northern Pike Taken from the Present Study Area, 28 April to 25 June 1978 ....... 38
9. Age-Length Relationship with Age Specific Sex Ratios and Percent Maturity for Flathead Chub Taken from the Present Study Area, 28 April to 25 June 1978 ....... 45
10. Summary o£ Longnose Sucker Spawning in the Athabasca and Clearwater Rivers, 28 April to 22 June 1978 ........ 53
11. Stream Depth and Substrate Composition Downstream of the Mountain Rapids, 19 June 1978, at Locations Shown in Figure 16 . . . . . . . . . . . . . . . . . . . . . . . . . . . . . . . . . . . . . 58
15. Mean Fork Lengths for Age 11 Longnose Suckers Taken from the Present Study Area, 28 April to 25 June 1978 68
16. Age-Length Relationship with Age-Specific Sex Ratios and Percent Maturity for Longnose Suckers Taken in the Present Study Area on the Athabasca River Upstream of Cascade Rapids, 28 April to 25 June 1978 ...•.....•....• 70
17. Age-Length Relationship with Age-Specific Sex Ratios and Percent Maturity for Longnose Suckers Taken in the Present Study Area on the Athabasca River Downstream of Cascade Rapids, 28 April to 25 June 1978 .........••. 71
18. Age-Length Relationship with Age-Specific Sex Ratios and Percent ~4aturity for Longnose Suckers Taken in the Present Study Area in the Clearwater River, 28 April to 25 June 1978 .. . . . . . . . . • . . . . . . . . . . . . . . . . • . . • • . . 72
19. Logarithmic Length-Weight Relationships for Longnose Suckers Taken in the Athabasca and Clearwater Rivers Upstream of Fort McMurray, 28 April to 25 June 1978 76
20. Spawning Condition of White Suckers Taken from the Athabasca and Clearwater Rivers, 5 May to 13 June 1978 80
21. Age-Length Relationship with Age-Specific Sex Ratios and Percent Maturity for White Sucker Taken from the· Present Study Area, 28 April to 25 June 1978 •.•.....••. 84
22. Spawning Condition of Walleye from the Athabasca and Clearwater Rivers, 28 April to 23 June 1978 ..•.....•.•• 92
23. Age-Length Relationship with Age-Specific Sex Ratios and Percent Maturity for Walleye Taken from the Present Study Area, 28 April to 25 June 1978 •.•........•.•..••. 96
xiv
LIST OF FIGURES
1. The AOSERP Study Area
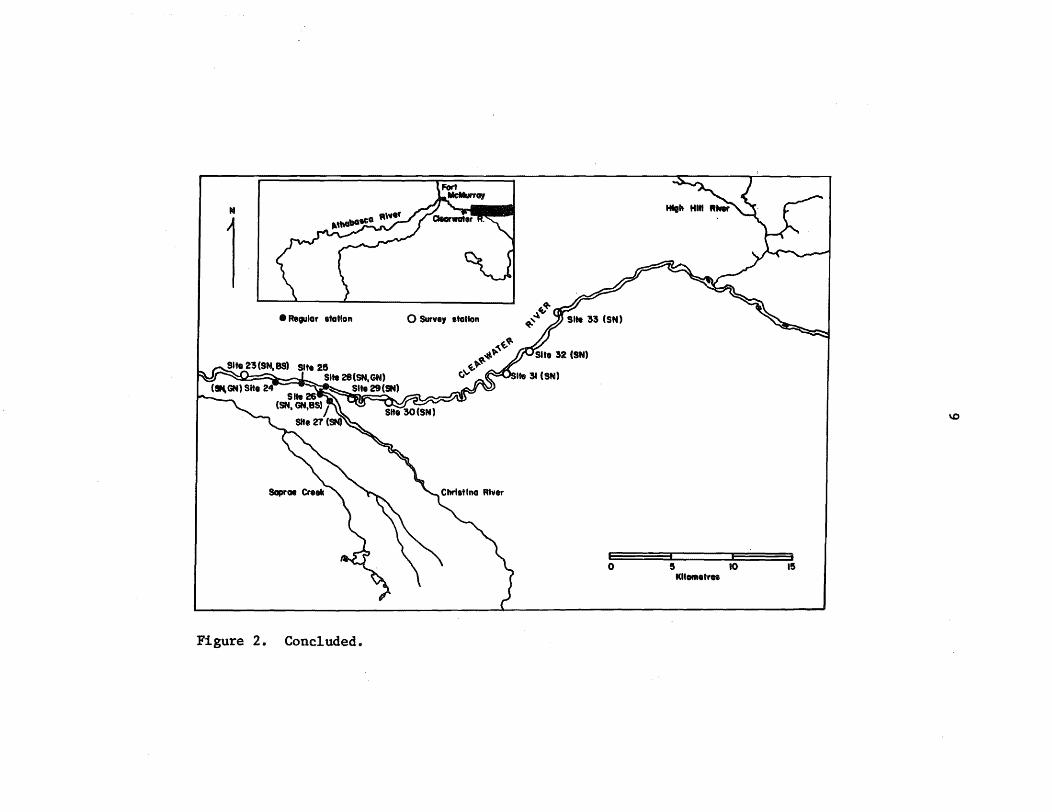
2. The Project Study Area Showing Locations at Regular and Survey Sampling Stations and the Sampling Methods
Page
2
Used at Each Station ..•.•.............................. 7
3. Seasonal Dissolved Oxygen Levels, Water Temperature, Turbidity, and Daily Discharge in the Athabasca and Clearwater Rivers, 28 April to 25 June 1978 ..•........• 15
4. Seasonal Patterns of Catch Per Gillnet Hour for Goldeye, Pike, Flathead Chub, Longnose Sucker, and Walleye in the Athabasca and Clearwater Rivers Upstream of Fort McMurray, 28 April to 23 June 1978 ...••.......• 24
5. Seasonal Patterns of Catch Per Beach Seine Haul for Longnose Suckers, White Suckers, and Goldeye in the Athabasca and Clearwater Rivers Upstream of Fort McMurray, 28 April to 15 June 1978 ..•.••......••....... 25
6. Length-Frequency Distribution of Goldeye Taken from the Athabasca and Clearwater Rivers Upstream of Fort McMurray, 28 April to 25 June 1978 .............•.. 27
7. Locations Where Pike Were Taken in the Present Study Area . . . . . . . . . . . . . . . . . . . . . . . . . . . . . . . . . . . . . . . . . . . . . . . . . . . 31
8. The Length-Frequency Distribution of Male and Female Northern Pike Taken in the Athabasca and Clearwater Rivers Upstream of Fort McMurray, 28 April to 25 June 19 78 . . • . . . . . . . . . . . . . . . . . • • . . . . . . . . . . . . . . . . . . . • . . . 37
9. Comparison ,of Growth Rates of Northern Pike Collected in this Study and Northern Pike Collected in Five Other Studies in Alberta .. . . . . . . . . . . . . . . . . . . . . . . . . . . . • . 39
10. Length-Fecundity Relationship for Northern Pike Taken in the Present Study Area, 28 April to 25 June 1978 ••••• 41
11. Seasonal Patterns of Abundance for Pike Fry, Flathead Chub, Longnose Sucker Juveniles, and Walleye Fry Taken by Minnow Seine in the Athabasca and Clearwater Rivers, 28 April to 25 June 1978 ........•..................•... 42
12. Length-Frequency Distribution of Flathead Chub Taken from the Athabasca and Clearwater Rivers Upstream of Fort McMurray, 28 April to 25 June 1978 ...•..........•. 44
13.
14.
15.
16.
17.
18.
19.
20.
21.
22.
23.
xv
LIST OF FIGURES (CONTINUED)
Comparison of Growth Rates of Flathead Chub Collected in this Study and Flathead Chub Collected in Three Other Studies in the AOSERP Study Area ....••••..•...•.•
Locations Where Longnose Suckers Were Taken in the Present Study Area ........••.•..•............•..•.•...•
Seasonal Abundance of Eggs and Sucker Fry in Drift Samples and Sucker Fry in Minnow Seines on the Athabasca and Clearwater Rivers, "28 April to 25 June 1978 ...................... D ••••••••••••••••••••••••••••
Schematic Diagram of the Mountain Rapids Showing the Location of Sampling Points for Depth and Substrate Composi t-ion ...•..•.•.•...............•..•.........•....
Schematic Diagram of the Cascade Rapids Showing the Location of Sampling Points for Depth and Substrate Composi tion ........................................... .
Depth Profiles and Substrate Characteristics at Six Transects Downstream of the Mountain Rapids on the Athabasca River, 19 June 1978 ......................... .
Depth Profiles and Substrate Characteristics at Three Transects Downstream of the Cascade Rapids on the Athabasca River, 19 June 1978 ......................... .
Length-Frequencies for Longnose Suckers Taken from the Athabasca River Upstream of the Cascade Rapids, 28 April to 25 June 1978 .............................. .
Comparison of Growth Rates of Longnose Suckers Taken in the Athabasca River Upstream of the Cascade Rapids, in the Athabasca River Downstream of the Cascade Rapids, and in the Clearwater River, 28 April to 25 June 1978 ...•................................•..•...
Comparison of Growth Rates of Longnose Suckers Collected from Three Areas in this Study and Longnose Suckers Collected in Five Other Studies in Alberta
Length-Fecundity Relationship for Longnose Suckers Taken in the Project Study Area, 28 April to 25 June 1978 •••••••••••••••••••••••••••••••••••••••• 0 ••••••••••
Page
46
48
54
56
57
60
61
66
73
74
77
xvi
LIST OF FIGURES (CONCLUDED)
Page
24. Length-Frequency Distribution of Sucker Fry Taken in the Clearwater River, Site 24, on 24 June 1978 ......•.... 81
25. Length-Frequency Distribution of White Suckers Taken from the Athabasca and Clearwater Rivers Upstream of Fort McMurray, 28 April to 25 June 1978 .............•.. 83
26. Comparison of Growth Rates of White Suckers Collected in this Study and White Suckers Collected in Three Other Studies in the AOSERP Study Area ..............•.. 85
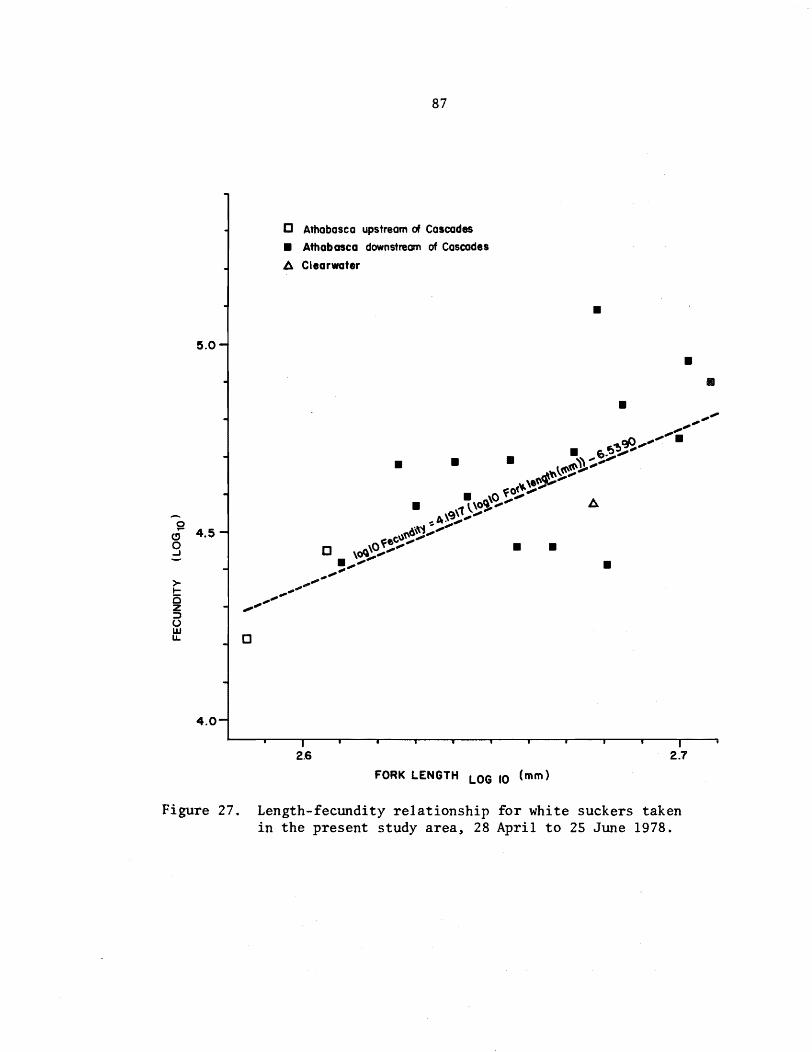
27. Length-Fecundity Relationship for White Suckers Taken in the Present Study Area, 28 April to 25 June 1978 87
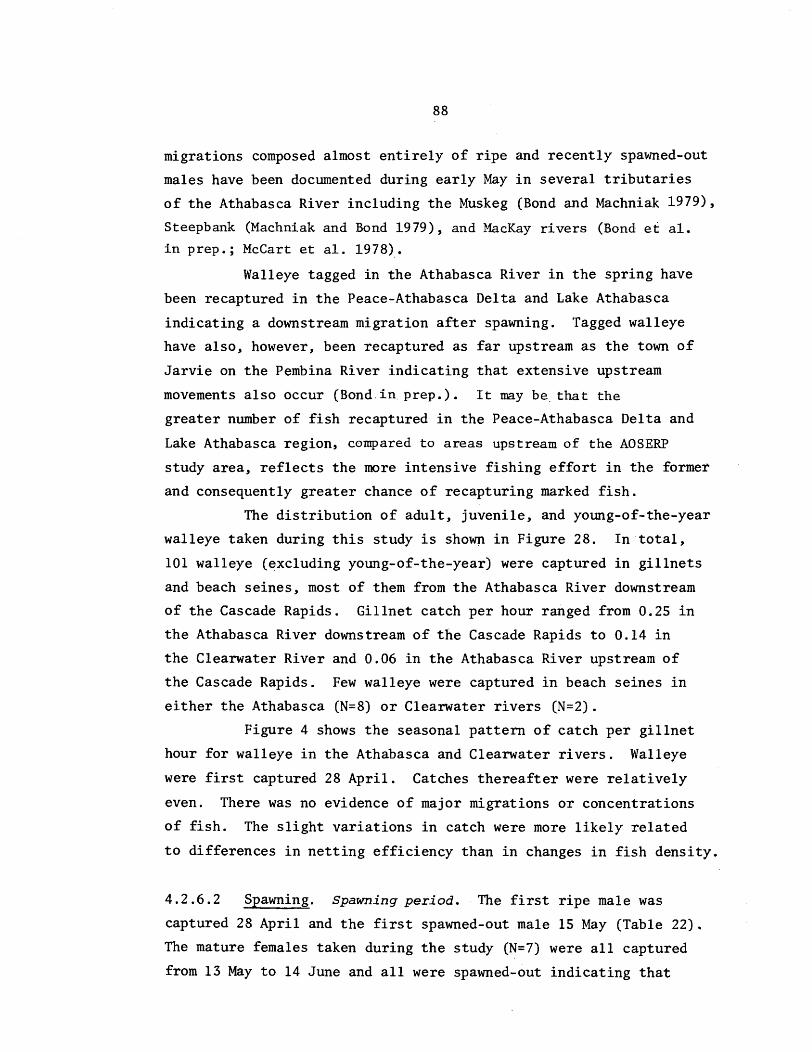
28. Locations Where Walleye Were Taken in the Present Study Area . . . . . . . . • . . . . . . . . . . . . . . . . . . . . . . . . . . . . . . . . . . . . 89
29. The Length-Frequency Distribution of Male and Female Walleye Taken in the Athabasca and Clearwater Rivers Upstream of Fort McMurray, 28 April to 25 June 1978 94
30. Comparison of Growth Rates of Walleye Collected in this Study and Walleye Collected in Six Other Studies in Alberta . . . . . . . . . . . . . . . . . . . . . . . . . . . . . . . . . . . . . . . . . . . . . 97
31. Seasonal Patterns of Catch Per Metre of Shoreline Seined for Mountain Whitefish Fry, Longnose Dace, Lake Chub, Fathead Minnow, and Trout-Perch in the Athabasca and Clearwater Rivers, 28 April to 25 June 1978 ......................................•..... 100
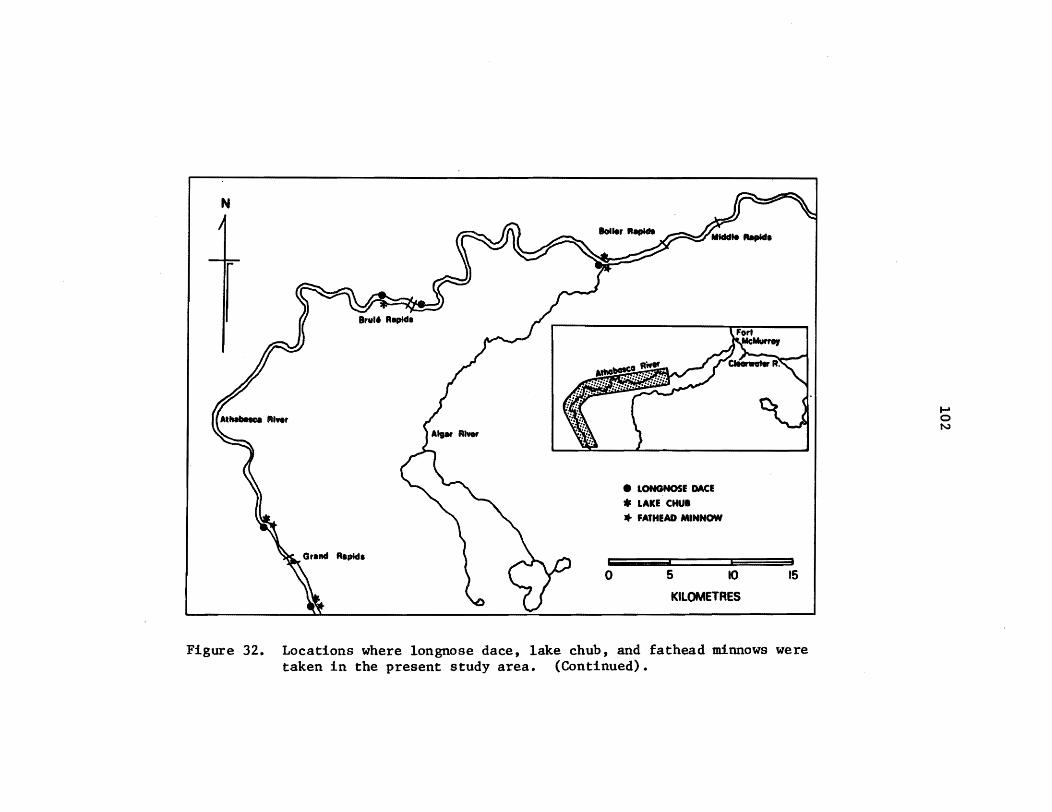
32. Locations Where Longnose Dace, Lake Chub, and Fathead Minnow·Were Taken in the Present Study Area ••..•......... 102
33. Locations Where Emerald Shiner, Spottail Shiner, and Trout-Perch Were Taken in the Present Study Area ......• 106
34. Locations Where Young-of-the-Year and Older Burbot Were Taken in the Present Study Area ........................ 111
35. Locations Where Slimy Sculpin, Sp~onhead Sculpin, and Unidentified Sculpin Young-of-the-Year Were Taken in the Present Study Area . . . . . . . • . . . . . . . . . . . . . . . . . . . . . . . .. 114
xvi i
ABSTRACT
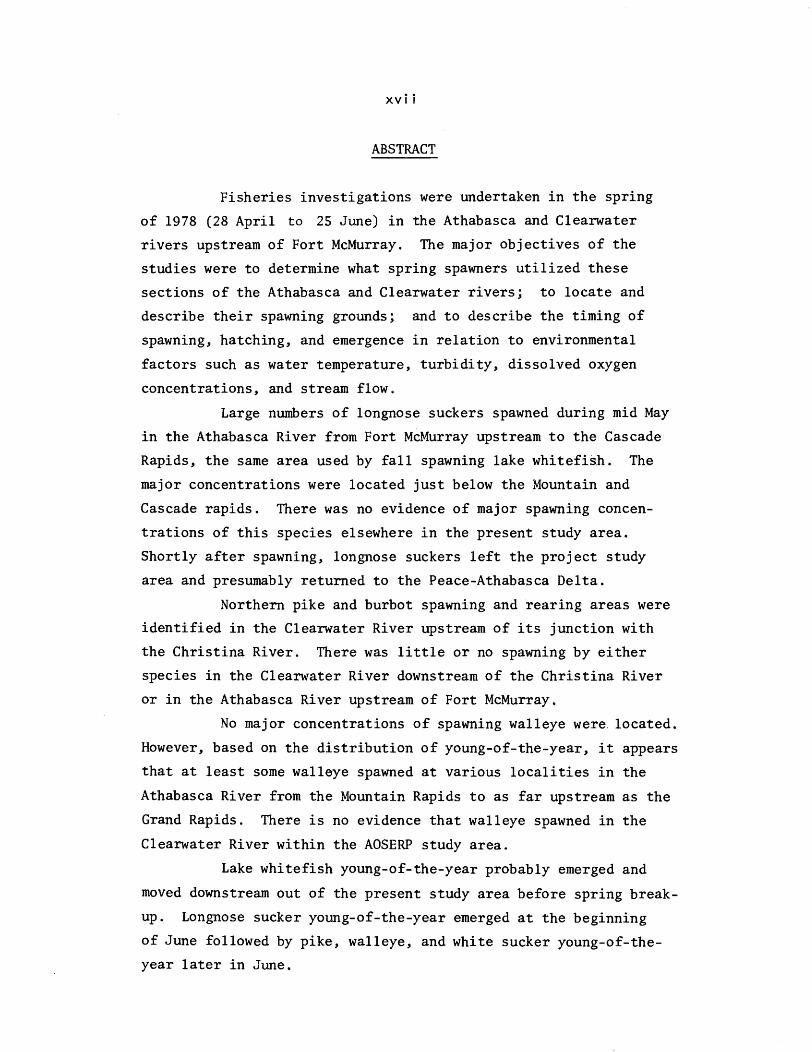
Fisheries investigations were undertaken in the spring
of 1978 (28 April to 25 June) in the Athabasca and Clearwater
rivers upstream of Fort McMurray. The major objectives of the
studies were to determine what spring spawners utilized these
sections of the Athabasca and Clearwater rivers; to locate and
describe their spawning grounds; and to describe the timing of
spawning, hatching, and emergence in relation to environmental
factors such as water temperature, turbidity, dissolved oxygen
concentrations, and stream flow.
Large numbers of longnose suckers spawned during mid May
in the Athabasca River from Fort McMurray upstream to the Cascade
Rapids, the same area used by fall spawning lake whitefish. The
major concentrations were located just below the Mountain and
Cascade rapids. There was no evidence of major spawning concen
trations of this species elsewhere in the present study area.
Shortly after spawning, longnose suckers left the project study
area and presumably returned to the Peace-Athabasca Delta.
Northern pike and burbot spawning and rearing areas were
identified in the Clearwater River upstream of its junction with
the Christina River. There was little or no spawning by either
species in the Clearwater River downstream of the Christina River
or in the Athabasca River upstream of Fort McMurray.
No major concentrations of spawning walleye were. located.
However, based on the distribution of young-of-the-year, it appears
that at least some walleye spawned at various localities in the
Athabasca River from the Mountain Rapids to as far upstream as the
Grand Rapids. There is no evidence that walleye spawned in the
Clearwater River within the AOSERP study area.
Lake whitefish young-of-the-year probably emerged and
moved downstream out of the present study area before spring break
up. Longnose sucker young-of-the-year emerged at the beginning
of June followed by pike, walleye, and white sucker young-of-the
year later in June.
xv iii
The Athabasca River, and to a lesser extent the Clearwater
River, provide valuable habitat for a number of minor species
including flathead chub, longnose dace, and lake chub. Large
numbers of juvenile goldeye also use the area as feeding grounds
during the open-water period.
xix
ACKNOWLEDGEMENTS
The field assistance of William Grant and Daniel McCart
is gratefully acknowledged. Valuable assistance during the
preparation of this manuscript was provided by Joyce Harris and
Cecilia Gossen.
The authors would also like to thank the personnel of
the AOSERP Mildred Lake Research Facility for their support
and assistance.
This research project WS 1.6.1 was funded by the Alberta
Oil Sands Environmental Research Program, a joint Alberta-Canada
research program established to fund, direct, and co-ordinate
environmental research in the Athabasca Oil Sands area of north
eastern Alberta.
1
1. INTRODUCTION
1.1 BACKGROUND
The Alberta Oil Sands Environmental Research Program (AOSERP)
has, as part of its mandate, the responsibility of determining the
baseline status of various aquatic ecosystems in the AOSERP study area
(Figure 1) in order to assess the probable impact of oil sands develop
ment. This study, an investigation of spring spawning fish populations
in the Athabasca and Clearwater rivers upstream of Fort McMurray, was
conducted in an area where little information was previously available.
Until now, the only studies on spawning fish in the mainstem
Athabasca and Clearwater rivers upstream of Fort MCMurray have been
those of Jones et ale (1978) on fall spawning lake whitefish. Earlier
studies by Griffiths (1973) on the Clearwater River were conducted
upstream of and outside the present boundaries of the AOSERP study
area while those on the Athabasca River were located near the Great
Canadian Oil Sands (GCOS) 1 plant downstream of Fort MCMurray. Recently
completed studies by Tripp and Tsui (in prep.) were concentrated on
several tributary streams and lakes in the southern portion of the
AOSERP study area. They identified major spawning runs of northern pike,
longnose suckers, and white suckers in the Christina River but provided
little additional information on spring spawners in the Athabasca River.
Studies on the Athabasca River downstream of Fort MCMurray
(Bond and Berry in prep.a, in prep.bj MCCart et ale 1977) show, however,
the importance of the Athabasca River as a major migration route for
several important fish species. Both longnose and white suckers, for
example, have been shown to move upstream early in the spring to spawn
in several major tributaries of the Athabasca River. These include
the Muskeg (Bond and Machniak 1977, 1979), Steepbank (Machniak and
Bond 1979 ), and MacKay (Bond et al;. in prep.; McCart: et a1. 1978)
rivers. There has been no evidence, however, of spawning by either
sucker species in the Athabasca River itself. After spawning, most
suckers appear to return to the Peace-Athabasca Delta and Lake
Athabasca.
IGCOS amalgated with Sun Oil Company in August 1979, after the writing of this report was completed, to become Suncor, Inc.
~.AOSERP'" v'uOVAREA •
AIII.rta
Edmonton •
Km 10 0
• H lINt 10 20 30
MI10 0 20 30
Figure 1. The AOSERP study area.
2
3
Large numbers of goldeye also migrate upstream shortly
after spring break-up. This migration consists almost exclusively
of immature fish in the 230 to 300 mm range and probably represents
a movement by prespawning age fish from overwintering areas in the
Peace-Athabasca Delta to feeding grounds in the Athabasca River.
Jones et al. (1978) indicate that they move as far upstream as the
Grand Rapids on the Athabasca River (140 km above Fort McMurray)
and the Christina River on the Clearwater River (25 km above Fort
McMurray). They are also taken in the lower reaches of the MacKay
(McCart et al. 1978) and Christina (Tripp and Tsui in prep.)
rivers but not in smaller tributaries such as the Muskeg and Steep
bank rivers (Bond and Machniak 1977,'1979; Machniak and Bond 1979).
Catches decline in the fall as goldeye move back downstream to overwintering areas.
In the fall, lake whitefish migrate upstream from Lake
Athabasca to spawn in the Athabasca River. Jones et al. (1978)
indicate that spawning occurs as far upstream as the Cascade Rapids
(38 km upstream of Fort McMurray). The largest concentration,
however, is located immedia~ely below the MOuritain Rapids, approximately
15 km upstream of Fort MCMurray. After spawning (13 to 25 October
~977), lake Whitefish quickly return to the Peace-Athabasca Delta
and Lake Athabasca.
The migratory patterns and major spawning areas of other
species, such as northern pike and walleye, in the Athabasca River
are not known as well as those of lake whitefish, goldeye, longnose
suckers, and white suckers. Catches of northern pike in the main
stem rivers are generally small, sporadic, and seldom useful for
describing seasonal movements. A small upstream migration has
been described for the Muskeg River (Bond and Machniak 1977, 1979)
although it was composed largely of spent and immature
northern pike. Most pike spawning has been presumed to occur in
marshy backwaters along the Athabasca River and in the Athabasca
River Delta. The only major spawning area yet described for
northern pike in the AOSERP study area occurs in the Christina
River (Tripp and Tsui in prep.), a tributary of the Clearwater River.
4
Studies on the Athabasca River indicate that walleye
enter the Athabasca River under the ice and may commence spawning
shortly before spring break-up. Females, however, are rarely
sampled which may indicate that they leave the spawning areas
immediately after spawning. Ripe and recently spent males, on the
other hand, are commonly sampled throughout the lower Athabasca
River. Post-spawning runs of spent males have been identified in
the Steepbank (Machniak and Bond 1979) and MacKay (Bond et al.
in prep; McCart et al. 1978) rivers. The definite location of any
walleye spawning areas in the Athabasca River is unknown. The
most likely locations are suggested to be in the rocky, faster
flowing reaches of the Athabasca or Clearwater rivers upstream of
Fort McMurray (Bond and Berry in prep.b).
1.2 OBJECTIVES
The overall objective of this study was to describe the
habitat and biology of the major spring spawning species during the
spring in the Athabasca and Clearwater rivers upstream of Fort
McMurray. More specifically, the objectives were:
1. To identify and describe the spawning characteristics
of major fish species during the spring in the
Athabasca and Clearwater rivers upstream of Fort
McMurray to the boundaries of the AOSERP study area;
2. To describe, delineate, and quantify actual and
potential spring spawning areas by species;
3. To describe the time frame of spawning, hatching,
fry development, and emergence for each species in
relation to environmental factors; and
4. To describe and quantify the downstream movement of
fry (including fall spawning whitefish) in relation
to natural environmental factors.
To meet these objectives, a three-man crew was used to
conduct field investigations on' the Athabasca and Clearwater rivers
from spring break-up until the end of June,1978. Eighteen stations,
16 on the Athabasca River, six on the Clearwater River, and two on
5
the Christina River, were selected for routine sampling. The
locations of the above stations were similar to those in Jones et
al. (1978). Thirteen additional stations were also sampled on one
or two occasions to further delineate actual and potential spring
spawning areas. Of these, five were located on the Clearwater
River upstream of the AOSERP study area.
Each station was sampled with standard gillnet gangs,
large mesh beach seines, and minnow seines, depending on ice
conditions, water levels, and the amount of debris present in the
rivers. Initially, the efforts were concentrated on sampling
larger fish in order to describe the seasonal movements, spawning
period, spawning area, and basic life history of each major species.
After spawning, drift netting and small mesh seining along inshore
areas were also emphasized in order to describe the emergence times,
downstream movements, and distribution of young-of-the-year.
This report consists of two volumes. Volume I is an
explanatory text complete with summary tables and maps, while
Volume II contains detailed site descriptions, catch data, and
dissection data.
Volume II has been released as Open File 4, copies of
which can be viewed at designated libraries. Copies can be
purchased directly from Riley's Reproductions and Printing Ltd.,
10180-108 Street, Edmonton, Alberta. For further information,
please contact Program Management at AOSERP.
6
2. MATERIALS AND METIlODS
The study began in late April 1978, prior to ice break-up on
tha Athabasca and Clearwater rivers. There was an initial helicopter
reconnaissance of the Athabasca River, upstream of Mountain Rapids,
on 27 April. At that time, this was the only open water along the
Athabasca River in the AOSERP study area. After break-up (29 April
for both rivers), a jet-powered riverboat was used to reach sampling
sites on the Clearwater River and its tributary, the Christina River,
and on the Athabasca River as far upstream as Cascade Rapids. A
helicopter was used to sample the Athabasca River upstream of
Cascade Rapids to the limit of the AOSERP study area.
The locations of sampling stations are indicated in
Figure 2. Routine sampling stations were visited at 2 to 10 day
intervals. At each visit, the stations were gillnetted anq/or
seined, depending on conditions. The variable mesh gillnets used
were standard gangs consisting of'six individual panels 3.0 m long
and 2.4 m deep of the following mesh sizes: 3.8, 5.1, 6.3, 7.6,
8.9, and 10.2 cm stretch mesh.
Gillnets were set for periods from 2 to 24 hours,
depending primarily on stream conditions. It was not possible to
set nets for long periods when large amounts of debris were present.
Records were kept of the duration of sets and the numbers of each
species caught.
The seines used were of two types: a large mesh beach
seine 30.5 m long and 2.4 m deep and 5.1 cm stretch mesh; and a
pole-mounted small mesh minnow seine 1.2 m deep and 3.0 m in length
constructed of 3.2 mm nylon marquissette.
Beach seining was done in quiet backwater areas from the
shoreline with the aid of jet boats. Records were kept of the
number of hauls and the catch of each species. Minnow seining was
done along the shoreline and careful records kept of the number of
hauls, the length of shoreline seined, and the catch of each species.
At some of the routine sampling stations (Stations 7, 11,
12, and 15 on the Athabasca and Stations 17 and 21 on the
Clearwater River), drift samples were taken to collect fish eggs
N
1
o
• Retulor Itotlon o Survey etatlon
5 10 KILOMETRES
15
Figure 2. The project study area showing locations at regular and survey sampl ing stations and the sampling methods used at each station. GN=standard gil1net gang, SN=minnow seine, BS=beach seine. (Continued).
and newly emerged fry. The sampling apparatus has an opening 30.5 cm2
and a mesh size of 600 ~m. The apparatus was fished just
below the water surface. Records were kept of the velocity of
water through the net and of the ·duration of the sampling effort
so that the catch could be related to the volume of water sampled.
Normally, the drift nets were fished for 5 to 15 minute periods.
Survey sampling stations were sampled less frequently
than the routine stations. The survey stations were sampled in an
attempt to delineate the spawning grounds of spring spawners and
to locate concentrations of fry. The same sampling methods were
used at the routine sampling sites.
A large number of longnose suckers were marked by partial
finclips and released alive. Three distinctive marks were used
depending on area of capture:
1. Fish captured at the mouth of the Clearwater River
and in the Athabasca River downstream of Fort McMurray
were marked by the partial removal of the left pelvic
fin;
2. Fish captured in the Athabasca River from Fort
McMurray upstream to Mountain Rapids were marked
by partial removal of the right pectoral fin; and
3. Fish captured in the Athabasca River from Mountain
Rapids upstream to Cascade Rapids were marked by
partial removal of the left pectoral fin.
All subsequent catches were examined for recaptured fish.
Captured fish were either retained for detailed life
history analysis in the laboratory or released alive. The latter
were examined for evidence of maturity and spawning condition.
As they approached spawning, it was possible to identify mature
fish in the field as:
1. Mature-green: fish that would spawn, generally
characterized by large body size, large gonads, and
secondary evidence of maturity such as nuptial
tubercles and body colouration;
2. Mature-ripe: fish from which sex products could be
11
extruded by gentle pressure on the abdomen; and
3. Spawned-out: fish which had recently completed
spawning as indicated by a flaccid abdomen and the
absence or diminished volume of sex products
expressed by gentle pressure on the abdomen.
Fish retained for detailed life history analysis were
dissected in the laboratory. Each fish was measured to the nearest
millimetre and eggs to the nearest 0.1 rom by calculating the mean
diameter of 10 unpreserved eggs of the largest size class lined up
in a row. Gonads were removed and weighed to the nearest 0.1 g.
For fecundity determination, a weighed subsample, including both
eggs and ovarian tissue, amounting to about 10% of total gonad
weight,was preserved in 10% formalin for later enumeration. Eggs
in the subsample were counted under magnification and the total
fecundity calculated by direct proportion.
After dissection, gonads were classified as mature or
immature. Mature gonads were further classified as green, ripe,
or spawned-out in a manner similar to that described above.
Additional criteria included egg size, gonad weight, looseness of
eggs, colouration, and vascularization of the gonads.
Otoliths were used for determining the age of all fish
species taken during this study with the exception of northern pike
and walleye which were aged with scales. Otoliths were read with
the aid of a binocular microscope using Nordeng's (1961) criteria
for the identification of annuli. Scales were read with the aid
of a projecting microscope using Lagler's (1956) criteria for the
identification of annuli. Each fish was aged by two independent
readers. Differences in age were reconciled during a third joint
reading by the two observers.
Fish stomachs contents were examined in the laboratory
and identified to major taxa (order or family) or other suitable
category (e.g., insect parts, digested material, fish remains).
Data on the presence or absence of various items were used to
calculate frequency of occurrence for various food items. A more
detailed analysis of stomach contents was not undertaken because
12
most of the samples were dead specimens taken in overnight gi11net
sets and the stomachs were therefore in an advanced state of
decomposition.
Throughout the course of the study, water temperature
(pocket thermometer) and dissolved oxygen levels (Hach OX-10
Dissolved Oxygen Kit) were measured at approximately 5 day
intervals at various sites along the Athabasca and Clearwater
rivers. Turbidity samples were also collected in 500 mL hand held
bottles and preserved with 1 mL CuSO~ for later reading on a Hach
Turbidimeter.
13
3. THE STUDY AREA
The area under study extends upstream of Fort McMurray
on both the Athabasca and Clearwater rivers to the southern and
eastern limits of the AOSERP study area (Figure 1). It includes
the mouth of the Christina River, a major tributary of the Clear
water River. Within the present study area, the Athabasca flows a
distance of approximately 140 km at an average gradient of 1.0 m/km.
The banks are approximat~ly 150 to 200 mhigh and forested
with the usual elements of a spruce/aspen boreal forest.
In this reach of the Athabasca River, there are several
sets of rapids that have a major influence on the distribution of
fish species. These are the Mountain and Cascade rapids which are
formed of sills of limestone bedrock stretching almost completely
across the river. An earlier study (Jones et al. 1978) demonstrated
that the areas just downstream of these rapids are major spawning
areas for lake whitefish. Even at low flows, the rapids are a
major obstacle to fish migrations. Rapids upstream of the Cascade
Rapids (e.g., Grand, Brule, Boiler, and Middle rapids) are
discontinuous and do not appear to form a serious barrier to fish
movements.
Coarse gravels are the predominant substrate in the
section of the Athabasca River under study.
The Clearwater River is a slower, meandering,river.
Within the present study area, it flows a distance of approximately
65 km at a gradient of 0.2 m/km before joining the Athabasca
River at Fort McMurray. Its banks are generally low and eroding,
especially along the outside curve of meanders. Most of the
substrate is sand. The river is dotted with numerous islands,
particularly in the upper reaches of the present study area. The
side channels formed by these islands often have extensive growths
of aquatic macrophytes.
A total of 33 stations was sampled during the study
period, 27 April to 26 June 1978. Of these, 17 were regular
stations that were sampled at intervals throughout the study.
The remaining 16 stations include those sampled during preliminary
14
surveys to locate concentrations of spring spawning fish species
or recently emerged fry. The locations of sampling stations are
shown in Figure 2, together with the sampling methods used at each
station. A description of each ,sampling location is included in
Volume II (Tripp and McCart 1979).
3.1 DISCHARGE
The seasonal patterns of daily discharge rates for the
Athabasca River downstream of Fort McMurray and for the Clearwater
River at Draper, Alberta, are shown in Figure 3 for the period
1 April to 30 June 1978. At Fort McMurray, spring break-up on both
rivers occurred 28 April although there was an earlier peak in
discharge in the Athabasca River on 21 April. This earlier peak
did not dislodge ice in the river at Fort McMurray and caused the
ice to pile up as far upstream as the Mountain Rapids. The
Athabasca River upstream of the Mountain Rapids, however, was free
of ice for one week prior to break-up downstream.
During the study period, discharge rates in the Athabasca
River ranged from 252 m3/s on 1 April to a peak of 1.498 m3/s on
4 May. Discharge dropped to 711 m3/s on 20 May but there was a
second major peak of 2).32 m3/s on 19 June as a result of heavy
precipitation and spring runoff upstream of the study area.
Discharge in the Clearwater River was considerably more
stable than on the Athabasca River, rising from a base flow of
61 m3/s on 1 April to a peak of 309 m3/s on 30 April. Discharge
dropped very slowly thereafter.
3.2 DISSOLVED OXYGEN
Dissolved oxygen concentrations were similar in the
Athabasca and Clearwater rivers (Figure 3). Values were highest
just after break-up and then declined through to mid-June. The
highest levels were recorded in the Clearwater on 29 April and
17 May (11.0 mg/L), the lowest on 5 June and 10 June (8.0 mg/L).
In the Athabasca, the highest value was recorded 5 May (10.4 mg/L)
and the lowest on 10 June (8.0 mg/L).
N o
; . 12
•
-~ t:
2100
1100
1500
~ 1200
i
I .00
"0 I
JOO
15
------... -____ ",.e " .. -"
Ice Conditions
- Atbabatca R . ---Clearwater R.
309
!t _____ ----------. ....,I'
,,~----------.----------------MAY
Figure 3. Seasonal dissolved oxygen levels, water temperature, turbidity, and daily discharge in the Athabasca and Clearwater rivers, 28 April to 25 June 1978. (Stream discharge data provided by Water Survey of Canada.)
16
In both rivers, the recorded values were close to
saturation at all times and the declines in concentration were
largely the result of increasing water temperatures since the oxygen
carrying capacity of water declines as temperature increases.
3.3 TEMPERATURE
Water temperatures in the Athabasca River upstream of the
Mountain Rapids were 9 to 10°C on 27 April, approximately one week
after the break-up of the upper reaches of the Athabasca. Water temper-
atures downstream of the Mountain Rapids therefore increased
rapidly (Figure 3) when the ice broke up at Fort McMurray on 29 April, flooding the lower section of the Ath~basca River with warm
water. Temperatures increased gradually thereafter in both the
Athabasca and Clearwater rivers, reaching a maximum of 18°C in
early June.
3.4 TURBIDITY
The seasonal pattern of turbidity in the Athabasca and
Clearwater rivers, April to June 1978, is shown in Figure 3.
Values in the Athabasca ranged from highs of 65 FTU's (Formazin
Turbidity Units) on 6 May, and_95 FTU's on 22 June during periods
of peak discharge, 'to 15 FTU's on'15 May at low flow. Turbidity
was highest (35 FTU's) on the Clearwater just after break-up,
30 April to 5 June, and then declined to 4.7 FTU's 18 June.
3.5 WATER QUALITY
Additional information on various water quality parameters
in the Athabasca River upstream of Fort McMurray is summarized in
Table 1 (telephone conversation with A.M. Akena, Pollution Control
Division, Alberta Environment; January 1979).
17
Table 1. Water quality in the Athabasca River 100 m upstream of the Horse River, 13 June 1978.
0 Temperature ( C) 17.5 TIC (mg/L) 23.5 pH 8.0 Dissolved Organic Conductivity 0 Carbon (mg/L) 23.5
(~mhos/cm @ 25 C) 110 Total Nitrogen D.O. (mg/L) 9.0 (mg/L) 0.079 Ca. (mg/L) 24.9 Ammonium (mg/L) 0.04 Mg (mg/L) 7.0 Kjeldahl N (mg/L) 0.75 Na (mg/L) 4.3 Phenol (mg/L) 0.004 K (mg/L) 0.8 Oil & Grease (mg/L) 0.6 Cl (mg/L) 1.1 N03 (mg/L) 0.074 S04= (mg/L) 17.1 N02 (mg/L) 0.005 Total Alkalinity COD (mg/L) 61
(mg/L) 90.7 Chromium+ 6 (mg/L) 0.003 Bicarbonate (mg/L) 111.0 Cu (mg/L) 0.004 Hardness (mg/L) 91.0 Fe (mg/L) 7.5 Fl (mg/L) 0.5 Pb (mg/L) 0.012 Tannin and Lignin Mn (mg/L) 0.283
(mg/L) 0.5 Zn (mg/L) 0.007 Total Phosphate Va (mg/L) 0.006
(mg/L) 0.032 Se (mg/L) 0.0009 Orthophosphate Hg (mg/L) <0.001
(mg/L) 0.009 Ni (mg/L) 0.004 Filterable Residue Al (mg/L) 0.63
(mg/L) 102 Co (mg/L) 0.002 Filterable Residue-- Bo (mg/L) 0.02
inorganic (mg/L) 83 Free CO2 (mg/L) 1.7 Non-filterable
Total ••••••••••••••••••••••••••••••••••••••••••••• 2197 100.0 531 100.0 5180 100.0 7908 100.0
Table 3. Relative abundance of fish species in gi11net, beach seine, and minnow seine catches from the Athabasca River upstream of the Cascade Rapids, the Athabasca downstream of the Cascade Rapids to Fort MCMurray, and the Clearwater River including the mouth of the Christina River, 28 April to 25 June 1978.
and spoonhead sculpin were also absent from the latter.
Rainbow trout (Jones et a1. 1978), northern redbe11y
dace, ninespine stickleback, and Iowa darter (Bond and Berry
in prep.a,b) were the only species previously reported from
the Athabasca and Clearwater rivers in the AOSERP study area not
captured in this study.
Data summarizing the total fishing effort and catch per
unit effort for each sampling method and each sampling area are
presented in Table 4. Catch per unit effort was highest for beach
seining in the Athabasca downstream of the Cascade Rapids largely
because of the large concentrations of 10ngnose suckers in this area.
Gi11net catch per unit effort was also highest in this area. Catch
per unit effort for minnow seining was highest in the lower Athabasca
when sucker fry are excluded from the results but highest in the
Clearwater River when they are included.
4.2 LIFE HISTORIES OF MAJOR SPECIES
4.2.1 Go1deye
4.2.1.1 Distribution and movements. Previous studies (e.g., McCart
et a1. 1977; Jones et a1. 1978; Bond and Berry in prep.b) have
shown that goldeye in the Athabasca River are almost exclusively
large juveniles which apparently move upstream from the Peace
Athabasca Delta and use the river as a summer feeding area.
In the spring of 1978, juvenile goldeye were found
throughout the study area, as far upstream as the Grand Rapids
on the Athabasca River and the mouth of the Christina River, a
tributary to the Clearwater River.
Go1deye first appeared in both the Athabasca and Clear
water rivers around the middle of May. While there were fluctu
ations in ~oth gi11net and seine catches (Figures 4 and 5) from
mid-May to the end of the study period, goldeye were present in
both streams throughout the study period. It is more likely that
the fluctuations were due to sampling error than to any significant
23
Table 4. Summary of gillnetting, heach se1n1ng and minnow seining catch per unit effort in the present study area, 28 Apr1l to 25 June 1978.
Sampling Athabasca Athabasca Clearwater Total Method above the below the Christina
Cascades Cascades
Gillnetting
Total hours 330. O. 241.0 284.5 855.5
Total fish 147 197 158 502
Fish per hour 0.45 0.82 0.56 0.59
Beach Seining
Total hauls 2 64 22 88
Total fish 1 2109 78 2 188
Fish per haul 0.50 32.95 3.55 24.86
Minnow seining
Total hauls 45 162 74 281
Total distance em) 550 2 447 602 3 599
Total fisha 847 6 136 886 3599
Total fishb 1164 6 503 3 421 11 088
Catch per a
metre 1.54 2.51 1.47 2.19
Catch per b
metre 2.12 2.66 5.68 3.08
b excluding sucker young of the year including sucker young of the year
--A .......
'S.O --- CI ... r ......
2.0
1.0
3.0
LO
I 2.0
I 1.0 G !c u
1.0
2.0
1.0
A I ,
I I
I .. '" I , .... ' \ I
, \ I ..... \ I
24
........
I FLATHEAD CHua I
(LONGNOSE SUCKER I
I WALLEYE I
APRIL JUNE
Figure 4. Seasonal patterns of catch per gi11net hour for goldeye, pike, flathead chub, longnose sucker, and walleye in the Athabasca and Clearwater rivers upstream of Fort McMurray, 28 April to 23 June 1978. Sampling times are indicated by short vertical bars on the horizontal axis.
25
110.0
mo I lONG NOSE SUCKER I 10.0
8QO
"PQO
IQ.O - Alhobaaca
--- atorwat., 50.0
«1.0
JO.O
i 20.0 a: It :I: 10.0
5 I .. s.o i :I: I WHITE SUCKER I ~ 2D
LO
3.0
2.0 I GOLDEYE I 1.0
AfllRtL JUNE
Figure 5. Seasonal patterns of catch per beach seine haul for longnose suckers, white suckers, and goldeye in the Athabasca and Clearwater rivers upstream of Fort MCMurray, 28 April to 15 June 1978. Sampling times are indicated by short vertical bars on the horizontal axis.
26
changes in the distribution of fish.
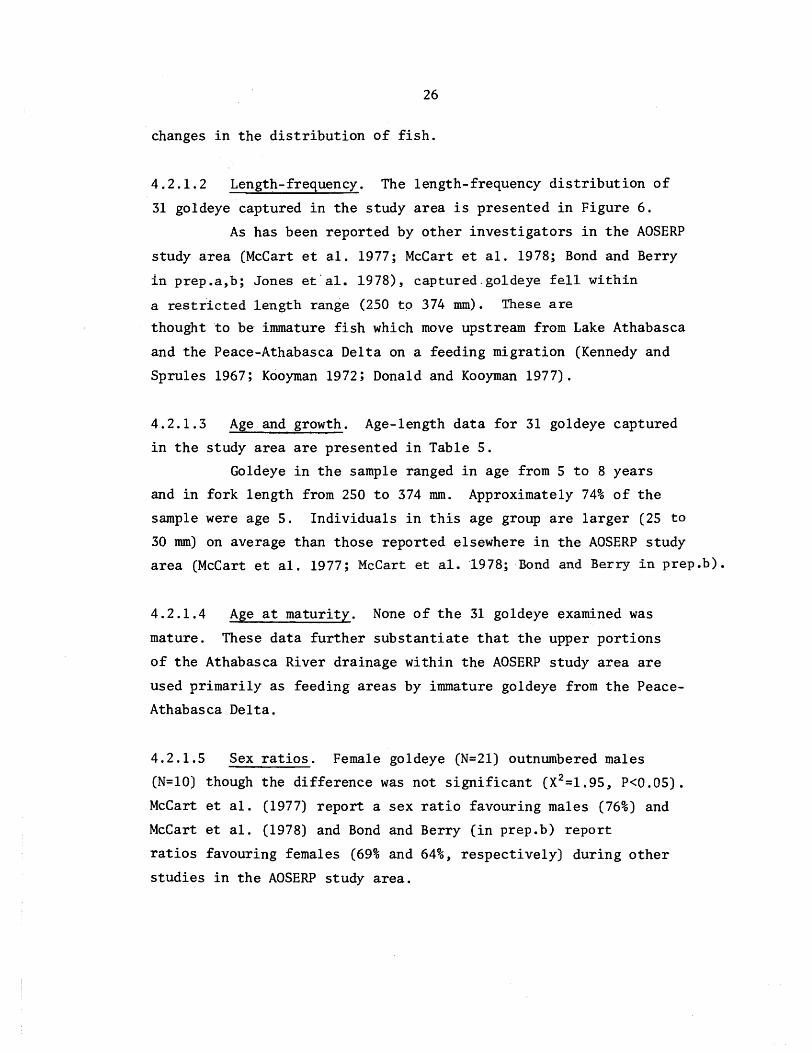
4.2.1.2 Length-frequency. The length-frequency distribution of
31 goldeye captured in the study area is presented in Figure 6.
As has been reported by other investigators in the AOSERP
study area (McCart et al. 1977; McCart et al. 1978; Bond and Berry
in prep.a,b; Jones et'al. 1978), captured.goldeye fell within
a restricted length range (250 to 374 mm). These are
thought to be' immature fish which move upstream from Lake Athabasca
and the Peace-Athabasca Delta on a feeding migration (Kennedy and
Sprules 1967; Kooyman 1972; Donald and Kooyman 1977).
4.2.1.3 Age and growth. Age-length data for 31 goldeye captured
in the study area are presented in Table 5.
Goldeye in the sample ranged in age from 5 to 8 years
and in fork length from 250 to 374 mm. Approximately 74% of the
sample were age 5. Individuals in this age group are larger (25 to
30 mm) on average than those reported elsewhere in the AOSERP study
area (McCart et al. 1977; McCart et ale '1978; Bond and Berry in prep.b).
4.2.1.4 Age at maturity. None of the 31 goldeye examined was
mature. These data further substantiate that the upper portions
of the Athabasca River drainage within the AOSERP study area are
used primarily as feeding areas by immature goldeye from the Peace
Athabasca Delta.
4.2.1.5 Sex ratios. Female goldeye (N=2l) outnumbered males
(N=lO) though the difference was not significant (X 2 =1.95, P<0.05).
McCart et al. (1977) report a sex ratio favouring males (76%) and
McCart et al. (1978) and Bond and Berry (in prep.b) report
ratios favouring females (69% and 64%, respectively) during other
studies in the AOSERP study area.
27
8 I GOLDEYE 1781 % U)
ii::
~ e a:: &&I 4 CD :IE :::) 3 z
2
Figure 6. Length-frequency distribution of goldeye taken from the Athabasca and Clearwater rivers upstream of Fort McMurray, 28 April to 25 June 1978.
Table 5. Age-length relationship with age-specific sex ratios and percent maturity for goldeye taken from the project study area, 28 April to 25 June 1978.
Fork Length (nun) Males Females Age Mean S.D. S.E. Range N % % Mature N % % Mature Unsexed Total
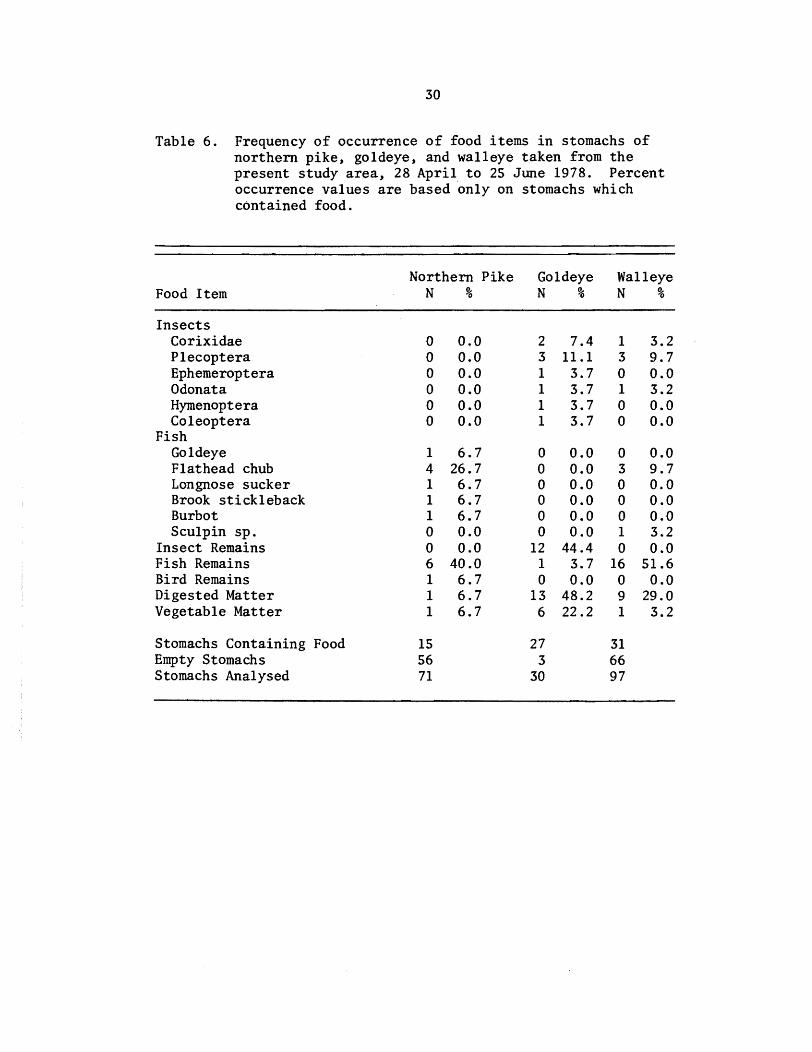
4.2.1.7 Food habits. Percent occurrence of food items in 30
goldeye stomachs is shown in Table 6. Although a large proportion
of the contents were unidentifiable, aquatic and terrestrial
insects predominated.
4.2.2 Northern Pike
4.2.2.1 Distribution and movements. There is no evidence from
previous studies in the AOSERP study area that northern pike under
take extensive migrations such as those which characterize lake
whitefish, goldeye, and longnose sucker. It seems likely that
the majority of pike remain in the study area throughout the year,
although they undoubtedly undertake short migrations between over
wintering, spawning, and summer feeding areas.
In the spring of 1978, larger juvenile and adult pike
were found throughout the project study area (Figure 7) from late
April until late June when the study ended. Catches were generally
small and the data cannot be used to describe patterns of movements
(Figure 4).
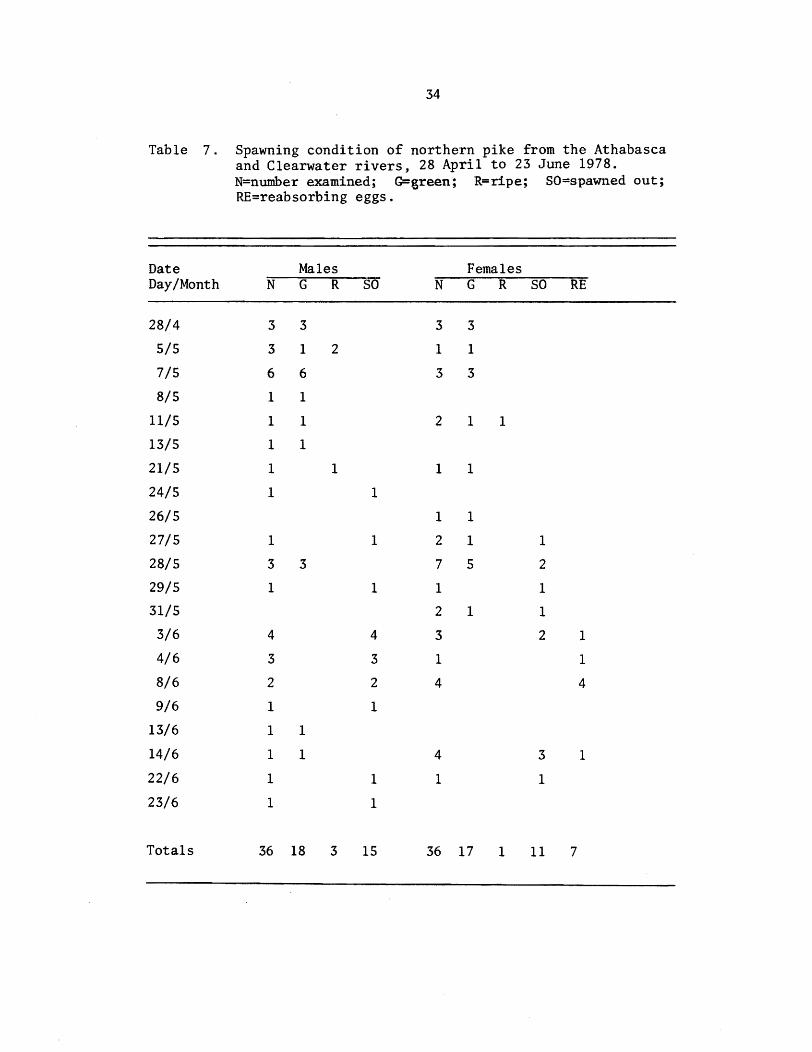
4.2.2.2 Spawning. Spawning period. The first ripe males
(Table 7) were captured on 5 May and the first ripe female on 11 May.
Spawned-out females were first tak~n on 27 May although a
green female was taken as late as 31 May. These data suggest that
the spawning period was largely concentrated in the last half of
May. An unusual feature of the data was the occurrence of a high
30
Table 6. Frequency of occurrence of food items in stomachs of northern pike, goldeye, and walleye taken from the present study area, 28 April to 25 June 1978. Percent occurrence values are based only on stomachs which contained food.
Northern Pike Goldeye Walleye Food Item N % N % N %
Figure 7. Locations where. pike were taken in the present study area. Major spawning areas are also indicated. (Continued).
W I-'
32
'I
~!I .
"tS i OJ =' c:::t I
....t III
lIlt ... ! c:::t • 8 i • **=:::: .••••
j . ,....
f! z ...... I' J 6'0 ~
N
r
II ... C,.ek
o
Figure 7. Concluded.
NORTHERN PIKE
• Adult
* Juvenile ,.. Young-of-the-yea,
:::;::: MaiM Spawning AnMll
5 10
KILOMETRES
15
w w
34
Table 7. Spawning condition of northern pike from the Athabasca and Clearwater rivers, 28 April to 23 June 1978. N=number examined; G=green; R=ripe; SO=spawned out; RE=reabsorbing eggs.
Date Males Females Day/Month N G R SO N G R SO RE
28/4 3 3 3 3
5/5 3 1 2 1 1
7/5 6 6 3 3
8/5 1 1
11/5 1 1 2 1 1
13/5 1 1
21/5 1 1 1 1
24/5 1 1
26/5 1 1
27/5 1 1 2 1 1
28/5 3 3 7 5 2
29/5 1 1 1 1
31/5 2 1 1
3/6 4 4 3 2 1
4/6 3 3 1 1
8/6 2 2 4 4
9/6 1 1
13/6 1 1
14/6 1 1 4 3 1
22/6 1 1 1 1
23/6 1 1
Totals 36 18 3 15 36 17 1 11 7
35
proportion (7 of 36 mature females sampled) of mature females which
appeared not to have successfully spawned and were in the process
of re-absorbing their eggs. All of these fish were taken in the
Athabasca and not in the Clearwater. In rivers, this species
typically spawns in weedy backwaters and the presence of unspawned
fish may reflect the absence of suitable spawning areas in the
Athabasca River.
spawning areas and fry emergence. There is nO.direct
evidence of the location of spawning grounds for northern pike in
the project study area. There is, however, indirect evidence from
the distribution of young-of-the-year that a major spawning ground
for this species in the project study area is located in the Clear
water River upstream of its junction with the Christina River
(Figure 7). In the upper Clearwater, catches of young-of-the-year
pike in backwaters and side channels were very high, 2.65 fry per
metre of shore seined compared with only 0.05 fry per metre seined
downstream of the Christina River. No young-of-the-year pike were
taken from the Athabasca River at any time during the study.
The upper Clearwater River, which is characterized by ma~y
islands and quiet, shallow, side channels, does appear to have
excellent spawning habitat for northern pike. The side channels
range from 1 or 2 m to more than 10 m in width and from
less than 0.15 m to more than 1 m in depth. The substrate is
largely composed of heavy silt and organic debris with.a dense
cover of aquatic macrophytes. In June, the latter was formed
primarily of Mares-tail (Hippuris vulgaris) with pickerel weed
(Potomogeton richardsoni) and other pond weeds (P. pectinatus,
Myriophyllum exalbescens) also present. A dense growth of partly
submerged Equisetum sp. and occasionally Scirpus sp. often
dominated the bank vegetation. Current speed was usually negligible.
The first young-of-the-year pike were captured 7 June.
The mean fork length of 30 pike taken on 13 June was 30.9 ± 6.04 mm.
The scarcity of young-of-the-year pike in the lower Clearwater
River may indicate that during the first few week.s of their life
they do not move far from the spawning areas.
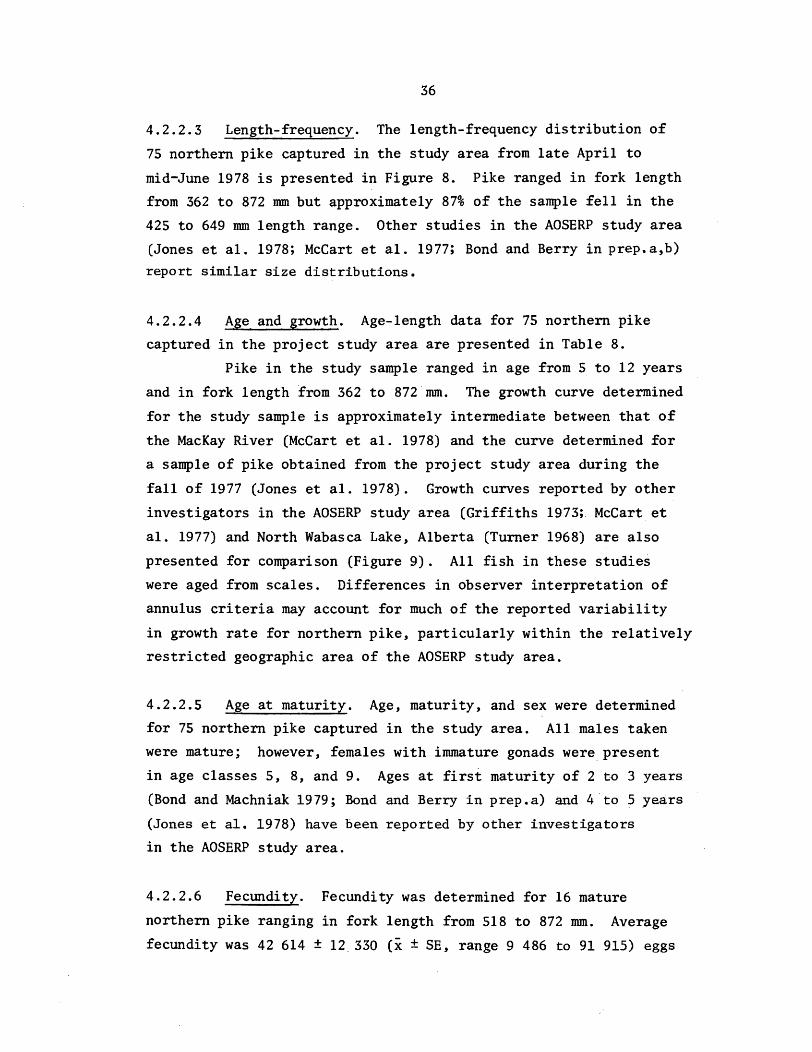
36
4.2.2.3 Length-frequency. The length-frequency distribution of
75 northern pike captured in the study area from late April to
mid-June 1978 is presented in Figure 8. Pike ranged in fork length
from 362 to 872 mm but approximately 87% of the sample fell in the
425 to 649 mm length range. Other studies in the AOSERP study area
(Jones et al. 1978; McCart et al. 1977; Bond and Berry in prep.a,b)
report similar size distributions.
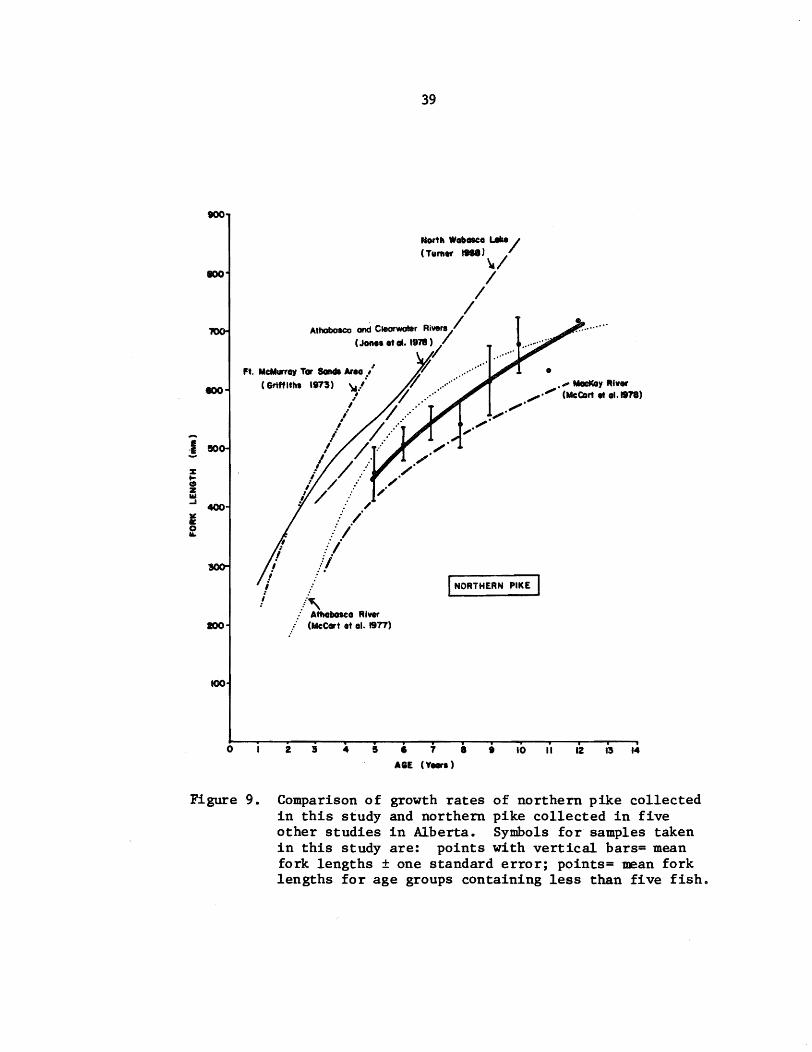
4.2.2.4 Age and growth. Age-length data for 75 northern pike
captured in the project study area are presented in Table 8.
Pike in the study sample ranged in age from 5 to 12 years
and in fork length from 362 to 872 mm. The growth curve determined
for the study sample is approximately intermediate between that of
the MacKay River (McCart et al. 1978) and the curve determined for
a sample of pike obtained from the project study area during the
fall of 1977 (Jones et al. 1978). Growth curves reported by other
investigators in the AOSERP study area (Griffiths 1973; McCart et
al. 1977) and North Wabasca Lake, Alberta (Turner 1968) are also
presented for comparison (Figure 9). All fish in these studies
were aged from scales. Differences in observer interpretation of
annulus criteria may account for much of the reported variability
in growth rate for northern pike, particularly within the relatively
restricted geographic area of the AOSERP study area.
4.2.2.5 Age at maturity. Age, maturity, and sex were determined
for 75 northern pike captured in the study area. All males taken
were mature; however, females with immature gonads were~present
in age classes 5, 8, and 9. Ages at first maturity of 2 to 3 years
(Bond and Machniak 1979; Bond and Berry in prep.a) and 4 to ? years
(Jones et a1. 1978) have been reported by other investigators
in the AOSERP study area.
4.2.2.6 Fecundity. Fecundity was determined for 16 mature
northern pike ranging in fork length from 518 to 872 mm. Average
fecundity was 42 614 ± 12,330 (x ± SE, range 9 486 to 91 915) eggs
Figure 8. The length-frequency distribution of male and female northern pike taken in the Athabasca and Clearwater rivers upstream of Fort MCMurray, 28 April to 2S June 1978.
.
tJ.I ""-I
TABLE 8. Age-length relationship with age-specific sex ratios and percent maturity for northern pike taken from the present study area, 28 April to 25 June, 1978.
Fork Length (nun) Males Females Age Mean S.D. S.E. Range N % % Mature N % ~ Mature Unsexed Total
Figure 9. Comparison of growth rates of northern pike collected in this study and northern pike collected in five other studies in Alberta. Symbols for samples taken in this study are: points with vertical bars= mean fork lengths ± one standard error; points= mean fork lengths for age groups containing less than five fish.
40
per female. Fecundity was significantly correlated with length
formulae were determined separately for male and female pike;
however, analysis of covariance did not reveal significant
differences in either slope (F=0.53, P>0.05) or intercept (F=3.50,
P>0.05). Data were therefore combined and the following relation
ship was determined for the total sample:
4.2.2.9
LOgIO Length (mm) = 3.45 LOgIO Weight (g) - 6.40
r=0.97, P<0.05, N=76
Food habits. Of 71 northern pike examined, 79% (56) had
empty stomachs. Identifiable items in stomachs containing food
included remains of flathead chub, burbot, goldeye, longnose sucker,
stickleback, and bird bones (Table 6).
4.2.3 Flathead Chub
4.2.3.1 Distribution and movements. Flathead chub are common in
both the Athabasca River and its major tributaries including the
Clearwater River. The biology of the species is, however, little
known. In the project study area, few large fish, susceptible to
capture by gillnets, were taken prior to mid-May (Figure 4) .
Smaller fish, however, were taken in minnow seine samples in the
project study area throughout the study period with catches peaking
in late June (Figure 11). These data suggest that there may be
migrations of both juvenile and adult flathead chub between the
study area and other parts of the Athabasca drainage.
5.0
•
[J
2.7
41
•
2S
• [J
III
[J Athabosca upstream of Cascades
• Athabasca downstream of Cascades
Jl. Clearwater
2.9
FORK LENGTH (LOG 10 ) (mm)
~igure 10. Length-fecundity relationship for northern pike taken in the present study area, 28 April to 25 June 1978.
42
I PIKE FRY I
1.00
075 I FLATHEAD CHUB I 050
I QZ5
! !5 w ~ I a: r I LDNGNDSE SUCKER JUVENILES I % U
= u 015 I
CD z Q50 I
~
! Q25 z I
Q (WALLEYE FRY I
Q25
MAY JUNE
Figure 11. Seasonal patterns of abundance for pike fry, flathead chub, longnose sucker juveniles, and walleye fry taken by minnow seine in the Athabasca and Clearwater rivers, 28 April to 25 June 1978. Data are combined for the Athabasca and C1earwat~r rivers and expressed as catch per metre of shoreline seined. Sampling times are indicated by short vertical bars on the horixonta1 axis.
43
4.2.3.2 Spawning. No ripe fish were taken during the course of
the study and it is not known if the species spawns within the
project study area. The spawning habits of flathead chub are not
well known. The spawning season appears to be in summer (July and
August) rather than in spring and the species may have spawned in
the project study area after the termination of the study on 26 June.
4.2.3.3 Length-frequency. The length-frequency distribution for
20 flathead chub sampled in the project study area is presented in
Figure 12. Chub ranged in length from 170 to 295 mm and were evenly
distributed throughout this range. Although none was retained for
analysis, immature juveniles ranging in length from approximately
40 to 80 mm were also very abundant in small mesh seine collections.
4.2.3.4 Age and growth. Age-length data for 16 flathead chub
are presented in Table 9. Flathead chub were aged from scales.
Fish in the study sample ranged in age from 3 to 8 and
in length from 170 to 295 mm. The growth curve derived for the
study population approximates those determined for flathead chub
captured in other areas of the AOSERP study area (Figure 13).
4.2.3.5 Age at maturity. Immature flathead chub as old as age 6
occurred in the study sample (Table 8). Other researchers in the
AOSERP study area report ages at first maturity of 2 to 3 (McCart et
ala 1977; Bond and Berry in prep.b) and 4 to 5 (Bond and Berry in prep.a) for this species.
4.2.3.6 Sex ratios. There were significantly more females (81%,
X2=4.0, P<0.05, N=18) than males in the study sample. Bond
and Berry (in prep.a,b) and ~·fcCart et ale (1977) also report
sex ratios favouring females, 68, 77, and 78%, respectively,
formulae were determined separately for males and females:
44
:I: 4 I FLATHEAD CHUB '78)
(I)
ii: 3
~ 2
a:
I :) z
a. ~
I I • • i ~ 0 ~ !!
a. ~ E N N .. ~ I • • o ~ ~ i 0 i N N N N N l\i N
FORK LENGTH (mm)
Figure 12. Length-frequency distribution of flathead chub taken from the Athabasca and Clearwater rivers upstream of Fort McMurray, 28 April to 2S June 1978.
Table 9. Age-length relationship with age-specific sex ratios and percent maturity for flathead chub taken from the present study area, 28 April to 25 June 1978.
Fork Length (mm) Males Females Age Me an S . D. S . E . Range N % % Mature N % % Mature Unsexed Total
3 184.3 13.6 7.8 170-197 0 0 3 3
4 0 0 0 0
5 232.0 37.0 16.5 178-273 1 20 100 4 80 50 0 5
6 251.8 29.3 9.3 210-295 2 20 50 7 70 86 1 10
7 246 0 0 1 100 100 0 1
8 275 0 0 1 100 100 0 1
Totals 3 19 67 13 81 77 4 20
.j::.. V1
40
300 -E !. % .... e.!) z ~ 200 ¥ I:r
~
K)
, .., ., , ,
, .' , .' , , f " , .' , ." , "
f ", f " , ,.'
f " f " f 0'
f " I
Athabasca River at Mildred Lake (Bond and Berry in prep. b
I",\ /Athabasca River Delta
I (Bond and Berr, in prep. b)
2 3 4 5 6 7 8
AGE (Viers)
..... Athabasca River at S,ncrude .' ...• fit- (McCort It 01. 1917,)
I FLATHEAD CHUB
9 10 II 12 13
Figure 13. Comparison of growth rates of flathead chub collected in this study and flathead chub collected in three other studies in the AOSERP study area. Symbols for samples collected in this study are: points plus vertical bars= mean fork lengths ± one standard error; points= mean fork lengths for age groups containing less than five fish; triang1es= individual fork lengths.
~ 0\
47
males:
Loglo Length (mm) = 2.66 LOgIO Weight (g) - 4.16
r=O.83, P<O.05, N=4
females:
LOgIO Length (mm) = 2.95 Loglo Weight (g) - 4.82
r=O.97, P<O.05, N=17
These relationships were compared by analysis of covariance and
were found to differ significantly in slopes (F=2l9.7, P<O.05)
but not in intercepts (F=O.98, P>O.05).
4.2.4 Longnose Sucker
4.2.4.1 Distribution and movements. Longnose suckers are a
major species in the AOSERP study area both in terms of their
numbers and in their importance as a forage species. Several
studies have documented major longnose sucker spawning runs into
tributaries of the Athabasca River downstream of Fort McMurray.
These include the Muskeg (Bond and Machniak 1977, 1979), Steepbank
(Machniak and Bond 1979), and MacKay rivers (McCart et al. 1978;
Bond et al. in prep.). A large spawning run also occurs in
the Christina River, a tributary of the Clearwater River (Tripp
and Tsui in prep.). Undoubtedly, other large tributaries of the
lower Athabasca, such as the Ells and Firebag rivers, are also
important spawning areas for longnose suckers.
Earlier studies on the Athabasca River have shown a peak
in the numbers of mature longnose suckers during late April and May,
coinciding with spawning runs into tributary streams (Bond and
Berry in prep.b; McCart et al. 1977). There was no evidence,
however, that longnose suckers were spawning in the Athabasca River
itself downstream of Fort McMurray and it was assumed that all
spawning took place in tributaries.
In the present study, large adult, small juvenile, and
young-of-the-year longnose suckers were found throughout the
project study area (Figure 14). By far the largest concentrations
of adults, however, were located in the Athabasca River downstream
N
r
o
LONG NOSE SUCKER
• Adult
* Juve"iI. .. Young-of-th.-yHr ::::::: MaJor Spawning Ar ...
5 10
KILOMETRES
15
Figure 14. Locations where longnose suckers were taken in the present study area. Major spawning areas are also indicated. (Continued).
.po. 00
N
r
CrooMd .....
lONGNOSE SUCKER
• Adult
* J""enll. ,.. y ...... of-the-ynr
::::::: Malor SpawnIng Areas
Figure 14. Continued.
RIver
H .... ItOM RIver
o 5 10
KILOMETRES
15
~ \0
50
~
I 52 en
l~ w
• a: ... t; w
~ • i I ~
I 9
l11t It) i2
• * .. ~:i:~ 0
. "t'J QJ
"t'J ='
.-I c.J c:: 0 u
1 . ...::t
I' u .-I
Z I QJ
"""'" .... , =' • bQ ..,... r..
51
of the Cascade Rapids to a point a few kilometres downstream of
Mountain Rapids. Based on age-length and length-frequency data
which will be discussed later, these suckers are considered to be
part of a migratory population that moves upstream from Lake
Athabasca to spawn in the Athabasca River upstream of Fort McMurray.
This population is considered to be distinct from a population of
smaller, slower growing longnose suckers inhabiting the Athabasca
River upstream of Cascade Rapids. The spawning locations of the
latter are unknown.
Figure 5 shows the large increases in beach seine catches
in the Athabasca River upstream of Fort McMurray which occurred
when mature longnose suckers arrived in early to mid-May. Far
fewer longnose suckers were captured in the Clearwater River though
there is evidence of a small peak coinciding with that in the
Athabasca River. By mid-June, few mature longnose suckers were
present in the study area downstream of Cascade Rapids.
Major concentrations of spawning longnose suckers were
located downstream of Mountain and Cascade rapids (25 and
32 km upstream of Fort McMurray, respectively). Probably
few longnose suckers migrate any further upstream. Although some
longnose suckers were observed struggling over low bedrock sills
at the edge of the Cascade Rapids, it is probable that these, in
combination with the equally difficult Little Cascade Rapids located
a few kilometres upstream, are an almost impassable barrier to
upstream movements for most of the year.
A total of 1982 longnose suckers captured in the Athabasca
River downstream of the Cascade Rapids were marked with distinctive
fin clips. Eight of these were recaptured, five of them at the
same location where they were marked. Of the remaining three,
two marked at the Mountain Rapids were recaptured below the Cascade
Rapids on 12 May, indicating an upstream movement. The final
recapture was a spent individual initially marked at Mountain
Rapids which was recaptured 28 May in the Athabasca River downstream
of Fort McMurray indicating a downstream migration shortly after
spawning.
52
The small percentage of recaptures (0.4%) suggests that
a large population of longnose suckers, probably numbering in the
hundreds of thousands, spawns in the Athabasca River between the
occurred between 10 May and 23 May (Table 10). The first ripe
females were captured on 12 May although four spawned-out females
had been captured the previous day. Spawning probably peaked on
15 Mayas indicated by the large number of eggs collected in drift
samples (Figure 15). After 22 May, no drifting eggs were taken.
By that date, the number of longnose suckers in the spawning areas
was also greatly reduced and all females were spawned-out.
During the spawning season, water temperatures ranged
from 9°C at the onset of spawning to 15°C at the end and dissolved
oxygen levels from 9.2 to 10.4 mg/L. During the same period, water
levels and turbidity were at their lowest since break-up on 29 April
(Figure 3), ranging from 650 to 950 m3/s and 15 to 31 FTU's,
respectively.
Spawning areas. Figure 14 shows the locations of known
and possible spawning areas for longnose suckers in the project
study area. The best documented and probably the most important
of these is the Athabasca River from Fort McMurray upstream to the
Cascade Rapids, the same area used by fall spawning lake whitefish·
(Jones et al. 1978).
It is likely that, within this section of the Athabasca
River, most longnose suckers spawn just downstream of the Mountain
and Cascade rapids. Although direct observations of spawning could
not be made because of poor visibility, a large number of longnose
suckers was observed in these areas, splashing and rolling on the
water surface during the peak spawning period. Longnose sucker
catches were also high at the Mountain and Cascade rapids, averaging
53.8 (range 0 to 374) and 44.9 (range 0 to 163) suckers per beach
seine haul, respectively, compared with 16.3 (range 0 to 80) suckers
per beach seine elsewhere.
53
Table 10. Summary of longnose sucker spawning in the Athabasca and Clearwater rivers, 28 April to 22 June 1978. N= number examined, G= green, R= ripe, SO = spawned out.
Date MALES FEMALES
(day/month) N G R SO N G R SO
28/4 3 3 4 4
30/4 18 18
01/5 1 1
04/5 58 42 16 96 96
05/05 20 19 1 18 18
06/05 78 73 5 90 90
07/05 116 92 24 130 130
08/05 208 179 29 205 205
09/05 6 6 5 5
10/05 95 65 30 135 135
11/05 1 1 9 5 4
12/05 91 59 32 185 177 7 1
13/05 65 43 22 140 133 6 1
15/05 37 20 17 21 6 7 8
21/05 1 1 7 5 2
22/05 14 14 6 6
24/05 30 1 29 14 14
26/05 1 1
27/05 2 2 2 2
28/05 42 42 59 59
04/06 3 3
14/06 1 1
22/06 1 1 Total 867 581 182 104 1151 1029 20 102
54
If) • UIO , I: ... LOO
I ~ d
Q50 z
.... ,~.-.
48.75 ,/~
; ~
--AtIIobGica R. ~ \ , ----- Clearwot.r R. I , ,
I l
4.0 , , , , , I , , , , ,
i I , , , , , , i ,
3.0 r .... ~ ,
I '" I I ..... , I ... .., I , I I
~ I
I ; 2.0 I , , I I I
t % 1.0 u
8
Figure 15. Seasonal abundance of eggs and sucker fry in drift samples and sucker fry in minnow seines on the Athabasca and Clearwater rivers, 28 April to 25 June 1978. Sampling dates are indicated by short vertical bars on the horizontal axis.
55
Figures 16 and 17 are schematic maps of the lower sections
of the Mountain and Cascade rapids showing the locations where
stream depth and substrate composition were determined on 19 June
1978. Data describing the depth and substrate at each sampling
point are presented in Tables 11 (Mountain Rapids) and 12 (Cascade
Rapids) . These data are further summarized in Figures 18 and 19
for a series of depth and substrate profiles at several locations
across the river. For the Mountain Rapids, the stream profiles,
from top to bottom (Figure 18), were based on the following sample
points: 4 to 10, 11 to 16, 17 to 22, 23 to 28, 29 to 34; for the
Cascade Rapids (Figure 19): 1 to 12, 29 to 38, 39 to 46.
Maximum depth downstream of the Mountain Rapids ranged
from 3.0 to 5.0 m (Figure 18). The substrate is composed largely
of rubble with boulders along the left bank facing upstream and
along the base of the rapids. Sandy substrates are confined to a
few locations along quiet edges of the river while gravel substrates
are found mixed in with rubble near the left bank, 50 to 250 m
downstream of the rapids. Surface velocity ranged from 1.7 to
2.1 mls across most of the river during high water periods and
0.7 to 1.8 mls during low water periods.
Maximum depth at the Cascade Rapids ranged from 4.5 m
at the base of the rapids to 2.8 m farther downstream (Figure 19).
Bedrock and coarse rubble dominate the substrate near the rapids,
changing to rubble farther downstream with increasing amounts of
gravel and sand near the edge of the river. Surface velocities at
the Cascade Rapids varied more than those at the Mountain Rapids,
ranging from 0.4 to 2.1 m/s.
The Athabasca River upstream of Cascade Rapids was not
sampled intensively during the spawning period and no fish in
spawning condition were captured. Later in the summer, however,
young-of-the-year suckers were captured in the vicinity of
tributary streams suggesting that longnose suckers in this section
spawn in tributaries rather than in the mainstem.
In the Clearwater River, substrates are predominantly
sand and suitable spawning areas for longnose suckers, which prefer
Figure 18. Depth profiles and substrate characteristics at six transects downstream of the
(m) Mountain Rapids on the Athabasca River, 19 June 1978.
0\ o
e '-0
.r:. 2-0 -:- 3·0
I'() 2-0 3-0 4-0
o 100 200 300 400
~ -~I R I~I Bd I R "Bd IIBd ,R,G,
(R SII R "R,G,S IL~_H G,S
o 100 200 300 500 0 lsta nc. (m) i.~~L-__ ~~~~ __ ~::~ ____ L-__ ~IL-__ ~'~'-~' _____ 1 I I I II I I I I
c 4-0-L2...JIG,S II R.G IIR,G,SIM
500
SUBSTRATE
Bd - Bedrock R - Rubble G - Gravel S - Sand! Silt
Figure 19. Depth profiles and substrate characteristics at three transects downstream of the Cascade Rapids on the Athabasca River, 19 June 1978.
a.. .....
62
coarser substrates for spawning, are limited. The sucker fry
captured in the Clearwater probably drifted out of the Christina
River, a known spawning area for both longnose and white suckers.
Few fry were captured in the Clearwater River upstream of its
junction with the Christina River.
4.2.4.3 Fry emergence and downstream migration. In the
Athabasca River, recently emerged sucker fry were first collected
in drift samples taken 30 May (Figure 15). The numbers of fry
peaked 1 June and then dropped very quickly. By 11 June, relatively
few fry were drifting down the river. During this period, water
temperatures ranged from 14 to l~C, dissolved oxygen concentrations
from 8.0 to 8.8 mg/L, turbidity from 45 to 60 FTU's, and discharge
rates from 1050 to 1500 m3/s. The incubation period (i.e., the
period between peak spawning and peak emergence) was 17 days, from
15 May to 1 June, approximately 235 centigrade degree days.
The timing of the peak downstream movement of fry in the
Clearwater River was similar but there was a greater, secondary
peak in mid-June which did not occur in the Athabasca River.
Data describing the diel periodicity of drift rates of
sucker fry in the Athabasca and Clearwater rivers are presented in
Table 13. The data cover two 24 h periods, 1 and 2 June and 19 and
20 June. On 1 and 2 June, drift rates were highest in the evening
at 1800 and 2100 h and lowest in the morning at 0600 and 0900 h.
Because, however, the differences between replicates were quite
variable, no definite conclusions can be drawn. On 19 and 20 June,
drift rates on the Athabasca River were much lower than during
the earlier period (a mean 0.07 compared with 0.22 fish/m3) and
there was no obvious diel pattern. The Clearwater River was sampled
only once, 19 and 20 June. The mean drift rate (0.09 fish/m 3) was
similar to that on the Athabasca River during the same period.
Again, there was no obvious diel pattern in movements.
Drift rates measured 1 June along a transect across the
Athabasca River indicated that drift rates were generally highest
away from the stream edges in areas of high velocity (Table 14).
Table 13. Die1 drift rates for sucker fry in the Athabasca and Clearwater rivers, 1 to 2 June and 19 to 20 June 1978. Drift rates are the mean of three replicates.
Athabasca River, 1-2 June Athabasca River, 19-20 June Clearwater River, 19-20 June Time Drift Rate Drift Rate Drift Rate
(Hours) (No./m 3) Range (No. 1m 3
) Range (No. 1m 3) Range
1200 0.12 0.09-0.18 0.14 0.06-0.28 0.16 0.09-0.22
1500 0.22 0.19-0.27 0.02 0.00-0.07 0.14 0.00-0.43
1800 0.59 0.20-1.01 0.15 0.00-0.28 0.01 0.00-0.04
2100 0.37 0.11-0.80 0.10 0.00-0.21 0.05 0.00-0.09
2400 0.22 0.00-0.54 0.11 0.00-0.27 0.07 0.00-0.13
0300 0.13 0.09-0.19 0.03 0.00-0.09 0.21 0.16-0.26
0600 0.06 0.00-0.09 0.02 0.00-0.07 0.00 0.00
0900 0.08 0.00-0.16 0.00 0.00 0.01 0.00-0.04
1200 0.21 0.02-0.33 0.03 0.00-0.09 0.14 0.09-0.17
Mean Rates 0.22 0.00-1.01 0.07 0.00-0.28 0.09 0.00-0.43
.. 0\ ~
Table 14. Drift rates for sucker fry across the Athabasca River, 1 June 1978.
Number of Fry/rn s 0.12 3.80 3.01 4.63 1.57 0.00 0.00
65
Not all fry drift downstream out of the project study
area. Some move inshore and take up residence there as indicated
by catch per unit effort data for minnow seining (Figure 15). The
data suggest, however, that this is more likely to occur where
velocities are low (as in the Clearwater River) than where
velocities are high (as in the Athabasca River). In the former,
catch per unit effort was much higher throughout the study period.
The secondary peak in abundance which occurred in both
rivers around 22 June is probably the'result of increasing numbers
of recently emerged white sucker fry that were not differentiated
from longnose sucker fry. Though the data are few, it appears that
white suckers spawn later in the spring than longnose suckers.
4.2.4.4 Juveniles. From 28 April to 30 May, immature longnose
suckers ranging from 40 to 100 mm fork length were scarce (Figure 11)
in the project study area,. In June, however, their numbers
increased rapidly throughout the study area. It is not known
whether this increase is the result of an upstream migration or an
inshore movement from overwintering areas located in the deeper
parts of the Athabasca River or tributary streams.
4~2.4.5 Length-frequency. The length-frequency distribution of
205 longnose suckers captured in three subdivisions of the project
study area, from early September to early November 1977 (Jones et
al. 1978) and from late April to mid-June 1978, is presented in
Figure 20. The total sample was subdivided into three sets:
1. Athabasca River upstream of Cascade Rapids;
'2. Athabasca River downstream of Cascade Rapids; and
3. Clearwater River.
The sets were treated separately in this analysis.
It is apparent that, while the ranges of lengths recorded
for each sub-area are similar, the Athabasca River sample from
downstream of the Cascade Rapids contains more large fish than the
upstream sample. The Clearwater River sample is approximately
intermediate. Student's t-test analysis of these d'ata revealed
"TI o 2'1 ~
J;i z !t %
:I :I
N .. 0) CD
375-399ggJl .........
N :;; C;; a;
!i % ):lot II' ):lot (J) o ):lot
2'1
< ." 2'1
~ Z
~ 2'1
'" ):lot ~
o "TI
~ (J) o ~ ITI
2'1 ):lot
" 6 (J)
NUMBER OF FISH
N • 0) CD ~ N :;; $ CD •• ••• t ,
o r ITI ):lot 2'1
~ iii 2'1
2'1 <: ITI 2'1
N • 0) CD 0 N ~ $ ~
!i % ):lot II' J> (J) o ):lot
2'1 <: ." 2'1
C
~ 2'1 ."
~
~ .................... ~ (J) n ~ '" 2'1 ):lot
~ o (J)
Figure 20. Length-frequencies for longnose suckers taken from the Athabasca River upstream of the Cascade Rapids, Clearwater River, and the Athabasca River downstream of the Cascade Rapids, 28 April to 25 June 1978.
(j\ (j\
67
significant differences (P<O.OS) in comparison of mean lengths
(upstream=3l4 mm, downstream=384 mm, Clearwater=342 mm fork length)
between samples.
The observed differences in mean size between sampling
areas suggest the existence of at least two sub-populations of
longnose sucker in the study area:
1. A smaller, slower growing, resident population which
utilizes the Athabasca River, both upstream and
downstream of the Cascade Rapids, throughout the
year; and
2. A larger, faster growing, migratory form (probably
originating in Lake Athabasca) which does not
penetrate upstream of the Cascade Rapids.
Fish in the Clearwater River, which are intermediate in
length, may represent a third, distinct population or result from
an intermingling of the other two. The former interpretation is
suggested by the fact that the length-frequency distribution of
suckers in the Clearwater does not completely overlap the length
frequency distributions of longnose suckers in the Athabasca River,
either upstream or downstream of the Cascade Rapids. Secondly, a
comparison of mean fork length at age 11, the only age for which
there are sufficient data, shows a significant difference between
the three stream sections (Table 15).
Length-frequency distributions previously reported in the
AOSERP study area (Bond and Berry in prep.a,b; Bond and 11achniak'
1979; McCart et a1. 1977) broadly overlap those of longnose
suckers taken during this study.
Few juvenile longnose suckers were captured in either
the Athabasca or Clearwater rivers. While this may be because of
sampling bias, it is more likely that juvenile longnose suckers
have a distribution quite different from the larger, adult segment
of the population.
68
Table 15. Mean fork lengths for age 11 longnose suckers taken from the present study area, 28 April to 25 June 1978.
Fork Length (mm) Location N x 2 SE t P
Athabasca River above Cascades 7 305.1 20.6
2.7681 <0.05 Clearwater River 11 343.3 17.6
Athabasca River 2.1245 <0.05
below Cascades 10 383.4 34.6
69
4.2.4.6 Age and growth. Age-length data for longnose suckers
(27 captured in the Athabasca River above Cascade Rapids, 41
captured downstream of the Cascade Rapids, and 42 captured in the
Clearwater River) are presented in Tables 16, 17, and 18,
respectively. Otolith ages were used in all calculations for this
species.
Longnose suckers captured above Cascade Rapids were, on
average, slower growing than those sampled from below (Figure 21).
The growth curve for the Clearwater River sample is approximately
intermediate.
In Figure 22, the age-length relationship of longnose
suckers captured during this study is compared with growth rates
reported for populations elsewhere in the AOSERP study area (Bond
and Machniak 1977; McCart et al. 1977, 1978) and in Alberta (Rawson
and Elsey 1950). Longnose suckers captured above the Cascade
Rapids grow at a very slow rate, comparable to that reported for a
population inhabiting an alpine lake (Pyramid Lake) in Alberta
(Rawson and Elsey 1950). The growth curves for the samples captured
in the Athabasca River downstream of Cascade Rapids and in the
Clearwater River, however, fall within the range previously described
for earlier samples from the AOSERP study area.
The maximum age determined for longnose sucker captured
during this study was 20 years. Elsewhere in the AOSERP study area,
maximum ages of 13 (Bond and Machniak 1977; McCart et al. 1977,
Jones et al. 1978), 14 (Bond and Berry in prep.a), 17. (}1cCart
et al. 1978), and 19 years (Bond and Berry in prep.b) have
been reported.
It is probable that some of the apparent variation in
growth rates between samples of longnose sucker from the AOSERP
study area is ascribable to differences in aging techniques (e.g.,
scales, otoliths, fin rays) and differences in the criteria used
to identify annuli. A detailed comparison of various aging
techniques and the criteria used in identifying annuli on various
structures is warranted.
Table 16. Age-length relationship with age-specific sex ratios and percent maturity for longnose suckers taken in the present study area on the Athabasca River upstream of Cascade Rapids, 28 April to 25 June 1978.
Fork Lensth (mm) Males FelUlles Ale Mean S.D. S.E. Range N ~ ~ Mature N ~ ~ Mature Unsexed Total
Table 17. Age-length relationship with age-specific sex ratios and percent maturity for longnose suckers taken in the present study area on the Athabasca River downstream of Cascade Rapids, 28 April to 25 June 1978.
Fork Length (mm) Males Females Age Mean S.D. S.E. Range N % % Mature N % % Mature Unsexed Total
7 202 0 0 1 100 0 0 1
8 0 0 0 0
9 309 12.7 9.0 300-318 2 100 0 0 0 0 2
10 354.4 44.8 20.0 291-388 2 40 50 3 60 67 0 5
11 383.4 54.7 17.3 309-445 1 10 0 9 90 89 0 10
12 418.0 32.5 23.0 395-441 0 0 2 100 100 0 2
13 374.2 69.6 31.1 257-427 0 0 5 100 60 0 5
14 393.0 77.1 34.5 273-458 2 40 50 3 60 67 0 5
15 450 0 0 1 100 100 0 1
16 470.3 18.0 6.8 441-497 1 14 100 6 86 100 0 7
17 0 0 0 0
18 477 0 0 1 100 100 0 1
19 0 0 0 0
20 457.0 1.4 1.0 456-458 0 0 2 100 100 0 2
Totals 8 20 38 33 80 82 0 41
....... .....
Table 18. Age-length relationship with age-specific sex ratios and percent maturity for longnose suckers taken in the present study area in the Clearwater River, 28 April to 25 June 1978.
Fork Length (mm) Males Females Age Mean S.D. S.E. Range N % % Mature N % % Mature Unsexed Total
Figure 21. Comparison of growth rates of longnose suckers taken in the Athabasca River upstream of the Cascade Rapids, in the Athabasca River downstream of the Cascade Rapids, and in the Clearwater River, 28 April to 25 June 1978. Points with vertical lines are mean
,fork lengths ± one standard error. Single points are individual fork lengths.
600
500
-E 400 ~ % .... (!) z W
-I 300 lII.: a: o l&.
200
100
Muskev River (Bond and Machnlak 1971)
/ ~..-: /.,. .
L, /::"
Athabasca , ...
(Jones .t oI.I97~);'
"/ Athabasca /
(McCart et m.I977)7
/ /
/ I .. ······
/ ....
2 4 6 8 10 12 AGE (~a~)
~ .... __ ---- AthabolCa below cascades
.. _ .. _ .. MacKay River (McCort .t al. 1978)
Lake (Rawson and Elley 1950)
I LONGNOSE SUCKER I
14 16 18 20 22
Figure 22. Comparison of growth rates of longnose suckers collected from three areas in this study and longnose suckers collected in five other studies in Alberta.
-....J ~
75
4.2.4.7 Age at maturity. Age, maturity, and sex were determined
for 104 longnose suckers from the project study area (Tables 16 to
18). The youngest mature male and female were both age 8 and were
captured, respectively, in the Clearwater River and in the Athabasca
River above Cascade Rapids. Some individuals as old as 14 years
of age had immature gonads suggesting that some fish may not spawn
every year. Other investigators in the AOSERP study area report
ages at first maturity for this species of from 5 (Bond and Machniak
1977; Jones et al. 1978) to 8 years (Bond and Berry in prep.a).
Tripp and McCart (1974) report that longnose suckers in the Donnelly
River, N.W.T., mature for the first time at age 9 to 12 years.
Variations in aging technique probably account for some of the
reported range in age at maturity within the AOSERP study area.
4.2.4.8 Sex ratios. There was no significant difference in the
number of males and females (X2 =3.20, P>0.05, 53% females) in the
total sample, including aged and unaged fish, for which sex was
determined (N=1756). Other researchers (Bond and Machniak 1977;
McCart et al. 1977; McCart et al. 1978, Bond and Berry in prep.b)
in the AOSERP study area also report balanced sex ratios.
4.2.4.9 Length-weight relationships. Analysis of covariance
showed a significant difference between the slopes of the length
weight relationships (Table 19) for samples (males, females, and
unsexed fish) taken from the Athabasca River upstream of the Cascade
Rapids and the Clearwater River (F=13.9) and between the intercepts
of samples taken from the lower Athabasca and Clearwater rivers
(F=8.0). There were, however, no significant differences in other
comparisons.
4.2.4.10 Fecundity. Fecundity was determined for 30 mature long
nose suckers captured in the project study area (Figure 23).
Individuals varied in fork length from 309 to 497 mm and in
fecundity from 6623 to 53 768 eggs. The mean length and fecundity
of the sample were 402.0 mm (SE=7.02) and 21 842.6 eggs (SE=1431.1),
Table 19. Logarithmic (Log 10 ) length-weight relationships for longnose suckers taken in the Athabasca and Clearwater rivers upstream of Fort McMurray, 28 April to 25 June 1978.
Mean Length Mean Weight Location Sample N (mm) (g) Slope Intercept Sxy rxy
4.2.4.11 Food habits. Longnose sucker stomach contents were
generally unidentifiable under field conditions and therefore no
feeding data are presented for this species.
4.2.5 White Suckers
4.2.5.1 Distribution and movements. White suckers are found
throughout the AOSERP study area in both the Athabasca River
and its tributaries. Spawning appears to be concentrated in
tributaries and major spawning runs have been documented in
the Muskeg (Bond and Machniak 1977, 1979), Steepbank
(Machniak and Bond 1979), MacKay (McCart et ale 1978; Bond
et ale in prep.), and Christina rivers (Tripp and Tsui in
prep.). There is no evidence to date indicating that white
suckers spawn in the Athabasca River itself. Tagging studies
(Bond and Berry in prep.a,b) have shown that some white suckers
tagged in the Athabasca River and its tributaries (e.g., the
Muskeg River) migrate downstream, following spawning in the
spring, to the Peace-Athabasca Delta and Lake Athabasca.
In the spring of 1978, white suckers were taken in beach
seines in the Athabasca River below the Cascade Rapids between
5 May and 23 May and none thereafter (Figure 5). Only two white
suckers were ever captured in beach seines in the Clearwater River
although they are known to spawn in its tributary, the Christina
River. Catch per beach seine haUl was 0.38 white suckers per haul
in the Athabasca compared with 0.09 per haul in the Clearwater
River. Fewer fish were sampled in gillnets although catch-per
gillnet hour was higher in the Clearwater River (0.04) than in the
lower (0.01) or upper (0.01) Athabasca River. Overall, white
suckers (excluding young-of-the-year) constituted 0.9% of the
total catch in beach seines, gillnets, and minnow seines.
79
4.2.5.2 Spawning. Spawning period. The first ripe male was
captured on 15 May and the first spawned-out male on 8 June
(Table 20). Although ripe females were never captured during the
study, the fact that all females taken up to 24 May were green and two
captured after 29 May were spawned-out indicates that spawning
probably occurred in the last week of May. This was approximately
one week after longnose suckers had spawned in the Athabasca River.
Similar differences in time between longnose and white sucker
spawning have been reported elsewhere (Geen et al. 1966; Bond and
Machniak 1979).
Spawning areas. Evidently, there is no appreciable white
sucker spawning in the Athabasca River although there appear to be
suitable spawning areas characterized by fast-flowing water over
gravel substrates. Nor does there appear to be any spawning in
the Clearwater River, although, as with longnose suckers, spawning
areas are limited since the Clearwater River has a sandy substrate.
Spawning is probably concentrated in various tributaries such as
the Christina River.
4.2.5.3 Fry emergence. The seasonal pattern of abundance for
sucker fry in minnow seines taken in the Athabasca and Clearwater
rivers was discussed earlier under the emergence and downstream
migration of longnose sucker fry (Figure 15). Fry of the two
species were not distinguished and the second major peak for catches
taken in the Clearwater River, 21 June, and the second minor peak
in the Athabasca River, 22 June, are probably a combination of the
two species. The length-frequency distribution of sucker fry taken
from the Clearwater River 24 June (Figure 24) shows a distinct
bimodality. Since white suckers spawn after longnose suckers, the
smaller fry averaging 17 mm are probably white suckers while the
larger fry averaging 22 to 23 mm are probably longnose suckers.
Peak emergence of white sucker fry likely occurred 22 June.
4.2.5.4 Length-frequency. The length-frequency distribution of
41 white suckers captured in the project study area from late April
80
Table 20. Spawning condition of white suckers taken from the Athabasca and Clearwater rivers, 5 May to 13 June 1978. N= number examined; G= green; R= ripe; So= spawnedout.
Date Males Females (Day/Month) N G R SO N G R SO
5/5 1 1 1 1
7/5 3 3
8/5 1 1
10/5 3 3
12/5 4 4 10 10
15/5 1 1 1 1
21/5 1 1 2 2
24/5 1 1
29/5 1 1
3/6 1 1
8/6 3 3
13/6 1 1
Totals 14 8 2 4 21 19 0 2
81
14 16 18 20 22 24 26 28 32
FORK LENGTH (mm)
Figure 24. Length-frequency distribution of sucker fry taken in the Clearwater River, Site 24, on 24 June 1978. N=6S.
82
to mid June-1978, is presented in Figure 25. Few individuals
smaller than 3S0 mm fork length were captured in either beach
seines or gillnets. Jones et ala (1978) captured white suckers
primarily in the length range 300 to 400 mm in the same study area
sampled during the present study. As with longnose sucker, the
absence of juveniles may be due to sampling bias but is more likely
due to differences in the distributions of juveniles and adults.
4.2.S.S Age and growth. Age-length data for 37 white suckers
captured in the project study area are presented in Table 21 and
in Figure 26.
White suckers in the sample ranged in age from 10 to 18
years and in fork length from 263 to S20 mm. The growth curve for
the study sample is approximately intermediate between those
determined for populations elsewhere in the AOSERP study area
(Figure 26). White suckers taken in the present study were both
older and larger than those taken by Jones et ala (1978) in the
same study area. As with longnose suckers, variation in aging
techniques and criteria for establishment of annuli probably account
for at least some of the variability in growth rates reported for
this species in the AOSERP study area.
4.2.S.6 Age at maturity. Age, maturity, and sex were determined
for 37 white suckers. There was only one immature specimen (age 12)
in the aged sample. Elsewhere in the AOSERP study area, ages at
first maturity of 3 to 4 (Bond and Machniak 1977), 5 to 6 (Jones
et ala 1978), and 8 to 12 (McCart et ala 1978) have been reported.
4.2.S.7 Sex ratios. There were fewer males (14) than females
(23) in the aged sample, but the difference was not significant
(X 2=1.OS, P<O.OS). Jones et ala (1978) report a similar prepon
derance of females (78%) in a sample of white suckers taken from
the same study area in the fall of 1977. Bond and Machniak (1977)
and Bond and Berry (in prep.b) a~so report significantly more females
(62% and SS%, respectively) than males in the spring spawning runs
83
8
I WHITE SUCKER '78 1 :I: 6 fI)
Ii: ..... 5 0 II: 4 III ~ '5
2
~ en ~ en .. E .. , ~ en .. !! ~ ~ t; N en N
", ", It) ", .. I I , , • • , , ,
I t
~ It) ~ ~ S J! ~. 10
~ It) 8 ... N N N f)t f;; ..
FORK LENGTH (m m )
Figure 25. Length-frequency distribution of white suckers taken from the Athabasca and Clearwater rivers upstream of Fort McMurray, 28 April to 25 June 1978.
Table 21. Age-length relationship with age-specific sex ratios and percent maturity for white sucker taken from the present study area, 28 April to 25 June 1978.
Fork Length (nun} Males Females Age Mean S.D. S.E. Range N % % Mature N % % Mature Unsexed Total
. ....... &" .. Ibe.a lid Cltanllll. / ................ (Jone. It 01. 1118) i",
.. v A'
// /./ / /
/ ." / ./
/ / / I .... OR.
/ i (Bond and MactWall 1W7)
4 • • 10 12 14 II .. ME C ...... )
20
Figure 26. Comparison of growth rates of white suckers collected in this study and white suckers collected in three other studies in the AOSERP study area. Symbols for samples taken in this study are: Points with vertical bars= mean fork lengths ± one standard error; points= individual fork lengths.
86
of white sucker in the Muskeg River. Elsewhere, balanced sex ratios
have been reported (McCart et ale 1977, 1978).
4.2.5.8 Length-weight relationships. No significant differences
in slope (F=2.85, P>0.05) or intercept (F=0.49, P>0.05) were
observed in the length-weight relationships of males and females.
The length-weight relationship determined for the combined sample
4.2.5.10 Food habits. As with longnose sucker, stomach contents
of white suckers were too finely ground to permit detailed analysis.
Therefore, no feeding data are presented for this species.
4.2.6 Walleye
4.2.6.1 Distribution and movements. Earlier studies indicate
that Richardson Lake in the Peace-Athabasca Delta is a major
spawning area for walleye (Bidgood 1968, 1971, 1973; Dietz 1973)
in the Athabasca Drainage. Other studies have indicated that there
is a large migration up the Athabasca River in early spring (McCart
et ale 1977; Bond and Berry in prep.a,b). This migration is
assumed to be a spawning migration from Lake Athabasca
although few ripe females have ever been captured in the Athabasca
River during the spring spawning period and there have been no
direct observations of spawning. ~10st of the walleye taken in
the river in early spring have been spent males and females with
sex ratios favouring males ranging from 63% (Bond and Berry
in prep.b) to 97% (Bond and Berry in prep.a). Similar
5.0
$2 (!) 4.5 o ...J
)0-Io Z ::J () W LL
4.0
C
87
C Athabasca upstream ~ Cascades
• Athabasca downstream of Cascades
A Clearwater
•
•
•
2.6 2.1
FORK LENGTH LOG 10 (mm)
Figure 27. Length-fecundity relationship for white suckers taken in the present study area, 28 April to 25 June 1978.
II
88
migrations composed almost entirely of ripe and recently spawned-out
males have been documented during early May in several tributaries
of the Athabasca River including the Muskeg (Bond and Machniak 1979),
Steepbank (Machniak and Bond 1979), and MacKay rivers (Bond et a1. in prep.; McCart et a1. 1978) .•
Walleye tagged in the Athabasca River in the spring have
been recaptured in the Peace-Athabasca Delta and Lake Athabasca
indicating a downstream migration after spawning. Tagged walleye
have also, however, been recaptured as far upstream as the town of
Jarvie on the Pembina River indicating that extensive upstream
movements also occur (Bond. in. prep.). It may be. that the
greater number of fish recaptured in the Peace-Athabasca Delta and
Lake Athabasca region, compared to areas upstream of the AOSERP
study area, reflects the more intensive fishing effort in the former
and consequently greater chance of recapturing marked fish.
The distribution of adult, juvenile, and young-of-the-year
walleye taken during this study is shown in Figure 28. In total,
101 walleye (excluding young-of-the-year) were captured in gillnets
and beach seines, most of them from the Athabasca River downstream
of the Cascade Rapids. Gillnet catch per hour ranged from 0.25 in
the Athabasca River downstream of the Cascade Rapids to 0.14 in
the Clearwater River and 0.06 in the Athabasca River upstream of
the Cascade Rapids. Few walleye were captured in beach seines in
either the Athabasca (N=8) or Clearwater rivers (N=2).
Figure 4 shows the seasonal pattern of catch per gillnet
hour for walleye in the Athabasca and Clearwater rivers. Walleye
were first captured 28 April. Catches thereafter were relatively
even. There was no evidence of major migrations or concentrations
of fish. The slight variations in catch were more likely related
to differences in netting efficiency than in changes in fish density.
4.2.6.2 Spawning. Spawning period. The first ripe male was
captured 28 April and the first spawned-out male 15 May (Table 22).
The mature females taken during the study (N=7) were all captured
from 13 May to 14 June and all were spawned-out indicating that
N
r
o
WAllEYE
• Adult
* JwenI" .. y ..... of .... .,..
=:::::: PotenttCII $pawning ANal
5 10
KILOMETRES
15
Figure 28. Locations where walleye were taken in the present study area. Potential spawning areas are also indicated. (Continued).
00 \0
90
I 52 U)
~ t-w
J ~ a: U') i2
t i
I ~
11 . "C
i- ~ -1 r t = lit "1""1 t J II ..... ..,
= .., • * *:~:;:: 0 J t.)
J .
co N
I' OJ Z<:;;
J 5-1 :s t)D
"1""1 ~
N
r ' , I
o
Figure 28. Concluded.
WALLEYE
• Adult * Juwnil. ,.. Young-of-fhe..year
::::::: Potential SDawnina Area.
-'E;;;;;;;;;;;;;;;;;;;;;;;;;;;;;;;;;;;;3
5 10
KILOMETRES
15
\0 ~
92
Table 22. Spawning condition of walleye from the Athabasca and Clearwater rivers, 28 April to 23 June 1978. N= number examined, G= green, R= ripe, SO= spawned-out.
MALES FEMALES Date N G R SO N G R so"
28/4 1 1
05/5 1 1
13/5 1 1
15/5 6 1 5
21/5 11 11
22/5 1 1
23/5 1 1
24/5 2 2
26/5 2 2
28/5 1 1 1 1
29/5 8 8 1 1
02/6 1 1
03/6 3 3
04/06 3 3 1 1
08/6 1 1
09/6 1 1
10/6 1 1
14/6 1 1
22/6 1 1
23/6 1 1
Total 44 0 3 41 7 0 0 7
93
spawning was completed by 13 May. The s:carcity of mature females
and relatively high temperatures at this time suggests, however,
that spawning occurred much earlier, at least in that segment of
the Athabasca River upstream of the Mountain Rapids. Water
temperatures in the Athabasca River upstream of Mountain Rapids
reached 10°C as early as 28 April, even though the Athabasca River
downstream of the Mountain Rapids was still frozen.
Spawning areas. Because few walleye spawners were taken
during the study, neither the location(s) of spawning areas nor
the extent of spawning runs in the study area are known. Based on
the distribution and relative abundance of walleye young-of-the
year, however, spawning appeared to be concentrated in the Athabasca
River upstream of the Cascade Rapids. Evidently little spawning
occurred in the Clearwater River. Catches of young-of-the-year
in minnow seines ranged from 0.23 per metre shoreline seined in
the Athabasca River upstream of the Cascade Rapids to 0.05 in the
lower Athabasca River and 0.01 in the Clearwater River. The
largest concentrations were located downstream of the Grand Rapids,
Mountain Rapids, and the mouth of the Algar River (Figure 28).
4.2.6.3 Fry emergence. The seasonal pattern of abundance of
walleye young-of-the-year is shown in Figure 11. Young-of-the-year
were first taken on 5 June, downstream of the Mountain Rapids.
Catches reached maximum densities on 17 June and then declined.
Mean fork length for young-of-the-year sampled on 5 June was
14.1 ± 0.3 mm (2 SE, N=6) and 21.4 ± 0.8 mm (2 SE, N=37) 15 June.
4.2.6.4 Length-frequency. The length-frequency distribution of
103 walleye captured in the study area from late April to mid-June
1978 is presented in Figure 29. Walleye ranged in fork length
from 85 to 580 mm with fish in the 325 to 499 mm range comprising over
90% of the total. Similar length-frequency distributions have
been reported elsewhere in the Athabasca River within the AOSERP
study area (McCart et al. 1977; Bond and Berry in prep.a,b;
Jones et al. 1978).
12 uJ WALLEYE N = 102
• r.f
1°1 I I o ~ 9
8
7
::r:: 6, en I III II Ii 1111 i:i:' 5
&L 0 4
II: 3 w m 2 2 ::> z
100 150 200 250 300 350 400 450 500 550 600
FORK LENGTH (MM)
Figure 29. The length-frequency distribution of male and female walleye taken in the Athabasca and Clearwater rivers upstream of Fort McMurray, 28 April to 25 June 1978.
!.O ~
95
4.2.6.5 Age and growth. Age-length data for 100 wa!leye captured
in the project study area are presented in Table 23. Ages were
determined from scales.
Walleye in the study sample ranged in age from 2 to 13
years, and in fork length from 85 to 580 mm. Fish younger than
six years were rare. The growth curve determined for the study
population approximates that of the MacKay River, Alberta,
population (Figure 30). The growth rate is slower, however, than
that determined for several other AOSERP study area samples and
two lake resident populations in Alberta.
4.2.6.6 Age at maturity. Age and sex were determined for 99
walleye captured in the project study area. The earliest maturing
females and males in the study sample were age 5 and 6, respectively.
In general, however, females matured much later than males. The
presence of individuals with immature gonads in the older age
classes (i.e., 12 years) may indicate that not all walleye in the
study population spawn every year once maturity is reached. Else
where in the AOSERP study area, ages at first maturity of 3 to 4
years (Bond and Berry in prep.a,b) and 5 to 7 years (McCart et al. 1978;
Jones et al. 1978) have been reported.
4.2.6.7 Sex ratios. Males outnumbered females (57% male, total
N=99) in the sample of walleye from the study area but the
difference was not significant (X 2=0.96, P<0.05).
Sex ratios favouring males (63 to 97%) are reported by
other investigators in the AOSERP study area (McCart et ale 1977,
1978; Bond and Machniak 1979; Bond and Berry in prep.a;
Jones et al. 1978). Bond and Berry (in prep.b), however,_ report a nearly balanced sex ratio for this species in the Peace-
formulae were determined separately for males and females:
Table 23. Age-length relationship with age-specific sex ratios and percent maturity for walleye taken from the present study area, 28 April to 25 June 1978.
Fork Length (mm) Males Females Age Mean S.D. S.E. Range N % % Mature N % % Mature Unsexed Total
2 85 0 1 100 0 0 1
3 217.0 27.1 15.6 189-243 1 33 0 2 67 0 0 3
4 246.0 42.4 30.0 216-276 1 50 0 1 50 0 0 2
5 270.0 4.2 3.0 267-273 0 0 2 100 0 0 2
6 359.2 69.4 23.1 253-466 5 56 40 4 44 25 0 9
7 361.9 75.1 23.8 270-481 7 70 71 3 30 0 0 10
8 359.0 40.6 12.9 308-428 5 50 60 5 50 0 0 10
9 379.9 32.8 7.2 319-436 13 62 85 8 38 0 0 21
10 391.9 45.1 12.5 328-477 9 69 89 4 31 25 0 13
11 430.0 37.8 11.4 368-491 5 45 100 6 55 17 0 11
12 425.1 59.2 17.9 325-512 5 50 80 5 50 40 1 11
13+ 479.0 80.8 30.6 397-580 5 71 100 2 29 100 0 7
Totals 56 57 77 43 43 16 1 100
(,C) 0\
s ~ • .. -' II
!
100
eoo
500
AthobCllca RI".r (McCart It oI~~.:~ .. "'" .. ,
North Wobasco Lolle /' •.•....•....
l TllI'nlr 1968 t. // Klhlwla Lolle ...•...••..•. ....,. (McDonald 1961) ••• :. ... _ ...... _ ••
Figure 30. Comparison of growth rates of walleye collected in this study and walleye collected in six other studies in Alberta. Symbols for the samples taken in the present study are: points plus vertical bars= mean fork length ± one standard error; single points, mean fork lengths for age groups containing less than five fish; triangles= individual fork lengths.
\0 ......
98
males:
LOgIO Length (mm) = 3.23 LOglo Weight (g) - 5.59
r=0.99, P<0.05, N=56
females:
Loglo Length (rnm) = 2.26 Loglo Weight (g) - 3.09
r=0.95, P<0.05, N=43
These relationships were compared by analysis of
covariance and were found to differ significantly in slopes (F=37.49,
P<0.05) but not in intercept (F=0.84, P>0.05).
4.2.6.9 Food habits. Of 97 walleye examined, 68% had empty
stomachs. Fish (flathead chub, sculpins) and unidentified fish
remains occurred most frequently in those stomachs which contained food.
4.2.7 Other Species
Other species are those for which few or no individuals
were retained for detailed analysis. These include Dolly Varden,
lake whitefish, mountain whitefish, Arctic grayling, longnose dace,
lake chub, pearl dace, finescale dace, fathead minnow, emerald
stickleback, yellow perch, slimy sculpin, and spoonhead sculpin.
In what follows, various aspects of their distribution, movements,
and life history are discussed.
4.2.7.1 Dolly Varden. A single Dolly Varden juvenile, 265 rnm
fork length, was gillnetted upstream of the Brule Rapids (Site 3)
on 21 May. It had probably drifted downstream from the headwaters
of the Athabasca River where the species is native (Paetz and Nelson
1970). Dolly Varden in small numbers have been reported elsewhere
in the AOSERP study area from the Athabasca (Bond and Berry in
prep.b), Muskeg (Bond and l1achniak 1979), and Steepbank rivers
(Machniak and Bond 1979).
4.2.7.2 Lake whitefish. Two localities in the Athabasca River,
one downstream of Cascade and one downstream of Mountain Rapids,
99
are major spawning grounds for lake whitefish which migrate
upstream out of Lake Athabasca (Jones et al. 1978). However, few
recently -emerged young-of-the-year were present when the study
commenced on 28 April. The Athabasca River upstream of the ~iountain
Rapids was open for at least a week before break-up downstream and
water temperatures were high (IOOC) by 28 April. It is likely that
these high temperatures, in the areas of heaviest egg deposition,
stimulated emergence and downstream movement.
From 30 May to 24 June, 20 lake whitefish young-of-the
year, ranging from 26 to 45 mm fork length, were collected in the
present study area. Of these, only two were taken in the Athabasca
River downstream of Mountain Rapids and none were taken upstream of
the Mountain Rapids. In the Clearwater River, fry (N=18) were
taken as far upstream as the mouth of the Christina River, indicating
that at least some whitefish spawning occurs in these areas.
A total of seven larger whitefish were sampled in beach
seines and gillnets during the study, all of them in the Clearwater
and Christina rivers. Of these, four were dissected and found to
be immature, ranging from 298 to 354 mm in length and 5 to 7 years
in age.
4.2.7.3 Mountain whitefish. Four mountain whitefish were taken
in beach seines and gillnets: in the Athabasca River downstream
of the Cascade Rapids (24 May), in the Athabasca River near Clark
Creek (6 May), and in the mouth of the Christina River (5 May).
Young-of-the-year (N=104) were sampled as early as 30
April although the majority were taken between 19 June and 17 June
(Figure 31). The major concentrations of young-of-the-year were
located at the mouths of tributary streams in the Athabasca River
upstream of the Cascade Rapids. Catch per metre shoreline seined
was considerably greater in this area (0.15) than in the Athabasca
River downstream of the Cascade Rapids (0.01). One young-of-the
year was collected at the mouth of the Clearwater River, 17 June.
100
I MOUNTAIN WHn'EFISH FRY I
0.75
0.50 I LONGNOSE DACE I
1.2~
i 100 Ii
I O.7~ I LAKE CHUB I ~ O.~
~ I o.2~
I z: u 5 l2~ I .. I 1.00
i
I 0.7~ I FATHEAD MINNOW I I
0.25
0.
QZ I TROUT • PERCH I
APRIL MAY .,HE
Figure 31. Seasonal patterns of catch per metre of shoreline seined for mountain whitefish fry, longnose dace, lake chub, fathead minnow, and trout-perCh in the Athabasca and Clearwater rivers, 28 April to 25 June 1978. Sampling times are indicated by short vertical bars on the horizontal axis.
101
4.2.7.4 Arctic grayling. Jones et al. (1978) showed that
grayling do not spend much time in the present study area during
the open water period. They found that catches in the Athabasca
and Clearwater rivers did not increase until late fall when both
water temperatures and levels had dropped. Similar downstream
migrations, presumably to overwintering areas, have been described
in the Muskeg (Bond and Machniak 1979) and Steepbank rivers
(Machniak and Bond 1979).
Only three Arctic grayling (excluding young-of-the-year)
were captured in the project study area: one at the mouth of the
Clearwater River (3 June) as well as one upstream and one downstream
of the Grand Rapids on the Athabasca River (4 June). Grayling fry
(N=8) were taken between 8 June and 18 June at several locations
in the Athabasca River downstream of Mountain Rapids.
4.2.7.5 Longnose dace. During the study period, longnose dace
were the third most abundant species taken in minnow seines (15.1%)
and overall (9.9%). Locations where longnose dace were captured
are shown in Figure 32. Catches were greatest in the Athabasca
River downstream of the Cascades (0.25 fish per metre shoreline
seined) followed by the Clearwater (0.17 fish per metre) and
upper Athabasca (0.10 per metre) rivers. The seasonal pattern of
abundance (Figure 31) shows a substantial increase in June,
suggesting a possible upstream migration from overwintering grounds
located elsewhere in the AOSERP study area.
4.2.7.6 Lake chub. During the study period, 721 lake chub,
constituting 9.1% of the total catch, were taken. Figure 32 shows
capture locations. The highest densities were recorded in the
Clearwater River, near the mouths of the Hangingstone and Christina
rivers, and the lowest densities in the Athabasca River upstream
of the Cascade Rapids. Catches per metre shoreline seined ranged
from 0.28 in the Clearwater River to 0.21 in the lower Athabasca
River and 0.15 in the upper Athabasca River.
The seasonal pattern of abundance (Figure 31) shows a
N
r
• LONGNOSE DACE • LAKE CHUI .. FATHEAD MINNOW
o 5 10 15
KILOMETRES
Figure 32. Locations where longnose dace, lake chub, and fathead minnows were taken in the present study area. (Continued).
..... o N
N
~ .....
• LONGNOSE DACE * LAKE CHUB ,. FATHEAD MINNOW
Figure 32. Continued.
o 5 10
KILOMETRES
15
I-' o w
104
w ~ 52 fa
~I! a: ti ~ I~c w
w Z LO £2 !~
.** 0
. "0 Q)
] ....t U s:: 0 tJ
1 . N
I' u C"")
z ...... I Q) ... = • co .,.. ~
105
pattern similar to that of longnose dace. Densities were low in
late April and May but rose sharply in June.
4.2.7.7 Pearl dace. Three pearl dace were captured in minnow
seines downstream of the Mountain Rapids on 10 June, in the
Athabasca River near Clark Creek on 25 June, and at the mouth of
the Christina River on 21 June.
4.2.7.8 Finescale dace. Three finescale dace were taken: one
in the upper Athabasca River at the mouth of the Algar River on
4 June and two at the mouth of the Christina River on 5 May and
24 June.
4.2.7.9 Fathead minnow. A total of 336 fathead minnows,
constituting 4.2% of the total catch, was sampled during the study.
Figure 32 shows the locations where fathead minnows were taken.
Most were collected in the Athabasca River downstream of the
Cascade Rapids with the highest concentrations downstream of the
Mountain Rapids and at the mouth of the Horse River. A few (N=5)
fathead minnows were captured in the Clearwater River near its
mouth. Catches per metre shoreline seined ranged from 0.12 in the
lower Athabasca River to 0.08 in the upper Athabasca River and
0.1 in the Clearwater River.
As with longnose dace and lake chub, fathead minnow
densities were lowest in late April and most of May but peaked
suddenly in early June (Figure 31), suggesting a rapid migration
from overwintering areas located elsewhere in the AOSERP study area.
4.2.7.10 Emerald shiner. From 4 June to 25 June, 52 emerald
shiners, representing 1.0% of the total catch in IDdnnow seines,
were collected in the Athabasca and Clearwater rivers. Locations
where emerald shiners were taken are shown in Figure 33. Catches
per metre shoreline seined ranged from 0.04 in the Athabasca
upstream of the Cascade Rapids to 0.01 in the lower Athabasca and
Clearwater rivers.
N
r
o
• EMEIALD SHINEI
* SPOTTAIL SHINEI .. TIOUJ-PlICH
5 10
KILOMETRES
15
Figure 33. Locations where emerald shiner, spottail shiner, and trout-perch were taken in the present study area. (Continued.
..... o 0'1
N
r
Ctooked RIIpidt
• EMEIALD SHINEI * SPOTTAIL SHINEI
* 11lOUT-PEICH
Figure 33. Continued.
o
RI,.,
5 10
KILOMETRES
15
I-' o .......
108
•• 2 fa IoU IoU !Zz a: i-~ Ii; i IoU
~ ..... ~ - I ~ :! ...
li§ It)
IoU"''''
-** 0
. "d cu "d ::s r-I CJ s:: 0 tJ
1 . M
II
u M
z ....... I cu .... ~ ~
109
4.2.7.11 Spottail shiners. A total of 40 spottail shiners were
captured between 11 and 25 June. Their distribution (Figure 33)
largely overlapped the distribution of emerald shiners. Catches
per metre shoreline seined ranged from 0.02 in the upper Athabasca
River to 0.01 in the lower Athabasca. One spottail shiner was
captured at the mouth of the Clearwater River.
4.2.7.12 Brassy minnow. Bond and Berry (in prep. a) report
collecting brassy minnows in the mainstem of the Athabasca River
downstream of Fort McMurray. During the course of this study, six
brassy minnows were collected in the Athabasca River upstream and
downstream of Brule Rapids, at the mouth of the Algar River, and just
downstream of the Mountain Rapids. None was collected in the
Clearwater River although they have been reported from one other
tributary of the Athabasca River, the House River (BishoP 1975).
4.2.7.13 Burbot. A total of 19 adult and juvenile burbot was
sampled in beach seines and gillnets, mainly from the Athabasca
River. The catch data suggest that there may have been a greater
density of burbot in the Athabasca River upstream (0.04 fish per
hour) than downstream of the Cascade Rapids (0.02 fish per hour).
Because of the low and sporadic catches throughout the study period,
however, no definite conclusions can be drawn regarding the relative
distribution of burbot.
Burbot young-of-the-year were abundant in shallow, weedy
side channels of the Clearwater River upstream of its junction
with the Christina River. This area has been previously described
in this report as a major spawning area for northern pike. The
presence of burbot young-of-the-year together with young-of-the
year northern pike suggest that the spawning areas for the two
species overlap considerably. Between 13 and 24 June, 63 burbot
young-of-the-year were taken in the Clearwater River, 56 of them
upstream of the Christina. Catches of young-of-the-year burbot in
the latter area averaged 1.5 fish per metre of shore seined
compared to 0.01 downstream.
110
Figqre 34 shows the locations where young-of-the-year
and older burbot were collected as well as probable spawning areas
for burbot in the present study area.
4.2.7.14 Trout-perch. From 28 April to 25 June, 194 trout-perch,
constituting 2.5% of the total catch, were sampled, most of these
in the Athabasca River downstream of Cascade Rapids. Relatively
few trout-perch were sampled in the Athabasca River upstream of
the Cascades or in the Clearwater River. Catches of trout-perch
per metre of shoreline seined ranged from 0.10 in the lower
Athabasca to 0.02 in the upper Athabasca and Clearwater rivers.
Figure 33 shows the location where trout-perch were taken.
The seasonal pattern of abundance was similar to those se
described for longnose dace, lake chub, and fathead minnow
(Figure 31). Catches were low throughout most of the study period
but generally increased in late June.
4.2.7.15 Brook stickleback. Two brook sticklebacks were captured
on the Clearwater River at Site 24 on 21 June.
4.2.7.16 Yellow perch. Four small, juvenile yellow perch were
collected at the mouth of the Clearwater River (25 June) and in
the Athabasca River near the mouth of Conn Creek.
4.2.7.17 Slimy sculpin. Figure 35 shows the locations where slimy
sculpins were taken. Of 24 slimy sculpins collected during the
study period, 19 were captured in the Athabasca River downstream of
the Cascade Rapids while five were sampled from the Clearwater River.
No slimy sculpins were captured in the Athabasca River upstream of
the Cascade Rapids.
4.2.7.18 Spoonhead sculpin. Figure 35 shows the locations where
a total of 14 spoonhead sculpins was taken in the present study
area. They were captured in the Athabasca River, from Fort Mcl1urray
N
r
IURIOT
• Adult ... Juvenile • Young-of-the-year ::::::: Maior SDawnina Areas
o 5 10 15
KILOMETRES
Figure 34. Locations where young-of-the-year and older burbot were taken in the present study area. Major spawning areas are also indicated. (Continued).
..... ..... .....
112
J
z ....... \' J J
o
. ~
113
!Q
I .2 t c
2 0 •• r m __ .! ·c a:
1~1 t;
~ § ~ r·t t.O 52 1,.! I • * :~:~:
0
. "0
<U ] .-f U s:: 0 u
1- . ...r
I' u ~
z, I oj J..I
• Q, .,.. fz.4
N
r
• SLIMY SCULPIN * SPOONHEAD SCULPIN
* SCULPIN •• lOUNG-OF-1'HE-YEAI
o 5 10 15
KILOIVIETRES
Figure 35. Locations where sli~ sculpin, spoonhead sculpin, and unidentified sculpin young-of-the-year were taken in the present study area. (Continued).
..... ..... ~
N
r • SLIMY SCULPIN * SPOON HEAD SCULPIN .. SCULPIN .. WXJNG-of-THE-YEAR
CrooIIed """1
Figure 35. Continued.
o 5 to KtLOMETRES
15
.... .... U1
116
!n ., c IF .., ,
52 fa ! ~ a:
l~1 tu ":e 9 ... t i- ll) 52 :::t..,
~zz j5 E
... 2 a tft tft
.** 0
. "t:S Q)
"t:S =' l"""'f CJ = 8
1 .
1.1"\ M
I' u
z ...... I e =' co .....
"""
117
upstream to above the Grand Rapids, but were not taken in the
Clearwater River.
118
5.0 GENERAL DISCUSSION AND SUMMARY
The chief objectives of this study were to determine what
major spring spawning fish species utilize the Athabasca and Clear
water rivers upstream of Fort McMurray and, as far as possible, to
locate and ·describe their spawning grounds and to describe the
timing of spawning, hatching, and emergence.
These objectives were approximated for longnose suckers
only. It was determined that the Athabasca River from Fort Mc~~rray
upstream to the Cascade Rapids is critical spawning habitat for
large numbers of longnose suckers that presumably migrate upstream
from the Peace-Athabasca Delta and Lake Athabasca. The number of
longnose suckers marked and then recaptured during this study was
too small to estimate the size of the spawning popUlation; however,
the number is likely to be in the hundreds of tho~sands.
It is unlikely that any significant numbers of longnose
suckers migrating upstream from the lower Athabasca River manage
to get by the Cascade Rapids which also appear to be major barriers
for several other fish species. Large numbers of fall spawning lake
whitefish, for example, migrate as far upstream as the Cascade
Rapids but no farther (Jones et al. 1978). Tripp and Tsui (in
prep.) a.;Lso show a dramatic drop in goldeye and walleye gi1.lnet
catches upstream of the Cascade Rapids compared with catches down
stream of the Cascade Rapids.
Longnose suckers taken upstream of the Cascade Rapids are
considered distinct from those taken downstream of the Cascade
Rapids largely on the basis of different age-length relationships.
Indirect evidence from the distribution of recently emerged young
of-the-year in this area suggests that spawning occurs in the main
stem Athabasca. However, they probably spawn in various tributaries
of the upper Athabasca River as well.
There is probably very little longnose sucker spawning in
the Clearwater River, within the AOSERP study area. Sucker young
of-the-year rearing in the lower reaches of the Clearwater River
is probably the result of downstream movements from spawning areas
located upstream, such as the Christina River (Tripp and Tsui in prep.)
119
In 1978, longnose suckers spawned in the Athabasca River
from 10 May to 23 May, peaking on 15 May. After spawning, spent
fish quickly left the study area, presumably to feeding and over
wintering areas located farther downstream. Young-of-the-year
emerged around 1 June in the Athabasca River and were quickly
carried downstream by the current. Large numbers of young-of-the
year remained in the Clearwater River where current speeds are
considerably slower than those in the Athabasca River.
The spawning period, major spawning areas, and size of the
spawning population for walleye in the Athabasca and Clearwater
rivers upstream of Fort McMurray are still unknown. Walleye catches
were low throughout the study period and none were taken in spawning
condition. Possibly, walleye moved upstream, spawned, and then left
the study area before spring break-up was completed. Young-of-the
year walleye were captured as early as 5 June 1978 at various
locations from the Mountain Rapids upstream to the Grand Rapids.
They were, however, not abundant. None was taken in the Clearwater
River.
It is possible that 1978 was an abnormal year during which
no major walleye spawning run occurred, since in most years, walleye
are apparently much more abundant. During this study, angling
success was extremely low near Fort McMurray in areas which, in
the past, have always been an excellent fishing area according to
personal interviews with Alberta Fish and Wildlife Officers and
many residents of Fort McMurray.
Spring break-up on the Athabasca River at Fort McMurray
was delayed because of ice jams extending upstream as far as the
Mountain Rapids. The resulting drop in water temperatures from
10°C above the Mountain Rapids to DoC downstream of the Mountain
Rapids may have curtailed walleye spawning. Walleye normally
spawn at temperatures ranging from 6.7 to 8.90 C (Scott and Crossman
1973). In addition, ice jamming at the Mountain Rapids may have
prevented further upstream movements through a combination of
reduced swimming abilities at low water temperatures (Jones et al.
120
1974) and increased flow rates.
The weedy side channels, cut-offs, and backwaters along
the Clearwater River upstream of its confluence with the Christina
River are critical spawning and rearing habitat for northern pike
and burbot. Small young-of-the-year of both species were very
abundant in these areas while few were taken in the Clearwater
River downstream of the Christina River or in the Athabasca River
upstream of Fort McMurray.
The Clearwater River upstream of its junction with the
Christina River was not sampled until after young-of-the-year
northern pike had already emerged. The spawning, hatching, and
emergence times for northern pike in this area are therefore
unknown. It is possible that the northern pike spawning in the
upper Clearwater River are a segment of the large spawning runs
of northern pike described in the Christina River (Tripp and Tsui
in prep.).
An additional objective of the study was to describe
the downstream movements of lake whitefish young-of-the-year.
However, few were captured despite intensive sampling immediately
after break-up suggesting that they probably emerged and moved
downstream out of the present study area before spring break-up
was completed.
The Athabasca River and, to a lesser extent, the Clear
water River, provide valuable habitat for a number of smaller
species. Of these, flathead chub, longnose dace, and lake chub
are the most numerous. Large numbers of pre-spawning age goldeye
also use the Athabasca and Clearwater rivers upstream of Fort
McMurray as feeding grounds during the open water period. Spawning
by other spring spawners such as Arctic grayling and white suckers
is probably confined to smaller tributaries.
121
6 • REFERENCES CITED
Bidgood, B.F. 1968. Ecology of walleyes in Richardson Lake-Lake Athabasca. Alberta Recreation, Parks and Wildlife. Fish. Res. Rep. 1. 21 pp.
Bidgood, B.F. 1971. Ecology of walleyes, Stizostedion v. vitreum~ in Richardson Lake-Lake Athabasca complex. Pages 187-203 in R.E. Reine1t, K. Ke11erha1s, M.A. Mo1ot, W.M. Schultz, and W.E. Stevens, eds. Proc. Peace-Athabasca Delta Symposium. Univ. of Alberta, Edmonton.
Bidgood, B.F. 1973. Walleyes and water levels in Lake Athabasca. in Ecological Investigations, the Peace-Athabasca Delta Project, Technical Appendices, Vol. 2, Appendix E.
Bishop, F.G. 1975. A new distribution record for brassy minnow in northwestern Alberta. Canadian Field-Naturalist 89:319-320.
Bond, W.A. in prep. A summary report of investigations of the fishery resources of the Athabasca River downstream of Fort MCMurray, Alberta. Prep. for the Alberta Oil Sands Environmental Research Program by Fisheries and Environment Canada, Fisheries and Marine Service. AOSERP Project AF 4.3.2.
Bond, W.A., and D.K. Berry. in prep.a. First interim report on an investigation of the fishery resources of the Athabasca River downstream of Fort MCMurray, Alberta. Prep. for the Alberta Oil Sands Environmental Research Program by Fisheries and Environment Canada, Fisheries and Marine Service. AOSERP Project AF 4.3.2.
Bond, W.A., and D.K. Berry. in prep.b. Second interim report on an investigation of the fishery resources of the Athabasca River downstream of Fort McMurray, Alberta. Prep. for the Alberta Oil Sands Environmental Research Program by Fisheries and Environment Canada, Fisheries and Marine Service. AOSERP Project AF 4.3.2.
Bond, W.A., and K. Machniak. 1977. Interim report on an intensive study of the fish fauna of the Muskeg River watershed of northeastern Alberta. Prep. for the Alberta Oil Sands Environmental Research Program by Fisheries and Environment Canada, Department of Fisheries. AOSERP Report 26. 137 pp.
122
Bond, W.A., and K. Machniak. 1979. Second interim report on an intensive study of the fish fauna of the Muskeg River watershed of northeastern Alberta. Prep. for the Alberta Oil Sands Environmental Research Program by Fisheries and Environment Canada, Freshwater Institute. AOSERP Project AF 4.5.1.
Bond, W.A., K. Machniak, M. Orr, D. Rudi, and D. Miller. in prep. Fisheries and aquatic habitat investigations in the MacKay River watershed of northeastern Alberta. ;Prep. for the 41b~rta O:!-lSands Environmental Research Program by Fisheries and Environment Canada, Fisheries and Marine Service. AOSERP Project \-JS 1.3.1.
Dietz, K.G. 1973. The life history of walleye (Stizostedion vitreum vitreum) in the Peace-Athabasca Delta. Fish and Wildl. Div., Alta. Dept. Lands and Forests, Man. Rep. 52 pp.
Donald, D.B., and A.H. Kooyman. 1977. Migration and population dynamics of the Peace-Athabasca Delta goldeye population. Canadian Wildlife Service. Occasional Paper No. 31. 19 pp.
Geen, G.H., T.G. Northcote, G.F. Hartman, and C.C. Lindsey. 1966. Life histories of two species of catostomid fishes in Sixteen Mile Lake, British Columbia, with special reference to inlet stream spawning. J. Fish. Res. Board Can. 23(11):1761-1788.
Griffiths, W.E. 1973. Preliminary fisheries survey of the Fort McMurray tar sands area. Fish and Wildlife Division, Alberta Dept. of Lands and Forests. 622 pp.
Jones, D.R., J.W. Kiceniuk, and O.S. Bamford. 1974. Evaluation of the swimming performance of several fish species from the Mackenzie River. J. Fish. Res. Board Can. 31:1641-1647.
Jones, M.L., G.J. Mann, and P.J. McCart. 1978. Fall fisheries investigations in the Athabasca and Clearwater rivers upstream of Fort McMurray: Volume I. Prep. for the Alberta Oil Sands Environmental Research Program by Aquatic Environments Limited. AOSERP Report 37. 71 pp.
Kennedy, W.A., and W.M. Sprules. 1967. Goldeye in Canada. Fish. Res. Board Can. Bull. 161. 45 pp.
Kooyman, A.H. 1972. Status of goldeye, Hiodon alosoides, populations in the Peace-Athabasca Delta. Peace-Athabasca Delta Project: ecological investigations. Vol. 2.
123
Kristensen, J., B.S. Ott, and A.D. Sekerak. 1976. Walleye and goldeye fisheries investigations in the Peace-Athabasca Delta--1975. Prep. for Alberta Oil Sands Environmental Research'Program by L.G.L. Ltd. AOSERP Report 2. 103 pp.
Lagler, K.F. 1956. Freshwater fishery biology, 2nd ed. WID. C. Brown Co., Dubuque, Iowa. 421 pp.
Machniak, K., and W.A. Bond. 1979. An intensive study of the fish fauna of the Steepbank River watershed of northeastern Alberta. Prep;. for the Alberta· Oil Sands Environmental Research Program by Fisheries and Environment Canada, Freshwater Institute. AOSERP Project AF 4.5.2.
McCart, P., P.T.P. Tsui, W. Grant, and R. Green. 1977. Baseline studies of aquatic environments in the Athabasca River near Lease 17. Environmental Research MOnograph 1977-2, Syncrude Canada Ltd. 205 pp.
MCCart, P.J., D. Tripp, P.T.P. Tsui, W. Grant, and R. Green. 1978. Baseline study of the water quality and aquatic resources of the MacKay River, Alberta. A report to Syncrude Canada Ltd. 200 pp.
McDonald, D. 1967. Kehiwin Lake. Province of Alberta, Dept. of Lands and Forests. 47 pp.
Nordeng, H. 1961. On the biology of char (SaZveZinus aZpinus~ L.) in Salangen, North Norway. Nytt. Magasin for Zoologi 10:67-123.
Paetz, M.J., and J.S. Nelson. Government of Alberta.
1970. The fishes of Alberta. 282 pp.
Rawson, D.S., and J.E. Elsey. 1950. Reduction in the longnose sucker population of Pyramid Lake, Alberta, in an attempt to improve angling. Trans. Amer. Fish. Soc. 78(1948):13-31.
Scott, W.B., and E.J. Crossman. 1973. Freshwater fishes of Canada. Fish. Res. Board Can. Bull. 184. 966 pp.
Tripp, D.B., and P.J. McCart. 1974. Life histories of grayling (ThymaZZus arcticus) and longnose suckers (Catostomus catostomus) in the Donnelly River system, N.W.T. Pages in P.J. McCart ed. Life histories of anadromous and freshwater fish in the western Arctic. Arctic Gas Biological Report Series 20(1). 91 pp.
124
Tripp, D.B., and P.J. McCart. 1979. Investigations of the spring spawning fish populations in the Athabasca and Clearwater rivers upstream of Fort McMurray, Volume II. Prep. for the Alberta Oil Sands Environmental Research Program by the Aquatic Environments Limited. AOSERP O.F. 4. 94 pp.
Tripp, D.B., and P.T.P. Tsui. in prep. Fisheries and habitat investigations in the southern portion of the AOSERP study area. Prep. for the Alberta Oil Sands Environmental Research Program by Aquatic Environments Limited. AOSERP Project WS 1.6.2.
Turner, W.R. 1968. Preliminary biological survey of Wabasca Lakes area, 1967. Province of Alberta, Dept. of Lands and Forests. 70 pp.
125
7. AOSERP RESEARCH REPORTS
1 • 2. AF 4.1.1
3. HE 1. 1 • 1 4. VE~2.2
5. HY 3. 1
6. 7. AF 3. 1 • 1
8. AF 1.2. 1
9. ME 3.3
10. HE 2. 1
11. AF 2.2. 1
12. ME 1. 7
13. ME 2.3. 1
14. 15. ME 3.4
16. ME 1.6
17. AF 2. 1 • 1
18. HY 1. 1
19. ME 4. 1
20. HY 3. 1 • 1
21. 22.
23. AF 1.1.2
24. ME 1.5.2
25. ME 3.5. 1
AOSERP First Annual Report, 1975 Walleye and Goldeye Fisheries Investigations. ·il1 the Peace-Athabasca Delta--1975 Structure of a Traditional Baseline Data System A Preliminary Vegetation Survey of the Alberta Oil Sands Environmental Research Program Study Area The Evaluation of Wastewaters from an Oil Sand Extraction Plant Housing for the North--The Stackwall System A Synopsis of the Physical and Biological Limnology and Fisheries Programs whithin the Alberta Oil Sands Area The Impact of Saline Waters upon Freshwater Biota (A Literature Review and Bibliography) Preliminary Investigations into the Magnitude of Fog Occurrence and Associated Problems in the Oil S'ands Area Development of a Research Design Related to Archaeological Studies in the Athabasca Oil Sands Area Life Cycles of Some Common Aquatic Insects of the Athabasca River, Alberta Very High Resolution Meteorological Satellite Study of Oi 1 Sands Weather: "A Feasibi 1 ity Study" Plume Dispersion Measurements from an Oil Sands Extraction Plant, March 1976
A Climatology of Low Level Air Trajectories in the Alberta Oil Sands Area The Feasibility of a Weather Radar near Fort McMurray, Alberta A Survey of Baseline Levels of Contaminants in Aquatic Biota of the AOSERP Study Area Interim Compilation of Stream Gauging Data to December 1976 for the Alberta Oil Sands Environmental Research Program Calculations of Annual Averaged Sulphur Dioxide Concentrations at Ground Level in the AOSERP Study Area Characterization of Organic Constituents in Waters and Wastewaters of the Athabasca Oil Sands Mining Area AOSERP Second Annual Report, 1976-77 Alberta Oil Sands Environmental Research'Program Interim Report to 1978 covering the period April 1975 to November 1978 Acute Lethality of Mine Depressurization Water on Trout Perch and Rainbow Trout Air System Winter Field Study in the AOSERP Study Area, February 1977. Review of Pollutant Transformation Processes Rel~vant to the Alberta Oil Sands Area
26. AF 4.5. 1
27. HE 1.5.1
28. VE 2. 1
29. HE 2.2
30. ME 2. 1 31 • VE 2.3
32. 33. TF J.2
34. HY 2.4
35. AF 4.9.1 36. AF 4.8.1
37. HE 2.2.2 38. VE 7. 1 • 1 39. ME 1.0
40. ws 3.3
41. AF 3.5.1 42. TF 1.1.4
43. TF 6. 1
44. VE 3. 1
45. VE 3.3
46. VE 3.4
47. TF 1. 1 • 1
48. HG 1.1
49. WS 1.3.3
50. ME 3.6 51. HY 1.3
52. ME 2.3.2
126
Interim Report on an Intensive Study of the Fish Fauna of the Muskeg River Watershed of Northeastern Alberta Meteorology and Air Quality Winter Field Study in the'AOSERP Study Area, March 1976 Interim Report on a Soils Inventory in the Athabasca Oil Sands Area An Inventory System for Atmospheric Emissions in the AOSERP Study Area Ambient Air Quality in the AOSERP Study Area, 1977 Ecological Habitat Mapping of the AOSERP Study Area: Phase I AOSERP Third Annual Report, 1977-78 Relationships Between Habitats, Forages, and Carrying Capacity of Hoose Range in northern Alberta. Part I: Moose Preferences for Habitat Strata and Forages. Heavy Metals in Bottom Sediments of the Mainstem Athabasca River System tn the AOSERP Study Area The Effects of Sedimentation on the Aquatic Biota Fall Fisheries Investigations in the Athabasca and Clearwater Rivers Upstream of Fort McMurray: Volume Community Studies: Fort McMurray, Anzac, Fort MacKay Techniques for the Control of Small Mammals: A Review The Climatology of the Alberta Oil Sands Environmental Research Program Study Area Mixing Characteristics of the Athabasca River below Fort McMurray - Winter Conditions Acute and Chronic Toxicity of Vanadium to Fish Analysis of Fur Production Records for Registered Traplines in the AOSERP Study Area, 1970-75 A Socioeconomic Evaluation of the Recreational Fish and Wildlife Resources in Alberta, with Particular Reference to the AOSERP Study Area. Volume I: Summary and Conclusions Interim Report on Symptomology and Threshold Levels of Air Pollutant Injury to Vegetation, 1975 to 1978 Interim Report on Physiology and Mechanisms of Air-Borne Pollutant Injury to Vegetation, 1975 to 1978 Interim Report on Ecological Benchmarking and Biomonitoring for Detection of Air-Borne Pollutant Effects on Vegetation and Soils, 1975 to 1978. A Visibility Bias Model for Aerial Surveys for Moose on the AOSERP Study Area Interim Report on a Hydrogeological Investigation of the Muskeg River Basin, Alberta The Ecology of Macrobenthic Invertebrate Communities in Hartley Creek, Northeastern Alberta Literature Review on Pollution Deposition Processes Interim Compilation of 1976 Suspended Sediment Date in the AOSERP Study Area Plume Dispersion Measurements from an Oil Sands Extraction Plan, June 1977
53. HY 3.1.2
54. ws 2.3
55. HY 2.6 56. Af 3.2. 1
57. lS 2.3. 1
58. AF 2.0.2
59. TF 3.1 60. WS 1. 1 • 1 61. AF 4.5.2
62. TF 5. 1 63.
64. lS 21.6. 1
65. lS 21.6.2
66. AS 4.3.2
67. WS 1. 3.2
68. AS 1.5.3 AS 3.5.2
69. HS 40. 1
70. lS 28. 1.2
71. HY 2.2
72. lS 7.1.2
73. lS 23.2
74. AS 4.5 75. ws 1.3.4
127
Baseline States of Organic Constituents in the Athabasca River System Upstream of Fort McMurray A Preliminary Study of Chemical and Microbial Characteristics of the Athabasca River in the Athabasca Oil Sands Area of Northeastern Alb~rta Microbial Populations in the Athabasca River The Acute Toxicity of Saline Groundwater and of Vanadium to Fish and Aquatic Invertebrates Ecological Habitat Mapping of the AOSERP Study Area (Supplement): Phase I Interim Report on Ecological Studies on the lower Trophic levels of Muskeg Rivers Within the Alberta Oil Sands Environmental Research Program Study Area Semi-Aquatic Mammals. Annotated Bibliography Synthesis of Surface Water Hydrology An Intensive Study of the Fish Fauna of the Steepbank River Watershed of Northeastern Alberta Amphibians and Reptiles in the AOSERP Study-Area Calculate Sigma Data for the Alberta Oil Sands Environmental Research Program Study Area. A Review of the Baseline Data Relevant to the Impacts of Oil Sands Development on large Mammals in the AOSERP Study Area A Review of the Baseline Data Relevant to the Impacts of Oil Sands Development on Black Bears in the AOSERP Study Area An Assessment of the Models llRAQ and ADPIC for Application to the Athabasca Oil Sands Area Aquatic Biological Investigations of the Muskeg River Watershed Air System Summer Field Study in the AOSERP Study Area, June 1977 Native Employment Patterns in Alberta's Athabasca Oil Sands Reg ion An Interim Report on the Insectivorous Animals in the AOSERP Study Area lake Acidification Potential in the Alberta Oil Sands Environmental Research Program Study Area The Ecology of Five Major Species of Small Mammals in the AOSERP Study Area: A Review Distribution, Abundance and Habitat Associations of Beavers, Muskrats, Mink and River Otters in the AOSERP Study Area, Northeastern Alberta Interim Report to 1978 Air Quality Modelling and User Needs Interim report on a comparative study of benthic algal primary productivity in the AOSERP study area
76. AF 4.5. 1
77. HS 20.1\1
78. LS 22. 1 • 1
79. AF 3.6.1
80. LS 22.3.1
81. LS 22.1.2
82. LS 22.2
83. LS 22.2
128
An ,I ntens ive Study of the F ish Fauna o'f the Muskeg River Watershed of Northeastern Alberta Overview of Local Economic Development in the Athabasca Oil Sands Region Since 1961. Habitat Relationships and Management of Terrestrial Birds in No rtheaste rn A I berta._ The Multiple Toxicity of Vanadium, Nickel, and Pheno I to Fi sh. Biology and Management of Peregrin Falcons (FaZco pe~egrinu8 anatum) in Northeastern Alberta. Species Distribution and Habitat Relationships of Waterfowl in Northeastern Alberta. Breeding Distribution and Behaviour of the White Pelican in the Athabasca Oil Sands Area. The Distribution, Foraging Behaviour, and Allied Activities of the White Pelican in the Athabasca Oil Sands Area.
These reports are not available upon request. For further information about availabil ity and location of depositories, please contact:
Alberta Oil Sands Environmental Research Program 15th Floor, Oxbridge Place 9820 - 106 Street Edmonton, Alberta T5K 2J6
This material is provided under educational reproduction permissions included in Alberta Environment and Sustainable Resource Development's Copyright and Disclosure Statement, see terms at http://www.environment.alberta.ca/copyright.html. This Statement requires the following identification: "The source of the materials is Alberta Environment and Sustainable Resource Development http://www.environment.gov.ab.ca/. The use of these materials by the end user is done without any affiliation with or endorsement by the Government of Alberta. Reliance upon the end user's use of these materials is at the risk of the end user.