81
Investment Community Presentation
| Date post: | 23-Mar-2018 |
| Category: |
Documents |
| Upload: | nguyendiep |
| View: | 216 times |
| Download: | 2 times |

Investment Community Presentation

04
11
23
41
49
55
65
Enbridge and Spectra Merger
Strategic Overview
Liquids Pipelines
Gas Pipelines & Processing
Gas Distribution
Power, International & Energy Services
Corporate Finance
Appendix
Project Status Update
Maps
73
Contents
75
76

Legal NoticeThis presentation includes certain forward looking information (FLI) to provide Enbridge shareholders and potential investors with information about Enbridge and management’s assessment of its future plans and operations, which may not be appropriate for other purposes. FLI is typically identified by words such as “anticipate”, “expect”, “project”, “estimate”, “forecast”, “plan”, “intend”, “target”, “believe” and similar words suggesting future outcomes or statements regarding an outlook. All statements other than statements of historical fact may be forward-looking statements. In particular, this Presentation may contain forward-looking statements pertaining to the following: expectations regarding, and anticipated impact of, the Transaction, dividend payout policy and dividend payout expectations; adjusted earnings per share guidance, available cash flow from operations (ACFFO) guidance; satisfaction of closing conditions and the obtaining of consents and
approvals required to complete the Transaction; effect, results and perceived benefits of the Transaction, including with respect to the consideration to be received by the Company; expected timing and completion of Transaction; future equity and debt offerings and financing requirements and plans; expected future sources and costs of financing; and future growth opportunities and the allocation and impact thereof.
Although we believe that our FLI is reasonable based on the information available today and processes used to prepare it, such statements are not guarantees of future performance and you are cautioned against placing undue reliance on FLI. By its nature, FLI involves a variety of assumptions, risks, uncertainties and other factors which may cause actual results, levels of activity and achievements to differ materially from those expressed or implied in our FLI. Material assumptions include assumptions about: expected timing and terms of the Transaction; anticipated completion of the Transaction; adoption of the dividend policy; satisfaction of all closing conditions and receipt of regulatory, shareholder and third party consents and approvals with respect to the Transaction; impact of the Transaction and dividend policy on the Company’s future cash flows and capital project funding; impact of the Transaction and dividend policy on the Company’s credit ratings; expected earnings/(loss) or adjusted earnings/(loss); expected earnings/(loss) or adjusted earnings/(loss) per share; expected future cash flows and expected future ACFFO; estimated future dividends; debt and equity market conditions; expected supply and demand for crude oil, natural gas and natural gas liquids; prices of crude oil, natural gas and natural gas liquids; expected exchange rates; inflation; interest rates; availability and price of labour and pipeline construction materials; operational reliability; anticipated in-service dates and weather. Due to the interdependencies and correlation of these macroeconomic factors, the impact of any one assumption on FLI cannot be determined with certainty, particularly with respect to expected earnings and associated per unit or per share amounts, or estimated future distributions or dividends.
Our FLI is subject to risks and uncertainties pertaining to the Transaction, dividend policy, adjusted earnings guidance, ACFFO guidance, operating performance, regulatory parameters, weather, economic conditions, exchange rates, interest rates and commodity prices, including but not limited to those discussed more extensively in our filings with Canadian and US securities regulators. The impact of any one risk, uncertainty or factor on any particular FLI is not determinable with certainty as these are interdependent and our future course of action depends on management’s assessment of all information available at the relevant time. Except to the extent required by law, we assume no obligation to publicly update or revise any FLI, whether as a result of new information, future events or otherwise. All FLI in this presentation is expressly qualified in its entirety by these cautionary statements.
You should be cautioned that there is no assurance that the Transaction will be completed in the manner contemplated, or at all, or that the current market conditions and Enbridge’s assumptions and forecasts based on such market conditions will not materially change.
This presentation will make reference to non-GAAP measures including adjusted earnings and ACFFO, together with respective per share amounts. These measures are not measures that have a standardized meaning prescribed by U.S. GAAP and may not be comparable with similar measures presented by other issuers. Additional information on the Company’s use of non-GAAP measures can be found in Management’s Discussion and Analysis available on the Company’s website and www.SEDAR.com and the news release.
Enbridge Inc. and Spectra Energy Corp. Combine to Create North America’s Premier Energy Infrastructure Company
Investment Community Presentation January 2017
1

This presentation includes certain forward looking statements and information (FLI) to provide Enbridge and Spectra Energy shareholders and potential investors with information about Enbridge, Spectra Energy and their respective subsidiaries and affiliates, including each company’s management’s respective assessment of Enbridge, Spectra Energy and their respective subsidiaries’ future plans and operations, which FLI may not be appropriate for other purposes. FLI is typically identified by words such as “anticipate”, “expect”, “project”, “estimate”, “forecast”, “plan”, “intend”, “target”, “believe”, “likely” and similar words suggesting future outcomes or statements regarding an outlook. All statements other than statements of historical fact may be FLI. In particular, this news release contains FLI pertaining to, but not limited to, information with respect to the following: the Transaction; the combined company’s scale, financial flexibility and growth program; future business prospects and performance; annual cost, revenue and financing benefits; the expectation that the Transaction will be neutral to expected ACFFO per share growth guidance through 2019 and additive to the growth rate beyond that timeframe; future shareholder returns; annual dividend growth and anticipated dividend increases; payout of distributable cash flow; financial strength and ability to fund capital program and compete for growth projects; run-rate and tax synergies; leadership and governance structure; and head office and business center locations.
Although we believe that the FLI is reasonable based on the information available today and processes used to prepare it, such statements are not guarantees of future performance and you are cautioned against placing undue reliance on FLI. By its nature, FLI involves a variety of assumptions, which are based upon factors that may be difficult to predict and that may involve known and unknown risks and uncertainties and other factors which may cause actual results, levels of activity and achievements to differ materially from those expressed or implied by these FLI, including, but not limited to, the following: the timing and completion of the Transaction, including receipt of regulatory and shareholder approvals and the satisfaction of other conditions precedent; interloper risk; the realization of anticipated benefits and synergies of the Transaction and the timing thereof; the success of integration plans; the focus of management time and attention on the Transaction and other disruptionsarising from the Transaction; expected future ACFFO; estimated future dividends; financial strength and flexibility; debt and equity market conditions, including the ability to access capital markets on favourable terms or at all; cost of debt and equity capital; potential changes in the Enbridge share price which may negatively impact the value of consideration offered to Spectra Energy shareholders; expected supply and demand for crude oil, natural gas, natural gas liquids and renewable energy; prices of crude oil, natural gas, natural gas liquids and renewable energy; economic and competitive conditions; expected exchange rates; inflation; interest rates; tax rates and changes; completion of growth projects; anticipated in-service dates; capitalproject funding; success of hedging activities; the ability of management of Enbridge, its subsidiaries and affiliates to execute key priorities, including those in connection with the Transaction; availability and price of labour and construction materials; operational performance and reliability; customer, shareholder, regulatory and other stakeholder approvals and support; regulatory and legislative decisions and actions; public opinion; and weather. We caution that the foregoing list of factors is notexhaustive. Additional information about these and other assumptions, risks and uncertainties can be found in applicable filings with Canadian and U.S. securities regulators, including any proxy statement, prospectus or registration statement to be filed in connection with the Transaction. Due to the interdependencies and correlation of these factors, as well as other factors, the impact of any one assumption, risk or uncertainty on FLI cannot be determined with certainty.
Except to the extent required by law, we assume no obligation to publicly update or revise any FLI, whether as a result of new information, future events or otherwise. All FLI in this news release is expressly qualified in its entirety by these cautionary statements.
This presentation makes reference to non-GAAP measures, including ACFFO and ACFFO per share. ACFFO is defined as cash flow provided by operating activities before changes in operating assets and liabilities (including changes in environmental liabilities) less distributions to non-controlling interests and redeemable non-controlling interests, preference share dividends and maintenance capital expenditures, and further adjusted for unusual, non-recurring or non-operating factors. Management of Enbridge believes the presentation of these measures gives useful information to investors and shareholders as they provide increased transparency and insight into the performance of Enbridge. Management of Enbridge uses ACFFO to assess performance and to set its dividend payout target. These measures are not measures that have a standardized meaning prescribed by generally accepted accounting principles in the United States of America (U.S. GAAP) and may not be comparable with similar measures presented by other issuers. Additional information on Enbridge’s use of non-GAAP measures can be found in Enbridge’s Management’s Discussion and Analysis (MD&A) available on Enbridge’s website and www.sedar.com.
Enbridge will file with the U.S. Securities and Exchange Commission (SEC) a registration statement on Form F-4, which will include a proxy statement of Spectra Energy that also constitutes a prospectus of Enbridge, and any other documents in connection with the Transaction. The definitive proxy statement/prospectus will be sent to the shareholders of Spectra Energy. INVESTORS AND SHAREHOLDERS OF SPECTRA ENERGY ARE URGED TO READ THE PROXY STATEMENT/PROSPECTUS, AND ANY OTHER DOCUMENTS FILED OR TO BE FILED WITH THE SEC IN CONNECTION WITH THE TRANSACTION WHEN THEY BECOME AVAILABLE, AS THEY WILL CONTAIN IMPORTANT INFORMATION ABOUT Enbridge, Spectra Energy, THE TRANSACTION AND RELATED MATTERS. The registration statement and proxy statement/prospectus and other documents filed by Enbridge and Spectra Energy with the SEC, when filed, will be available free of charge at the SEC's website at www.sec.gov. In addition, investors and shareholders will be able to obtain free copies of the proxy statement/prospectus and other documents which will be filed with the SEC by Enbridge on Enbridge’s website at www.Enbridge.com or upon written request to Enbridge’s Investor Relations department, 200, 425 First St. SW, Calgary, AB T2P 3L8 or by calling 800.481.2804 within North America and 403.231.5957 from outside North America, and will be able to obtain free copies of the proxy statement/prospectus and other documents filed with the SEC by Spectra Energy upon written request to Spectra Energy, Investor Relations, 5400 Westheimer Ct. Houston, TX 77056 or by calling 713.627.4610. You may also read and copy any reports, statements and other information filed by Spectra Energy and Enbridge with the SEC at the SEC public reference room at 100 F Street N.E., Room 1580, Washington, D.C. 20549. Please call the SEC at 800.732.0330 or visit the SEC's website for further information on its public reference room. This communication shall not constitute an offer to sell or the solicitation of an offer to buy any securities, nor shall there be any sale of securities in any jurisdiction in which such offer, solicitation or sale would be unlawful prior to appropriate registration or qualification under the securities laws of such jurisdiction. No offering of securities shall be made except by means of a prospectus meeting the requirements of Section 10 of the U.S. Securities Act of 1933, as amended.
This communication is not a solicitation of proxies in connection with the Transaction. However, Enbridge, Spectra Energy, certain of their respective directors and executive officers and certain other members of management and employees, under SECrules, may be deemed to be participants in the solicitation of proxies in connection with the Transaction. Information about Enbridge’s directors and executive officers may be found in its Management Information Circular dated March 8, 2016 available on its website at www.Enbridge.com and at www.sedar.com. Information about Spectra Energy's directors, executive officers and other members of management and employees may be found in its 2015 Annual Report on Form 10-K filed with the SEC on February 25, 2016, and definitive proxy statement relating to its 2016 Annual Meeting of Shareholders filed with the SEC on March 16, 2016. These documents can be obtained free of charge from the sources indicated above. Additional information regarding the interests of such potential participants in the solicitation of proxies in connection with the Transaction will be included in the proxy statement/prospectus and other relevant materials filed with the SEC when they become available.
Legal Disclaimer
Investment Community Presentation January 2017
2
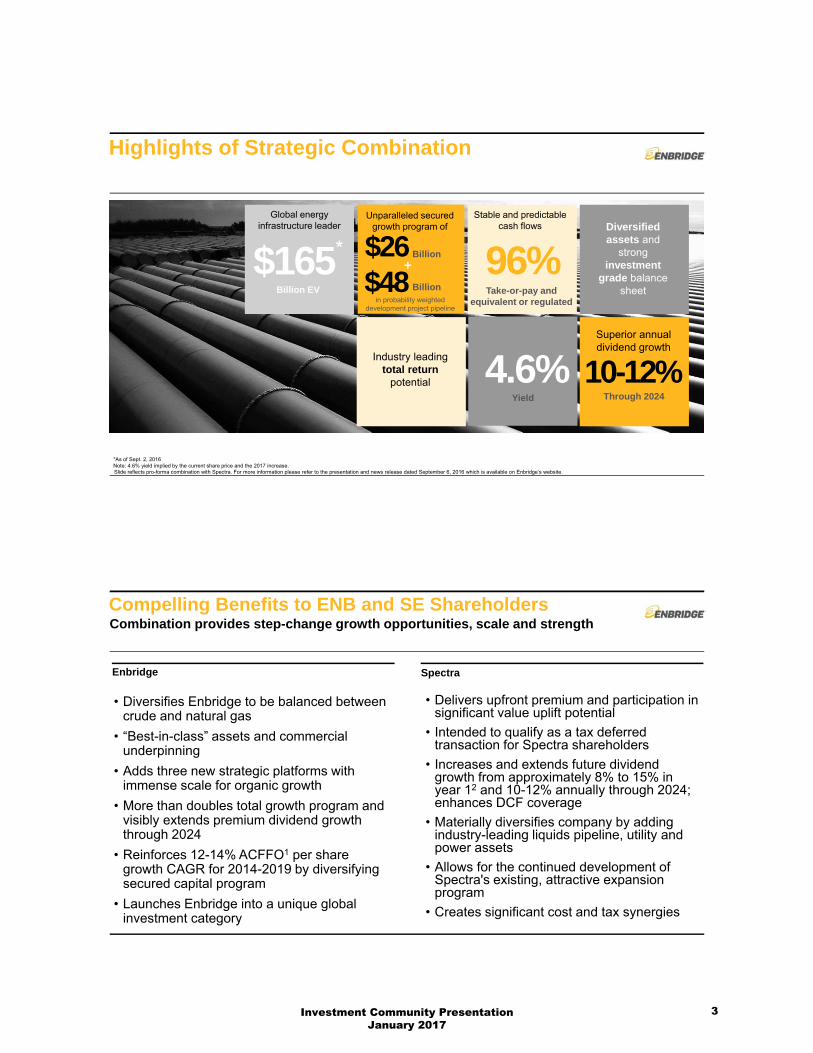
Highlights of Strategic Combination
$165Billion EV
10-12% Through 2024
Global energy infrastructure leader
Superior annual dividend growth
Unparalleled secured growth program of
$26Billion
Industry leading total return
potential
96%Take-or-pay and
equivalent or regulated
Stable and predictable cash flows
Yield
4.6%
Diversified assets and
strong investment
grade balance sheet$48 Billion
in probability weighted development project pipeline
+
*As of Sept. 2, 2016Note: 4.6% yield implied by the current share price and the 2017 increase.Slide reflects pro-forma combination with Spectra. For more information please refer to the presentation and news release dated September 6, 2016 which is available on Enbridge’s website.
*
Compelling Benefits to ENB and SE ShareholdersCombination provides step-change growth opportunities, scale and strength
Enbridge Spectra
• Diversifies Enbridge to be balanced between crude and natural gas
• “Best-in-class” assets and commercial underpinning
• Adds three new strategic platforms with immense scale for organic growth
• More than doubles total growth program and visibly extends premium dividend growth through 2024
• Reinforces 12-14% ACFFO1 per share growth CAGR for 2014-2019 by diversifying secured capital program
• Launches Enbridge into a unique global investment category
• Delivers upfront premium and participation in significant value uplift potential
• Intended to qualify as a tax deferred transaction for Spectra shareholders
• Increases and extends future dividend growth from approximately 8% to 15% in year 12 and 10-12% annually through 2024; enhances DCF coverage
• Materially diversifies company by adding industry-leading liquids pipeline, utility and power assets
• Allows for the continued development of Spectra's existing, attractive expansion program
• Creates significant cost and tax synergies
Investment Community Presentation January 2017
3

• $165B enterprise value
• Highest quality liquids and natural gas franchises
• Low-risk business model
• Strong balance sheet and access to capital
• $26B combined secured growth program
• 12-14% CAGR ACFFO/share growth (2014-2019)
• $48B development project pipeline drives 10-12% annual dividend growth through 2024
Premier North American Energy Infrastructure AssetsHighly compelling combination
Slide reflects pro-forma combination with Spectra Energy. For more information please refer to the presentation and news release dated September 6, 2016 which is available on Enbridge’s website.
Processing plants
Terminals / storage
Liquids long-haul
Gas long-haul
G&P pipelines
Wind assets
Geothermal power
Gas distribution
Solar assets
Enbridge
Processing plants
Propane terminals
Gas long-haul
NGL storage
Crude storage
Gas storage facility
Gas Distribution
Liquids long-haul
Spectra
G&P pipelines
Power transmission
Slide reflects pro-forma combination with Spectra Energy. For more information please refer to the presentation and news release dated September 6, 2016 which is available on Enbridge’s website.
North American Energy InfrastructureEnterprise Value
Global Energy CompaniesMarket Capitalization
Canadian Listed CompaniesEnterprise Value
$-
$20
$40
$60
$80
$100
$120
$140
$160
$180
En
brid
ge P
F
DU
K
KM
I
NE
E
En
brid
ge
ET
E
EP
D
TR
P
ET
P
WM
B
WP
Z
Sp
ectr
a
$-
$20
$40
$60
$80
$100
$120
$140
RY
TD
BN
S
En
brid
geP
F CN
R
SU
BM
O
BC
E
En
brid
ge
CN
Q
BA
M
CM
TR
I
Largest North American energy infrastructure company
One of the largest energy companies globally
One of the largest publicly listed Canadian companies
Source: Market Data from FactSet as at 09/02/2016. Based on spot FX rate as of 09/02/2016.
Enhanced financial flexibility and access to capitalScale Enhances Competitive Position
$-
XO
M
CV
X
Pe
troC
hina
RD
SB
BR
Pet
ro.
Tot
al BP
Sin
opec
En
brid
ge P
F
SL
B
DU
K
KM
I
En
brid
ge
EP
D
$600
$300
$150
$-
Investment Community Presentation January 2017
4

80
116
Residential/ Commercial
Industrial
Coal/ Nuclear Retirements
PowerDemand
Exports byLNG andPipeline
0
1,000
2,000
3,000
4,000
5,000
6,000
2016 2017 2018 2019 2020 2021 2022 2023 2024 2025
Fundamentals Support Sustainable Long Term Cash Flow and Efforts to Extend and Diversify Growth
Natural Gas: Steady long term growth from demand pull assets into US Northeast, Southeast and Gulf Coast
Liquids: Highly stable and growing base cash flows with further upside optionality in an oil recovery scenario
WCSB Takeaway Capacity vs Supply (kbpd)
WCSB short >500 kbpd pipeline capacity by 2021
Western Canadian refineries
Other existing pipelines
Enbridge
Sources of demand (Bcf/d)
Significant expansion potential
2016 2025
Slide reflects pro-forma combination with Spectra Energy. For more information please refer to the presentation and news release dated September 6, 2016 which is available on Enbridge’s website.
Multiple Strategic Growth Platforms
Positioned for sustained demand-pull organic growth for the foreseeable future
Positioned on a combined basis to compete with Canada’s leading midstream players on gas and NGL midstream infrastructure
Positioned to provide integrated gas/liquids midstream services across the hydrocarbon chain
Highly predictable growing cash flows with significant further
upside optionality
Utilities deliver significant customer and shareholder
benefits; Compelling platform for
extension to electric utilities
Spectra U.S. presence and utility customer base enhances growth
opportunities for Enbridge’s top-10 North American position
Canadian Midstream
North American
GasPipelines
Utilities
Renewable Power
U.S.Midstream
Enbridge Platforms for Growth Spectra Platforms for Growth
North American Liquids
Pipelines
Slide reflects pro-forma combination with Spectra Energy. For more information please refer to the presentation and news release dated September 6, 2016 which is available on Enbridge’s website.
Investment Community Presentation January 2017
5

Strong Commercial Underpinning
Low Risk Business Model Limited Commodity Price Risk Investment Grade Customers
96% of cash flow underpinned by long term commercial agreements (Take-or-pay or
equivalent1 contracts)
<5% of combined EBITDA is commodity price exposed
93%2 of revenue from investment grade or equivalent customers
Maintains Enbridge’s low risk and capital discipline for unparalleled resilience in all market cycles
Investment grade or equivalent 93%
Sub investment grade 7%
Fee-based >95%
Not fee-based <5%
Take-or-pay or equivalent 96%
Volumetric risk 4%
Slide reflects pro-forma combination with Spectra Energy. For more information please refer to the presentation and news release dated September 6, 2016 which is available on Enbridge’s website.
(1) Equivalent includes cost of service, Competitive Tolling Settlement and fee for service.(2) Excludes low risk regulated distribution utility revenues.
Significant and Highly Visible Combination Synergies
Full run-rate cost synergies expected to be achieved by end of 2018:
• Identifiable and achievable cost synergies; conservative estimates
•Potential to optimize funding / financing synergies (not included)
•Extends Spectra Energy’s current favorable cash tax position beyond 2018
•Assumes no benefits from future commercial and structuring synergies
Significant value created through operating and financial synergies
Forecast annual run rate synergies by 2018
$540 Million
General O&A costs 75%
Supply chain optimization 13%
Other costs 12%
Multiple synergy opportunities
Slide reflects pro-forma combination with Spectra Energy. For more information please refer to the presentation and news release dated September 6, 2016 which is available on Enbridge’s website.
Investment Community Presentation January 2017
6

Industry Leading GrowthWell balanced organic growth opportunities across six platforms
North American Liquids
Pipelines
North American Gas PipelinesUtilities
Midstream
Renewable Power
Unrivaled pro-forma secured expansion program1
2017 – 2019 ISDs ($ billions)Large, diverse opportunity set ($ billions)
$6 $8
$13
$17
$23
$26
WMBEPDETPKMITRPPro FormaEnbridge
100% in execution
$48Billion
Probability weighted development projects
Major Components of Risked Capital2, 3
• De-bottlenecking liquids pipelines / market access
• Northeast gas pipelines expansion / extension
• Southeast gas pipeline capacity
• Gas pipelines for exports
• EDF – Offshore wind
• Other offshore wind
• Utility organic growth
• Organic midstream expansion
• Others
Note: KMI, ETP, EPD and WMB secured expansion capex figures converted to CAD using a 1.28 USD to CAD F/X rate.(1) Secured growth capital program reflects only publicly announced secured projects entering into service between 2017 and 2019.(2) Probability weighted development growth capital.(3) Capital spending (predominantly post-2020) will further extend growth beyond the next decade
Slide reflects pro-forma combination with Spectra Energy. For more information please refer to the presentation and news release dated September 6, 2016 which is available on Enbridge’s website.
Diversifies and De-risks 2017–2019 Growth Guidance
Capital in service (2017 – 2019)
$5.9
$1.4
$8.2
$7.0
$2.6
$0.4
0
2
4
6
8
10
12
14
2017 2018 2019
$26B in projects to come online between 2017 and 2019
Diversity of secured growth programs by:• Commodity type• Expenditure profile
• Geography• Project size
Enbridge
Spectra Energy
$13$13
$4$4
$9$9
Slide reflects pro-forma combination with Spectra Energy. For more information please refer to the presentation and news release dated September 6, 2016 which is available on Enbridge’s website.
Investment Community Presentation January 2017
7

Supports, De-risks and Enhances Current Plan
$3.02
$3.72
2014A 2015A 2016E 2017E 2018E 2019E
$5.50
$6.00
$3.80
$4.50
ACFFO per share outlook through 2019 intact
ACFFO per Share Outlook (2014-2019)
2016E 2017E 2018E 2019E 2020E 2021E 2022E 2023E 2024E
Enbridge Spectra Energy Combination –Visible Organic Dividend Growth with Upside Potential
Dividend per Share Outlook (2017-2024)
$2.12
• 15% dividend increase in 20171
• 10-12% annual dividend growth (2018 through 2024)
• Conservative payout ratio of 50% - 60%
Dividend growth beyond 2019 supported by:
• Embedded growth / tilted returns
• $48B in probability-weighted development
project pipeline
• Potential to gradually increase payout within
50-60% range
1 Pro-rated based on transaction close date.Slide reflects pro-forma combination with Spectra Energy. For more information please refer to the presentation and news release dated September 6, 2016 which is available on Enbridge’s website.
Dividend growth through 2019 supported by:
• $26B secured growth program in execution
• Embedded growth / tilted returns
Investment Community Presentation January 2017
8

No Requirements for Follow-on Enbridge Inc. Equity
Uses Sources
Immediate and strengthening financial flexibility
Enbridge Group Funding Requirements2017e – 2019e
Debt maturities $10 JV Contributions $2
Capital expenditures $23 DRIP/Sponsored Investments/Monetizations
$8
Debt issuances $9
Internal cash flow, net of dividends $14
Ample sources of alternative equity financing
• $8B of alternative sources of equity capital:
• Spectra Energy Partners ATM
• Enbridge Income Fund Common Equity
• Enbridge Energy Partners PIK
• Enbridge Inc. DRIP
• Hybrids
• Planned monetization of ~$2B in non-core assets over next 12 months
• Other identified asset monetizations could provide an incremental $5-$6B of capital
Significant free cash flow generation beyond 2019
• Cumulative $14 to $18B free cash flow1 enables company to grow organically, acquire assets, and raise dividends without equity issuance at corporate level
• More competitive in capturing new organic opportunities
1 Cumulative free cash flow (net of dividends and maintenance capital) generated between 2020e and 2024e from commercially secured growth.
Balance Sheet StrengthCommitted to strong, investment grade credit ratings
Key Credit Metrics and TargetsStrong Credit Metrics
Significant Balance Sheet Strengthening by 2018Projected Pro Forma Debt to EBITDA
Credit Metric Target
FFO / Debt ≥15%
Debt / EBITDA ≤5.0x
6.2x5.5x
5.1x4.3x
2016 2017 2018 2019
5.0x
• Increased size, scale and asset diversity significantly enhances the credit profile of the combined entity
• Debt to EBITDA naturally improves as high quality projects under construction are placed into service and begin generating cash flows
• Committed to achieving targeted improvement in credit metrics and maintaining credit ratings across the family of companies as new projects are pursued
Slide reflects pro-forma combination with Spectra. For more information please refer to the presentation and news release dated September 6, 2016 which is available on Enbridge’s website.
Investment Community Presentation January 2017
9
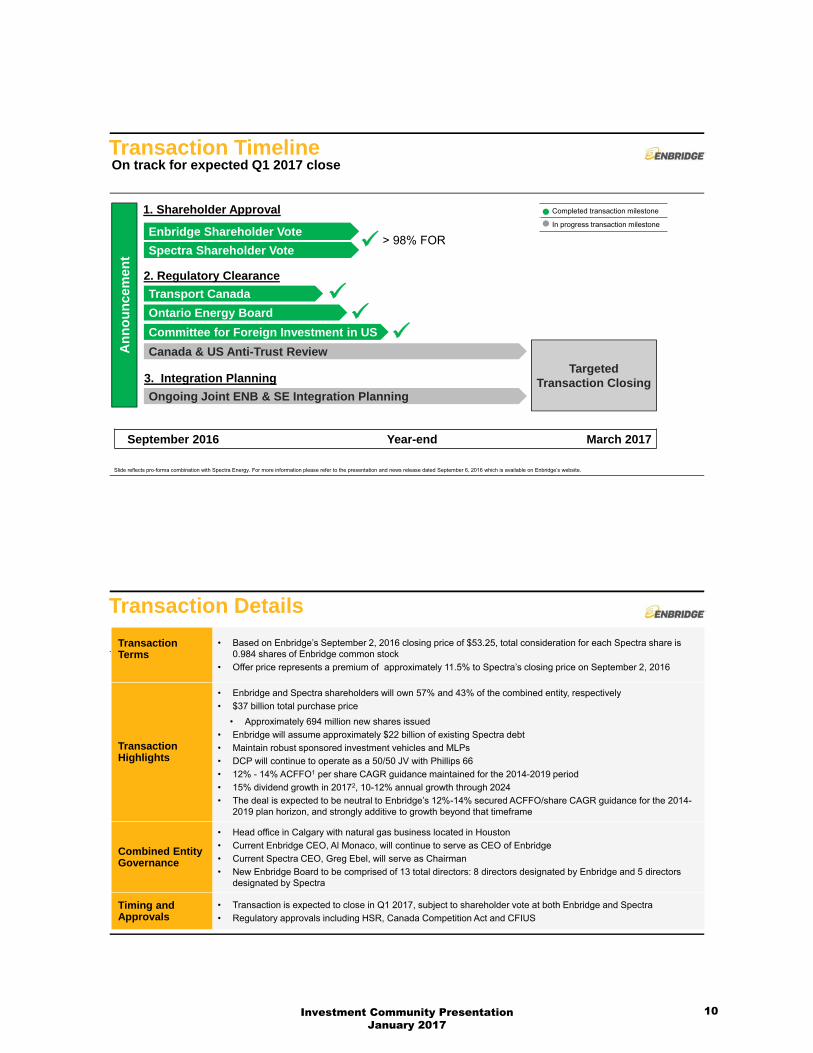
Transaction TimelineOn track for expected Q1 2017 close
Enbridge Shareholder Vote
An
no
un
cem
ent
Targeted Transaction Closing
September 2016 Year-end March 2017
Completed transaction milestone
In progress transaction milestone
Slide reflects pro-forma combination with Spectra Energy. For more information please refer to the presentation and news release dated September 6, 2016 which is available on Enbridge’s website.
Obtain Transport Canada and CFIUS clearance
Spectra Shareholder Vote
Transport Canada
Ontario Energy Board
Committee for Foreign Investment in US
Canada & US Anti-Trust Review
Ongoing Joint ENB & SE Integration Planning
1. Shareholder Approval
2. Regulatory Clearance
3. Integration Planning
> 98% FOR
Transaction Terms
• Based on Enbridge’s September 2, 2016 closing price of $53.25, total consideration for each Spectra share is 0.984 shares of Enbridge common stock
• Offer price represents a premium of approximately 11.5% to Spectra’s closing price on September 2, 2016
Transaction Highlights
• Enbridge and Spectra shareholders will own 57% and 43% of the combined entity, respectively
• $37 billion total purchase price
• Approximately 694 million new shares issued
• Enbridge will assume approximately $22 billion of existing Spectra debt
• Maintain robust sponsored investment vehicles and MLPs
• DCP will continue to operate as a 50/50 JV with Phillips 66
• 12% - 14% ACFFO1 per share CAGR guidance maintained for the 2014-2019 period
• 15% dividend growth in 20172, 10-12% annual growth through 2024
• The deal is expected to be neutral to Enbridge’s 12%-14% secured ACFFO/share CAGR guidance for the 2014-2019 plan horizon, and strongly additive to growth beyond that timeframe
Combined Entity Governance
• Head office in Calgary with natural gas business located in Houston
• Current Enbridge CEO, Al Monaco, will continue to serve as CEO of Enbridge
• Current Spectra CEO, Greg Ebel, will serve as Chairman
• New Enbridge Board to be comprised of 13 total directors: 8 directors designated by Enbridge and 5 directors designated by Spectra
Timing and Approvals
• Transaction is expected to close in Q1 2017, subject to shareholder vote at both Enbridge and Spectra
• Regulatory approvals including HSR, Canada Competition Act and CFIUS
Transaction Details
Investment Community Presentation January 2017
10

Strategic Overview
Investment Community Presentation January 2017
11
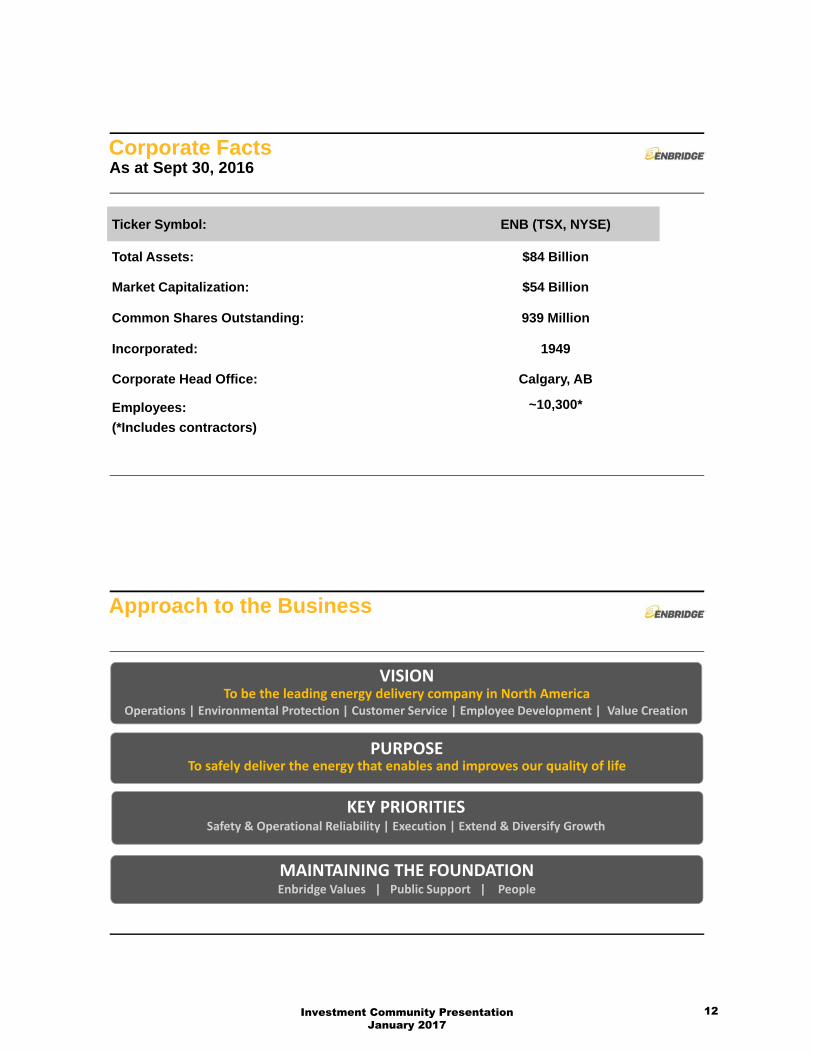
Corporate Facts
Ticker Symbol: ENB (TSX, NYSE)
Total Assets: $84 Billion
Market Capitalization: $54 Billion
Common Shares Outstanding: 939 Million
Incorporated: 1949
Corporate Head Office: Calgary, AB
Employees:
(*Includes contractors)
~10,300*
As at Sept 30, 2016
Approach to the Business
PURPOSETo safely deliver the energy that enables and improves our quality of life
KEY PRIORITIESSafety & Operational Reliability | Execution | Extend & Diversify Growth
MAINTAINING THE FOUNDATIONEnbridge Values | Public Support | People
VISION
Operations | Environmental Protection | Customer Service | Employee Development | Value CreationTo be the leading energy delivery company in North America
Investment Community Presentation January 2017
12

Strategically Positioned AssetsLiquids
• 27,600 km of pipeline
• 2.85 mmbpd mainline capacity
• 3.5 mmbpd market connected
Gas Distribution
• 2.1 million customers
• 420 bcf distributed
• 115 bcf gas storage
Gas Pipelines & Processing
• 24,800 km of pipeline
• 12 bcf/d pipeline capacity
• 107,000 bpd fractionation
• 4 bcf/d G&P capacity
Power & Energy Services
• 23 renewable projects
• 1,776 MW capacity (net)
• Marketing & refining supply
Shareholder Value Proposition
Industry Leading GrowthStrategic Asset Positioning ● Strong Fundamentals ●
Extend & Diversify Growth
Reliable Business ModelConservative Commercial Structures ● Minimal Commodity Exposure ●
Disciplined Capital Allocation
Significant Dividend Income4.0% yield ●10-12% growth
Superior Shareholder Returns=
+
+
14% 13%
2%4%
11% 11%
5 Year 10 Year
Enbridge Inc. S&P/TSX Composite Index Peer Average
2006 2007 2008 2009 2010 2011 2012 2013 2014 2015 2016
Dividend Per Share
Annualized Total Shareholder Return Dec 31, 2015
Investment Community Presentation January 2017
13
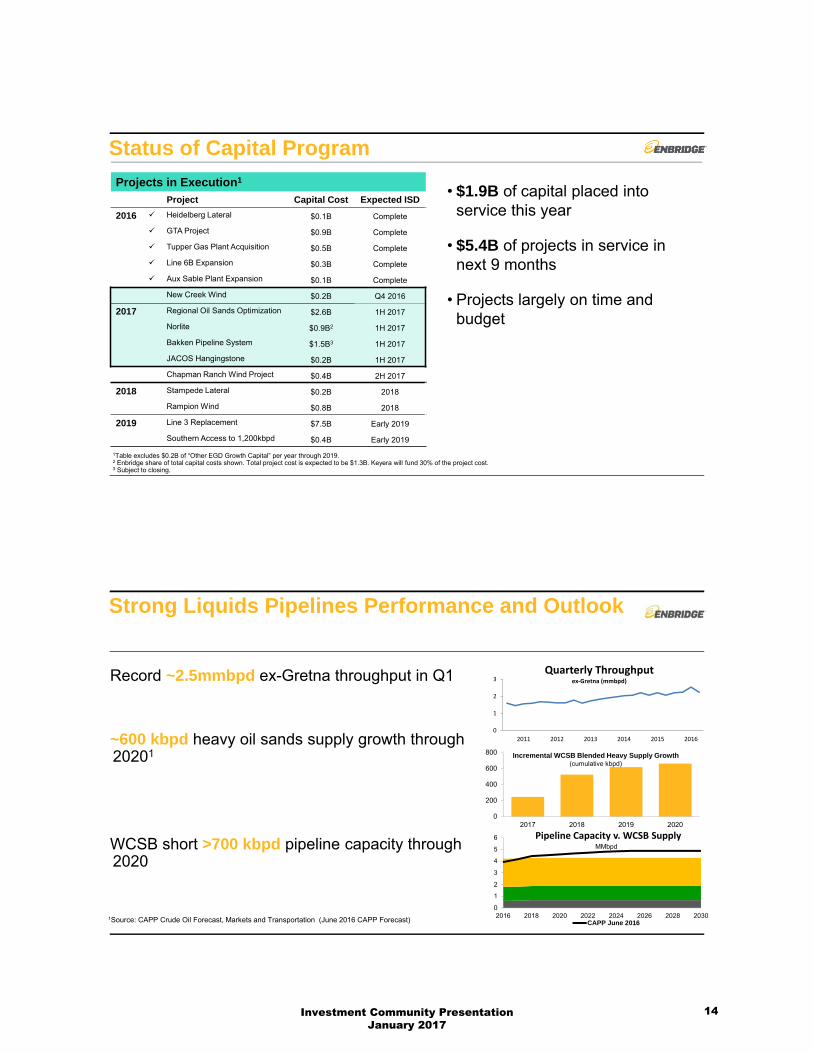
Status of Capital Program
Projects in Execution1
Project Capital Cost Expected ISD
2016 Heidelberg Lateral $0.1B Complete
GTA Project $0.9B Complete
Tupper Gas Plant Acquisition $0.5B Complete
Line 6B Expansion $0.3B Complete
Aux Sable Plant Expansion $0.1B Complete
New Creek Wind $0.2B Q4 2016
2017 Regional Oil Sands Optimization $2.6B 1H 2017
Norlite $0.9B2 1H 2017
Bakken Pipeline System $1.5B3 1H 2017
JACOS Hangingstone $0.2B 1H 2017
Chapman Ranch Wind Project $0.4B 2H 2017
2018 Stampede Lateral $0.2B 2018
Rampion Wind $0.8B 2018
2019 Line 3 Replacement $7.5B Early 2019
Southern Access to 1,200kbpd $0.4B Early 2019
1Table excludes $0.2B of “Other EGD Growth Capital” per year through 2019.2 Enbridge share of total capital costs shown. Total project cost is expected to be $1.3B. Keyera will fund 30% of the project cost.3 Subject to closing.
• $1.9B of capital placed into service this year
• $5.4B of projects in service in next 9 months
• Projects largely on time and budget
0
200
400
600
800
2017 2018 2019 2020
Strong Liquids Pipelines Performance and Outlook
1Source: CAPP Crude Oil Forecast, Markets and Transportation (June 2016 CAPP Forecast)
Pipeline Capacity v. WCSB Supply
0
1
2
3
4
5
6
2016 2018 2020 2022 2024 2026 2028 2030
MMbpd
CAPP June 2016
0
1
2
3
2011 2012 2013 2014 2015 2016
Quarterly Throughputex‐Gretna (mmbpd)
Incremental WCSB Blended Heavy Supply Growth(cumulative kbpd)
Record ~2.5mmbpd ex-Gretna throughput in Q1
~600 kbpd heavy oil sands supply growth through 20201
WCSB short >700 kbpd pipeline capacity through 2020
Investment Community Presentation January 2017
14

Liquids Business Competitive Position & Market Reach
*USD per barrel of heavy crude from Hardisty to Chicago
MARKET CAPACITY(KBPD)
Mainline ConnectedRefineries
1,900
Mainline Connected Markets (Pipelines)
PADD II 200
Cushing/USGC 775
Quebec/Ontario 300
Patoka 300
Total Pipeline Access 1,575
Grand Total 3,475
Stable, competitive tolls Stable, competitive tolls
$0
$2
$4
$6
2012 2013 2014 2015 2016
Strong Financial Position Strong credit ratings provide ready access to debt capital to fund growth program
Strong credit ratings supported by:
• Low business risk (rated “A” by Moody’s; “Excellent” by S&P)
• Minimal commodity price risk; strong counterparties
• Stable and predictable cash flows
• Project execution track record
• Strong dividend coverage
• Substantial standby liquidity; access to multiple sources of capital
EPI EGD ENB FUND EEP
DBRS A ABBB
(High)BBB
(High) BBB
Outlook Stable Stable Stable Stable Stable
Moody’s - - Baa2 Baa2 Baa3
Outlook - - Negative Negative Negative
S&P BBB+ BBB+ BBB+ - BBB
Outlook Stable Stable Stable - Stable
Investment Community Presentation January 2017
15
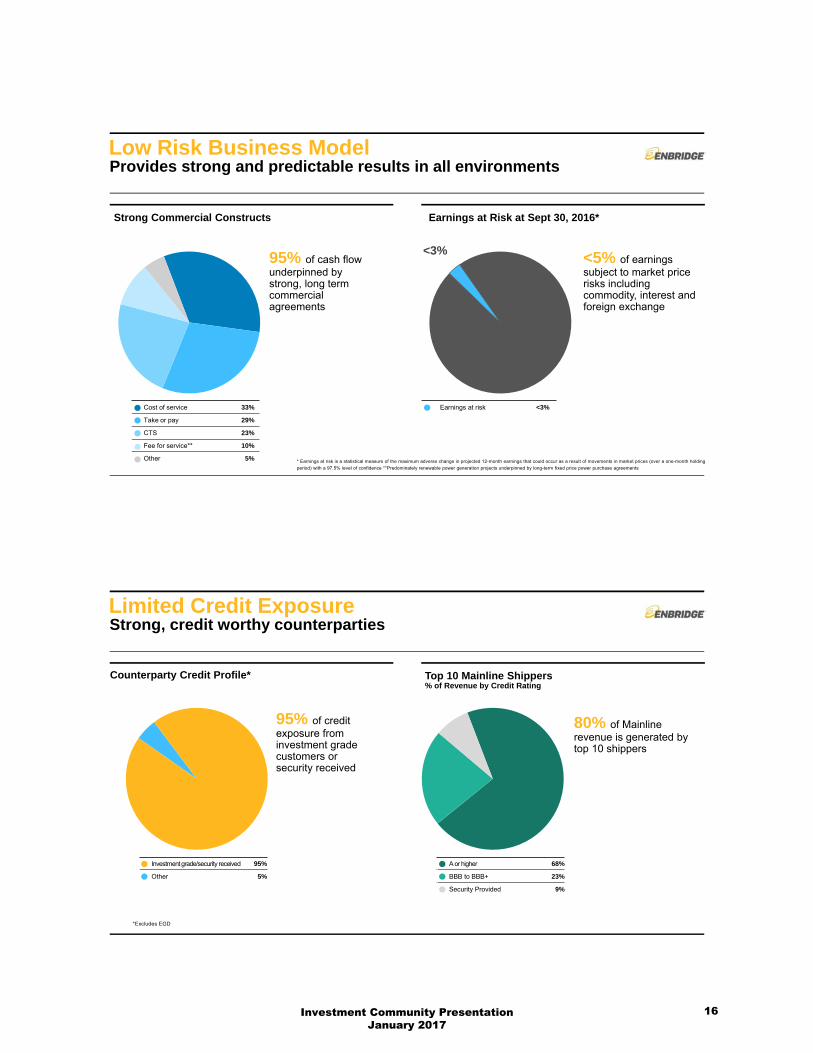
Low Risk Business Model
Strong Commercial Constructs
Provides strong and predictable results in all environments
Earnings at Risk at Sept 30, 2016*
Earnings at risk <3%Cost of service 33%
Take or pay 29%
CTS 23%
Fee for service** 10%
Other 5%
95% of cash flow underpinned by strong, long term commercial agreements
<5% of earnings subject to market price risks including commodity, interest and foreign exchange
<3%
* Earnings at risk is a statistical measure of the maximum adverse change in projected 12-month earnings that could occur as a result of movements in market prices (over a one-month holding
period) with a 97.5% level of confidence **Predominately renewable power generation projects underpinned by long-term fixed price power purchase agreements
Limited Credit Exposure Strong, credit worthy counterparties
Counterparty Credit Profile* Top 10 Mainline Shippers% of Revenue by Credit Rating
Investment grade/security received 95%
Other 5%
A or higher 68%
BBB to BBB+ 23%
Security Provided 9%
95% of credit exposure from investment grade customers or security received
80% of Mainline revenue is generated by top 10 shippers
*Excludes EGD
Investment Community Presentation January 2017
16

Strong Counterparty Credit Profile Major liquids pipeline systems underpinned by strong, investment grade customers
MAINLINE TOP 10 SHIPPERS
Shipper 1: Integrated AA+/Aaa
Shipper 2: Integrated A-/NR
Shipper 3: Refiner BBB/Baa2
Shipper 4: Integrated A-/Baa1
Shipper 5: Refiner AA-/A1
Shipper 6: Refiner A/Aa2
Shipper 7: Integrated BBB/Baa2
Shipper 8: Midstream B-/B3 (security provided)
Shipper 9: Refiner BBB-/Baa3
Shipper 10: Refiner BB/Ba3 (security provided)
REGIONAL OIL SANDS TOP 10 SHIPPERS
Shipper 1: Integrated A-/Baa1
Shipper 2: Integrated AA+/NR
Shipper 3: Producer BBB/Ba2
Shipper 4: Integrated BBB+/Baa2
Shipper 5: Producer A-/Baa2
Shipper 6: Producer BBB- (internal rating)
Shipper 7: Producer Credit enhancement to investment grade
Shipper 8: Integrated A+/Aa3
Shipper 9: Producer BBB+/NR
Positioned for Low Commodity Price Environment
Power & Energy Services
Gas Distribution Gas Pipelines & Processing
•WCSB volume growth through 2019
•Well capitalized customers with strong credit ratings
•Largest producers integrated with downstream operations
•Long term take-or-pay contracts
•Diversified businesses, connecting to premium markets
•Optimizing cost structure (MEP)
•No commodity price exposure
•Regulated business with throughput protection
•Highly competitive fuel source
•Long term PPAs with contracted power prices
•Diversified wind and solar resources
•Physical market arbitrage (Energy Services)
Liquids Pipelines
Investment Community Presentation January 2017
17
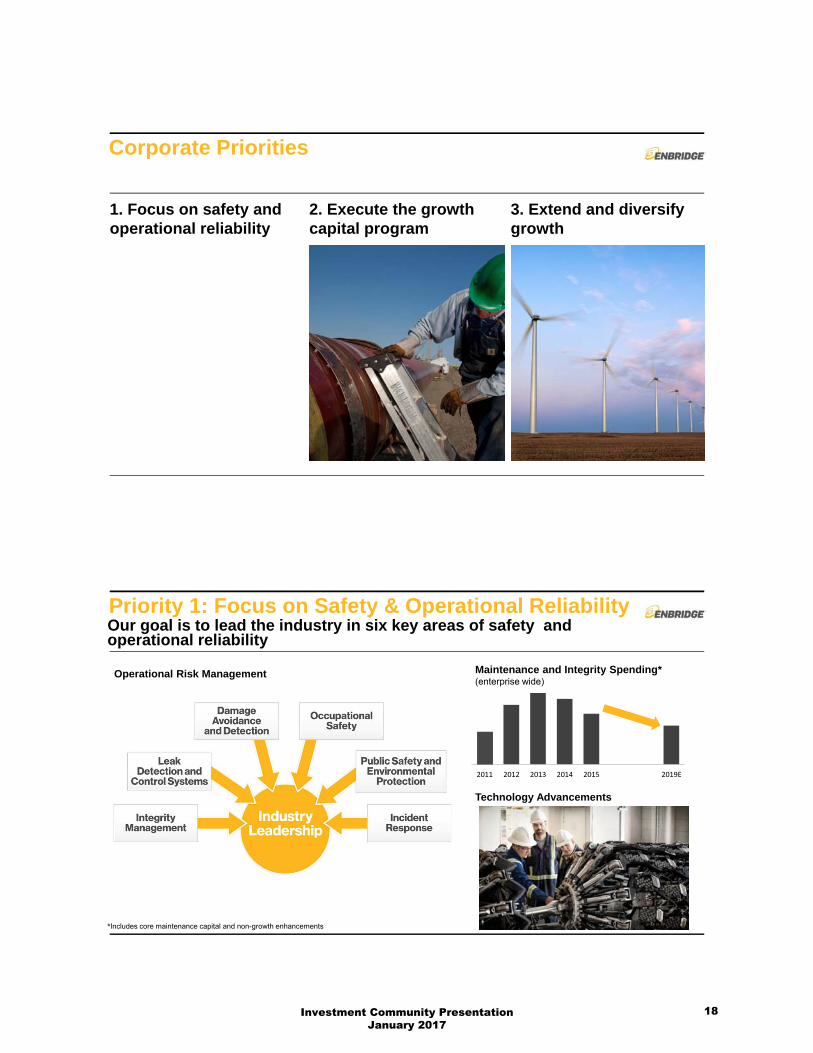
Corporate Priorities
1. Focus on safety andoperational reliability
2. Execute the growthcapital program
3. Extend and diversify growth
Priority 1: Focus on Safety & Operational ReliabilityOur goal is to lead the industry in six key areas of safety and operational reliability
Operational Risk Management
2011 2012 2013 2014 2015 2019E
Maintenance and Integrity Spending*(enterprise wide)
Technology Advancements
*Includes core maintenance capital and non-growth enhancements
Investment Community Presentation January 2017
18

Priority 2: Execute the Capital ProgramEnbridge has developed a strong major projects execution capability that provides a competitive advantage
Challenging Environment• Securing regulatory approval
• Cost and schedule risk
Project Management Expertise• Disciplined processes
• Supply chain management
• Capacity, skills, resources
Engaging Communities • Safety and environmental protection
• Demonstrate flexibility
• Build coalitions of support
0%
20%
40%
60%
80%
100%
Priority 2: Cost and Supply Chain Management
Key Inputs Secured• Favourable pricing and terms
⎯ Pipe
⎯ Mainline construction
⎯ Engineered equipment
• Capital Management
⎯ Supply chain cost initiatives
⎯ Scalable workforce
⎯ Productivity enhancements
• Capacity Optimization
⎯ Regional Oil Sands Optimization
⎯ $400 million savings
⎯ Mainline optimization
Enbridge Pipe vs. Market Pricing(USD/Short Ton)
Canadian Pipe
U.S. Pipe
Mainline Contracting
Land/ROW Acquisition
Enbridge Pricing
Market Pricing
0
400
800
1,200
1,600
2,000
Jan‐12 Nov‐12 Sep‐13 Jul‐14 May‐15 Mar‐16
Investment Community Presentation January 2017
19
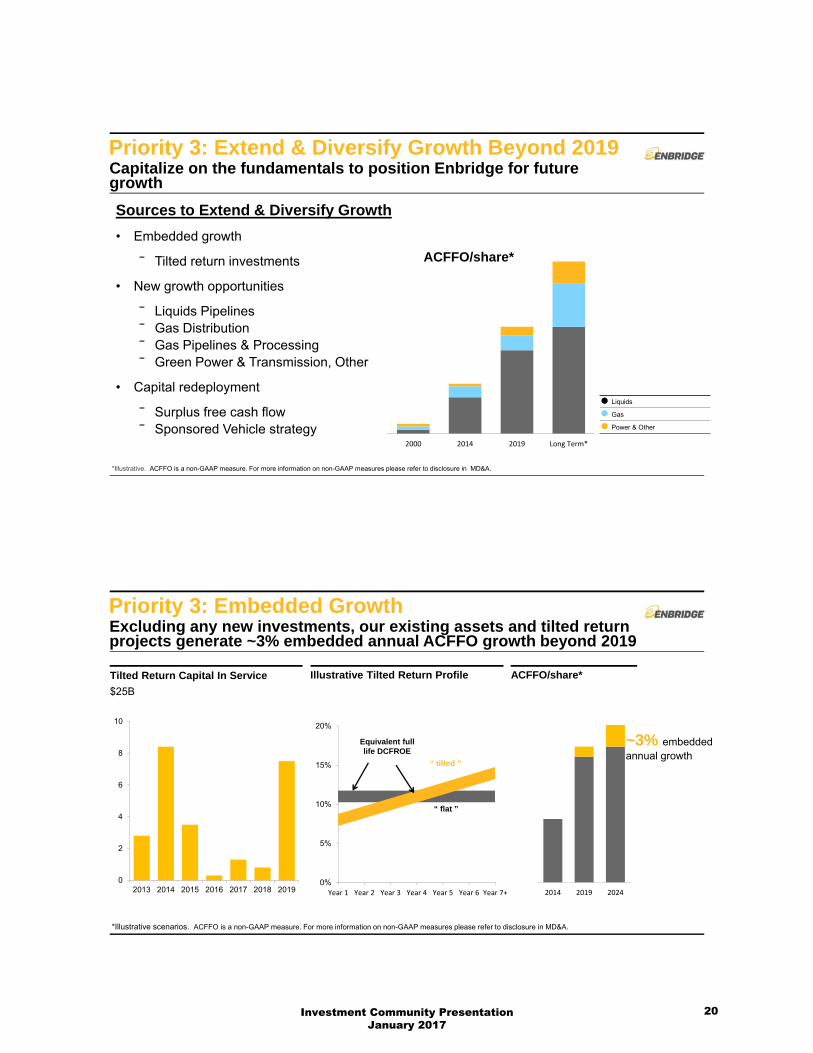
Priority 3: Extend & Diversify Growth Beyond 2019Capitalize on the fundamentals to position Enbridge for future growth
2000 2014 2019 Long Term*
ACFFO/share*
Sources to Extend & Diversify Growth
• Embedded growth
⎯ Tilted return investments
• New growth opportunities
⎯ Liquids Pipelines⎯ Gas Distribution⎯ Gas Pipelines & Processing⎯ Green Power & Transmission, Other
• Capital redeployment
⎯ Surplus free cash flow⎯ Sponsored Vehicle strategy
*Illustrative. ACFFO is a non-GAAP measure. For more information on non-GAAP measures please refer to disclosure in MD&A.
Liquids
Gas
Power & Other
Priority 3: Embedded Growth
*Illustrative scenarios. ACFFO is a non-GAAP measure. For more information on non-GAAP measures please refer to disclosure in MD&A.
Excluding any new investments, our existing assets and tilted return projects generate ~3% embedded annual ACFFO growth beyond 2019
ACFFO/share*Tilted Return Capital In Service
$25B
Illustrative Tilted Return Profile
~3% embedded annual growth
0
2
4
6
8
10
2013 2014 2015 2016 2017 2018 20190%
5%
10%
15%
20%
Year 1 Year 2 Year 3 Year 4 Year 5 Year 6 Year 7+
Equivalent full life DCFROE
“ tilted ”
“ flat ”
2014 2019 2024
Investment Community Presentation January 2017
20

Priority 3: Opportunities to Extend & Diversify Growth Substantial opportunity set drives growth beyond secured outlook
Gas Distribution• Retail, commercial, industrial load growth• System renewal and expansion• Storage and transportation
Gas Pipelines & Processing• Canadian midstream • Offshore USGC• Expand gas footprint
New Platforms• Power generation and transmission• Energy Services• International
Liquids Pipelines• Low-cost mainline expansion programs• Market access expansions/extensions• USGC regional infrastructure
Key investment criteria
• Strategic alignment
• Solid fundamentals
• Strong commercial underpinning
• Premium return to cost of capital
• Readily financeable
Priority 3: Capital RedeploymentGrowing ACFFO will be redeployed based on our capital allocation framework and strength of redeployment opportunities
ACFFO Growth*(secured program)
Capital Allocation Parameters
• Consistent with value proposition
• Strategic alignment
• Dividend payout policy
Redeployment Opportunities
• Organic investments
• Bolt-on asset acquisitions
• Expand strategic footprint
• Return capital to shareholders*ACFFO is a non-GAAP measure. For more information on non-GAAP measures please refer to disclosure in MD&A. Growth rate reflects secured program only; unsecured development pipeline provides further upside.
$3.02
2014 2019
12-14%+ CAGR12-14%+ CAGR
Investment Community Presentation January 2017
21
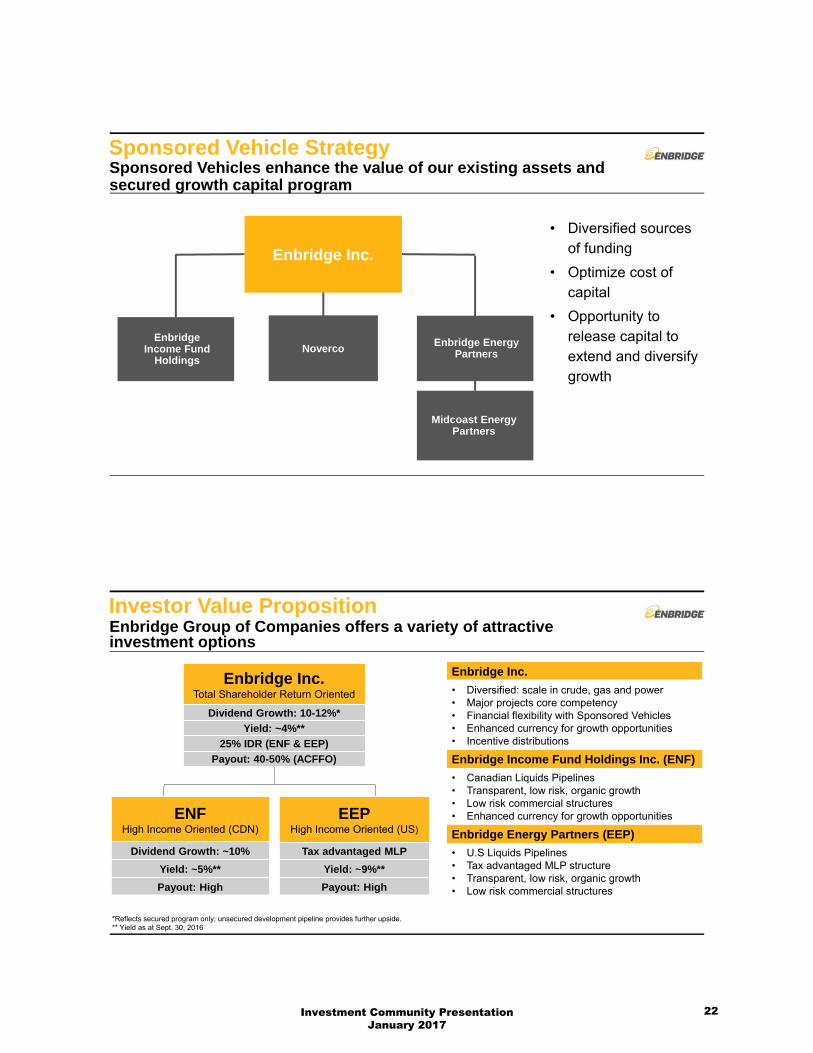
Sponsored Vehicle StrategySponsored Vehicles enhance the value of our existing assets and secured growth capital program
Enbridge Income Fund
HoldingsNoverco
Enbridge EnergyPartners
Enbridge Inc.
Midcoast Energy Partners
• Diversified sources of funding
• Optimize cost of capital
• Opportunity to release capital to extend and diversify growth
Investor Value Proposition
Enbridge Inc.Total Shareholder Return Oriented
Dividend Growth: 10-12%*
Yield: ~4%**
25% IDR (ENF & EEP)
Payout: 40-50% (ACFFO)
ENFHigh Income Oriented (CDN)
Dividend Growth: ~10%
Yield: ~5%**
Payout: High
EEPHigh Income Oriented (US)
Tax advantaged MLP
Yield: ~9%**
Payout: High
Enbridge Group of Companies offers a variety of attractive investment options
Enbridge Inc.
• Diversified: scale in crude, gas and power• Major projects core competency• Financial flexibility with Sponsored Vehicles• Enhanced currency for growth opportunities• Incentive distributions
Enbridge Income Fund Holdings Inc. (ENF)
• Canadian Liquids Pipelines• Transparent, low risk, organic growth• Low risk commercial structures• Enhanced currency for growth opportunities
Enbridge Energy Partners (EEP)
• U.S Liquids Pipelines• Tax advantaged MLP structure• Transparent, low risk, organic growth• Low risk commercial structures
*Reflects secured program only; unsecured development pipeline provides further upside.** Yield as at Sept. 30, 2016
Investment Community Presentation January 2017
22

Liquids Pipelines
Investment Community Presentation January 2017
23

Current System Overview
• Low-cost and stable tolls
• Market access optionality
• Crude slate and capacity optimization
• Unparalleled terminal and operational flexibility
Regional Oil Sands
Mainline System
North Dakota System
Lakehead System
Spearhead/Flanagan South
Investment Community Presentation January 2017
24
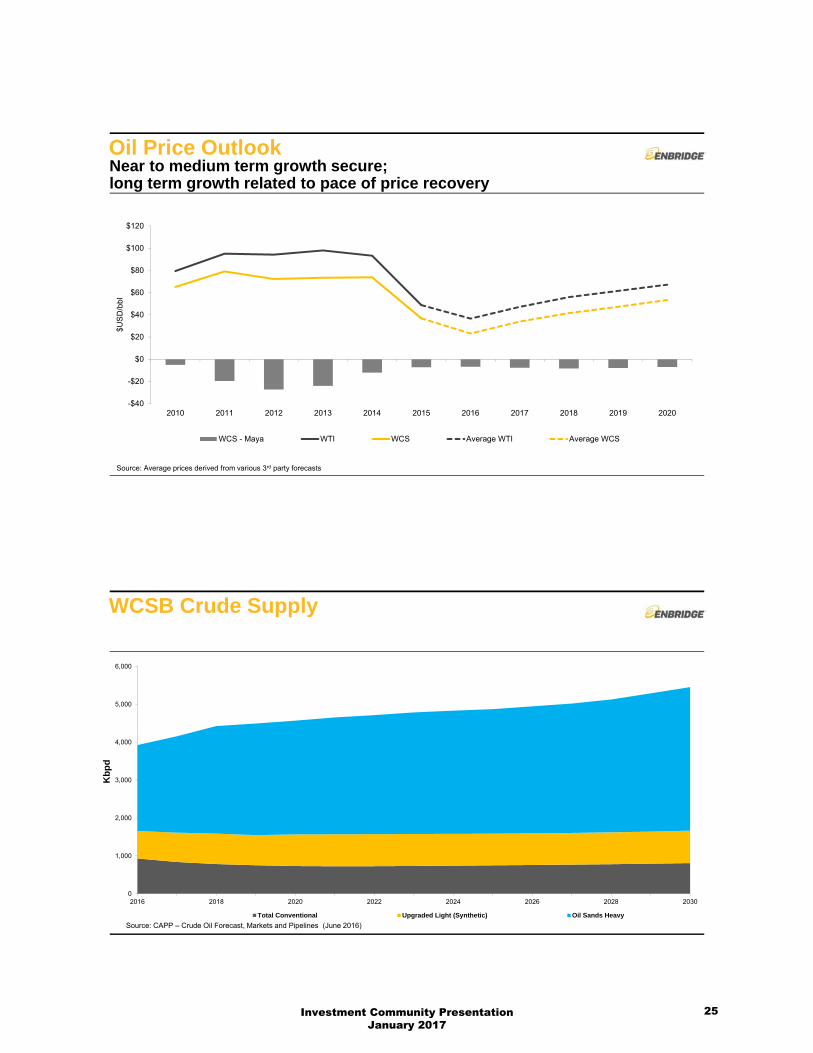
Oil Price OutlookNear to medium term growth secure; long term growth related to pace of price recovery
Source: Average prices derived from various 3rd party forecasts
-$40
-$20
$0
$20
$40
$60
$80
$100
$120
2010 2011 2012 2013 2014 2015 2016 2017 2018 2019 2020
$U
SD
/bb
l
WCS - Maya WTI WCS Average WTI Average WCS
WCSB Crude Supply
Source: CAPP – Crude Oil Forecast, Markets and Pipelines (June 2016)
0
1,000
2,000
3,000
4,000
5,000
6,000
2016 2018 2020 2022 2024 2026 2028 2030
Kb
pd
Total Conventional Upgraded Light (Synthetic) Oil Sands Heavy
Investment Community Presentation January 2017
25

Oil Sands Blended Supply OutlookHighly transparent supply outlook drives growth
“Syncrude production averaged 85,000barrels per day (Imperial’s share), the second highest quarterly production inits nearly 40-year history, reflecting ongoing efforts to improve the reliabilityof operations.”
Imperial Oil 3nd Quarter Results Release Oct 28, 2016
“The Sunrise Energy Project has resumed itsramp up following the restart of operations after the Fort McMurray wildfires.”
Husky Energy 3th Quarter Results Release Oct 27, 2016
“Surmont fully recovered from wildfire impacts and continues to ramp upwith gross production exceeding 100 MBOED in mid-October.”
ConocoPhillips 3rd Quarter 2016 Results Oct 27, 2016
“The Fort Hills project is more than 70% complete at the end of the thirdquarter of 2016, with the majority of the remaining work based in Alberta.”
Suncor Energy Inc. 3rd Quarter 2016 Results Oct 26, 2016
1Source: CAPP Crude Oil Forecast, Markets and Transportation (June 2015 Operating & In Construction)
“Current production volumes at Horizon are approximately175,000 bbl/d as the Phase 2B expansion start-up was executed in earlyOctober, slightly ahead of the targeted start-up date.”
Husky Energy 3nd Quarter Results Release Nov 3, 2016
0
100
200
300
400
500
600
700
2017 2018 2019 2020
Incremental WCSB Blended HeavySupply Growth
(cumulative kbpd)
Takeaway Capacity vs. Supply Outlook
Other Existing Pipelines
Western Canadian Refineries
Source: CAPP – Crude Oil Forecast, Markets and Pipelines (June 2016)
Near term optimization: +60 – 80 kbpd
0
1
2
3
4
5
6
2016 2017 2018 2019 2020 2021 2022 2023 2024 2025
Takeaway Capacity vs. Supply Outlook(mmbpd)
CAPP June 2016
Enbridge
Other Existing Pipelines
Western Canadian Refineries
Investment Community Presentation January 2017
26
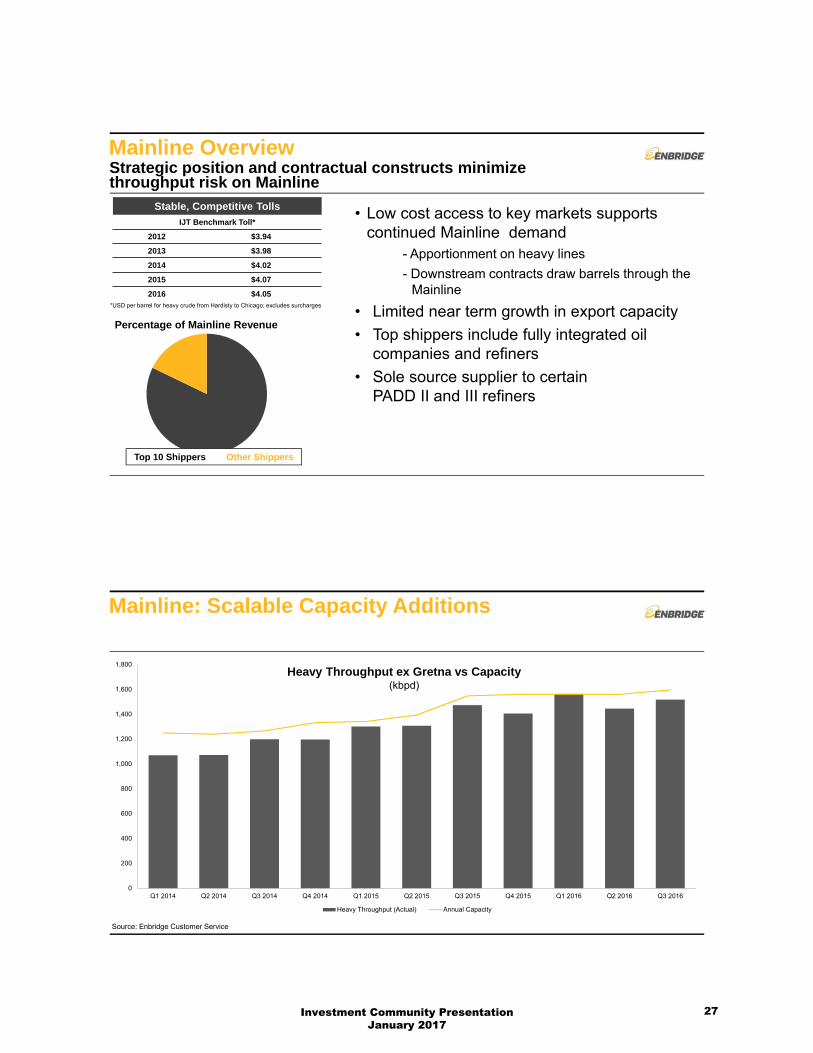
Mainline OverviewStrategic position and contractual constructs minimize throughput risk on Mainline
• Low cost access to key markets supports continued Mainline demand
- Apportionment on heavy lines
- Downstream contracts draw barrels through the Mainline
• Limited near term growth in export capacity
• Top shippers include fully integrated oil companies and refiners
• Sole source supplier to certain PADD II and III refiners
Stable, Competitive Tolls
IJT Benchmark Toll*
2012 $3.94
2013 $3.98
2014 $4.02
2015 $4.07
2016 $4.05
Top 10 Shippers Other Shippers
Percentage of Mainline Revenue
*USD per barrel for heavy crude from Hardisty to Chicago; excludes surcharges
Mainline: Scalable Capacity Additions
Source: Enbridge Customer Service
Heavy Throughput ex Gretna vs Capacity(kbpd)
0
200
400
600
800
1,000
1,200
1,400
1,600
1,800
Q1 2014 Q2 2014 Q3 2014 Q4 2014 Q1 2015 Q2 2015 Q3 2015 Q4 2015 Q1 2016 Q2 2016 Q3 2016
Heavy Throughput (Actual) Annual Capacity
Investment Community Presentation January 2017
27
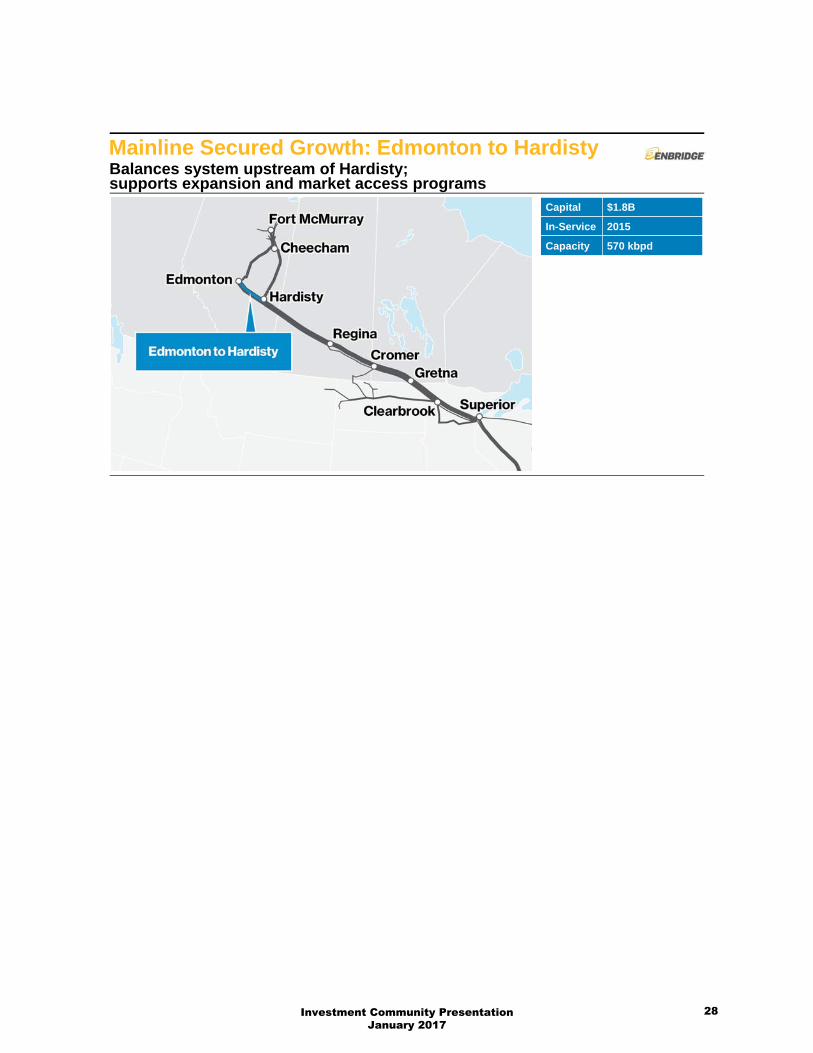
Mainline Secured Growth: Edmonton to HardistyBalances system upstream of Hardisty;supports expansion and market access programs
Capital $1.8B
In-Service 2015
Capacity 570 kbpd
Investment Community Presentation January 2017
28

Mainline Secured Growth: Line 3 Replacement
Capital $7.5B
In-Service Early 2019
CapacityRestore capacity to 760 kbpd
Project details• Replace all remaining segments of Line 3 between Hardisty and Superior• Restores line capacity to 760 kbpd• Expected in-service date: Early 2019• Shipper support (CAPP/RSG)• 15 year toll surcharge
Investment attributes• Solid return on significant incremental investment• Supports secured capital ACFFO growth profile• Avoids $1.1 billion in maintenance capital through 2017 and mounting thereafter
Benefits• Supports our #1 priority: safety and operational reliability• Provides high reliability and assurance to key markets• Reduced scheduling impacts of future maintenance• Increased scheduling flexibility• Improved line balancing
Mainline Secured Growth: Line 3 Replacement
Investment Community Presentation January 2017
29
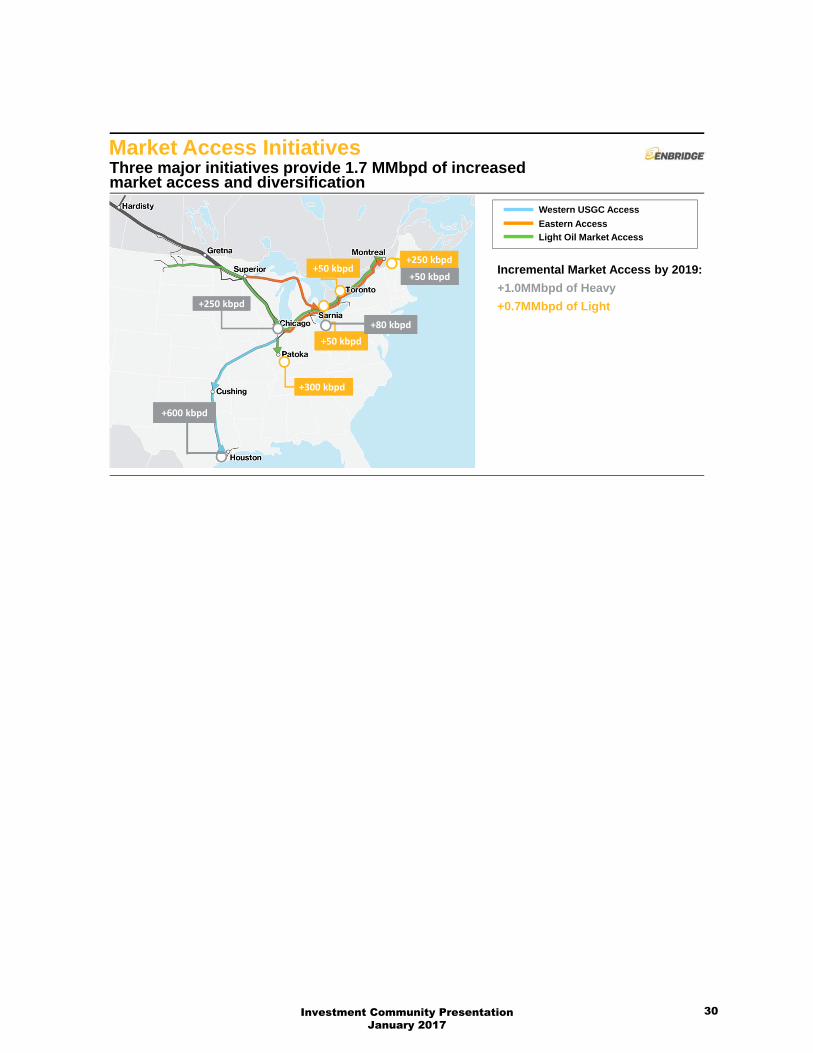
Market Access InitiativesThree major initiatives provide 1.7 MMbpd of increased market access and diversification
Eastern Access
Western USGC Access
Light Oil Market Access
Incremental Market Access by 2019:
+1.0MMbpd of Heavy
+0.7MMbpd of Light
+600 kbpd+600 kbpd
+300 kbpd
+250 kbpd+250 kbpd
+50 kbpd+50 kbpd+250 kbpd
+50 kbpd
+250 kbpd
+50 kbpd
+50 kbpd+50 kbpd
+80 kbpd+80 kbpd
Investment Community Presentation January 2017
30

Associated Mainline Expansions• Alberta Clipper to 800 kbpd • Southern Access to 560 kbpd
Flanagan South Pipeline • $2.9B capital project• In service: Q4 2014• Long term commercial agreements
(10 – 20 year terms)• Initial capacity: 600 kbpd, expandable to 800 kbpd
Seaway Pipeline Acquisition & Reversal • $1.2B purchase of 50% interest from
ConocoPhillips• $0.1B reversal and lateral to ECHO Terminal in
Houston completed Q2 2012• $0.1B capacity expansion completed in Q1 2013• 50/50 joint venture with Enterprise Products
Partners, L.P.
Seaway Pipeline Twin & Lateral • $1.2B capital project• In service: Q4 2014• Long term commercial agreements
(5 – 20 year terms)• Initial capacity: 450 kbpd, expandable to 600 kbpd
Market Access: Western US Gulf Coast Access
Market Access: Eastern AccessLine 9A Reversal • Reversal to access refineries in Ontario• Capacity: 240 kbpd• In service: 2013Line 9B Reversal • $0.7B capital project• Reversal to access refineries in Ontario
and Quebec• Capacity: 240 kbpd• In service: Q4 2015Line 5 Expansion • Capacity: 50 kbpd into Sarnia• In service: 2013Spearhead North Expansion • Capacity: 105 kbpd• In service: 2013Line 6B Replacement • Capacity: Increase of 260 kbpd into Sarnia
(Total line capacity of 500kbpd)• In service: 2014Toledo • Capacity: 80 kbpd• In Service: 2013
Investment Community Presentation January 2017
31

Market Access: Light Oil Market Access
Still need an update
Associated Mainline Expansions⎯ Canadian Mainline System Terminal Flexibility
and Connectivity ⎯ Southern Access Expansion
⎯ 560 kbpd to 950 kbpd: In service Q3 2015 ⎯ 950 kbpd to 1,200 kbpd: In service early 2019
Line 9 Capacity Expansion ⎯ $0.1B capital project⎯ Capacity: + 60 kbpd⎯ In service: Q4 2015
Line 6B Expansion (Pump stations and upgrades) ⎯ $0.3B capital project⎯ Capacity: +70 kbpd⎯ In service: 1H 2016
Southern Access Extension ⎯ $0.6B capital project (Enbridge cost)⎯ Capacity: 300 kbpd⎯ In service: December 2015⎯ Marathon named anchor shipper and equity partner, will fund 35%
of the project ($0.3B)
Line 62 Twin (Line 78 Chicago Connectivity)(36” pipeline from Flanagan to Griffith) ⎯ $0.5B capital project⎯ Capacity: 570 kbpd⎯ In service: Q4 2015
Market Access: Light Oil Market Access
Investment Community Presentation January 2017
32
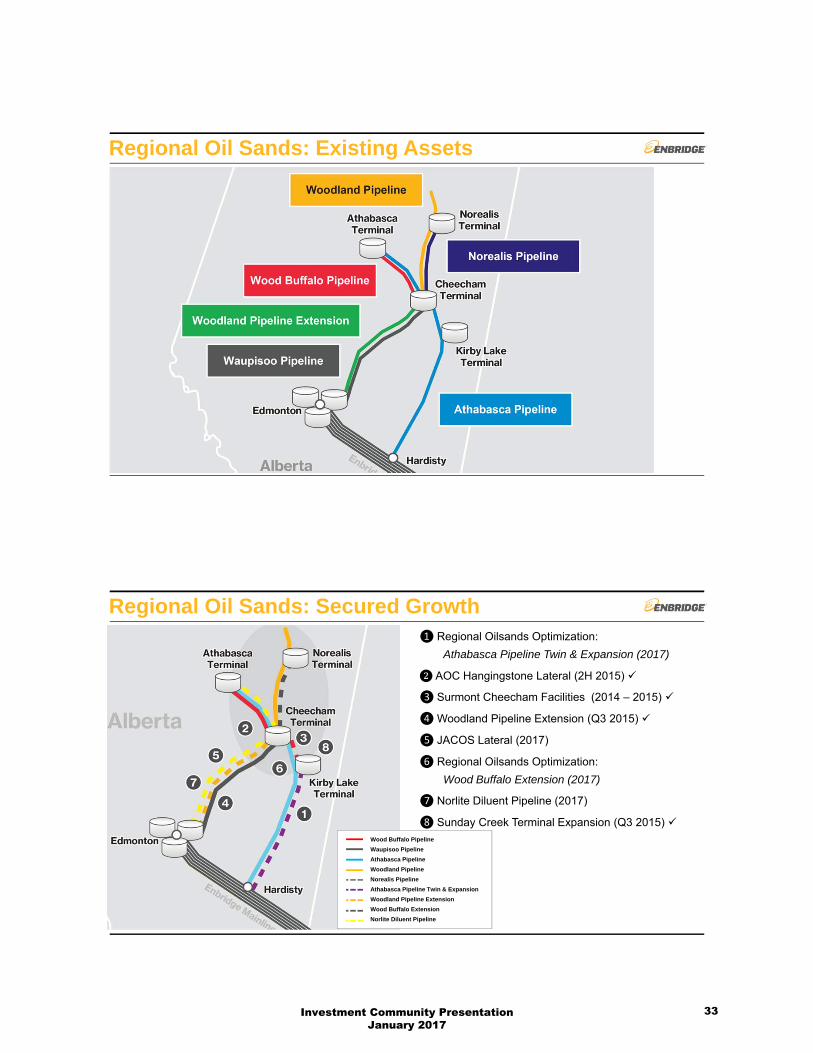
Regional Oil Sands: Existing Assets
❶ Regional Oilsands Optimization:
Athabasca Pipeline Twin & Expansion (2017)
❷ AOC Hangingstone Lateral (2H 2015)
❸ Surmont Cheecham Facilities (2014 – 2015)
❹ Woodland Pipeline Extension (Q3 2015)
❺ JACOS Lateral (2017)
❻ Regional Oilsands Optimization:
Wood Buffalo Extension (2017)
❼ Norlite Diluent Pipeline (2017)
❽ Sunday Creek Terminal Expansion (Q3 2015)
Regional Oil Sands: Secured Growth
Wood Buffalo Pipeline
Waupisoo Pipeline
Athabasca Pipeline
Woodland Pipeline
Norealis Pipeline
Athabasca Pipeline Twin & Expansion
Woodland Pipeline Extension
Wood Buffalo Extension
Norlite Diluent Pipeline
Investment Community Presentation January 2017
33
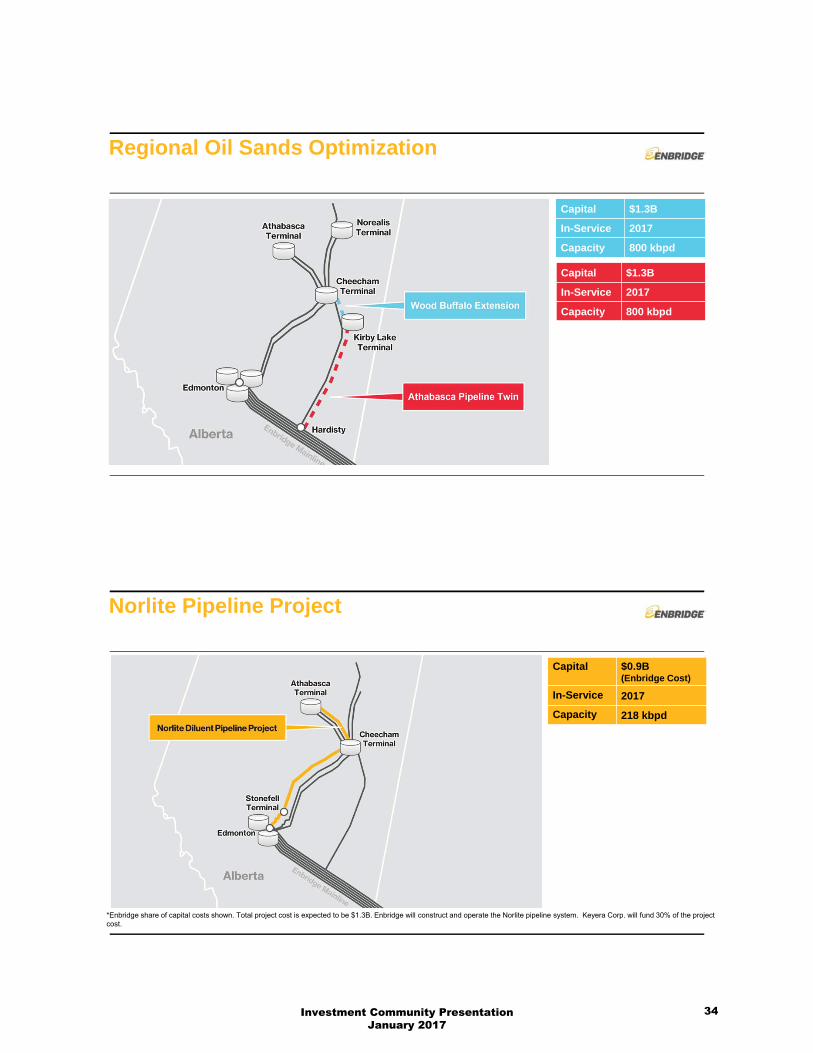
Regional Oil Sands Optimization
Capital $1.3B
In-Service 2017
Capacity 800 kbpd
Capital $1.3B
In-Service 2017
Capacity 800 kbpd
Norlite Pipeline Project
Capital $0.9B(Enbridge Cost)
In-Service 2017
Capacity 218 kbpd
*Enbridge share of capital costs shown. Total project cost is expected to be $1.3B. Enbridge will construct and operate the Norlite pipeline system. Keyera Corp. will fund 30% of the project cost.
Investment Community Presentation January 2017
34
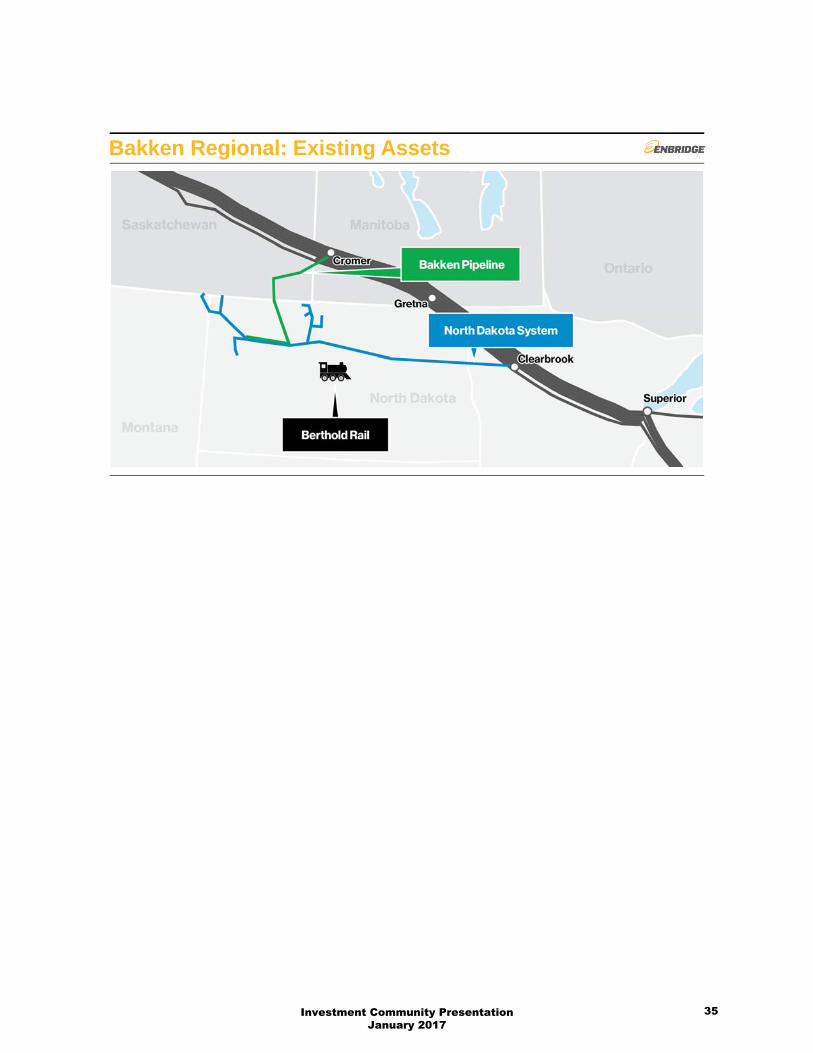
Bakken Regional: Existing Assets
*
Investment Community Presentation January 2017
35

Acquired Interest in Bakken Pipeline SystemSystem extends from the Bakken to USGC
Project Details
Assets:Bakken Pipeline System consists of Dakota Access Pipeline (DAPL) and Energy Transfer Crude Oil Pipeline (ETCO)
Capital: $1.5B
In-Service: 1H 2017
Capacity: ~470kbpd expandable to 570kbpd
Effective
Ownership: 27.6%
Expected Close: TBD
EEP MPC ETP SXL
Enbridge/Marathon Joint Venture
Bakken Holdings Company
Bakken Pipeline Investments
PSX
DAPL ETCO
75% 25% 60% 40%
49% 51%
75% 75%
25% 25%
PSX
Bakken Pipeline System Acquisition anticipated to close 2H 2016
Strategic Fit
• Offers customers competitive tolls between the Bakken and USGC
• Joint toll opportunity with Enbridge mainline
• Highly contracted: secured by long-term take-or-pay commitments
• High credit quality counterparties: >90% investment grade
• Expansion opportunities
Project Details
Capital: US $1.5B
In-Service: 1H 2017
Capacity: ~470 kbpd expandable to 570 kbpd
Effective
Ownership: 27.6%
Expected Close: TBD
Investment Community Presentation January 2017
36
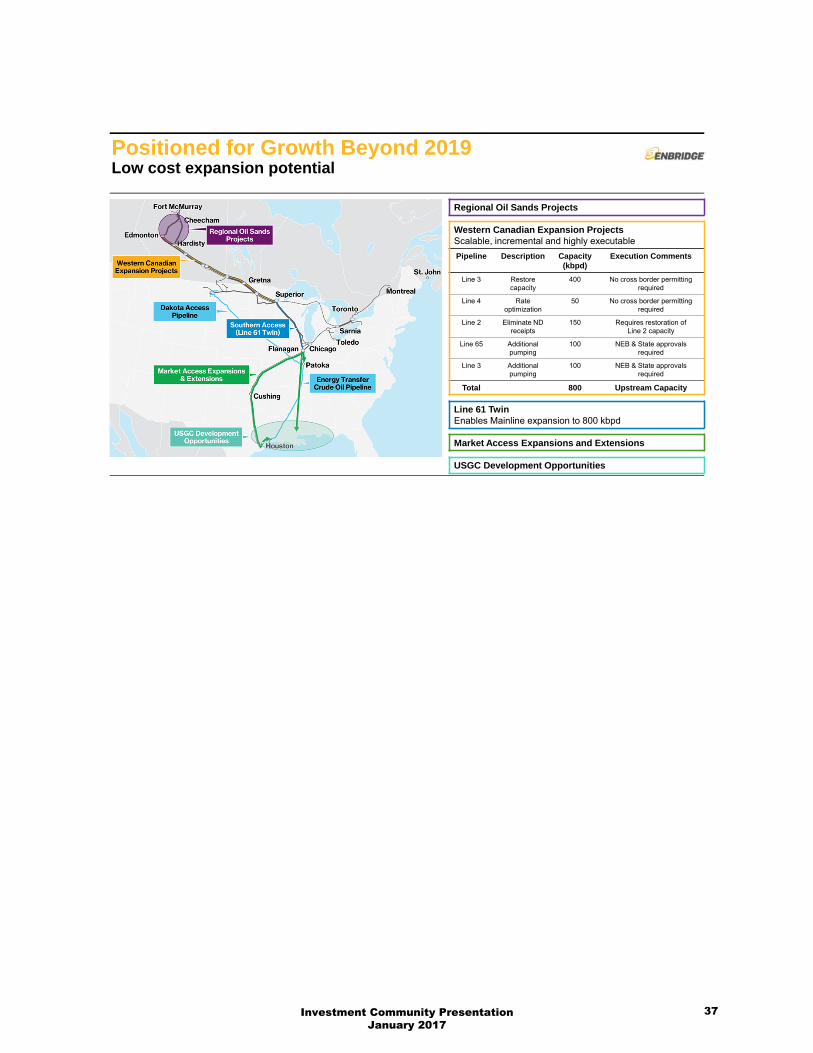
Regional Oil Sands Projects
Western Canadian Expansion ProjectsScalable, incremental and highly executable
Pipeline Description Capacity (kbpd)
Execution Comments
Line 3 Restore capacity
400 No cross border permitting required
Line 4 Rate optimization
50 No cross border permitting required
Line 2 Eliminate ND receipts
150 Requires restoration of Line 2 capacity
Line 65 Additionalpumping
100 NEB & State approvals required
Line 3 Additionalpumping
100 NEB & State approvals required
Total 800 Upstream Capacity
Line 61 TwinEnables Mainline expansion to 800 kbpd
Market Access Expansions and Extensions
USGC Development Opportunities
Positioned for Growth Beyond 2019Low cost expansion potential
Investment Community Presentation January 2017
37

Positioning for Growth Beyond 2019: Line 61 Twin
• Western Canadian Expansion will create a bottleneck at Superior
• Line 61 Twin relieves bottleneck and positions for market access growth
• Coordinating early development activities
Project Details
Scope Up to 42” twin of existing Line 61
Capital $3.5B - $4B
In-Service Date
TBD
Capacity Enables full Mainline expansion by 800 kbpd
Positioning for Growth Beyond 2019: Market Access
• Participation in ETCO can provide full path solution for Canadian producers to eastern USGC
• Positioned for a range of expansions and opportunities‒ Seaway/Flanagan South
‒ Southern Access Extension
‒ Eastern Gulf Coast Access
• Stable, competitive toll outlook
• Strong USGC market provides attractive netbacks
Investment Community Presentation January 2017
38
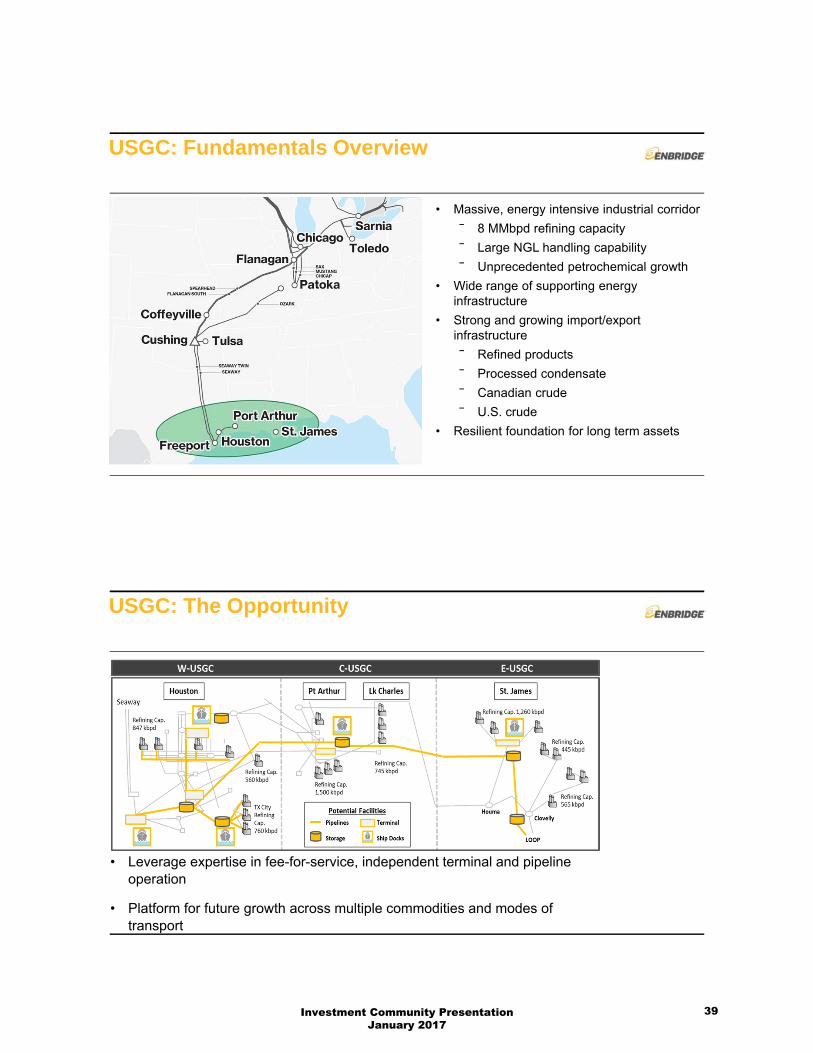
USGC: Fundamentals Overview
• Massive, energy intensive industrial corridor
⎯ 8 MMbpd refining capacity
⎯ Large NGL handling capability
⎯ Unprecedented petrochemical growth
• Wide range of supporting energy infrastructure
• Strong and growing import/export infrastructure
⎯ Refined products
⎯ Processed condensate
⎯ Canadian crude
⎯ U.S. crude
• Resilient foundation for long term assets
USGC: The Opportunity
• Leverage expertise in fee-for-service, independent terminal and pipeline operation
• Platform for future growth across multiple commodities and modes of transport
Investment Community Presentation January 2017
39

Investment Community Presentation January 2017
40

Gas Pipelines& Processing
Investment Community PresentationJanuary 2017
41

OverviewCurrent Position
• Strong regional positions
• Highly contracted
• Industry leading operations and integrity performance
Strategic Objectives
• Grow current footprint
• Build optionality
• Establish demand pull positions
Canadian Midstream
Alliance
US Gathering & Processing
Offshore
Aux Sable
Vector
Investment Community Presentation January 2017
42

Natural Gas Demand Growth
Source: IEA 2014 World Energy Outlook; ENB Gas & NGL Fundamentals
0
100
200
300
400
500
2012 2020 2025
Asia & Asia Oceania Middle East & Africa E. Europe/Eurasia
Europe Americas
Global natural gas demand (Bcf/d)
North American natural gas demand(Bcf/d)
0
20
40
60
80
100
120
140
2014 2025
Sources of demand Bcf/d
Residential/Commercial +1
Industrial +8
Coal/ Nuclear Retirements
+7
Power Demand +5
LNG +13
Mexico Exports +2
Natural Gas Supply Growth
0
2
4
6
8
10
12
14
16
18
20
2014 2016 2018 2020 2022 2024
Horn River Duvernay Montney Conventional
Source: Wood Mackenzie; ENB Gas & NGL Fundamentals
40
50
60
70
80
90
100
110
120
2014 2016 2018 2020 2022 2024
U.S. gas production(Bcf/d)
WCSB gas production(Bcf/d)
Investment Community Presentation January 2017
43
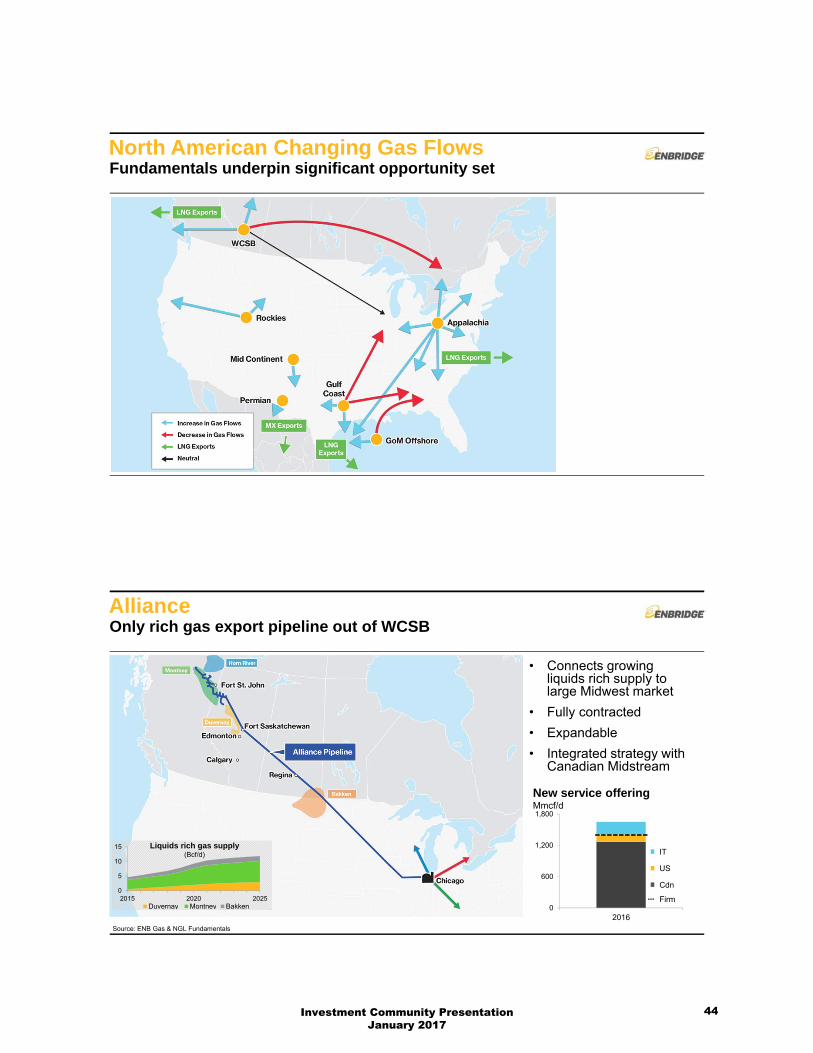
North American Changing Gas FlowsFundamentals underpin significant opportunity set
AllianceOnly rich gas export pipeline out of WCSB
• Connects growing liquids rich supply to large Midwest market
• Fully contracted
• Expandable
• Integrated strategy with Canadian Midstream
0
600
1,200
1,800
2016
New service offeringMmcf/d
IT
US
Cdn
Firm0
5
10
15
2015 2020 2025Duvernay Montney Bakken
Liquids rich gas supply(Bcf/d)
Source: ENB Gas & NGL Fundamentals
Investment Community Presentation January 2017
44
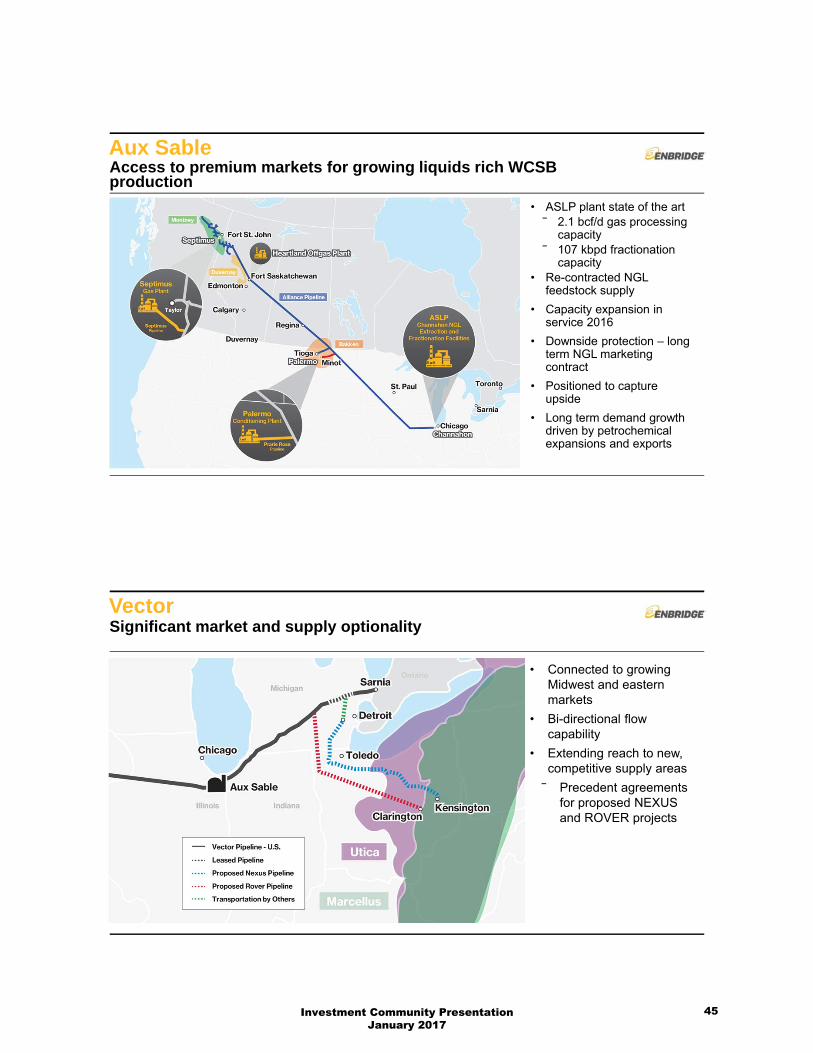
Aux SableAccess to premium markets for growing liquids rich WCSB production
• ASLP plant state of the art⎯ 2.1 bcf/d gas processing
capacity⎯ 107 kbpd fractionation
capacity• Re-contracted NGL
feedstock supply
• Capacity expansion in service 2016
• Downside protection – long term NGL marketing contract
• Positioned to capture upside
• Long term demand growth driven by petrochemical expansions and exports
VectorSignificant market and supply optionality
• Connected to growing Midwest and eastern markets
• Bi-directional flow capability
• Extending reach to new, competitive supply areas
⎯ Precedent agreements for proposed NEXUS and ROVER projects
Investment Community Presentation January 2017
45

US Gathering & ProcessingAsset optimization provides foundation for future growth
• Realign cost structure
• Rationalize portfolio
• Evolve commercial constructs to more fee based
• Extend reach in prolific and economic basins
• Expand service offerings
Opportunities in Growing Supply BasinsSignificant pipeline opportunities as growing supply expected to outpace regional demand
0
10
20
30
40
Demand Supply Demand Supply
Northeast Gas Supply & Regional Demand (Bcf/d)
2015 2025
MWMW
MA
MANE
NE
Utica Marcellus
Investment Community Presentation January 2017
46

OffshoreProven execution capabilities provide competitive advantage
• Robust long term outlook for deep water developments
• Commercial constructs aligned with reliable business model
• Recent project selections:⎯ Heidelberg⎯ Stampede⎯ Under negotiation: $0.6B
development
Canadian MidstreamFoundational assets provide optionality for large-scale development
• Develop customer gathering, processing and market access
• Strong producer interest in new 300 kbpd NGL pipeline & fractionator
• Limited Alberta C2/C3 market provides opportunities for NGL aggregation and export
Investment Community Presentation January 2017
47
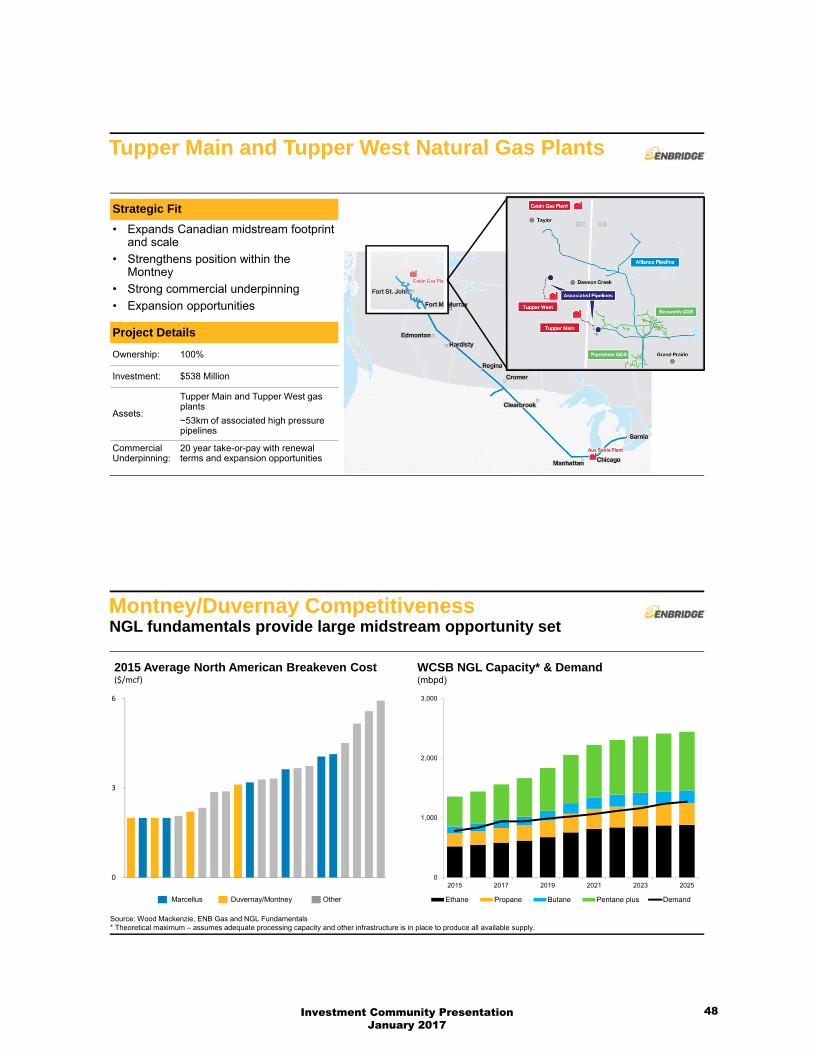
Tupper Main and Tupper West Natural Gas Plants
Strategic Fit
• Expands Canadian midstream footprint and scale
• Strengthens position within the Montney
• Strong commercial underpinning
• Expansion opportunities
Project Details
Ownership: 100%
Investment: $538 Million
Assets:
Tupper Main and Tupper West gas plants
~53km of associated high pressure pipelines
Commercial Underpinning:
20 year take-or-pay with renewal terms and expansion opportunities
Montney/Duvernay CompetitivenessNGL fundamentals provide large midstream opportunity set
0
3
6
Marcellus
2015 Average North American Breakeven Cost($/mcf)
0
1,000
2,000
3,000
2015 2017 2019 2021 2023 2025
Ethane Propane Butane Pentane plus Demand
WCSB NGL Capacity* & Demand(mbpd)
Duvernay/Montney Other
Source: Wood Mackenzie, ENB Gas and NGL Fundamentals* Theoretical maximum – assumes adequate processing capacity and other infrastructure is in place to produce all available supply.
Investment Community Presentation January 2017
48
Gas Distribution
Investment Community Presentation January 2017
49

Gas Distribution FootprintLargest gas distribution franchise in Canada;Serving over 2 million customers
Strategic PositioningStable low-risk business delivers strong risk-adjusted returns and foundation for growth
0%
6%
12%
2008 2009 2010 2011 2012 2013 2014 2015
Formula ROE ROE Premium
0
1
2
3
4
5
2008 2009 2010 2011 2012 2013 2014 2015
• Stable, predictable earnings and cash flow
• Low risk commercial model⎯ Regulated return
⎯ No direct commodity exposure
• $3 billion capital investment approved under current model⎯ Largest Canadian franchise
⎯ Strong population growth
• Foundational asset base supports broader energy strategy
Historical ROE Historical Rate Base$Billion
Investment Community Presentation January 2017
50
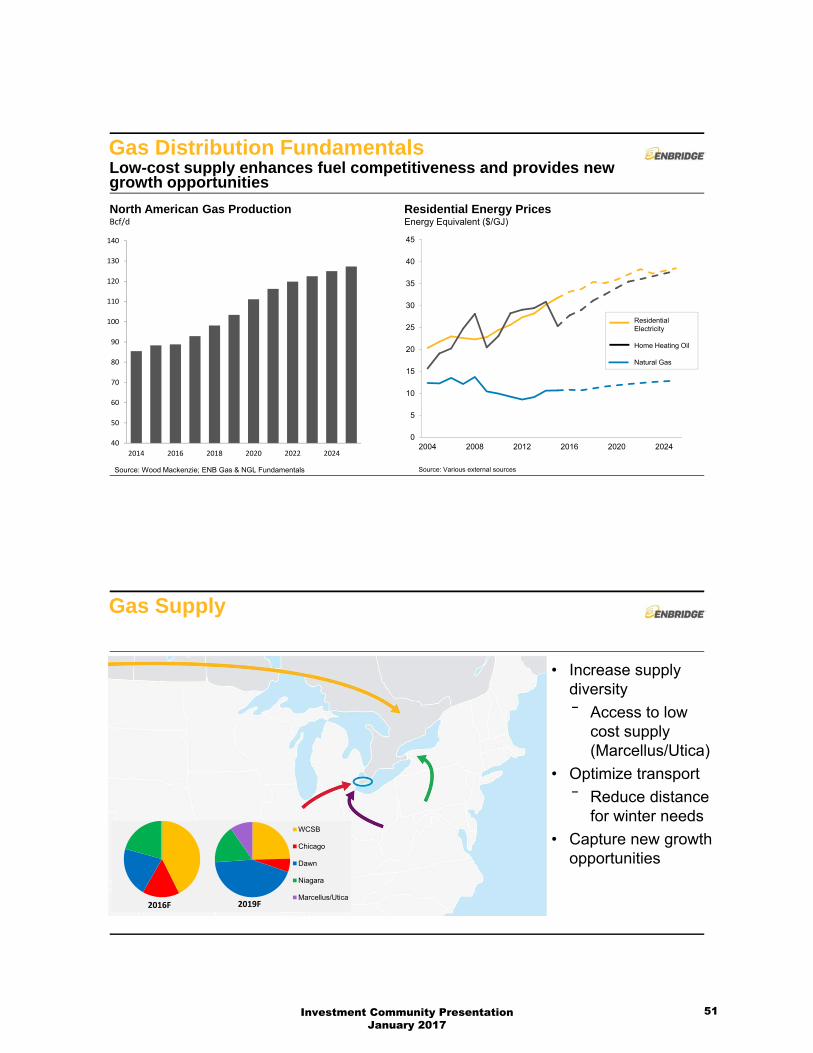
Gas Distribution FundamentalsLow-cost supply enhances fuel competitiveness and provides new growth opportunities
0
5
10
15
20
25
30
35
40
45
2004 2008 2012 2016 2020 202440
50
60
70
80
90
100
110
120
130
140
2014 2016 2018 2020 2022 2024
Source: Wood Mackenzie; ENB Gas & NGL Fundamentals Source: Various external sources
Residential Electricity
Home Heating Oil
Natural Gas
North American Gas ProductionBcf/d
Residential Energy PricesEnergy Equivalent ($/GJ)
Gas Supply
WCSB
Chicago
Dawn
Niagara
Marcellus/Utica2019F2016F
• Increase supply diversity
⎯ Access to low cost supply (Marcellus/Utica)
• Optimize transport
⎯ Reduce distance for winter needs
• Capture new growth opportunities
Investment Community Presentation January 2017
51

Custom Incentive RegulationInnovative model provides strong risk-adjusted returns with $3B approved capital investment
0%
2%
4%
6%
8%
10%
12%
2015 2016 2018
ROE Premium
Formula ROE
Board Approved Forecast
Current ROE Forecasts2015 - 2018• Annual ROE reset
protects against rising interest rates
• Upside sharing
• $3B approved capital investment required to meet customer needs
• No direct commodity exposure
Core Customer Growth
0
400
800
1,200
201
4
201
5
201
6
201
7
201
8
201
9
1.5
2.0
2.5
201
0
201
1
201
2
201
3
201
4
201
5
201
6
201
7
201
8
201
9
ForecastActual
• One of the fastest growing natural gas distribution companies in North America
• Consistently add 35k+ customers per year
• Ontario government supports rural community expansion
Average Number of Customers$ Million
Forecast Capital$ Million
Investment Community Presentation January 2017
52

System Renewal and Expansion: GTA ProjectLargest single capital investment in Gas Distribution history
• Increases capacity and reliability in the GTA and downtown Toronto
• Leverages additional supply and basin optionality
• Serves growing customer base through additional infrastructure
Project Details
Scope: Eastern Segment:23 km of 36” pipeWestern Segment:27 km of 42” pipe
In-Service Date: Q1 2016
Total Cost
$900M
Gas Storage OpportunitiesStorage investment reduces gas price volatility
• Storage is fundamental to support reliable, low cost supply
• Infrastructure renewal opportunities
⎯ Coincides with changing supply chain patterns
• Opportunity to position storage investments for long term growth
Investment Community Presentation January 2017
53
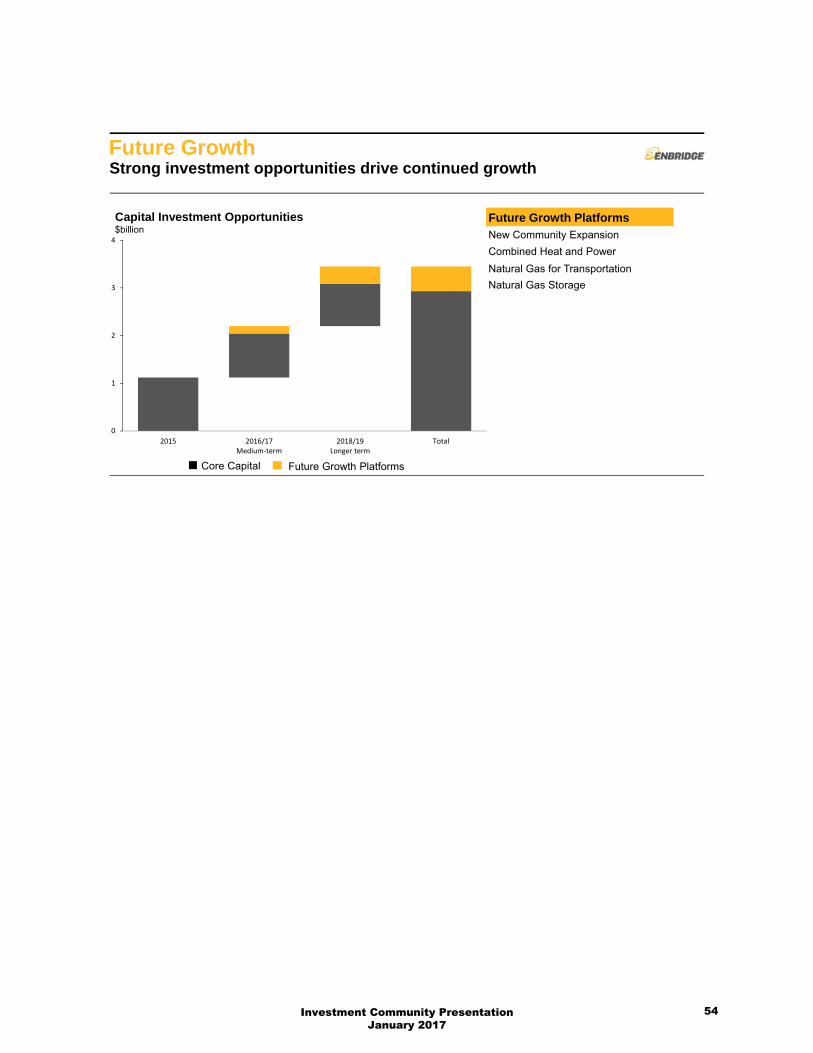
Future GrowthStrong investment opportunities drive continued growth
0
1
2
3
4
2015 2016/17Medium‐term
2018/19Longer term
Total
Future Growth PlatformsNew Community Expansion
Combined Heat and Power
Natural Gas for Transportation
Natural Gas Storage
Core Capital Future Growth Platforms
Capital Investment Opportunities$billion
Investment Community Presentation January 2017
54

Power, International and Energy Services
Investment Community PresentationJanuary 2017
55

Power Generation & Transmission Footprint
2010 2015 2019e
2010 2015 2019e
1,776
Net Generating Capacity MWs
Total Investment $ billion
4.6
0
50
100
2014-20 2021-25
Power FundamentalsAttractive fundamentals support accelerated growth
0
250
500
North America Europe
Gas Other Renewables
Forecast Generation Growth - 20251
GWsNorth American Transmission Investment3
US$ billions
1Source: International Energy Agency World Energy Outlook 20142Source: Energy International Administration (U.S.); Siemens (Europe). Europe combines data for UK and Germany.3Source: International Energy Agency
Investment Community Presentation January 2017
56

-
500
1,000
1,500
Current PositioningOne of Canada’s largest renewable power producers; opportunity for growth in U.S.
-
4,000
8,000
12,000
ENB
ENB
Top Wind & Solar GeneratorsCanada (MWs)
…
Top Wind & Solar GeneratorsNorth America (MWs)
Accelerated GrowthIntegrated model will help extend and accelerate growth
Operating Model Primarily outsourced Operator
Project Development External Internal & External
Portfolio Mix Primarily wind & solar Wind, solar, hydro, gas fired, transmission
Geographic Location North America North America & Europe
Investment Community Presentation January 2017
57
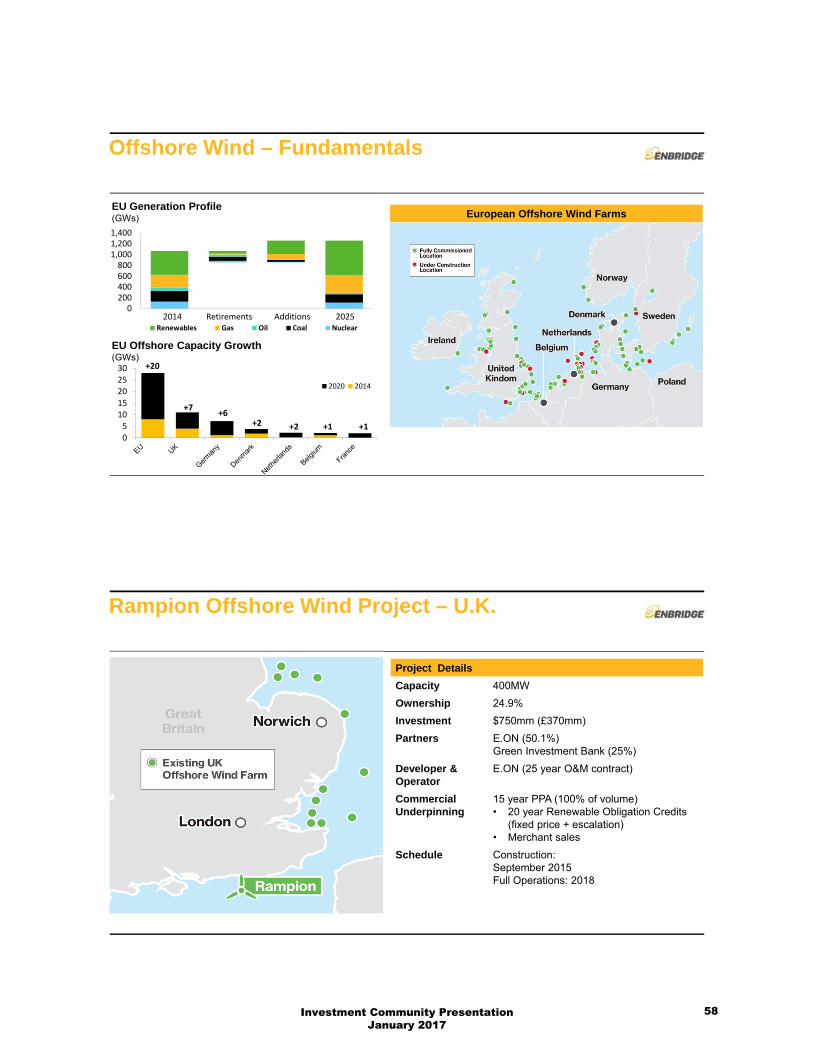
051015202530
2020 2014
Offshore Wind – Fundamentals
EU Offshore Capacity Growth(GWs)
0200400600800
1,0001,2001,400
Renewables Gas Oil Coal Nuclear
EU Generation Profile(GWs)
2014 2025Retirements Additions
European Offshore Wind Farms
+20
+7+6
+2 +2 +1 +1
Rampion Offshore Wind Project – U.K.
Project Details
Capacity 400MW
Ownership 24.9%
Investment $750mm (£370mm)
Partners E.ON (50.1%)Green Investment Bank (25%)
Developer & Operator
E.ON (25 year O&M contract)
Commercial Underpinning
15 year PPA (100% of volume) • 20 year Renewable Obligation Credits
(fixed price + escalation)• Merchant sales
Schedule Construction:September 2015Full Operations: 2018
Investment Community Presentation January 2017
58

Investment in Offshore Wind DeveloperÉolien Maritime France (“EMF”)
Project MWAnticipated
ConstructionExpected
ISD
Eoliennes Offshore des HautesFalaises
498 2017 2020
Eoliennes Offshore du Calvados 450 2018 2021
Parc du Banc de Guerande 480 2019 2022
• Investment Summary:‒ 50% co-development
‒ 3 advanced stage projects (1,400 MWs)
‒ 20 year fixed price PPA (offtake: EDF)
‒ Advanced permitting, capital estimate
• Value Proposition:‒ Large investment opportunity ($4.5B)
‒ Individual project sanctioning
‒ Attractive returns
‒ Strong partner
New Creek Wind Project
Project Details
Capacity 102MW
Ownership 100%
Investment $0.1 billion
Developer EverPower Wind Holdings
Operator Gamesa/Enbridge
Commercial Underpinning
12 year fixed price agreement Merchant sales
Schedule Construction: March 2016Full Operations: December 2016
Investment Community Presentation January 2017
59

Chapman Ranch Wind Project
Project DetailsCapacity 249 MW
Ownership 100%
Investment $0.4 billion
Developer Apex Clean Energy
Operator Acciona/Enbridge
Commercial Underpinning 12 year fixed volume agreement
Schedule Construction: September 2016Full Operations: Q3 2017
Disciplined Investment CriteriaPower investments align with reliable business model
Liquids Projects Power Projects
Strong market fundamentals Attractive low risk returns Low capital cost risk Strong commercial underpinnings No commodity price risk
Investment Community Presentation January 2017
60

Power Opportunity SetActively pursuing over 2,000 MWs of attractive projects
0
500
1,000
1,500
2,000
2,500
2016Near Term
2017/2018Medium Term
2019Longer Term
Total
Growth Opportunities(MWs)
International Focus
Investment Criteria
Australia
• Stable political environment and hedgeable currency
• Significant infrastructure deficit
Colombia
• Favourable business environment
• Operations history (OCENSA)
Areas of Focus
Investment Community Presentation January 2017
61
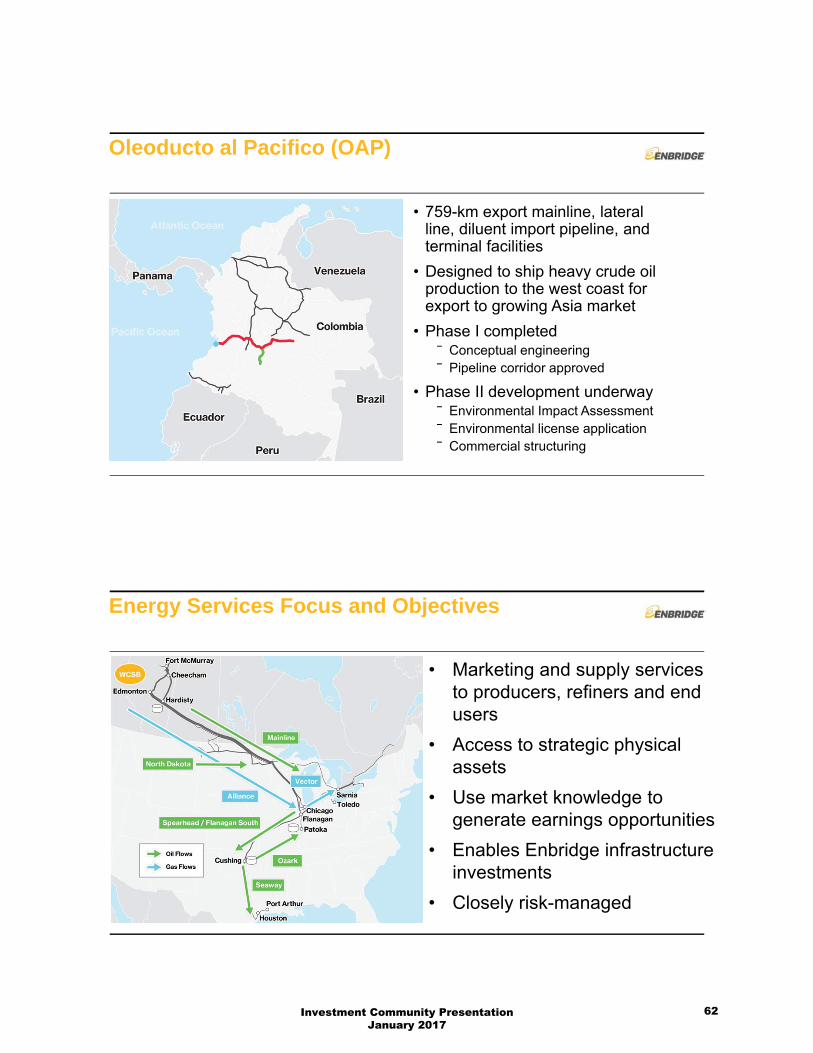
Oleoducto al Pacifico (OAP)
• 759-km export mainline, lateral line, diluent import pipeline, and terminal facilities
• Designed to ship heavy crude oil production to the west coast for export to growing Asia market
• Phase I completed ⎯ Conceptual engineering⎯ Pipeline corridor approved
• Phase II development underway⎯ Environmental Impact Assessment⎯ Environmental license application⎯ Commercial structuring
Proposed OAP Lateral
Proposed OAP Mainline
Proposed OAP Terminal
Existing Pipelines
Energy Services Focus and Objectives
• Marketing and supply services to producers, refiners and end users
• Access to strategic physical assets
• Use market knowledge to generate earnings opportunities
• Enables Enbridge infrastructure investments
• Closely risk-managed
Investment Community Presentation January 2017
62

Energy Services Business Strategies
A Buy WCS @ Edmonton, (35)Tariffs and TVM (6)
B Sell WCS @ Cushing 44Margin 3
A Buy DOM @ Midland (48)Tariffs and TVM (2)
B Sell DOM @ Longview 52Refinery Supply Margin 2
• Customer focus – fee for service solutions to producers and end users• Support Enbridge assets, profitably• Minimal commodity and basis spread exposure• Use physical assets to generate incremental optimization based earnings
Buy - February
($50)/bbl
Sell - March
$52/bbl
Investment Community Presentation January 2017
63

Investment Community Presentation January 2017
64

Corporate Finance
Investment Community PresentationJanuary 2017
65

Financial Highlights
1Available cash flow from operations (ACFFO), adjusted earnings before interest and taxes (adjusted EBIT) and adjusted earnings are non-GAAP measures. For more information on non-GAAP measures please refer to disclosure in the MD&A. Adjusted EBIT is not presented on a $/share basis.*Incremental impact if Alberta Wildfires had not occurred.
Adjusted EBIT1
$ MillionsACFFO1
$ Millions, except per share amounts
Adjusted Earnings1
$ Millions, except per share amounts
2015 2016 2015 2016 2015 2016
Q3 $958 $1,001 $0.79 $0.92 $0.47 $0.47
YTD $3,038 $3,464 $2.70 $3.13 [+$0.08]* $1.62 $1.72 [+$0.03]*
FY Guidance $4,400-$4,800 $3.80-$4.50
$802Q1
$1,114Q1 $468
Q1
$663Q1$1,031
Q1
$1,374Q1
$1,049Q2
$1,089Q2
Strong results reflect resiliency of business model; guidance range unchanged
$808Q2
$868Q2 $505
Q2
$456Q2
+$74*$1,001
Q3$958
Q3$399
Q3
$437Q3
+$74* +$26*$852
Q3
$668Q3
2016 Adjusted EBIT & ACFFO Guidance
Adjusted EBIT ACFFO/share
$3.02
$3.80
2014 2015 2016e
$4.4B
2016e
$4.8B $4.50
*Available cash flow from operations (ACFFO) and adjusted earnings before interest and tax (adjusted EBIT) are non-GAAP measures. For more information on non-GAAP measures please refer to disclosure in the MD&A.
Investment Community Presentation January 2017
66
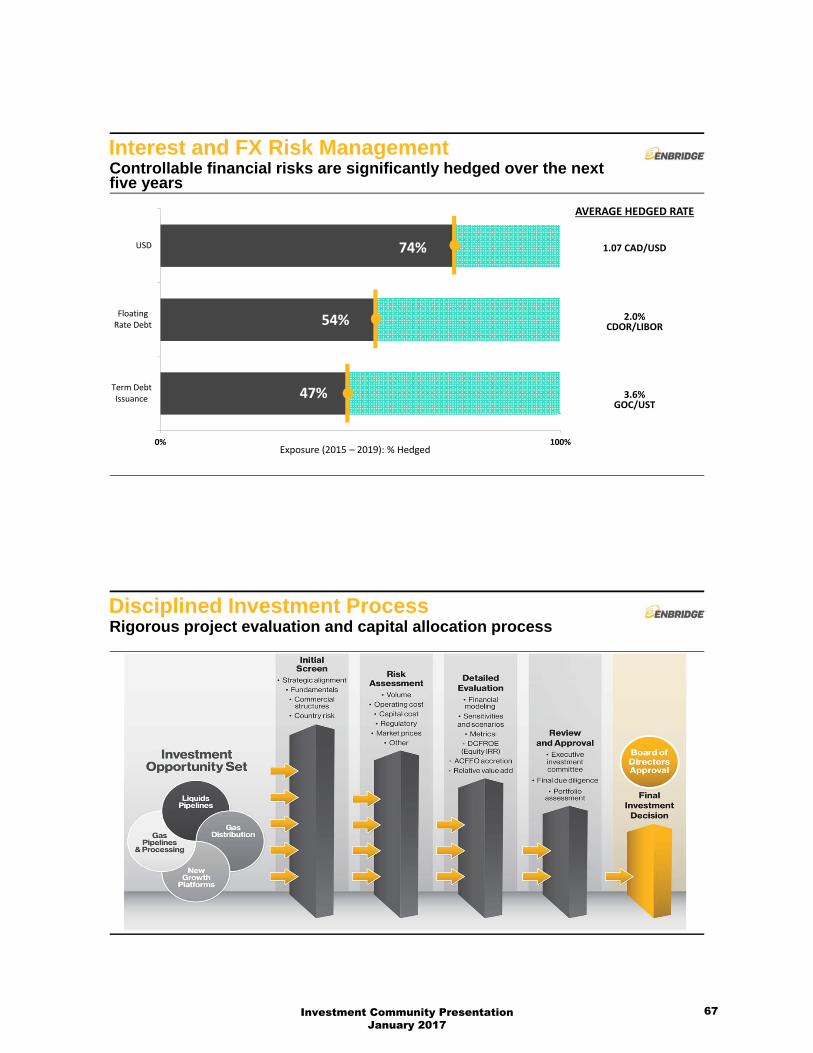
Interest and FX Risk ManagementControllable financial risks are significantly hedged over the next five years
47%
54%
74%
0% 100%
Term DebtIssuance
FloatingRate Debt
USD
Exposure (2015 – 2019): % Hedged
AVERAGE HEDGED RATE
1.07 CAD/USD
2.0% CDOR/LIBOR
3.6% GOC/UST
Disciplined Investment ProcessRigorous project evaluation and capital allocation process
Investment Community Presentation January 2017
67
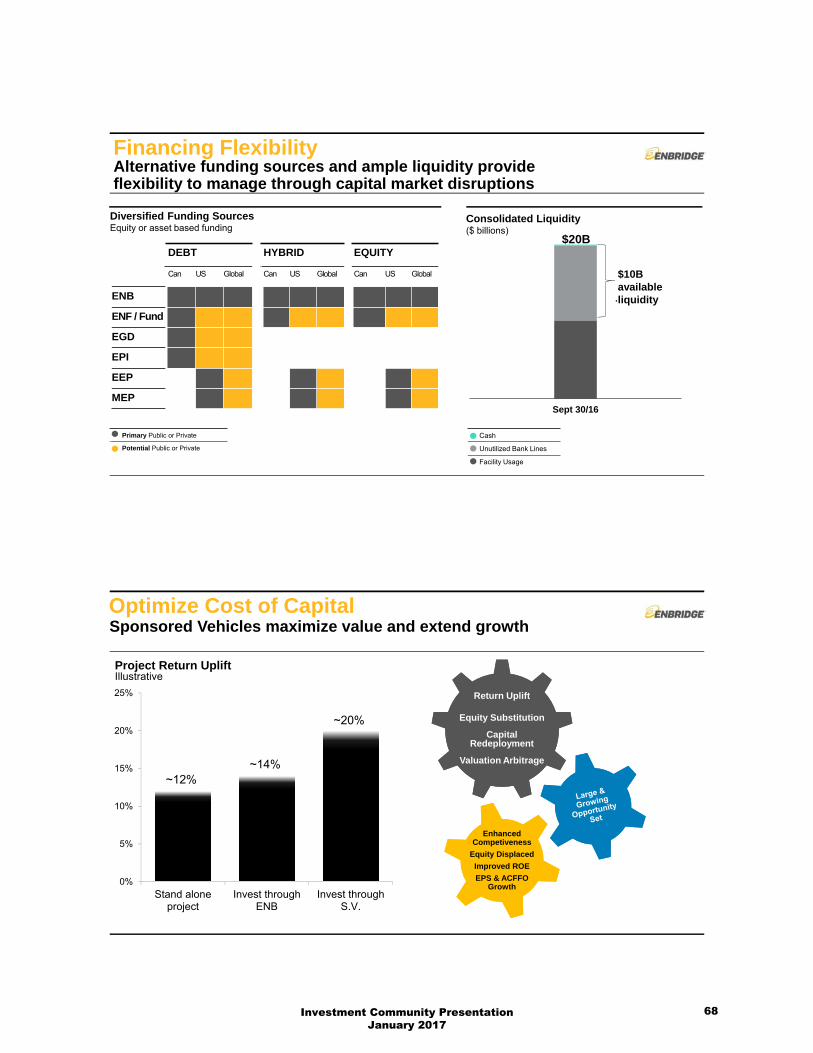
Financing Flexibility
DEBT
Can US Global
ENB
ENF / Fund
EGD
EPI
EEP
MEP
EQUITY
Can US Global
HYBRID
Can US Global
Sept 30/16
Alternative funding sources and ample liquidity provide flexibility to manage through capital market disruptions
$20B
$10Bavailableliquidity
Cash
Unutilized Bank Lines
Facility Usage
Primary Public or Private
Potential Public or Private
Diversified Funding SourcesEquity or asset based funding
Consolidated Liquidity($ billions)
Optimize Cost of CapitalSponsored Vehicles maximize value and extend growth
~12%~14%
~20%
0%
5%
10%
15%
20%
25%
Stand aloneproject
Invest throughENB
Invest throughS.V.
Project Return UpliftIllustrative
Return Uplift
Equity Substitution
Capital Redeployment
Valuation Arbitrage
Return Uplift
Equity Substitution
Capital Redeployment
Valuation Arbitrage
Enhanced Competiveness
Equity Displaced
Improved ROE
EPS & ACFFO Growth
Enhanced Competiveness
Equity Displaced
Improved ROE
EPS & ACFFO Growth
Investment Community Presentation January 2017
68

Enbridge Income Fund Holdings (ENF)The premier, low-risk Canadian energy infrastructure company
ENBTSX, NYSE
ENBTSX, NYSE
ENFTSX
ENFTSX
• $13B secured growth projects
• 10% DPS growth through 2019
• 5% current yield
• Growing public float and liquidity
The FundThe Fund
Operating Assets
Operating Assets
Enbridge Income Fund Holdings (ENF)Key Priorities
Execute $13B of secured growth projects
Bolster capital markets presence
Diversify and extend investor base
Position for further growth and expansion
2016e ACFFO*2016e ACFFO*
LiquidsGasRenewable Energy
*ACFFO is a non-GAAP measure. For more information on this non-GAAP measure please refer to the disclosure in EIPLP’s MD&A.
Investment Community Presentation January 2017
69
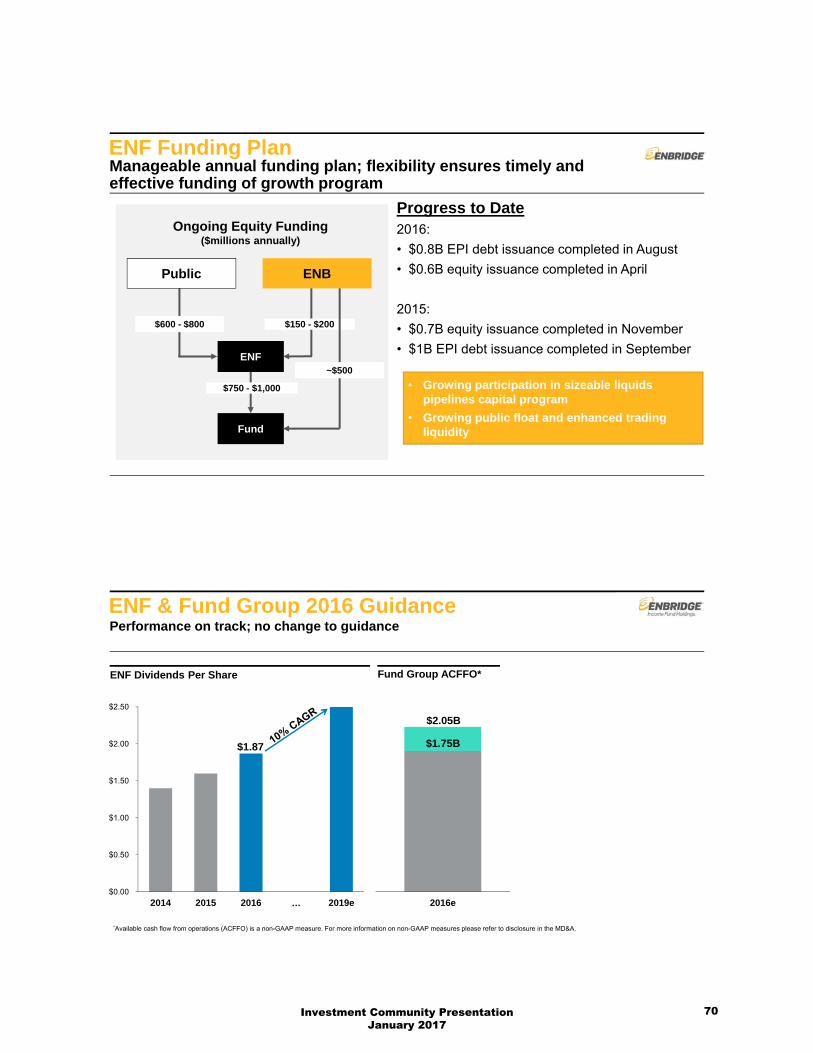
ENF Funding PlanManageable annual funding plan; flexibility ensures timely and effective funding of growth program
Ongoing Equity Funding ($millions annually)
Fund
ENF
Public
$600 - $800
$750 - $1,000
$150 - $200
ENB
~$500
Progress to Date2016:
• $0.8B EPI debt issuance completed in August
• $0.6B equity issuance completed in April
2015:
• $0.7B equity issuance completed in November
• $1B EPI debt issuance completed in September
• Growing participation in sizeable liquids pipelines capital program
• Growing public float and enhanced trading liquidity
$0.00
$0.50
$1.00
$1.50
$2.00
$2.50
2014 2015 2016 … 2019e
ENF & Fund Group 2016 Guidance
ENF Dividends Per Share Fund Group ACFFO*
$1.87
2016e
$2.05B
$1.75B
Performance on track; no change to guidance
*Available cash flow from operations (ACFFO) is a non-GAAP measure. For more information on non-GAAP measures please refer to disclosure in the MD&A.
Investment Community Presentation January 2017
70
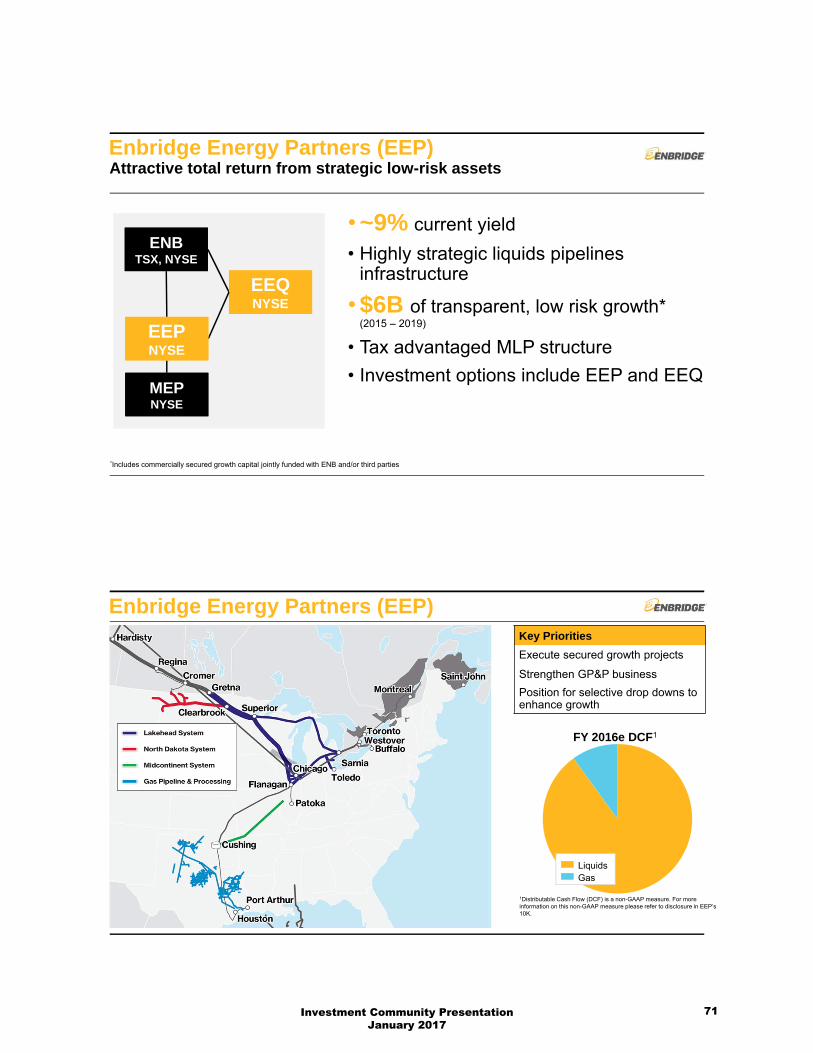
Enbridge Energy Partners (EEP)Attractive total return from strategic low-risk assets
• ~9% current yield
• Highly strategic liquids pipelines infrastructure
• $6B of transparent, low risk growth* (2015 – 2019)
• Tax advantaged MLP structure
• Investment options include EEP and EEQ
ENBTSX, NYSE
ENBTSX, NYSE
EEQNYSEEEQNYSE
MEPNYSEMEPNYSE
EEPNYSEEEPNYSE
*Includes commercially secured growth capital jointly funded with ENB and/or third parties
Enbridge Energy Partners (EEP)Key Priorities
Execute secured growth projects
Strengthen GP&P business
Position for selective drop downs to enhance growth
FY 2016e DCF1
1Distributable Cash Flow (DCF) is a non-GAAP measure. For more information on this non-GAAP measure please refer to disclosure in EEP’s 10K.
LiquidsGas
Investment Community Presentation January 2017
71

Investment Community Presentation January 2017
72

Appendix
Investment Community PresentationJanuary 2017
73

ENB Analyst EstimatesAs at January 1, 2016
Analyst Company 2016e EPS
Growth2016e vs. 2015a
2016e ACFFO per Share
Growth 2016e vs. 2015a
Target Price Rating
Gabe Moreen BAML $2.28 3.6% ‐ ‐ $60.00 Hold
Benjamin Pham BMO $2.25 2.3% $4.15 11.6% Research Restricted
David Galison Canaccord Genuity $2.05 ‐6.8% $3.91 5.1% $63.00 Buy
Robert Catellier CIBC $2.28 3.6% $4.08 9.7% $71.00 Buy
Faisel Khan Citibank $2.46 11.8% ‐ ‐ Research Restricted
Andrew Kuske Credit Suisse $2.41 9.5% ‐ ‐ Research Restricted
Ian Gillies FirstEnergy $2.08 ‐5.5% $4.16 11.8% $68.00 Buy
Ted Durbin Goldman Sachs $2.31 5.0% $3.79 1.9% Research Restricted
Jeremy Tonet JP Morgan $2.31 5.0% $3.90 4.8% Research Restricted
Patrick Kenny National Bank $2.30 4.5% $4.16 11.8% $63.00 Buy
Tyler Reardon Peters & Co $2.42 10.0% $4.01 7.8% $60.00 Buy
Robert Kwan RBC $2.35 6.8% $3.99 7.3% $69.00 Buy
Robert Hope Scotia $2.30 4.5% $4.17 12.1% $61.00 Buy
Linda Ezergailis TD $2.33 5.9% $3.90 4.8% $62.00 Buy
Average $2.28 3.7% $4.02 8.1% $63.78 8 Buys /1 Holds
Min $2.05 ‐6.8% $3.79 1.9% $60.00
Max $2.42 10.0% $4.17 10.8% $71.00
Outstanding Shares OwnershipAs at Sept 30, 2016 (Excludes Noverco’s share interest)
Canadian Institutional
Canadian Retail
U.S. Institutional
U.S Retail
Foreign Institutional
Management 43%
17%
26%
2% 9%
0%
Investment Community Presentation January 2017
74
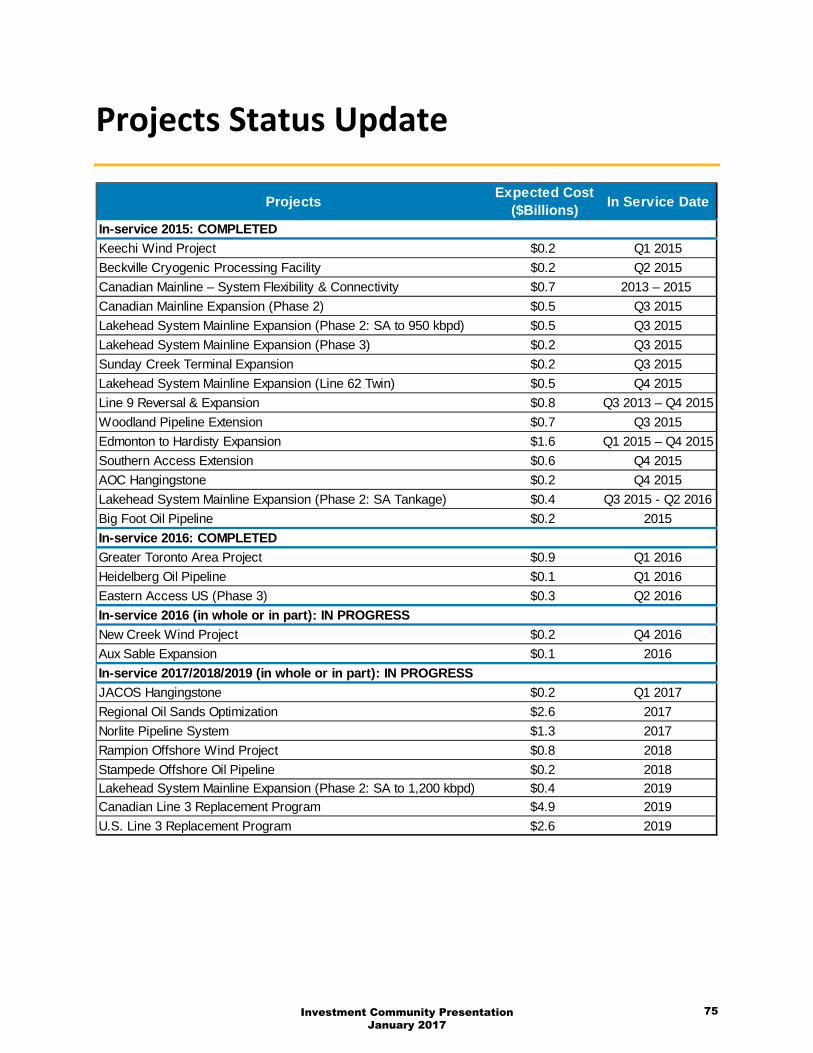
Projects Status Update
ProjectsExpected Cost
($Billions)In Service Date
In-service 2015: COMPLETED
Keechi Wind Project $0.2 Q1 2015Beckville Cryogenic Processing Facility $0.2 Q2 2015Canadian Mainline – System Flexibility & Connectivity $0.7 2013 – 2015 Canadian Mainline Expansion (Phase 2) $0.5 Q3 2015Lakehead System Mainline Expansion (Phase 2: SA to 950 kbpd) $0.5 Q3 2015Lakehead System Mainline Expansion (Phase 3) $0.2 Q3 2015Sunday Creek Terminal Expansion $0.2 Q3 2015Lakehead System Mainline Expansion (Line 62 Twin) $0.5 Q4 2015Line 9 Reversal & Expansion $0.8 Q3 2013 – Q4 2015Woodland Pipeline Extension $0.7 Q3 2015Edmonton to Hardisty Expansion $1.6 Q1 2015 – Q4 2015Southern Access Extension $0.6 Q4 2015AOC Hangingstone $0.2 Q4 2015Lakehead System Mainline Expansion (Phase 2: SA Tankage) $0.4 Q3 2015 - Q2 2016Big Foot Oil Pipeline $0.2 2015In-service 2016: COMPLETED
Greater Toronto Area Project $0.9 Q1 2016Heidelberg Oil Pipeline $0.1 Q1 2016Eastern Access US (Phase 3) $0.3 Q2 2016In-service 2016 (in whole or in part): IN PROGRESS
New Creek Wind Project $0.2 Q4 2016Aux Sable Expansion $0.1 2016In-service 2017/2018/2019 (in whole or in part): IN PROGRESS
JACOS Hangingstone $0.2 Q1 2017Regional Oil Sands Optimization $2.6 2017Norlite Pipeline System $1.3 2017Rampion Offshore Wind Project $0.8 2018Stampede Offshore Oil Pipeline $0.2 2018Lakehead System Mainline Expansion (Phase 2: SA to 1,200 kbpd) $0.4 2019Canadian Line 3 Replacement Program $4.9 2019U.S. Line 3 Replacement Program $2.6 2019
Investment Community PresentationJanuary 2017
75

Line 137,600 m3/d (237 kbpd)18"/20" - 1098 miles- NGL- Refined Products- Light
Line 2A70,300 m3/d (442 kbpd)24" - 596 miles- Condensates- Light
Line 2B70,300 m3/d (442 kbpd)24"/26" - 502 miles- Light
Line 362,000 m3/d (390 kbpd)34" - 1098 miles- Condensates
(Edmonton to Hardisty)- Light
Line 4126,500 m3/d (796 kbpd)36"/48" - 1098 miles- Heavy- Medium (Ex-Clearbrook)- Light (Ex-Clearbrook)
Line 585,900 m3/d (540 kbpd)30" - 645 miles- NGL- Light
Line 6106,000 m3/d (667 kbpd)34" - 467 miles- Light- Medium- Heavy
Line 728,600 m3/d (180 kbpd)20" - 120 miles- Light- Medium- Heavy
Line 7879,500 m3/d (500 kbpd)30"/36" - 373 miles- Light- Medium- Heavy
Line 6529,500 m3/d (186 kbpd)20" - 313 miles- Light- Medium
Line 1011,800 m3/d (74 kbpd)12"/20" - 91 miles- Light- Medium- Heavy
Line 1118,600 m3/d (117 kbpd)16"/20" - 47 miles- Condensates- Light- Medium- Heavy
Line 6237,400 m3/d (235 kbpd)22" - 75 miles- Heavy
Line 14/6450,500 m3/d (318 kbpd)24" - 467 miles- Light- Medium
Line 61148,000 m3/d (931 kbpd)42" - 454 miles- Light- Medium- Heavy
Line 67127,200 m3/d (800 kbpd)36" - 1112 miles- Heavy
NOTE: Capacities provided are Annual Capacities anddo not include current restrictions.
Not part ofthe EnbridgeMainline System
Line 947,700 m3/d (300 kbpd)30" - 517 miles- Light
- Heavy
Line 1716,000 m3/d (100 kbpd)16" - 88 miles- Heavy
Line 5530,700 m3/d (193 kbpd)22"/24" - 583 miles- Light- Medium- Heavy
Line 5993,000 m3/d (585 kbpd)36" - 593 miles- Light- Heavy
Line 7912,700 m3/d (80.0 kbpd)20"/16" - 61 miles- Heavy
Line 6347,700 m3/d (300 kbpd)24" - 168 miles- Light- Heavy
Pipeline System Configuration Q2, 2016
Superior
ClearbrookCromer
Cushing Patoka
Toledo
Van Buren
Sarnia
StockbridgeGriffith/Hartsdale
Flanagan
Line
17
Line 79
Kiantone
Montreal
Nanticoke
Line
55
Line
59
Line
63
Westover
Line 9
Line 7Line 78
Line 6
Line 61Li
ne6
2Li
ne78
Line 14
Line64
78
Line 10
Line 11
Line 65
Line 67
Line 4
Line 3
Line 1
Line 5
Edmonton
Line 2A Line 2B
Investment Community PresentationJanuary 2017
76

Line 18 — Waupisoo Pipeline550 kbpd30" - 380 km (236 miles)
Line 75 — Wood Buffalo Pipeline550 kbpd30" - 95 km (59 miles)
Line 19 — Athabasca Pipeline570 kbpd30" - 541 km (336 miles)
Line 45 — Athabasca Twin Pipeline450 kbpd (Expandable to 800 kbpd)36" - 343 km (214 miles)
Line 45 — Wood Buffalo Extension800 kbpd36" - 104 km (65 miles)
Line 74 — Norlite Pipeline130 kbpd (Expandable to 400 kbpd)24" - 443 km (275 miles)
Line 49 — Woodland Pipeline379 kbpd (Expandable to 800 kbpd)36" - 140 km (87 miles)
Line 70 — Woodland Extension379 kbpd (Expandable to 800 kbpd)36" - 385 km (239 miles)
Line 50 — Norealis Pipeline90 kbpd24" - 112 km (69 miles)
Line
18
Line
49
Line
74
Line
45
Line
45
Line
70
Line
50
Line
19
Woodland
Cheecham
Stonefell
Edmonton
Ath
abas
ca
Ath
abas
caTw
in
Woo
dlan
dE
xten
sion
Woo
dB
uffal
oE
xten
sion
Woo
dB
uffal
o
Wau
piso
o
Nor
ealis
Woo
dlan
d
NorealisAthabasca
Cheecham
Kirby Lake
Hardisty
Nor
lite
NOTE: Dotted lines denote pipelines that areproposed/under construction or not yet in service.
Oil Sands Regional System Configuration Q2, 2016
Line
75
Investment Community PresentationJanuary 2017
78Investment Community PresentationJanuary 2017
77

WestwardHoWestwardHo
XLXL
HalifaxImperial Oil (Dartmouth) – 85
January 2016
Source: Oil & Gas Journal (OGJ)Worldwide Refining Survey, December 2014
Come By Chance
Cheecham
Fort McMurray
Hardisty
Edmonton
Rainbow Lake
Lloydminster
Kerrobert
Regina
Cromer
Gretna
Clearbrook
Zama
Cheecham
Fort McMurray
Hardisty
Edmonton
Rainbow Lake
Lloydminster
Kerrobert
Regina
Gretna
Clearbrook
Zama
Sundre
Cutbank
Great Falls
SaltLakeCity
Santa Maria
Los Angeles
San Francisco
Casper
Cheyenne
Crane
FreeportCuero
McKeeBorger
Big SpringColorado City
Midland
El Paso
El Dorado
Montreal
Nanticoke
Ponca City
Cushing
St Paul
Philadelphia
Kitimat
Prince Rupert
Taylor
Prince George
Anacortes
Guernsey/Ft Laramie
Billings
Sinclair
Mandan
McPherson
Artesia
Long Beach
Bakersfield
Tulsa
Chicago
El Dorado
HoustonPort Arthur
Memphis
New OrleansSt James
Robinson
Wood River
Patoka
Wynnewood
Ardmore
Longview
Co�eyville
Lima
Toledo
Portland
Warren
Boston
Yorktown
Catlettsburg
Halifax
Quebec City
Saint John
Canton
DetroitSarnia
Denver
Superior
VancouverKamloops
Sundre
Cutbank
Great Falls
SaltLakeCity
Santa Maria
Los Angeles
San Francisco
Casper
Cheyenne
Crane
Corpus ChristiCorpus Christi
FreeportCueroThree
RiversThree Rivers
McKeeBorger
Big SpringColorado City
Midland
El Paso
El Dorado
Montreal
Nanticoke
Ponca City
Cushing
St Paul
Philadelphia
Kitimat
Prince Rupert
Taylor
Prince George
Anacortes
Guernsey/Ft Laramie
Billings
Sinclair
Mandan
McPherson
Long Beach
Bakersfield
Tulsa
Chicago
El Dorado
HoustonPort Arthur
LakeCharlesLakeCharles
Memphis
New OrleansSt James
Robinson
Wood River
Patoka
Wynnewood
Ardmore
Longview
Co�eyville
Lima
Toledo
Portland
Warren
Boston
Yorktown
Catlettsburg
Halifax
Quebec City
Saint John
Canton
DetroitSarnia
Denver
Superior
VancouverKamloops
FlanaganFlanagan
Come By Chance
Artesia
Cromer
Woodland
Norealis
Jayhawk
Tesoro
Chevron
SandpiperBelle
Fourche
Was
cana
Exp
ress
Bow
Riv
er
Ran
gela
nd
Cenex
Brid
ger
White Cli�s
Pony Express
Sun
cor
Express
Platte
Minnesota
Bel
le F
ourc
heW C
orridor
Koc
h
WoodpatCapwood
OzarkSpearh
ead
Chi
cap
Mus
tang
Mid
Val
ley
MontrealPortland
BP
Basin
Cactus KMCC
WTG
Permian Express
Sun
Mill
enni
um
Platte
ExxonM
obil
Tosco
Line 63
Chevron
Shell
But
e
Trans Mountain
Northern Gateway
Rainbo
w
Trans Mountain
Toledo
Jayhawk
Tesoro
Chevron
Belle
Fourche
Was
cana
Exp
ress
Bow
Riv
er
Ran
gela
nd
Cenex
Brid
ger
White Cli�s
Pony Express
Sun
cor
Express
Platte
Minnesota
Bel
le F
ourc
heW. C
orridor
Koc
h
SA
X
WoodpatCapwood
Ozark
Flanagan South
Flanagan South
Spearhead
MAPMAP
Pegasus (idle)
Pegasus (idle)
Chi
cap
Mus
tang
Mid
Val
ley
Kiantone
MontrealPortland
BP
Basin
Cactus KMCC
ExxonMobil
WTG
BridgeTex
BridgeTex
Permian Express
GardendaleGardendale
Ho-HoHo-Ho
Sun
Mill
enni
um
Platte
ExxonM
obil
Tosco
Line 63
Chevron
Shell
But
te
Trans Mountain
Northern Gateway
Rainbo
w
Trans Mountain
CenturionCenturion
Toledo
FrontierFrontier
Keystone
Keystone
WaupisooAthabascaWood Bu�alo ExtAthabasca Twin
Wood Bu�alo
WaupisooAthabascaWood Bu�alo ExtAthabasca Twin
Wood Bu�alo
Woodland
Norealis
Woodland Ext
Norlite
Woodland Ext
Norlite
Enbridge NWEnbridge NW
SouthernLightsSouthernLights
OsageOsage
SeawaySeaway
SeawayTwin
SeawayTwin
SA
XS
AX
MAPMAP
Cap
line
Cap
line
CraneCrane
ExxonMobil
Kiantone
UNITED STATES OF AMERICAUNITED STATES OF AMERICA
CANADA
MEXICO
PADD IV
PADD V
PADD I
PADD II
PADD IV
PADD V
PADD I
PADD II I
PADD II
PADD II I
Prince GeorgeHusky – 12
VancouverChevron (Burnaby) – 55
Great FallsCalumet MT Refining – 10
WyomingSinclair Oil (Sinclair) – 80HollyFrontier (Cheyenne) – 52Sinclair Oil (Evansville) – 20
BillingsExxonMobil – 61Phillips 66 – 59CHS (Laurel) – 55
Salt Lake CityTesoro – 58Chevron – 50Big West Oil – 35HollyFrontier (Woods Cross) – 31
BakersfieldKern Oil – 25San Joaquin Ref – 24
Borger/SunrayValero (Sunray ) – 170WRB Ref (Borger) – 143
DenverSuncor (Commerce City) – 98
OklahomaPhillips 66 (Ponca City) – 203HollyFrontier (Tulsa) – 125Valero (Ardmore) – 90Wynnewood Ref (Wynnewood) – 70
New Mexico/West TexasWestern Ref (El Paso) – 128HollyFrontier (Artesia) – 100Alon USA (Big Spring) – 73Western Ref (Gallup) – 25
Los AngelesChevron (El Segundo) – 269Tesoro (Carson) – 258ExxonMobil (Torrance) –150Phillips 66 (Wilmington) – 139Valero (Wilmington) – 135Tesoro (Wilmington) – 105Alon USA (Paramount) – 70
San FranciscoChevron (Richmond) – 257Valero (Benicia) – 170Tesoro (Martinez) – 166Shell (Martinez) – 145Phillips 66 (Rodeo) – 120
Puget SoundBP (Ferndale) – 222Shell (Anacortes) – 145Tesoro (Anacortes) – 120Phillips 66 (Ferndale) – 101TrailStone (Tacoma) – 42
TylerDelek – 60
Corpus ChristiFlint Hills – 278Valero – 205CITGO – 157Valero (Three Rivers) – 100
Houston/Texas CityExxonMobil (Baytown) – 561Marathon (Galveston Bay) – 451Shell (Deer Park) – 340LyondellBasell (Houston) – 268Valero (Texas City) – 250Phillips 66 (Sweeny) – 247Pasadena Ref (Pasadena) – 117Valero (Houston) – 97Marathon (Texas City) – 84
Port Arthur/BeaumontMotiva – 600Valero – 350ExxonMobil – 345Total – 169
Lake Charles/WestlakeCITGO – 440Phillips 66 – 244Calcasieu Ref – 75
MississippiChevron (Pascagoula) – 330Ergon Ref (Vicksburg) – 23
Mississippi RiverMarathon (Garyville) – 522ExxonMobil (Baton Rouge) – 503Valero (Norco) – 280Phillips 66 (Belle Chasse) – 247Motiva (Norco) – 235Motiva (Convent) – 230Chalmette Ref (Chalmette) – 189Valero (Meraux) – 135Placid Ref (Port Allen) – 82Alon USA (Krotz Springs) – 74Shell (St Rose) – 55
Southern Illinois/IndianaMarathon (Robinson) – 212CountryMark (Mt Vernon) – 27
CatlettsburgMarathon – 242
DetroitMarathon – 130
CantonMarathon – 90Ergon (Newell) – 23Lima
Husky – 160
Saint JohnIrving – 250
LindenPhillips 66 – 238
WarrenUnited – 70
NanticokeImperial Oil – 114
Delaware RiverPhiladelphia Energy (Philadelphia) – 330PBF Energy (Delaware City) – 190Monroe Energy (Trainer) – 185PBF Energy (Paulsboro) – 180Axeon (Paulsboro) – 70
Come by ChanceSilverRange – 115
ToledoPBF Energy – 170BP – 152
MemphisValero – 195
ChicagoBP (Whiting) – 407ExxonMobil (Joliet) – 238CITGO (Lemont) – 167
SarniaImperial Oil – 119Suncor – 85Nova – 80Shell – 71
Montreal/Quebec CityValero (Quebec City) – 235Suncor (Montreal) – 137
ReginaCO-OP – 145
LloydminsterHusky – 82
EdmontonImperial Oil – 189Suncor – 142Shell – 92
LouisianaCalumet (Schreveport) – 60
El DoradoDelek – 80
AlabamaShell (Saraland) – 79Hunt Ref (Tuscaloosa) – 72
SuperiorCalumet – 45
St PaulFlint Hills – 339Northern Tier Energy – 90
MandanTesoro – 71Dakota Prairie (Dickinson) – 20
KansasHollyFrontier (El Dorado) – 133Co�eyville (Co�eyville) – 115NCRA (McPherson) – 85
Wood RiverWRB Ref – 314
Major Canadian and U.S.Crude Oil Pipelines and Refineries
Enbridge Pipelines
Enbridge Pipelines (Diluent)
Enbridge Pipelines (Joint Ownership)
Enbridge Pipelines (Proposed/Under Construction)
Other Pipelines
Enbridge Rail Terminal Enbridge Rail Terminal(Joint Ownership)
Capacity of Refineries are inThousands of Barrels per Day
Investment Community PresentationJanuary 2017
78


