36
Investment Evaluation 1 INVESTMENT EVALUATION Professor Tim Thompson Kellogg School of Management
| Date post: | 15-Dec-2015 |
| Category: |
Documents |
| Upload: | khalid-vorse |
| View: | 221 times |
| Download: | 0 times |
Investment Evaluation 1
INVESTMENT EVALUATIONProfessor Tim Thompson
Kellogg School of Management
Investment Evaluation 2
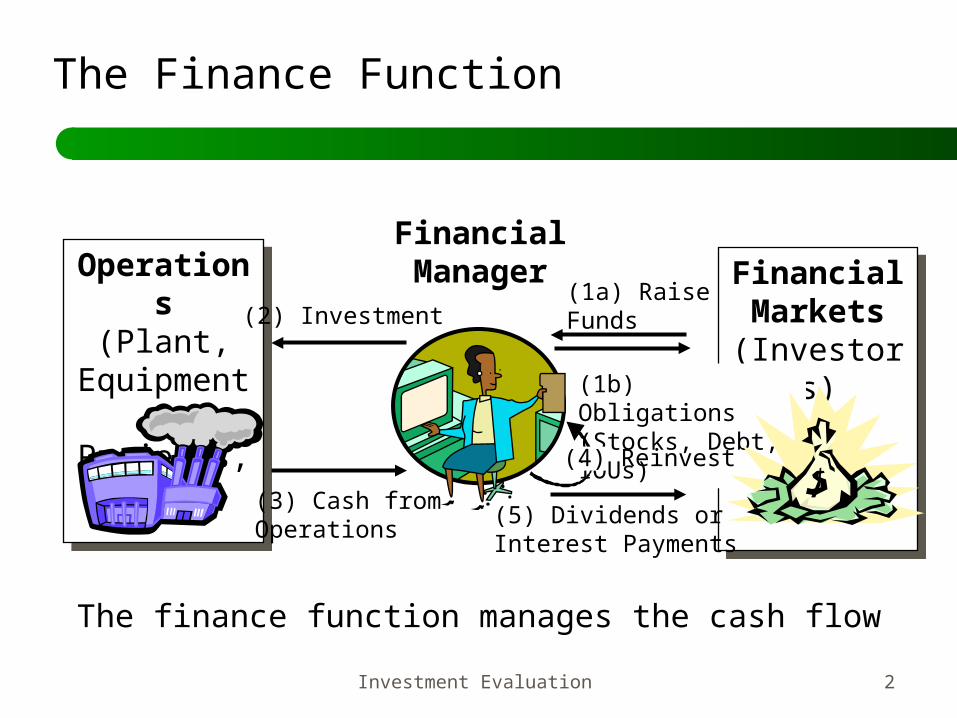
The Finance Function
Financial Markets
(Investors)
Financial Markets
(Investors)
Operations
(Plant, Equipment, Projects,
etc.)
Operations
(Plant, Equipment, Projects,
etc.)
FinancialManager
(1a) RaiseFunds
(1b) Obligations(Stocks, Debt, IOUs)
(2) Investment
(3) Cash fromOperations
(5) Dividends orInterest Payments
The finance function manages the cash flow
(4) Reinvest
Investment Evaluation 3
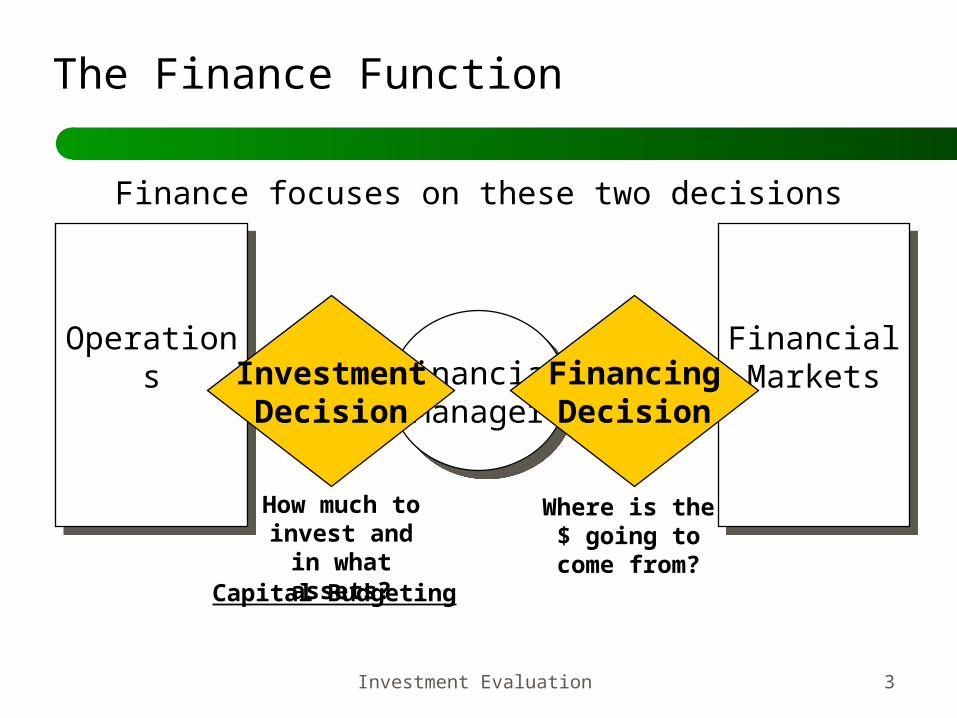
The Finance Function
Financial Markets
Financial Markets
Operations
Operations Financial
ManagerFinancialManager
InvestmentDecision
FinancingDecision
How much to invest and in what assets?
Where is the $ going to
come from?Capital Budgeting
Finance focuses on these two decisions
Investment Evaluation 4
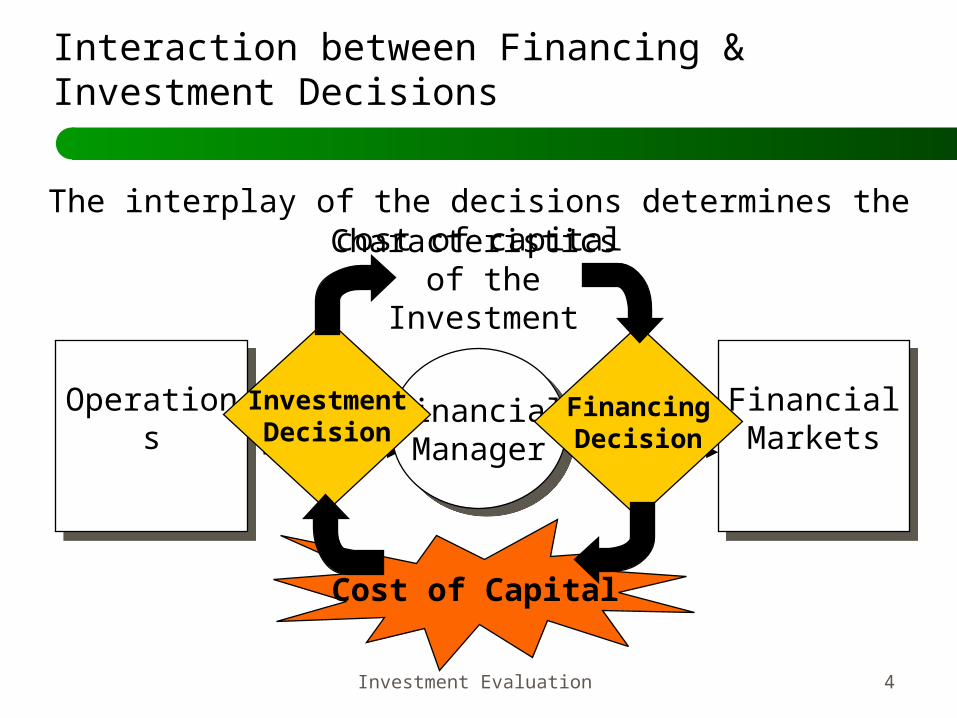
Interaction between Financing & Investment Decisions
Financial Markets
Financial Markets
Operations
Operations
FinancialManagerFinancialManager
InvestmentDecision
FinancingDecision
The interplay of the decisions determines the cost of capital
Cost of Capital
Characteristics of the
Investment
Investment Evaluation 5
The Finance Function
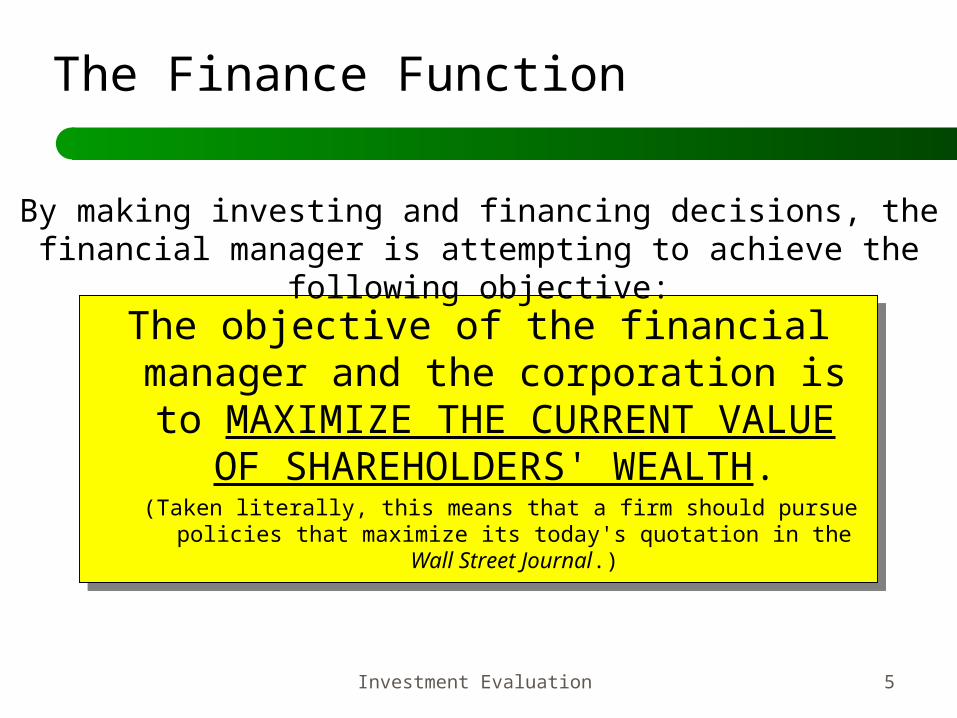
The objective of the financial manager and the corporation is to MAXIMIZE THE CURRENT VALUE OF
SHAREHOLDERS' WEALTH.(Taken literally, this means that a firm should pursue policies
that maximize its today's quotation in the Wall Street Journal.)
The objective of the financial manager and the corporation is to MAXIMIZE THE CURRENT VALUE OF
SHAREHOLDERS' WEALTH.(Taken literally, this means that a firm should pursue policies
that maximize its today's quotation in the Wall Street Journal.)
By making investing and financing decisions, the financial manager is attempting to achieve the following objective:
Investment Evaluation 6
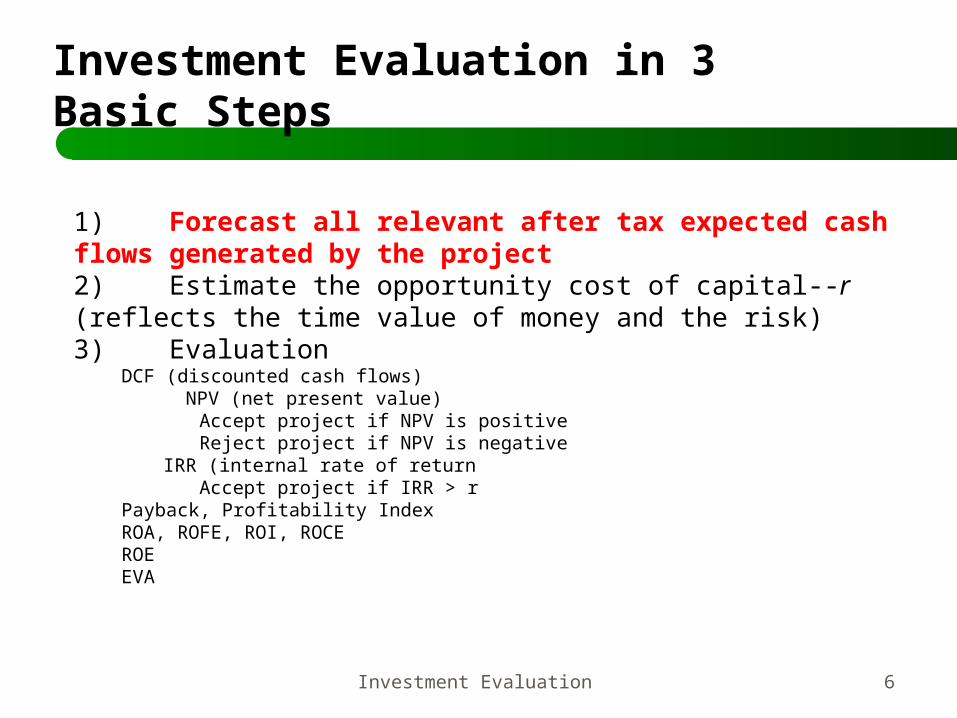
Investment Evaluation in 3 Basic Steps
1) Forecast all relevant after tax expected cash flows generated by the project2) Estimate the opportunity cost of capital--r (reflects the time value of money and the risk)3) Evaluation
DCF (discounted cash flows) NPV (net present value)
Accept project if NPV is positiveReject project if NPV is negative
IRR (internal rate of returnAccept project if IRR > r
Payback, Profitability IndexROA, ROFE, ROI, ROCEROEEVA
Investment Evaluation 7
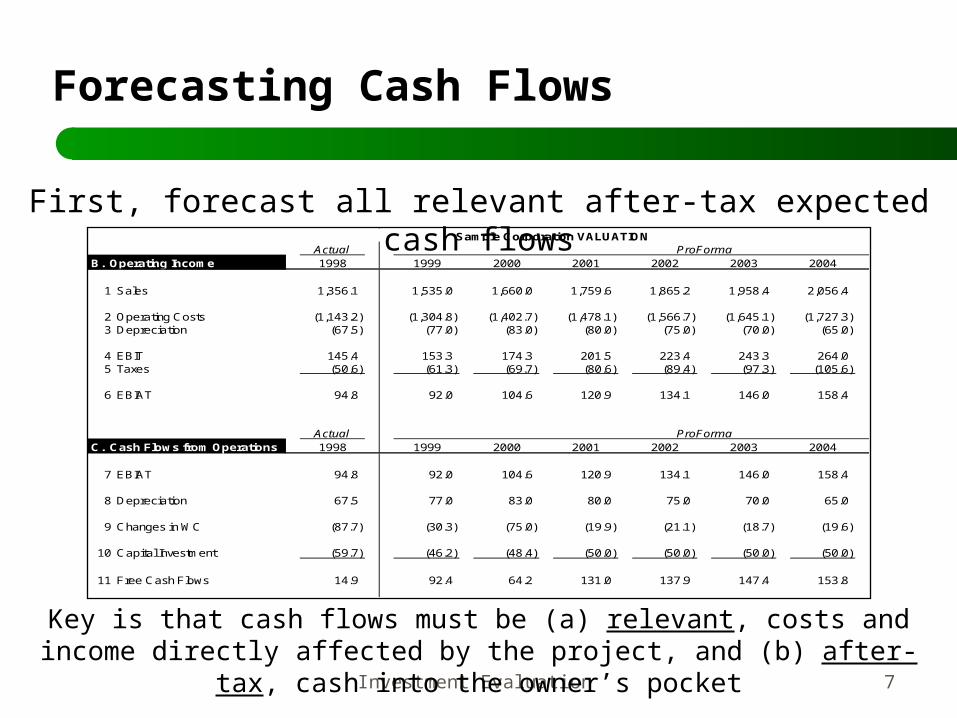
Forecasting Cash Flows
First, forecast all relevant after-tax expected cash flowsActual
B. Operating Income 1998 1999 2000 2001 2002 2003 2004
1 Sales 1,356.1 1,535.0 1,660.0 1,759.6 1,865.2 1,958.4 2,056.4
2 Operating Costs (1,143.2) (1,304.8) (1,402.7) (1,478.1) (1,566.7) (1,645.1) (1,727.3) 3 Depreciation (67.5) (77.0) (83.0) (80.0) (75.0) (70.0) (65.0)
4 EBIT 145.4 153.3 174.3 201.5 223.4 243.3 264.0 5 Taxes (50.6) (61.3) (69.7) (80.6) (89.4) (97.3) (105.6)
6 EBIAT 94.8 92.0 104.6 120.9 134.1 146.0 158.4
ActualC. Cash Flows from Operations 1998 1999 2000 2001 2002 2003 2004
7 EBIAT 94.8 92.0 104.6 120.9 134.1 146.0 158.4
8 Depreciation 67.5 77.0 83.0 80.0 75.0 70.0 65.0
9 Changes in WC (87.7) (30.3) (75.0) (19.9) (21.1) (18.7) (19.6)
10 Capital Investment (59.7) (46.2) (48.4) (50.0) (50.0) (50.0) (50.0)
11 Free Cash Flows 14.9 92.4 64.2 131.0 137.9 147.4 153.8
ProForma
ProForma
Sample Corporation VALUATION
Key is that cash flows must be (a) relevant, costs and income directly affected by the project, and (b) after-tax, cash into the
owner’s pocket
Investment Evaluation 8
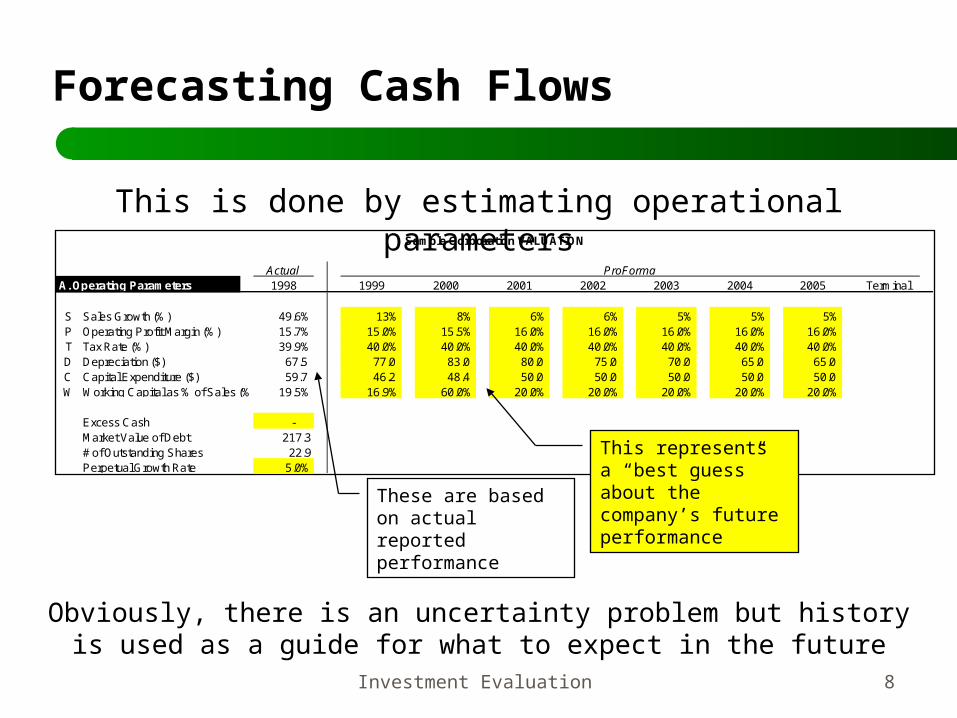
Forecasting Cash Flows
This is done by estimating operational parameters
ActualA. Operating Parameters 1998 1999 2000 2001 2002 2003 2004 2005 Terminal
S Sales Growth (%) 49.6% 13% 8% 6% 6% 5% 5% 5%P Operating Profit Margin (%) 15.7% 15.0% 15.5% 16.0% 16.0% 16.0% 16.0% 16.0%T Tax Rate (%) 39.9% 40.0% 40.0% 40.0% 40.0% 40.0% 40.0% 40.0%D Depreciation ($) 67.5 77.0 83.0 80.0 75.0 70.0 65.0 65.0 C Capital Expenditure ($) 59.7 46.2 48.4 50.0 50.0 50.0 50.0 50.0 W Working Capital as % of Sales (%) 19.5% 16.9% 60.0% 20.0% 20.0% 20.0% 20.0% 20.0%
Excess Cash - Market Value of Debt 217.3# of Outstanding Shares 22.9Perpetual Growth Rate 5.0%
Sample Corporation VALUATION
ProForma
These are based on actual reported performance
This represents a “best guess” about the company’s future performance
Obviously, there is an uncertainty problem but history is used as a guide for what to expect in the future
Investment Evaluation 9
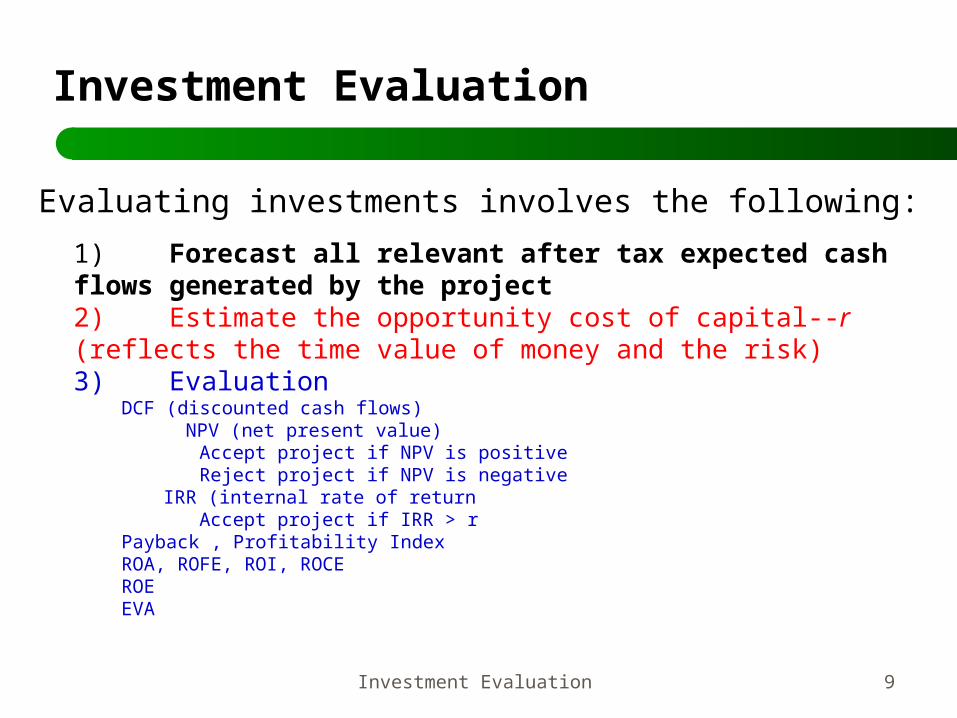
Investment Evaluation
Evaluating investments involves the following:
1) Forecast all relevant after tax expected cash flows generated by the project2) Estimate the opportunity cost of capital--r (reflects the time value of money and the risk)3) Evaluation
DCF (discounted cash flows) NPV (net present value)
Accept project if NPV is positiveReject project if NPV is negative
IRR (internal rate of returnAccept project if IRR > r
Payback , Profitability IndexROA, ROFE, ROI, ROCEROEEVA
Investment Evaluation 10
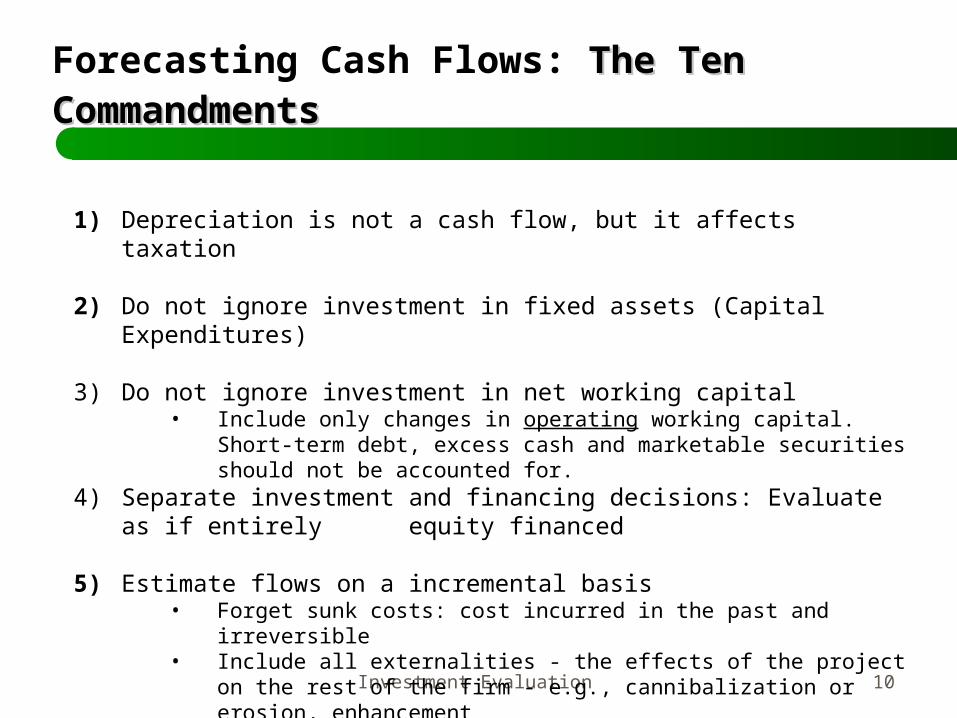
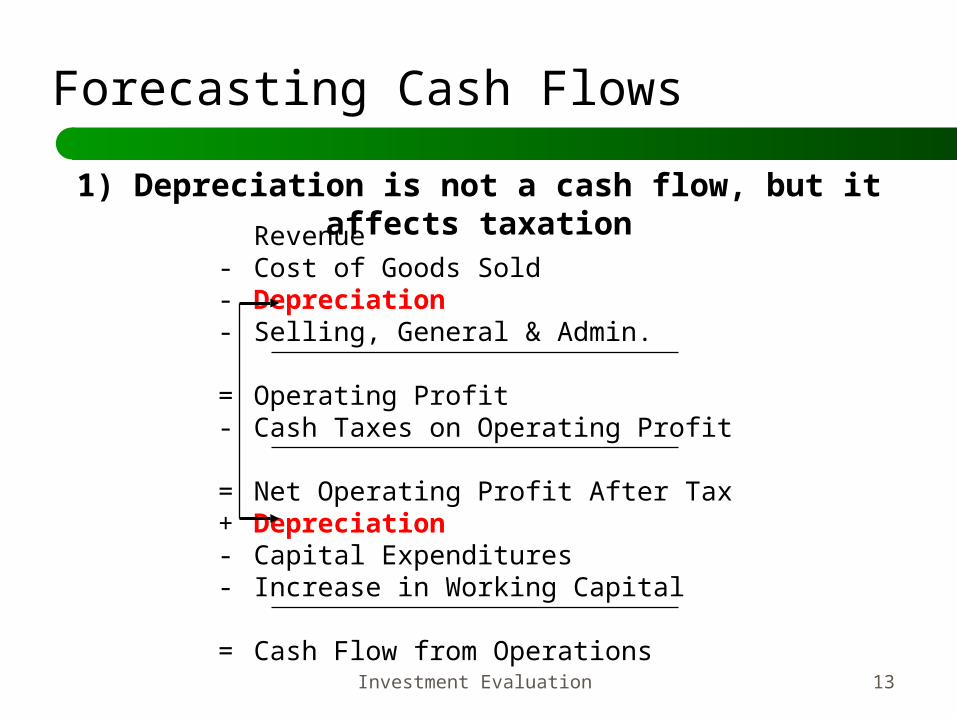
1) Depreciation is not a cash flow, but it affects taxation
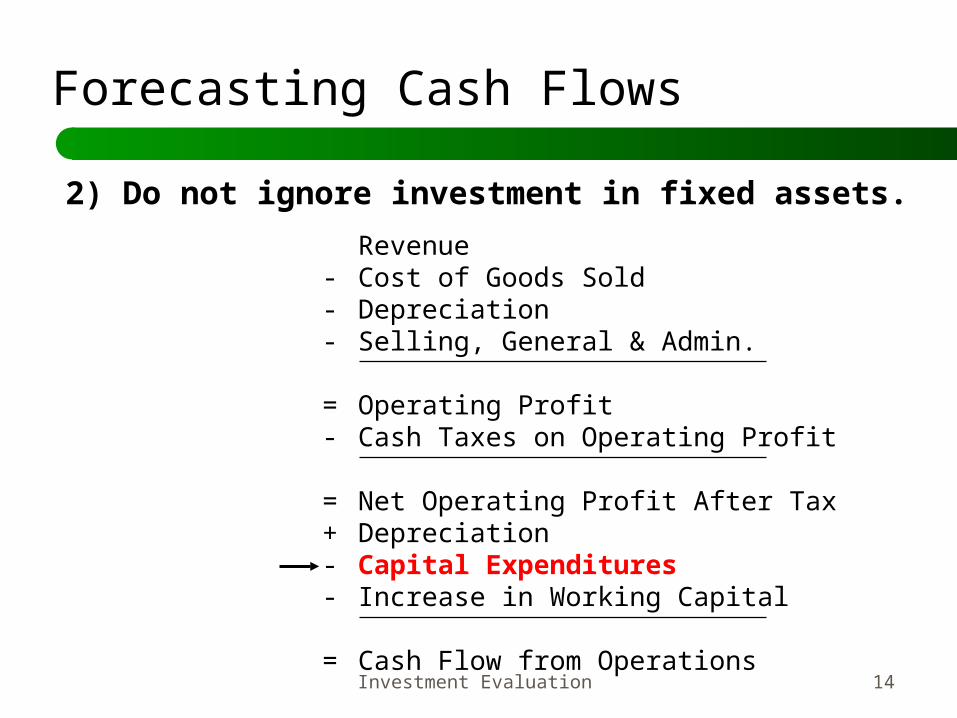
2) Do not ignore investment in fixed assets (Capital Expenditures)
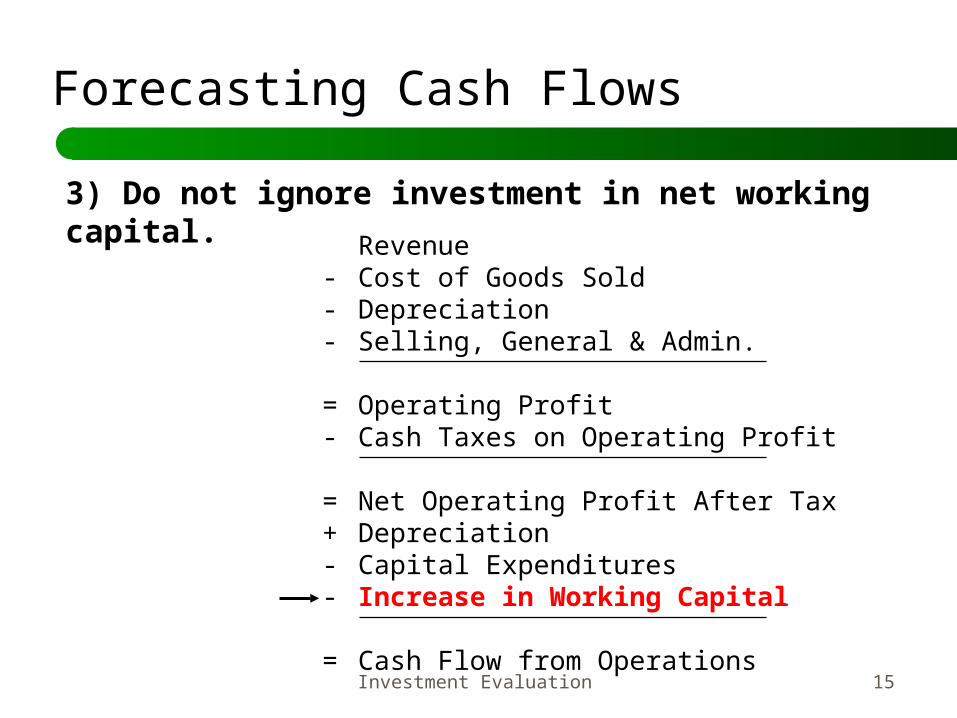
3) Do not ignore investment in net working capital• Include only changes in operating working capital. Short-term
debt, excess cash and marketable securities should not be accounted for.
4) Separate investment and financing decisions: Evaluate as if entirely equity financed
5) Estimate flows on a incremental basis• Forget sunk costs: cost incurred in the past and irreversible• Include all externalities - the effects of the project on the rest of
the firm - e.g., cannibalization or erosion, enhancement
6) Opportunity costs cannot be ignored
Forecasting Cash Flows: The Ten The Ten CommandmentsCommandments
Investment Evaluation 11
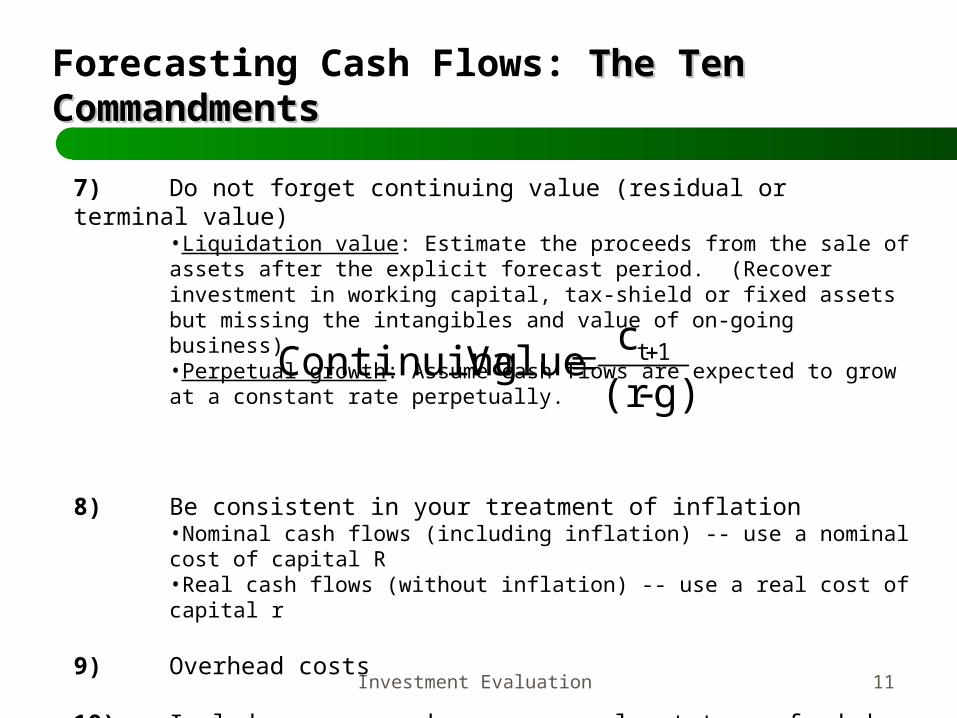
7) Do not forget continuing value (residual or terminal value)•Liquidation value: Estimate the proceeds from the sale of assets after the explicit forecast period. (Recover investment in working capital, tax-shield or fixed assets but missing the intangibles and value of on-going business)•Perpetual growth: Assume cash flows are expected to grow at a constant rate perpetually.
8) Be consistent in your treatment of inflation•Nominal cash flows (including inflation) -- use a nominal cost of capital R•Real cash flows (without inflation) -- use a real cost of capital r
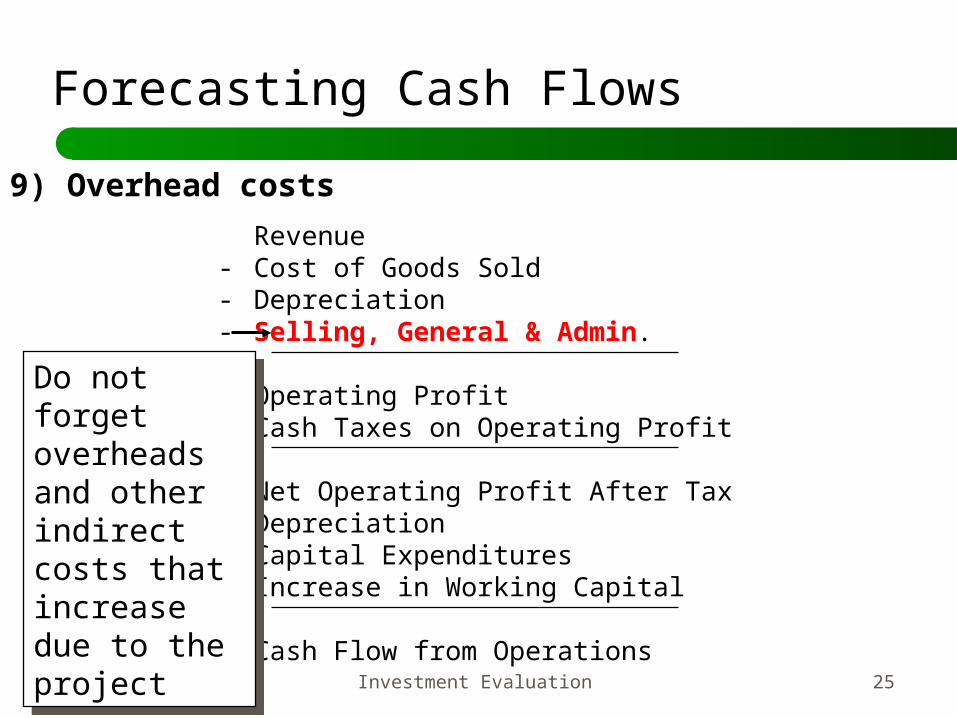
9) Overhead costs
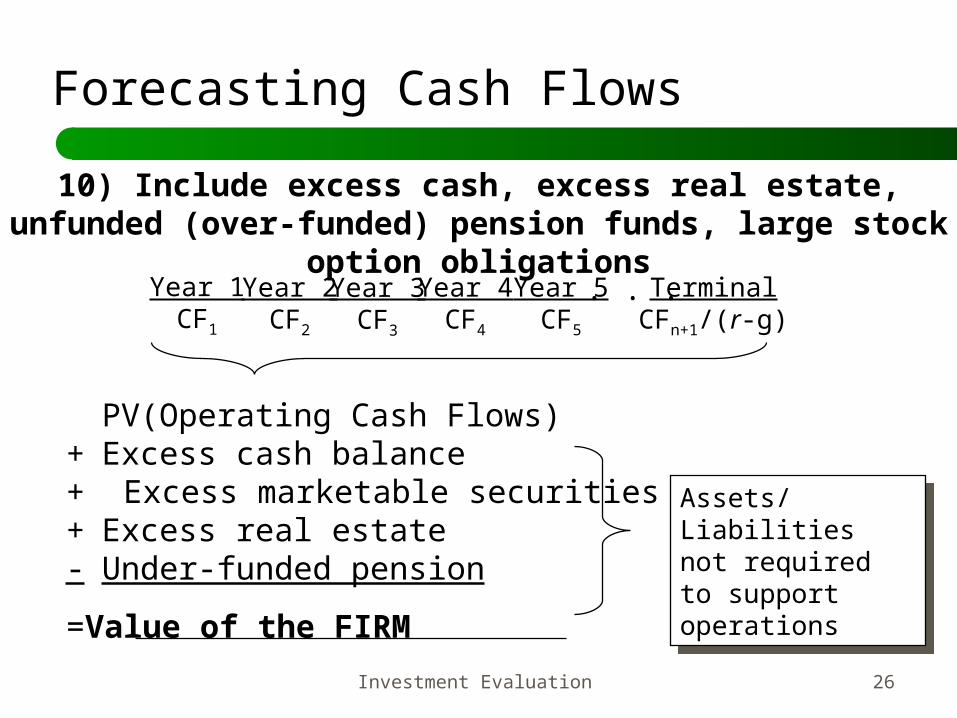
10) Include excess cash, excess real estate, unfunded (over-funded) pension fund, large stock option obligations, and other relevant off balance sheet items.
Forecasting Cash Flows: The Ten The Ten CommandmentsCommandments
g)-(r
c Value Continuing 1t
Investment Evaluation 12
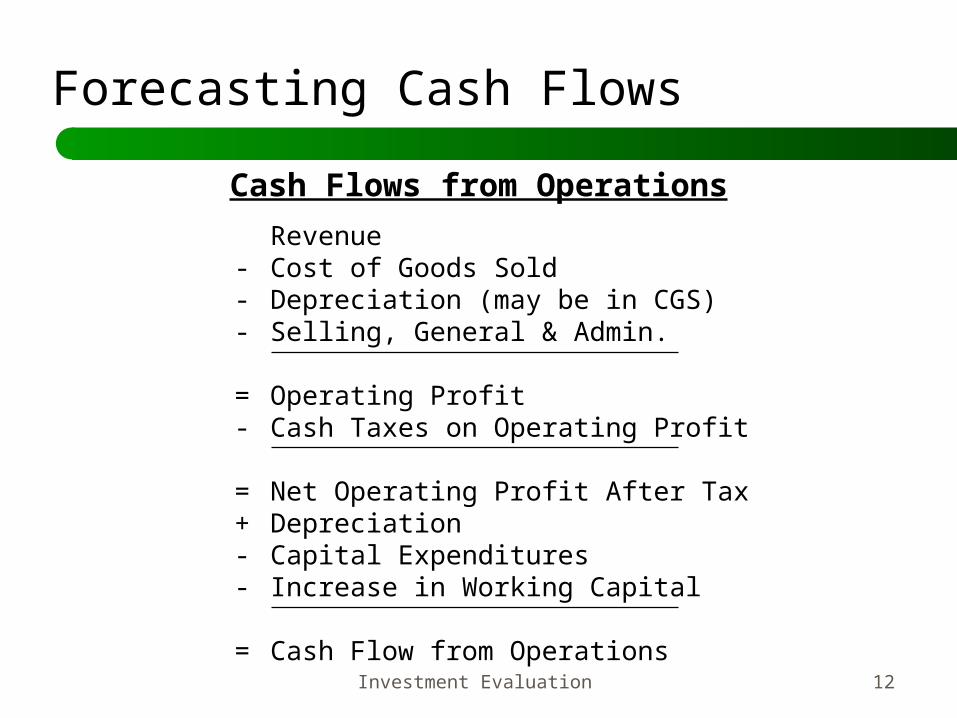
Forecasting Cash Flows
Cash Flows from Operations
Revenue- Cost of Goods Sold- Depreciation (may be in CGS)- Selling, General & Admin.
= Operating Profit- Cash Taxes on Operating Profit
= Net Operating Profit After Tax+ Depreciation- Capital Expenditures- Increase in Working Capital
= Cash Flow from Operations
Investment Evaluation 13
Forecasting Cash Flows
1) Depreciation is not a cash flow, but it affects taxationRevenue
- Cost of Goods Sold- Depreciation- Selling, General & Admin.
= Operating Profit- Cash Taxes on Operating Profit
= Net Operating Profit After Tax+ Depreciation- Capital Expenditures- Increase in Working Capital
= Cash Flow from Operations
Investment Evaluation 14
Forecasting Cash Flows
2) Do not ignore investment in fixed assets.
Revenue- Cost of Goods Sold- Depreciation- Selling, General & Admin.
= Operating Profit- Cash Taxes on Operating Profit
= Net Operating Profit After Tax+ Depreciation- Capital Expenditures- Increase in Working Capital
= Cash Flow from Operations
Investment Evaluation 15
Forecasting Cash Flows
3) Do not ignore investment in net working capital. Revenue
- Cost of Goods Sold- Depreciation- Selling, General & Admin.
= Operating Profit- Cash Taxes on Operating Profit
= Net Operating Profit After Tax+ Depreciation- Capital Expenditures- Increase in Working Capital
= Cash Flow from Operations
Investment Evaluation 16
Forecasting Cash Flows
There is an important distinction between the accounting definition of working capital and the economic/finance definition relevant to cash flows forecast. The distinction is a direct result of the
4th commandment above: We need the operating working capital, not the operating and financial working capital.
Investment Evaluation 17
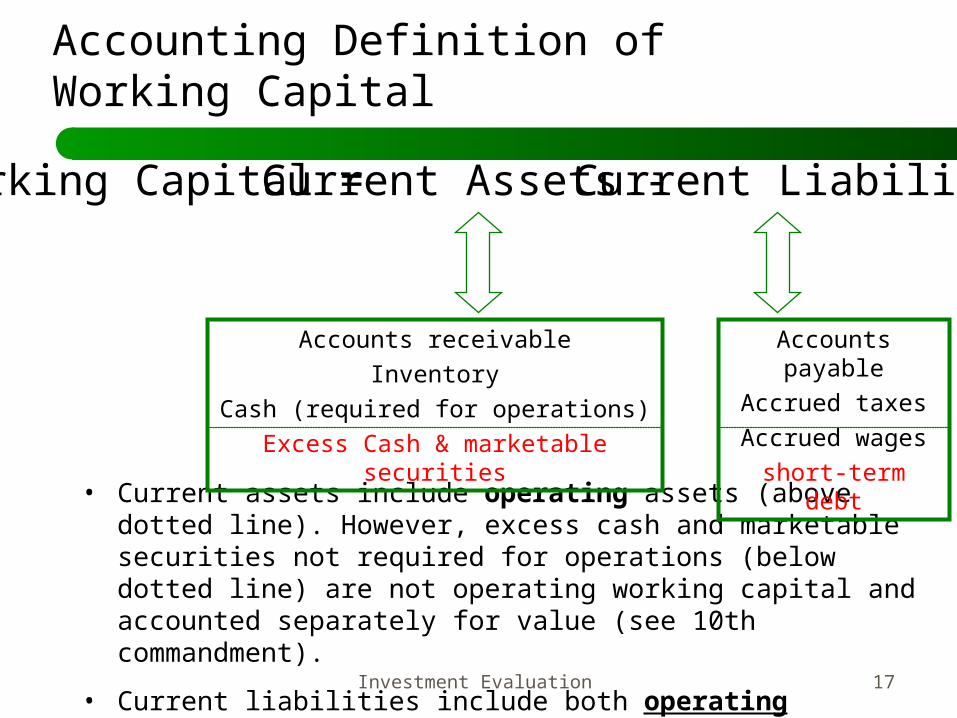
• Current assets include operating assets (above dotted line). However, excess cash and marketable securities not required for operations (below dotted line) are not operating working capital and accounted separately for value (see 10th commandment).
• Current liabilities include both operating liabilities (above the dotted line) and non-operating short-term debt (below the dotted line).
Accounting Definition of Working Capital
Accounts receivable
Inventory
Cash (required for operations)
Excess Cash & marketable securities
Accounts payable
Accrued taxes
Accrued wages
short-term debt
Working Capital = Current Assets - Current Liabilities
Investment Evaluation 18
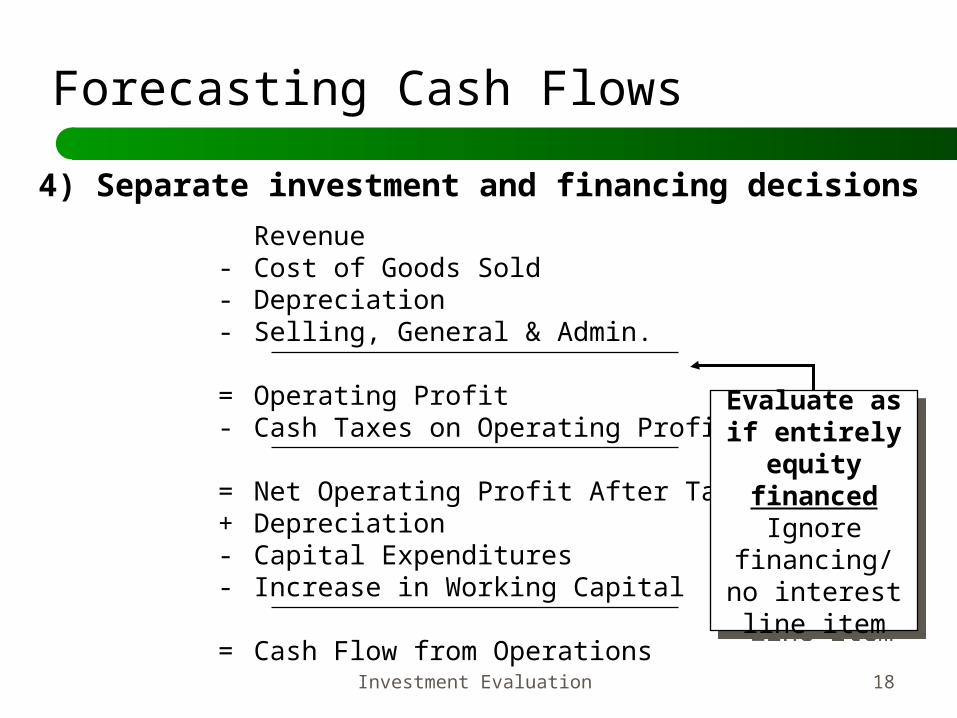
Forecasting Cash Flows
4) Separate investment and financing decisions
Revenue- Cost of Goods Sold- Depreciation- Selling, General & Admin.
= Operating Profit- Cash Taxes on Operating Profit
= Net Operating Profit After Tax+ Depreciation- Capital Expenditures- Increase in Working Capital
= Cash Flow from Operations
Evaluate as if entirely
equity financed
Ignore financing/no interest line item
Evaluate as if entirely
equity financed
Ignore financing/no interest line item
Investment Evaluation 19
Forecasting Cash Flows
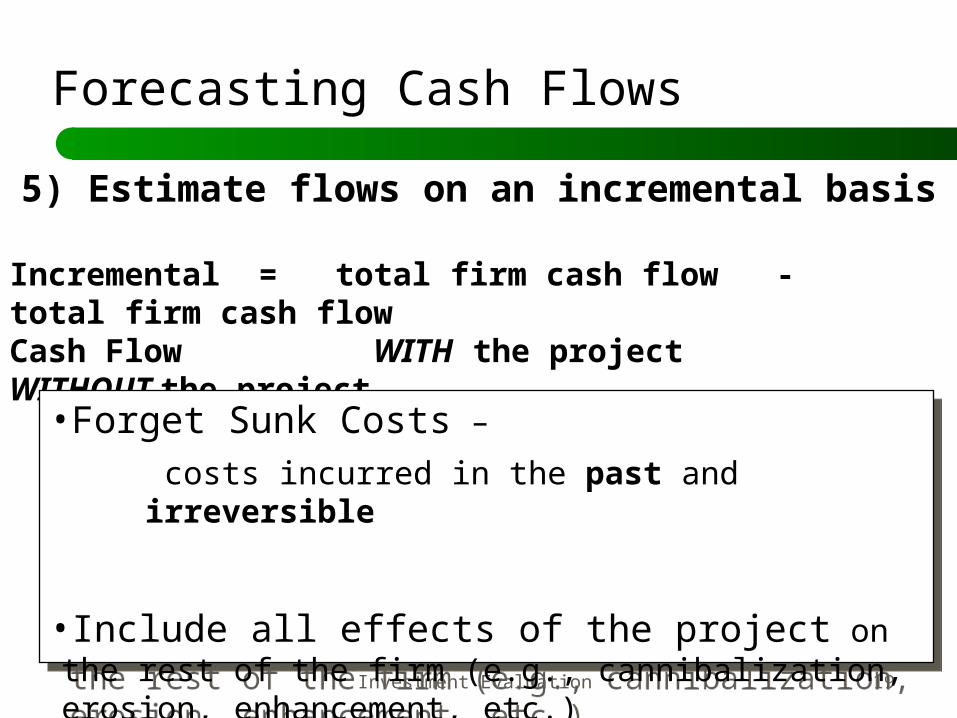
5) Estimate flows on an incremental basis
Incremental = total firm cash flow - total firm cash flow Cash Flow WITH the project WITHOUT the project
•Forget Sunk Costs –
costs incurred in the past and irreversible
•Include all effects of the project on the rest of the firm (e.g., cannibalization, erosion, enhancement, etc.)
•Forget Sunk Costs –
costs incurred in the past and irreversible
•Include all effects of the project on the rest of the firm (e.g., cannibalization, erosion, enhancement, etc.)
Investment Evaluation 20
Forecasting Cash Flows
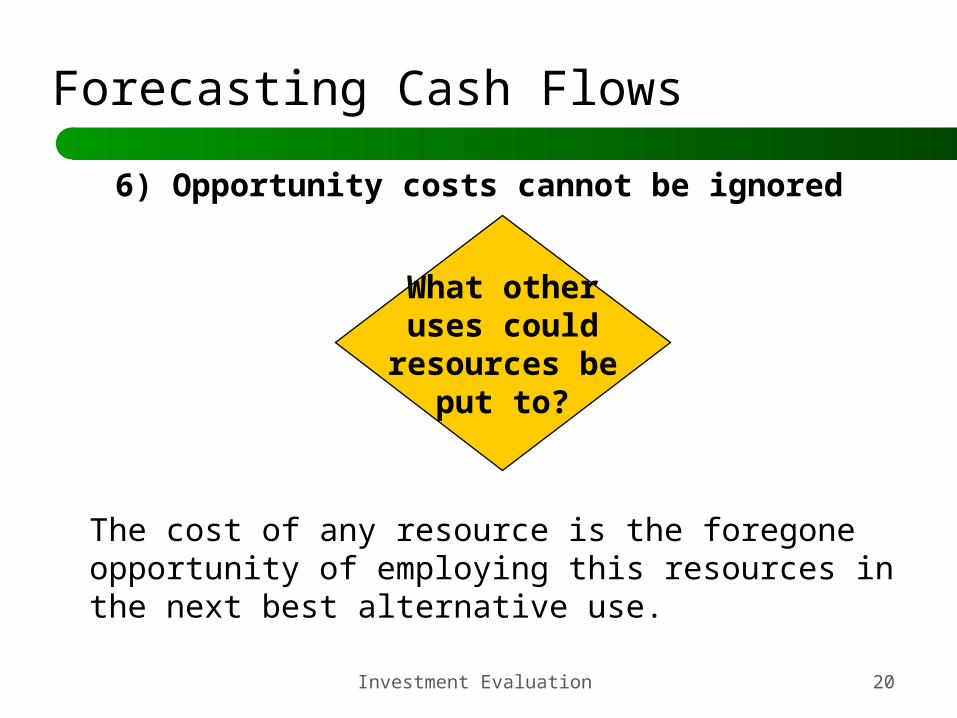
6) Opportunity costs cannot be ignored
What otheruses could
resources beput to?
The cost of any resource is the foregone opportunity of employing this resources in the next best alternative use.
Investment Evaluation 21
Forecasting Cash Flows
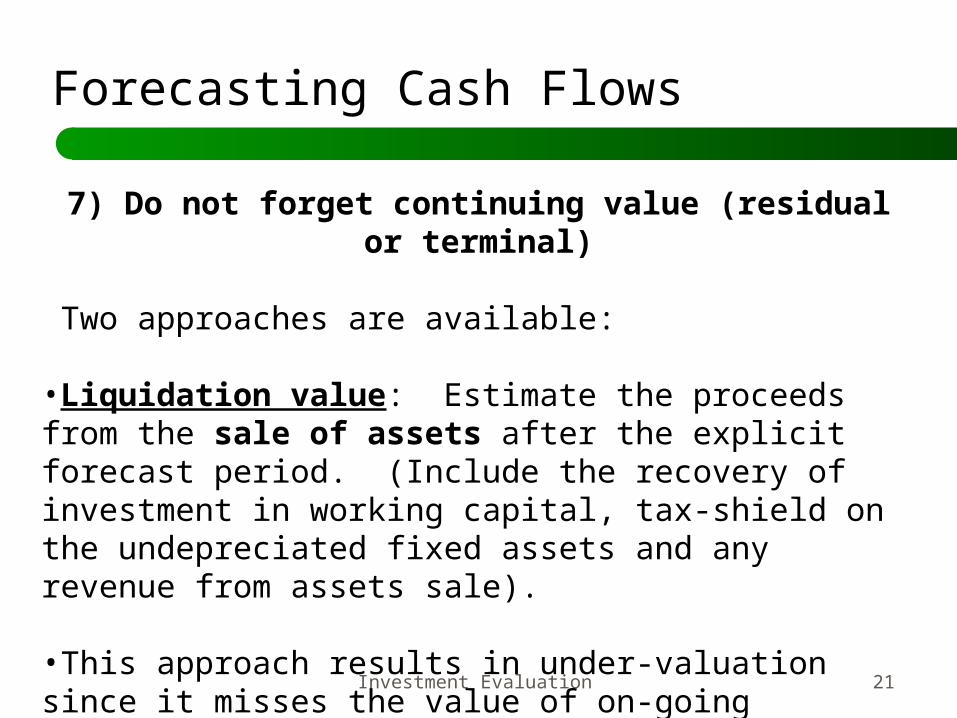
7) Do not forget continuing value (residual or terminal)
Two approaches are available:
•Liquidation value: Estimate the proceeds from the sale of assets after the explicit forecast period. (Include the recovery of investment in working capital, tax-shield on the undepreciated fixed assets and any revenue from assets sale). •This approach results in under-valuation since it misses the value of on-going business. It ignores the value of intangibles.
Investment Evaluation 22
Forecasting Cash Flows
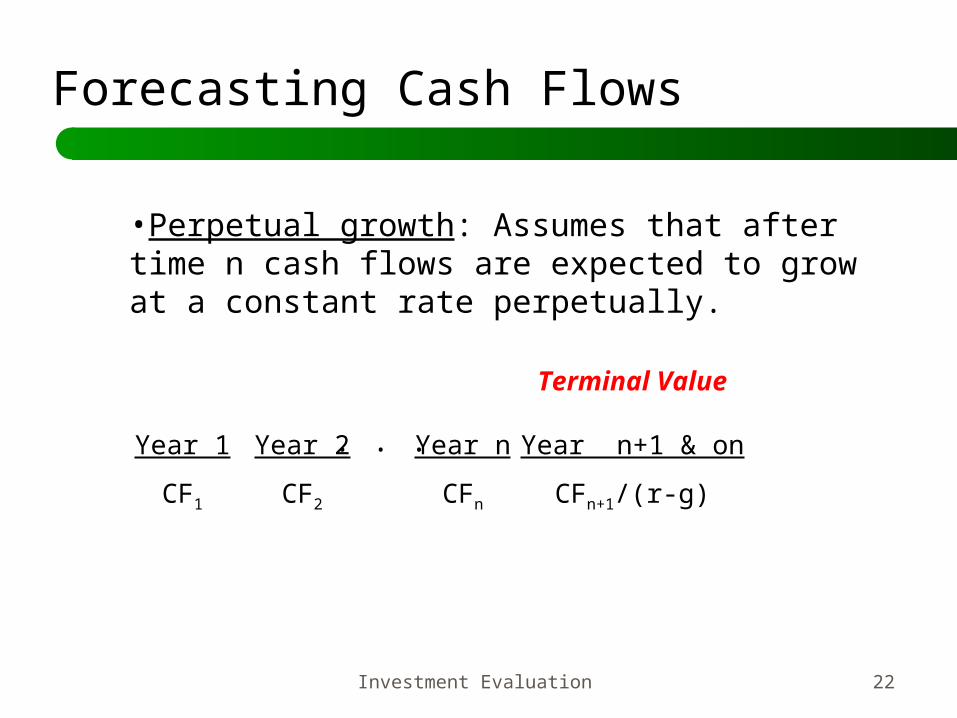
•Perpetual growth: Assumes that after time n cash flows are expected to grow at a constant rate perpetually.
Year 1
CF1
Year 2
CF2
Year n
CFn
. . .
Terminal Value
Year n+1 & on
CFn+1/(r-g)
Investment Evaluation 23
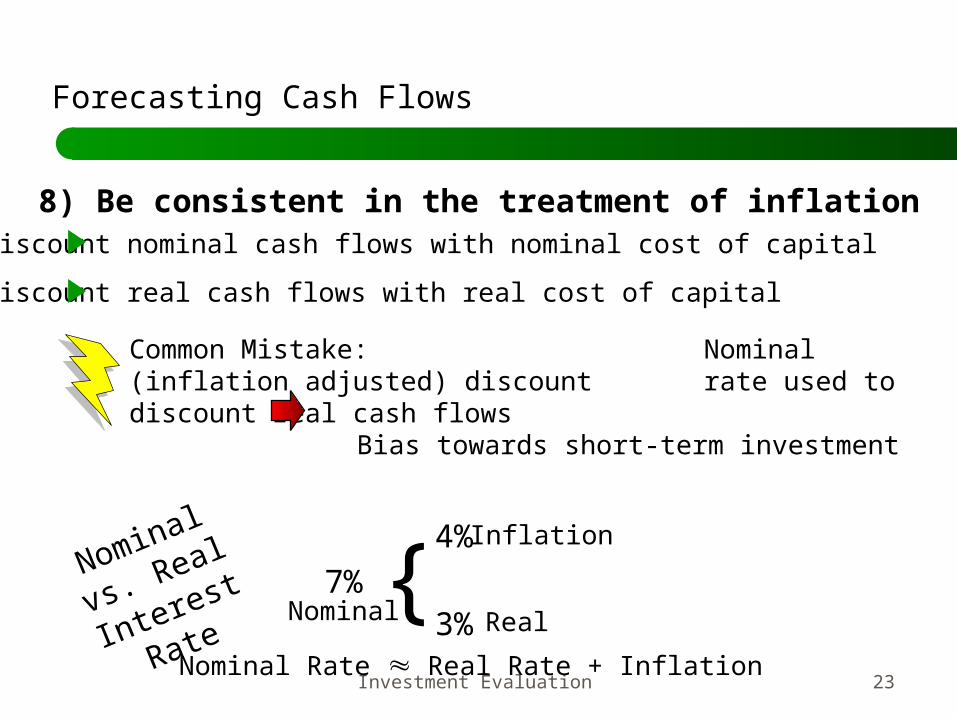
8) Be consistent in the treatment of inflationDiscount nominal cash flows with nominal cost of capital
Discount real cash flows with real cost of capital
Nominal Rate Real Rate + Inflation
Common Mistake: Nominal (inflation adjusted) discount rate used to discount real cash flows
Bias towards short-term investment
Nominal vs.
Real Interest
Rate7%
4%
3%Nominal
Inflation
Real{
Forecasting Cash Flows
Investment Evaluation 24
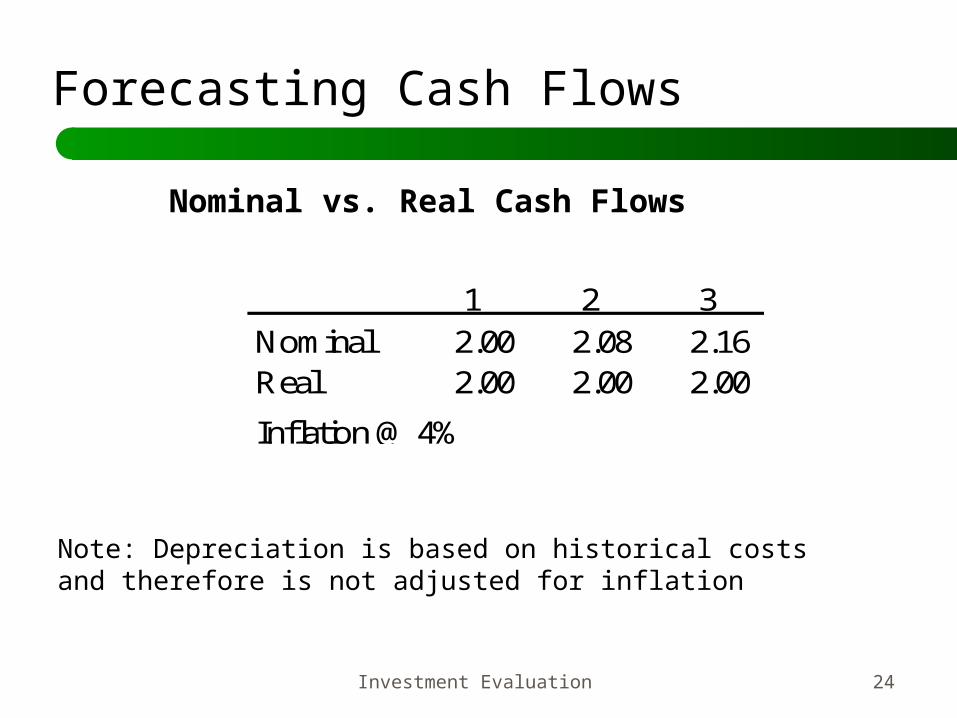
1 2 3Nominal 2.00 2.08 2.16 Real 2.00 2.00 2.00
Inflation @ 4%
Nominal vs. Real Cash Flows
Note: Depreciation is based on historical costs and therefore is not adjusted for inflation
Forecasting Cash Flows
Investment Evaluation 25
Forecasting Cash Flows
9) Overhead costs
Revenue- Cost of Goods Sold- Depreciation- Selling, General & Admin.
= Operating Profit- Cash Taxes on Operating Profit
= Net Operating Profit After Tax+ Depreciation- Capital Expenditures- Increase in Working Capital
= Cash Flow from Operations
Do not forget overheads and other indirect costs that increase due to the project
Do not forget overheads and other indirect costs that increase due to the project
Investment Evaluation 26
Forecasting Cash Flows
10) Include excess cash, excess real estate, unfunded (over-funded) pension funds, large stock
option obligationsYear 1
CF1
Year 2CF2
Year 3CF3
Year 4CF4
Year 5CF5
TerminalCFn+1/(r-g)
. . .
PV(Operating Cash Flows)+ Excess cash balance+ Excess marketable securities+ Excess real estate- Under-funded pension
=Value of the FIRM
Assets/Liabilities not required to support operations
Assets/Liabilities not required to support operations
Investment Evaluation 27
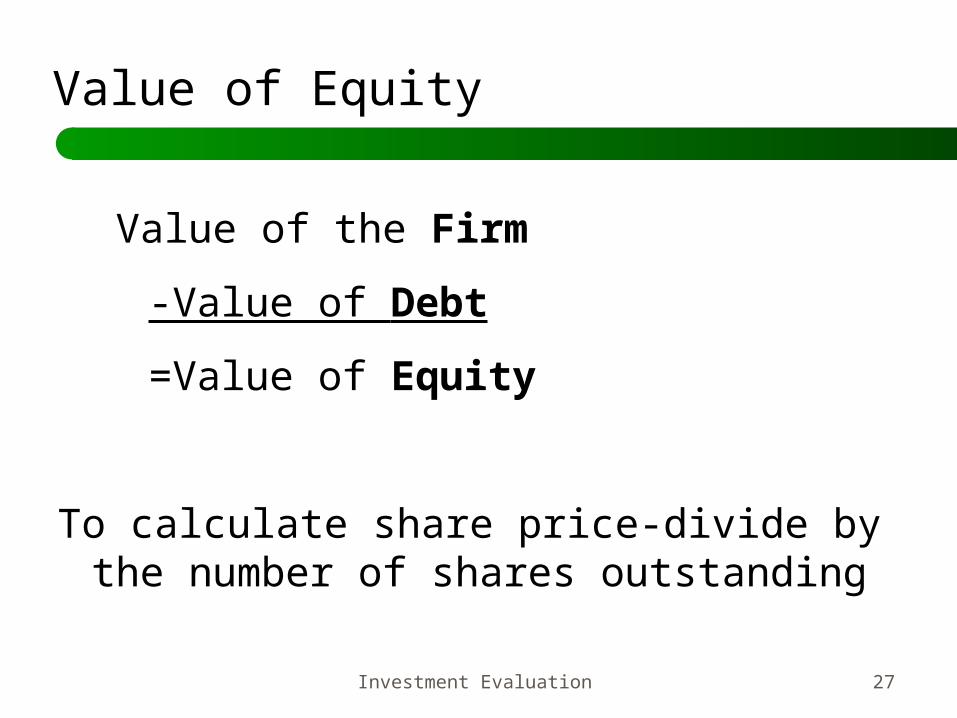
Value of the Firm
-Value of Debt
=Value of Equity
To calculate share price-divide by the number of shares outstanding
Value of Equity
Investment Evaluation 28
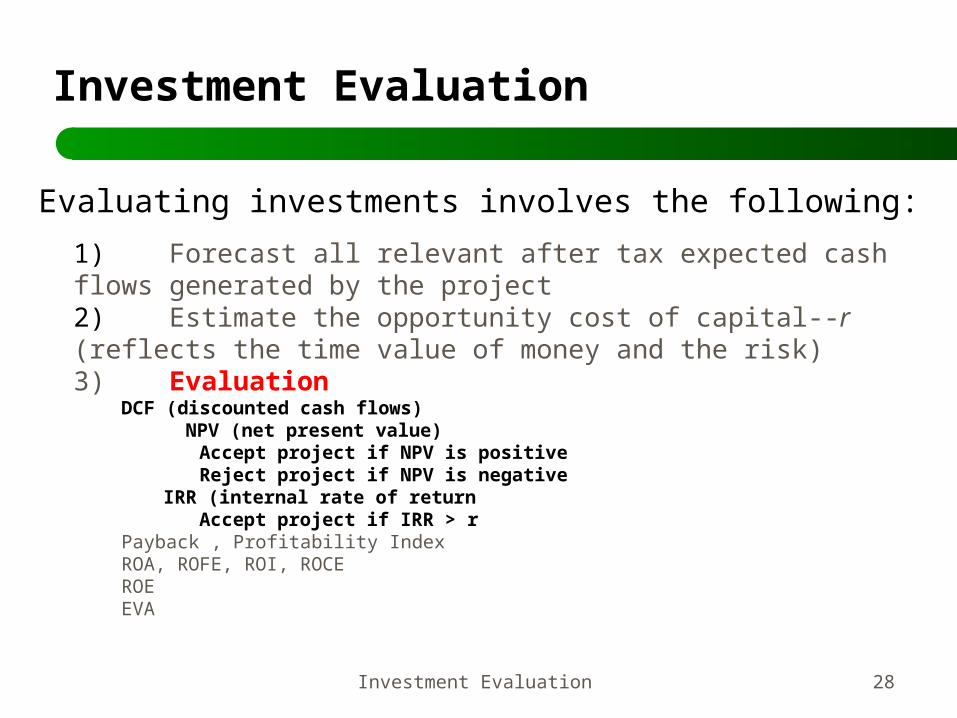
Investment Evaluation
Evaluating investments involves the following:
1) Forecast all relevant after tax expected cash flows generated by the project2) Estimate the opportunity cost of capital--r (reflects the time value of money and the risk)3) Evaluation
DCF (discounted cash flows) NPV (net present value)
Accept project if NPV is positiveReject project if NPV is negative
IRR (internal rate of returnAccept project if IRR > r
Payback , Profitability IndexROA, ROFE, ROI, ROCEROEEVA
Investment Evaluation 29
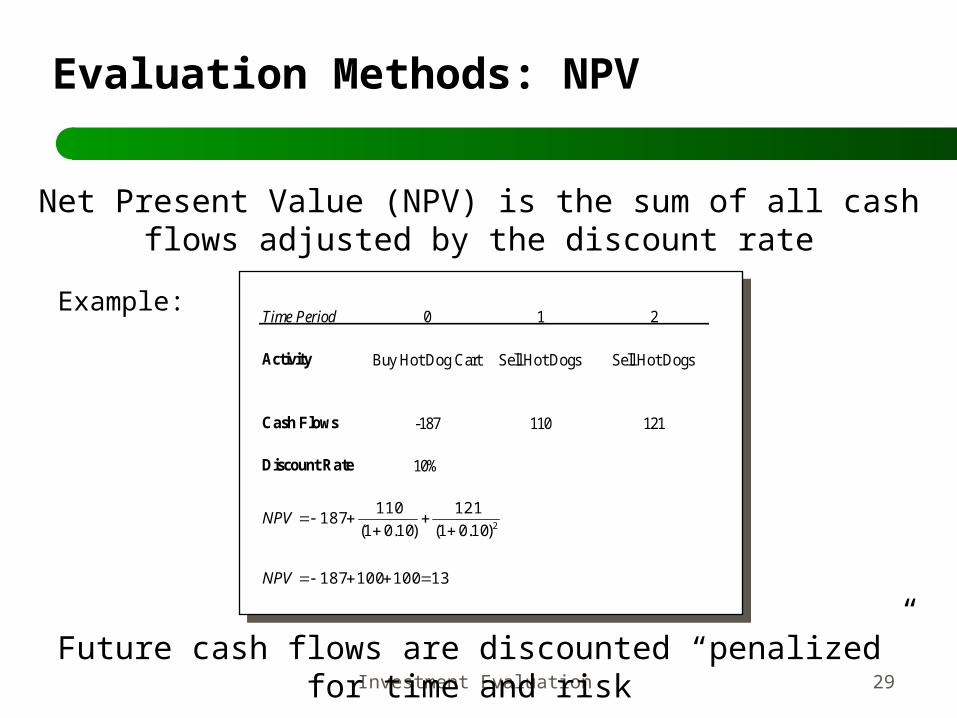
Evaluation Methods: NPV
Net Present Value (NPV) is the sum of all cash flows adjusted by the discount rate
Example: Time Period 0 1 2
Activity Buy Hot Dog Cart Sell Hot Dogs Sell Hot Dogs
Cash Flows -187 110 121
Discount Rate 10%
13100100187
)10.01(
121
)10.01(
110187
2
NPV
NPV
Future cash flows are discounted “penalized” for time and risk
Investment Evaluation 30
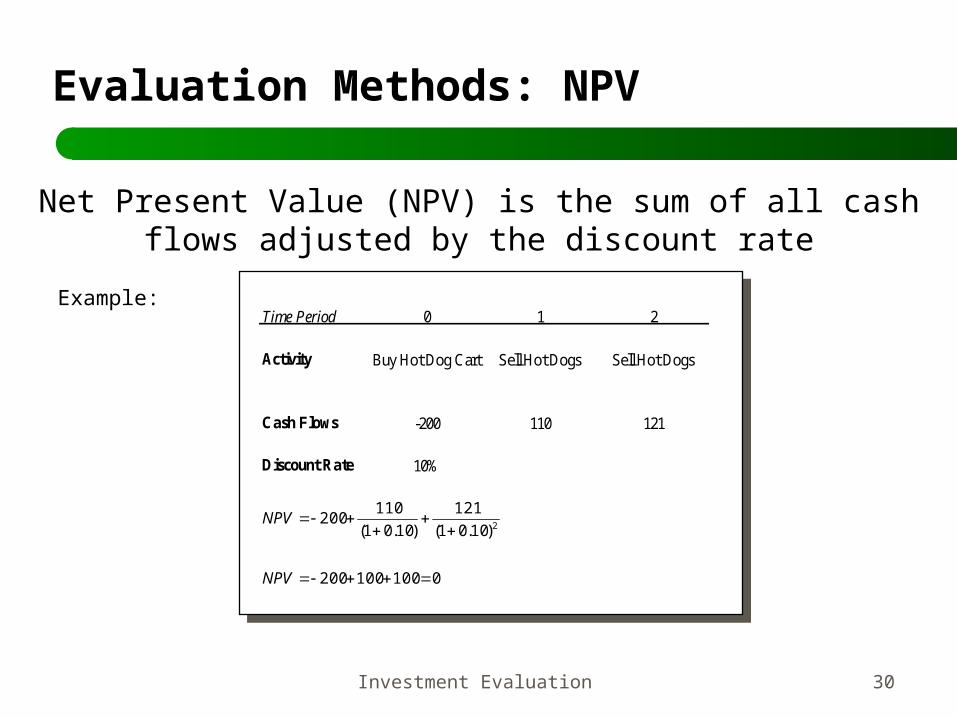
Evaluation Methods: NPV
Net Present Value (NPV) is the sum of all cash flows adjusted by the discount rate
Example:Time Period 0 1 2
Activity Buy Hot Dog Cart Sell Hot Dogs Sell Hot Dogs
Cash Flows -200 110 121
Discount Rate 10%
0100100200
)10.01(
121
)10.01(
110200
2
NPV
NPV
Investment Evaluation 31
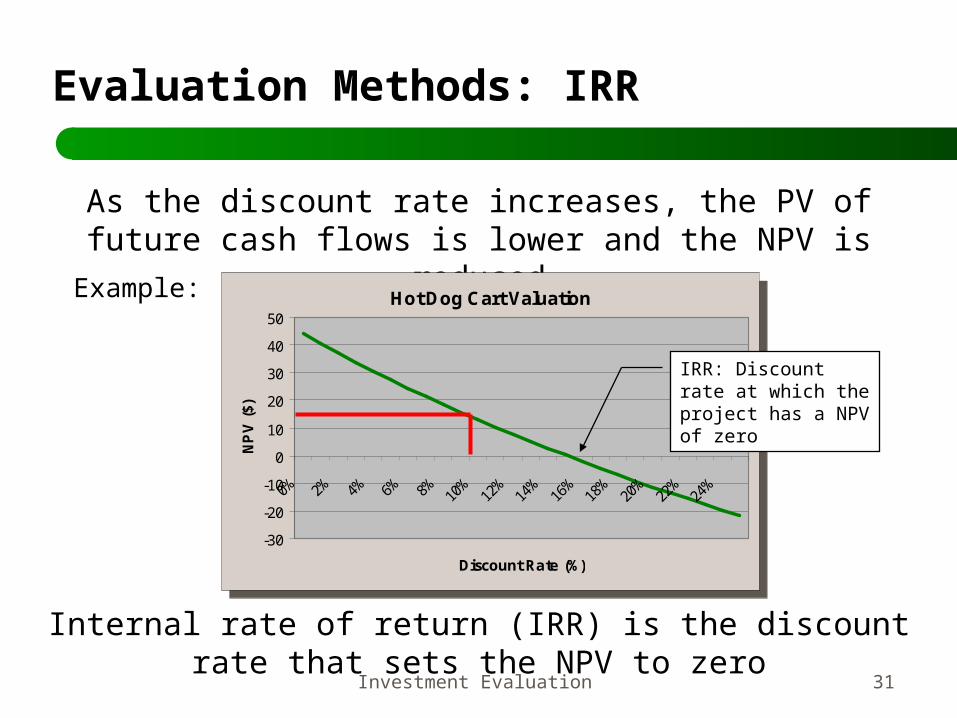
Evaluation Methods: IRR
As the discount rate increases, the PV of future cash flows is lower and the NPV is reduced
Example:Hot Dog Cart Valuation
-30
-20
-10
0
10
20
30
40
50
0% 2% 4% 6% 8% 10%
12%
14%
16%
18%
20%
22%
24%
Discount Rate (%)
NP
V (
$)
Hot Dog Cart Valuation
-30
-20
-10
0
10
20
30
40
50
0% 2% 4% 6% 8% 10%
12%
14%
16%
18%
20%
22%
24%
Discount Rate (%)
NP
V (
$)
Internal rate of return (IRR) is the discount rate that sets the NPV to zero
IRR: Discount rate at which the project has a NPV of zero
Investment Evaluation 32
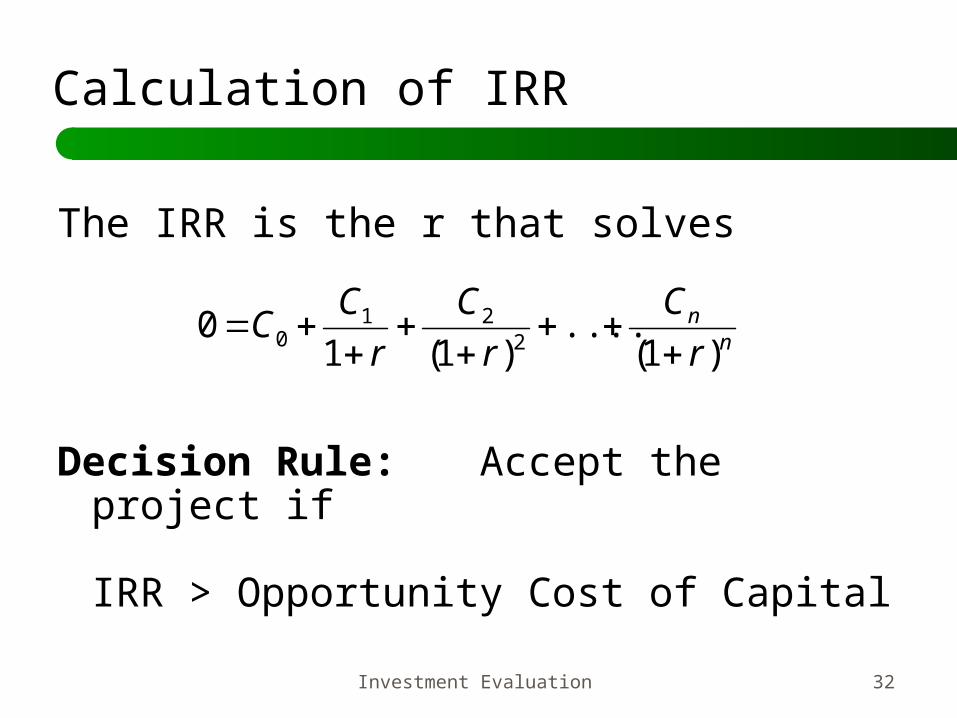
Calculation of IRR
The IRR is the r that solves
Decision Rule: Accept the project if
IRR > Opportunity Cost of Capital
nn
r
C
r
C
r
CC
)1(....
)1(10
221
0
Investment Evaluation 33
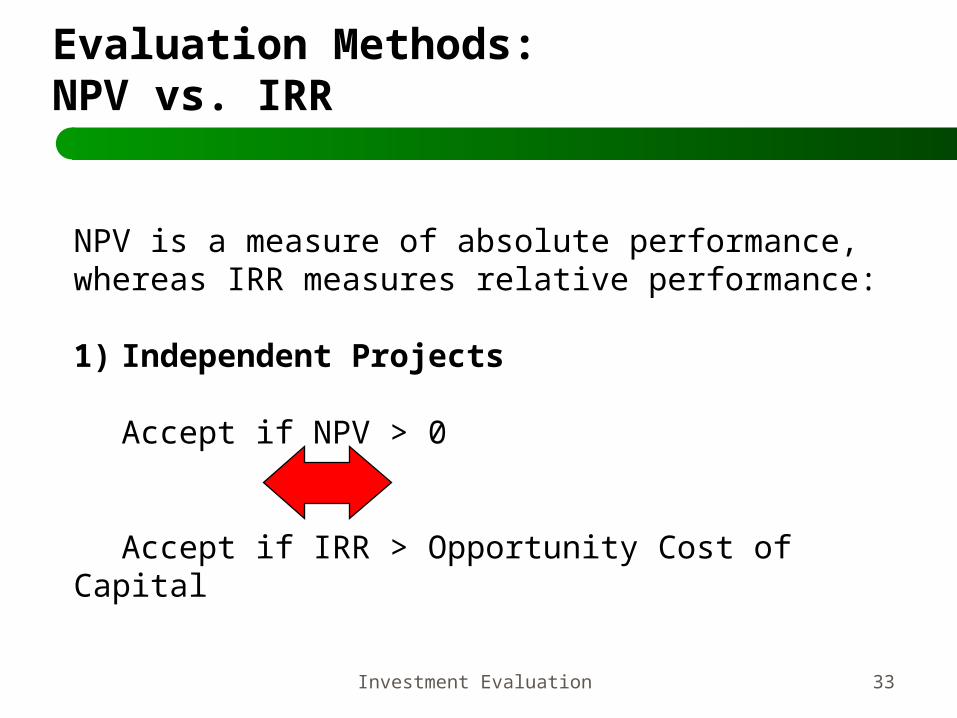
Evaluation Methods: NPV vs. IRR
NPV is a measure of absolute performance, whereas IRR measures relative performance:
1) Independent Projects
Accept if NPV > 0
Accept if IRR > Opportunity Cost of Capital
Investment Evaluation 34
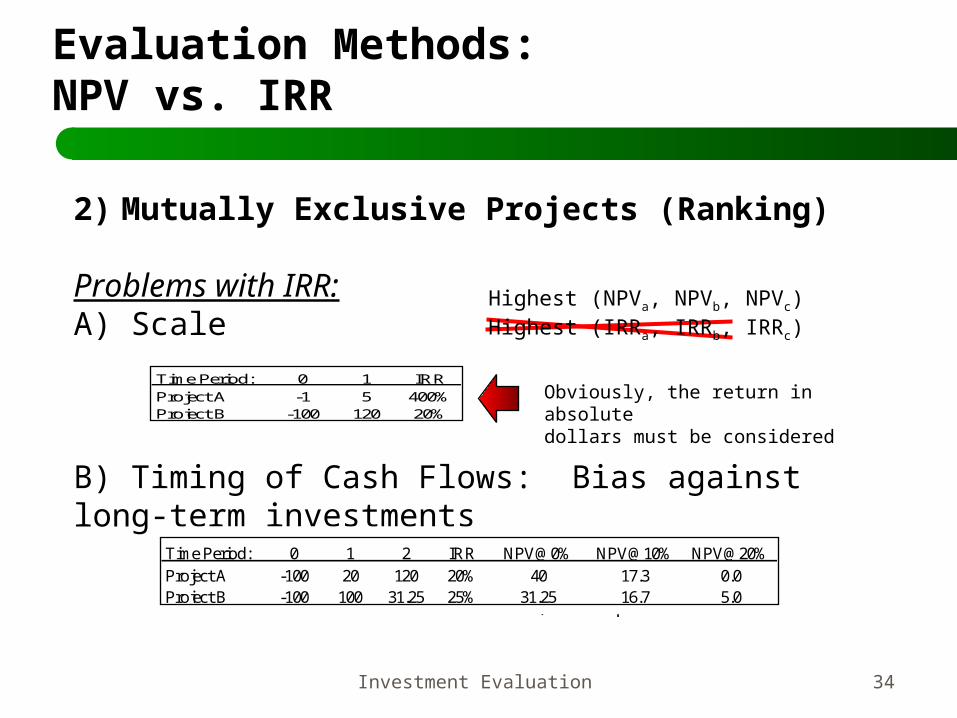
Evaluation Methods: NPV vs. IRR
2) Mutually Exclusive Projects (Ranking)
Problems with IRR:A) Scale
B) Timing of Cash Flows: Bias against long-term investments
Time Period: 0 1 IRRProject A -1 5 400%Project B -100 120 20%
Highest (NPVa, NPVb, NPVc)Highest (IRRa, IRRb, IRRc)
Obviously, the return in absolutedollars must be considered
Preference for CF early!But, it depends.
Time Period: 0 1 2Project A -100 20 120Project B -100 100 31.25
Time Period: 0 1 2 IRR NPV@0% NPV@10% NPV@20%Project A -100 20 120 20% 40 17.3 0.0Project B -100 100 31.25 25% 31.25 16.7 5.0
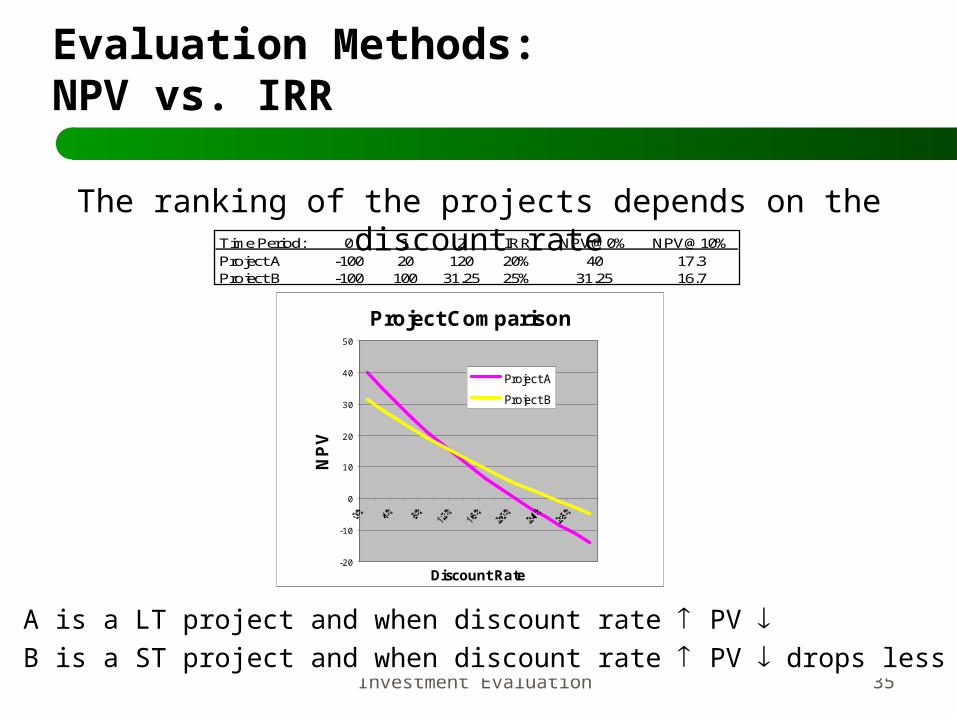
Investment Evaluation 35
The ranking of the projects depends on the discount rateTime Period: 0 1 2 IRR NPV@0% NPV@10%
Project A -100 20 120 20% 40 17.3Project B -100 100 31.25 25% 31.25 16.7
Project Comparison
-20
-10
0
10
20
30
40
50
Discount Rate
NP
V
Project A
Project B
A is a LT project and when discount rate PVB is a ST project and when discount rate PVdrops less
Evaluation Methods: NPV vs. IRR
Investment Evaluation 36
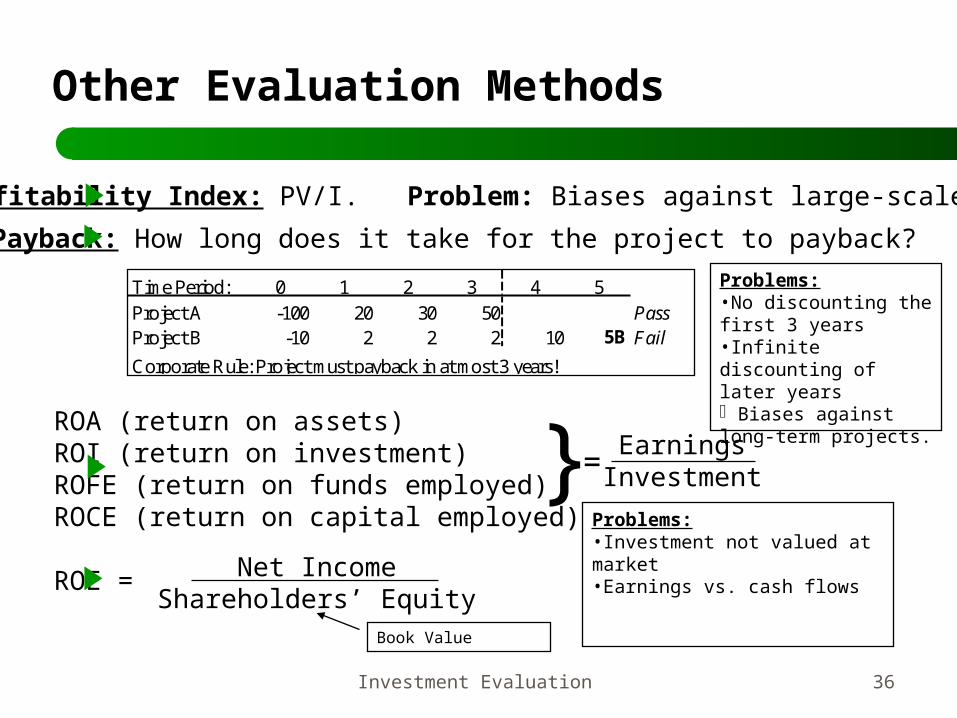
Other Evaluation Methods
Payback: How long does it take for the project to payback?
Time Period: 0 1 2 3 4 5Project A -100 20 30 50 PassProject B -10 2 2 2 10 5B Fail
Corporate Rule: Project must payback in at most 3 years!
Problems:•No discounting the first 3 years•Infinite discounting of later years Biases against long-term projects.ROA (return on assets)
ROI (return on investment)ROFE (return on funds employed)ROCE (return on capital employed)
ROE =
} EarningsInvestment=
Problems:•Investment not valued at market•Earnings vs. cash flows
Net IncomeShareholders’ Equity
Book Value
Profitability Index: PV/I. Problem: Biases against large-scale projects.


