OFFICIAL MASTER'S DEGREE IN THE ELECTRIC POWER INDUSTRY Master’s Thesis Investment Incentives and Tariff Design in a Meshed Offshore Grid Context Author: Leandro Lind Supervisor: Dr. Jean-Michel Glachant Co-Supervisor: Dr. Pradyumna Bhagwat Madrid, July 2017 UNIVERSIDAD PONTIFICIA COMILLAS ESCUELA TÉCNICA SUPERIOR DE INGENIERÍA (ICAI)
Transcript
OFFICIAL MASTER'S DEGREE IN THE ELECTRIC POWER INDUSTRY
Master’s Thesis
Investment Incentives and Tariff Design in a Meshed Offshore Grid Context
Author: Leandro Lind Supervisor: Dr. Jean-Michel Glachant Co-Supervisor: Dr. Pradyumna Bhagwat Madrid, July 2017
UNIVERSIDAD PONTIFICIA COMILLAS
ESCUELA TÉCNICA SUPERIOR DE INGENIERÍA (ICAI)
Official Master's Degree in the Electric Power lndustry (MEPI) Erasmus Mundus Joint Master in ·Economics and Management of Network Industries (EMIN)
Investment Incentives and Tariff Designin a Meshed Offshore Grid Context
by Leandro LIND
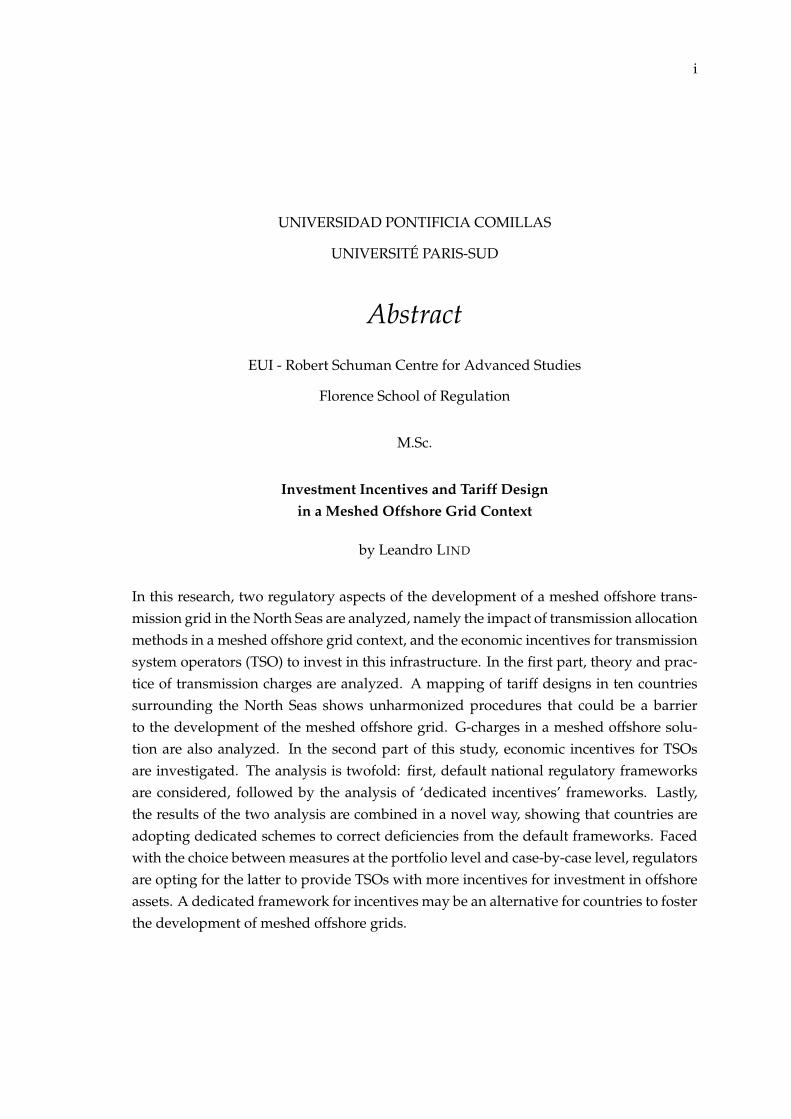
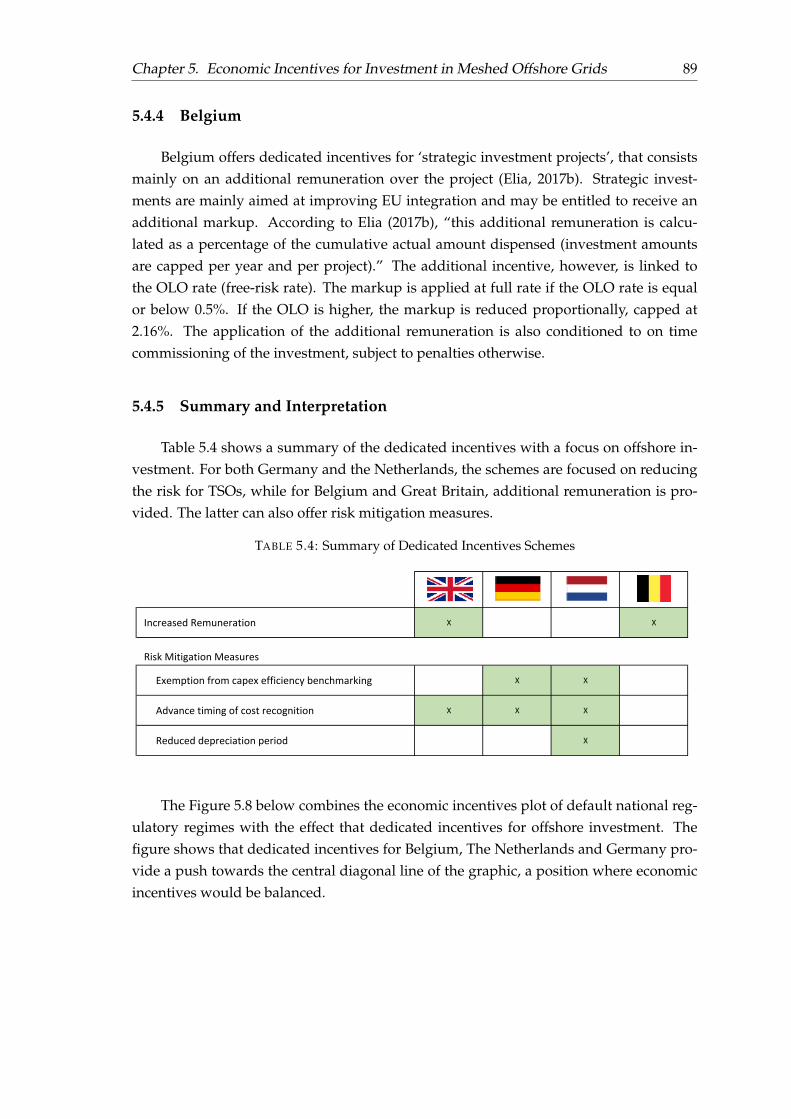
In this research, two regulatory aspects of the development of a meshed offshore trans-mission grid in the North Seas are analyzed, namely the impact of transmission allocationmethods in a meshed offshore grid context, and the economic incentives for transmissionsystem operators (TSO) to invest in this infrastructure. In the first part, theory and prac-tice of transmission charges are analyzed. A mapping of tariff designs in ten countriessurrounding the North Seas shows unharmonized procedures that could be a barrierto the development of the meshed offshore grid. G-charges in a meshed offshore solu-tion are also analyzed. In the second part of this study, economic incentives for TSOsare investigated. The analysis is twofold: first, default national regulatory frameworksare considered, followed by the analysis of ‘dedicated incentives’ frameworks. Lastly,the results of the two analysis are combined in a novel way, showing that countries areadopting dedicated schemes to correct deficiencies from the default frameworks. Facedwith the choice between measures at the portfolio level and case-by-case level, regulatorsare opting for the latter to provide TSOs with more incentives for investment in offshoreassets. A dedicated framework for incentives may be an alternative for countries to fosterthe development of meshed offshore grids.
AcknowledgementsFirst of all, I would like to thank the European Commission and the Erasmus+ Pro-
gramme for the opportunity that was given to me. The Erasmus Mundus Joint Masterin Economics and Management of Network Industries was not only a master’s course. Itwas a period of personal, academic and professional growth that changed my life.
I would like to thank also all my good friends from EMIN, especially Aleksandr,Dessireé, and Isaac, with whom I shared most of the past two years and with whom Icould learn, laugh, share the good and the bad moments. To my dear friend Nuria Roy,there is not a single day I don’t think about you. I wish you were here with us at thismoment.
To my canım Deniz, thank you for being at my side during all moments! =)
A big thank you to all friends from Madrid, Paris, and Florence. You made thisjourney incredibly joyful.
I also thank Prof. Jean-Michel Glachant for the opportunity of writing this master’sthesis at the Florence School of Regulation and for his supervision. Moreover, I thankPradyumna and Tim for the daily discussions and friendship. It was a pleasure to sharethe dungeons with you! I also say a big thank you to all the FSR team, with whom Ilearned a lot and enjoyed great moments.
I could not forget all my friends and family back home. To my parents, I say thankyou for everything you’ve done so I could be here, finishing this master’s thesis rightnow. To my friends in Brazil, I miss you all, and I hope to see you soon. Special thanks tothe members of the Orange Table Order: Bruno, Luiz Paulo, Paulo and Zenir.
Finally, I thank the coordinators of the EMIN program, Prof. Luis Olmos, fromComillas, and Prof. Serge Pajak, from Paris-Sud, for the excellence of the courses andall the academic support during these past two years. Thanks also to Sara Tamarit andMyriam Turpin for all the support and for making our stay in Madrid and Paris so mucheasier.
4.1 Summary of the transmission tariff structure in Belgium . . . . . . . . . . 444.2 Summary of the transmission tariff structure in Denmark . . . . . . . . . . 444.3 Summary of the transmission tariff structure in France . . . . . . . . . . . 454.4 Summary of the transmission tariff structure in Germany . . . . . . . . . . 454.5 Summary of the transmission tariff structure in Great Britain . . . . . . . . 464.6 Summary of the transmission tariff structure in Northern Ireland . . . . . 474.7 Summary of the transmission tariff structure in Ireland . . . . . . . . . . . 474.8 Summary of the transmission tariff structure in The Netherlands . . . . . 484.9 Summary of the transmission tariff structure in Norway . . . . . . . . . . . 484.10 Summary of the transmission tariff structure in Sweden . . . . . . . . . . . 494.11 Summarizing transmission charging design in the North Seas . . . . . . . 50
5.1 Summary of main risk factors in meshed offshore grids . . . . . . . . . . . 705.2 National Grid’s cost of capital allowed under RIIO . . . . . . . . . . . . . . 785.3 Summary of Default National Framework’s Characteristics . . . . . . . . . 855.4 Summary of Dedicated Incentives Schemes . . . . . . . . . . . . . . . . . . 89
ix
For Nuria Roy
1
Chapter 1
Introduction
Offshore wind is expected to play a major role in enabling the EU to meet its green-house gas (GHG) reduction and renewable energy target in the near and long-term future(European Commission, 2015). The recent offshore wind tenders in Germany which hada minimum price of 0.00 e/KWh (BMWi, 2017) provide a clear insight into the viabilityof this technology.
The development of a robust offshore electricity grid infrastructure has the potentialto deliver many benefits. Firstly, offshore grid infrastructure is regarded crucial for theintegration of renewable energy sources. Secondly, having a robust offshore grid infras-tructure connecting overseas markets would have a strong positive impact on long-termas well as the short-term security of supply (European Commission, 2016). Thirdly, by in-vesting in offshore grid infrastructure, more precisely in subsea interconnectors, electric-ity markets can be coupled across the sea, allowing a more efficient dispatch of generationand an overall increase in social welfare. Additionally, by coupling markets, the liquidityof the markets would be augmented, and more competition would be introduced.
Several studies (Cole et al., 2015; Egerer, Kunz, and Hirschhausen, 2013; EuropeanCommission, 2014a; NSCOGI, 2012c) show that a meshed offshore grid in the North Seaswould lead to maximisation of the total net benefits. A recent report of the EuropeanCommission (EC) demonstrates a potential for saving up to e5.1 billion in the referenceyear 2030 to be made by building a meshed grid instead of stand-alone connections ofwind farms and point-to-point interconnectors (European Commission, 2014a). How-ever, the development of this offshore meshed electricity grid in the North Seas would bean incremental process rather than through a so-called ‘big bang’ approach, even if thecoastal states could easily agree on this as a mutually beneficial objective. It is likely thatdevelopers will concentrate in short to medium term on building small-scale infrastruc-ture projects including interconnectors to which wind farms are attached. Over the longrun, these interconnections could then be linked with each other to create a regional grid(Woolley, 2013).
Chapter 1. Introduction 2
1.1 Motivation
Meshed offshore grids will connect offshore wind farms (OWF) to the main grids,increase the interconnection among countries, contribute to increasing the reliability ofsystems and to the achievement of renewables targets. However, the development of ameshed offshore grid still depends on the clarification of several important topics, rang-ing from technological components to legislation. As of today, these topics are like piecesof a big puzzle, yet to be identified and connected together.
Economic and regulatory aspects of meshed offshore grid play a central role asdrivers for the development of such infrastructure, and often these topics are linked,as transmission businesses are regulated activities. As shown by European Commission(2016), many are the regulatory challenges, from the planning phase of the meshed solu-tion, through the investment phase, to the operation of the offshore grid.
Answers are needed to make meshed offshore grids a reality, and therefore a greatopportunity for research exists, and some of the questions were still no sufficiently ex-plored by literature. Therefore, this thesis is devoted to the analysis of two of these reg-ulatory aspects, to the understanding of these two pieces that later will connect to themeshed offshore puzzle.
1.2 Research Objectives
This thesis is focused on the analysis of two regulatory challenges for the develop-ment of a meshed offshore grid in the North Seas. The first one is the impact of transmis-sion charges on the development of this infrastructure. Transmission System Operators(TSO) recover a big part of their costs through transmission charges, and this will also betrue for the recovery of assets in a meshed offshore grid. Moreover, transmission charges,as of today, can impact both investments decisions in offshore power, and operational de-cisions for OWFs. Transmission System Operators (TSO) can also be impacted, as OWFslocated in other TSO’s system, connected to the offshore grid, will use their infrastructure.
Therefore, the first objective is to identify how transmission charges will impact thedevelopment of the meshed offshore grid and what problems related to transmissioncharging may arise in an offshore grid context.
The second aspect to be investigated is related to the economic incentives for thedevelopment of the offshore grid. We focus specifically on the economic incentives forTSOs, as they seem to be the most prominent parties to carry the necessary investments,at least in the early stages of this development 1. Meshed offshore grids are expected tobe riskier than other types of transmission investments, and therefore, in order to carry
1Note that other types of companies may also be expected to invest in a meshed offshore solution. Formore details, please see Chapter 5.
Chapter 1. Introduction 3
the necessary investments, TSOs will expect the right remuneration for the risks they willbear. It is the regulator’s task to set this remuneration, as well as the basket of risks thatwill be carried by TSO.
The challenges involved in this analysis include the definition of the meshed offshoregrid from an investment perspective, so one can compare the level of the risk againstother types of investments TSOs already make. Understand what are economic incen-tives, which are the current levels of incentives at important countries of the North Seasand how countries could provide appropriate incentives for the investments in offshoregrids is the second objective of this thesis.
Therefore, the second objective is to understand if the current economic incentivesfor TSOs in the North Seas are suitable for the development of a meshed offshore grid.
For both parts of this study, a qualitative analysis will be conducted.
1.3 Thesis Outline
This thesis is divided into five chapters. Chapter 2 provides the reader with a map-ping of the relevant literature regarding the investigation on meshed offshore grids. InChapter 3, a literature review is made, identifying the pieces that compose the meshedoffshore grid puzzle, what are the main barriers in each of them, and how they linktogether. The Chapter 4 explores transmission cost allocation in a meshed offshore gridcontext, as described previously. Chapter 5 investigates the economic incentives for TSOsto invest in the offshore grid. Both Chapters 4 and 5 contain interim conclusions with themost relevant findings on each topic. Chapter 6 concludes the thesis.
4
Chapter 2
Mapping the Literature
2.1 Introduction
In this chapter, the most relevant literature on offshore grids will be identified andclassified. Considering that the specific topics on this thesis (transmission tariffs and eco-nomic incentives for meshed offshore grids) were not directly researched extensively, theliterature to be used later in the development combines works focused on the character-istics of meshed offshore grids and studies providing methodologies for the analysis oftransmission tariffs and economic incentives.
The literature on the development of a meshed offshore grid is recent and is stillbeing developed. No meshed offshore solution has been built as of the writing of thisstudy. Consequently, the literature around the topic is also a work in progress. Thesource for the most substantial studies on this topic can be traced to two origins, namelyresearch projects, usually promoted by the European Union, and the ones coming fromacademia, including Ph.D. researches and scientific articles.
The studies directly related to meshed offshore grids will be the source of infor-mation and data for the analysis in later chapters. However, further literature is alsorequired to build a theoretical framework to analyzes the topic just described. For thatmatter, the appropriate literature will be introduced in the respective Chapters 4 and 5,as the will support the construction of the analytical frameworks. In this chapter andChapter 3, the focus is on the studies dealing with aspects of offshore grids.
The objective of this mapping of the literature is not going into the discussion of theconclusions provided by the authors, but rather provide a reference of the most relevantwork made in the field, as well as identify the main challenges for the development of ameshed offshore grid. The following Chapter 3 will provide a complete literature review,diving into the main challenges and exploring the state of the art in the research of eachof one them.
Finally, it is important to mention that another great volume of reports and publi-cations are also used in the development part of this thesis, including information fromTSO’s websites, NRA’s websites, European institutions such as ACER, ENTSO-e, CEER
Chapter 2. Mapping the Literature 5
and the European Commission, and also the relevant regulation in place. These publi-cation are not identified in this literature mapping, as they are primary sources of infor-mation rather than a source of technical or scientific content. These publications are the"data" of this thesis.
The mapping of the literature is structured as follows. The first section maps themain research projects on meshed offshore grids, usually promoted by the EU. The sec-ond section explores the academic literature on meshed offshore grids, highlighting im-portant Ph.D. researches and published articles. The third section summarizes.
2.2 Research Projects
Meshed offshore grids exist only in theory as of the writing of this thesis. Meshedoffshore grids can be seen as a particular form of a Supergrid (Schröder, 2013). Supergridshave been imagined ever since the beginning of the use of the HVDC technology, morespecifically after the installation of the HVDC Gotland link in Sweden, the first commer-cial transmission line of its kind. However, most of the proposals of Supergrids before2005 were more of visions than concrete plans for the development of the infrastructure.
FIGURE 2.1: Suggestion of a EU Supergrid by ABB in 1992. Source: ABBCommunications, 2009
After the introduction of a strong push towards decarbonization in the EuropeanUnion in the early 2000’s, countries started to consider the Supergrids, and more pre-cisely, meshed offshore grids as a mean to contribute to the achievement of such environ-mental targets. The period was marked by the fast growth of renewables in the Europeancountries’ energy mixes, and wind power has been the main responsible for this expan-sion of renewables. With dropping costs for offshore installations and the necessity tofind additional sites for wind farms, offshore projects started to become more practical.
Chapter 2. Mapping the Literature 6
At the same moment, European institutions began important research projects and polit-ical initiatives for the development of a meshed offshore grid in the North Seas.
2.2.1 OffshoreGrid Project
The first comprehensive project to evaluate a future meshed offshore grid was theOffshoreGrid project, funded by the European Commission through the Intelligent En-ergy Europe Programme. This project was conducted from 2009 to 2011 and was final-ized with the presentation of the Final Report in October of 2011 (OffshoreGrid, 2011).According to the document, the main objectives of the project were to provide recom-mendations on topology and dimensioning of the meshed offshore grid, guidelines forinvestment decision and trigger a coordinated approach with the Mediterranean ring 1.
The project conducted a techno-economic assessment of a future meshed offshoregrid and compared the results with a base case in which OWFs are connected directlyto the shore. Using a projection to 2030, the project concluded that a meshed solution isindeed more beneficial than a future with only individual connections farm-to-shore.
The project is important not only for the results it achieves but also for the defini-tions and understanding of meshed offshore solutions. An important set of definitionsis regarding the type of infrastructures possible in a meshed solution. According to Off-shoreGrid (2011), they are:
FIGURE 2.2: Illustration of a Connection country-to-country
• Wind farm hubs: Instead of connecting wind farms individually to the shore, theycan be grouped by the use of hubs, and then connected to the shore by one singlecable.
1The Mediterranean Ring or MEDRING is an energy project interconnect the countries of the Mediter-ranean basin through electricity and gas exchange (European Parliament, 2011).
Chapter 2. Mapping the Literature 7
FIGURE 2.3: Illustration of a wind farm hub2
• Tee-in connection: The Tee-in connection is composed by one OWF connected toone country-to-country connection.
FIGURE 2.4: Illustration of a tee-in connection
• Hub-to-hub connection: This infrastructure is composed by a wind farm hub con-nected to another wind farm hub.
FIGURE 2.5: Illustration of a hub-to-hub connection
Considering the four infrastructures described above, the project simulates the de-velopment of the offshore grid following two different approaches, one called the “DirectDesign” and the other called the “Split Design”.
• Direct Design: in the beginning, interconnectors (connection country-to-country)are build. When interconnectors are no more beneficial, tee-in, hub-to-hub andconnections among them are built.
2Note that the graphical representation of a wind turbine represents a wind farm, composed of dozens ofwind turbines.
Chapter 2. Mapping the Literature 8
• Split Design: The driver for this approach is not the interconnector, but the windfarms. It starts by building lower-cost interconnectors by splitting wind farm con-nections to two shores and then integrating with other structures in a meshed grid.
The conclusions from the study are that both the Direct Design and the Split Designwill generate benefits higher than the individual connections only. For the simulationcarried by the project, the benefits are calculated in e25 billion for the Direct Design ande16 billion for the Split Design over a 25 years lifetime, compared to the base case.
FIGURE 2.6: Representation for the Direct Design. Source: OffshoreGrid,2011
2.2.2 The North Seas Countries’ Offshore Grid Initiative
In 2010, The North Seas Countries’ Offshore Grid Initiative (NSCOGI) was formedby the signature of Memorandum of Understanding (MoU) among ten countries aroundthe North Seas. They are Belgium, Denmark, France, Germany, Ireland, Luxembourg,the Netherlands, Sweden and the United Kingdom. The cooperation group was createdfollowing the European Economic Recovery plan, more specifically the Regulation (EC)663/2009 that provided financial stimulus for the development of the cooperation. Infact, the NSCOGI is more than a research project, is regional cooperation to facilitate andcoordinate the development of a meshed offshore grid in the region.
On the research side of the cooperation, three Working Groups (WG) were estab-lished.
Chapter 2. Mapping the Literature 9
• Working Group 1: Grid configuration
• Working Group 2: Regulatory issues
• Working Group 3: Planning and Permitting
The Working Group 1 followed a similar approach as the one used by the Offshore-Grid Project, in which a future meshed offshore grid is simulated and compared to the‘business as usual’ (BAU) scenario composed of radial connections and interconnectors.On the identification of topology patterns and strategies for development of the offshoregrid, the Work Group 1 also provide useful classification and insights. The study showsthat a possible meshed network will start from the already existing radial scenario, mov-ing to an international coordination scenario to finally become a meshed grid.
The Working Group 2 is responsible for studying regulatory and economic aspects ofthe meshed offshore grids. In the first deliverable (NSCOGI, 2012e), NSCOGI identifiesthe most important incompatibilities of national markets and regulatory regimes with ameshed offshore grid. The project carried a survey with the ten countries involved. Fromthe answers received, NSCOGI identified six main topics in which regulatory differencesamong countries may impose barriers to the development of a meshed offshore grid, aslisted bellow:
1. Financing, construction, and ownership
2. Compatibility of offshore regulatory regimes and network designs
3. Approach to system operation (balancing and ancillary services)
4. Financial support, grid access regime and charging requirements for offshore gen-eration
Chapter 2. Mapping the Literature 10
5. Wholesale power market interactions
6. Roles and responsibilities of institutions
In the Deliverable 3 (NSCOGI, 2012a), NSCOGI explores the Cross-Border Cost Allo-cation (CBCA) problem. They WG2 describes five different cost allocation methods andanalyzes them using nine criteria in order to assess the robustness of the options. Theallocation methods are used in a hypothetical project providing a comparison of resultsfor the options. The conclusions are insightful and show that no single method copeswith all criteria, pointing trade-offs among them.
The Deliverable 5 (NSCOGI, 2012b) deals with market design questions in a meshedoffshore grid. This questions are analyzed based on a tee-connection, exploring whatcould be the possibilities for an OWF to sell the energy. The identification of in whichhub the OWF belongs to and in which bidding zone it is allowed to trade is not trivialand will impact on the decision of the OWF owner.
2.2.3 NorthSeaGrid Project
The NorthSeaGrid (NorthSeaGrid, 2015) is another project promoted by the EU’sIntelligent Energy Europe (IEE) program. The aim of the project is to provide a techno-economic study on the optimal design for a meshed grid in the North Seas, as well asprovide solutions for financial and regulatory barriers. The project uses three real casestudies to develop its analysis. The first one is the German Bight case, the second is theBenelux-UK, and the third is the UK-NO case, as illustrated by Figure 2.8 below.
FIGURE 2.8: NorthSeaGrid Case Studies. Source: NorthSeaGrid, 2015
The project concludes that integrated designs are more beneficial than the equivalentisolated configurations. This happens due to the fact that in the integrated solutions,generally lower material requirements are observed, and therefore costs are reduced. Onthe benefits side, those tend to be higher, as the utilization of the infrastructure is greateras well as network security in the case an export cable fails (NorthSeaGrid, 2015).
Chapter 2. Mapping the Literature 11
The project notes, however, that benefits are highly sensitive to the characteristicsof the next-generation of the system. Therefore the application of conventional CBCAmethods may result in unbalanced outcomes. The project proposes the use of “PositiveNet Benefit Differential” method. The report also notes the regulatory challenge concern-ing the OWF connected to more than one country. In this situation, following the currentregulation, OWFs can only feed into the grid of the country that provides the supportscheme (if any). This may be a barrier in a meshed offshore scenario and will create atleast uncertainty for the OWF developer.
2.2.4 European Commission Reports
The European Commission recently published two comprehensive reports regardingthe development of the meshed grid in the North Seas (European Commission, 2014a; Eu-ropean Commission, 2016). Both reports were prepared by external institutions, namelyTractebel Engineering, Ecofys and PricewaterhouseCoopers (PWC).
The report from 2014 (European Commission, 2014a) is named ‘Study of the Benefitsof a Meshed Offshore Grid in Northern Seas Region’ and comprises a real size optimiza-tion of the European system that optimizes the configuration of a meshed offshore gridin the North Seas. Like previous studies, this one also compares the result of a meshedsolution and with a base scenario with only radial connections. It is interesting to notethat this model uses elements of market design and topology types identified both in theOffshoreGrid project (OffshoreGrid, 2011) and the NOSCOGI project (NSCOGI, 2012e;NSCOGI, 2012a; NSCOGI, 2012b).
The conclusions show that the coordinated solution is more beneficial than the business-as-usual (radial connections) scenario. According to the report, the integrated grid is ex-pected to provide savings in losses, CO2 emissions and generation of e1.5 to 5.1 billionper year compared to the radial solution.
Chapter 2. Mapping the Literature 12
FIGURE 2.9: Regulatory Barriers’ Evaluation. Source: European Commis-sion, 2016
The second report issued by the European Commission in 2016 (European Commis-sion, 2016) is a long identification of regulatory matters concerning the development ofthe meshed offshore grid in the North Seas. To carry this research, the authors conductedstakeholder consultations, workshops and research, and concluded the study by present-ing a toolkit of regulatory models to be used by governments and the EU.
2.2.5 THINK Project
The THINK Project was founded by the European Commission FP7 program. Thisproject was coordinated by the Florence School of Regulation and counted with the con-tribution of another 16 partner institutions. Conducted from 2010 to 2013, the project cov-ered twelve topics in energy policy aiming to contribute to the European Commission’s(DG Energy) needs. One of this topics, the Topic 5 (Meeus et al., 2012), dealt specificallywith offshore grids.
The report focused on the regulatory barriers to the meshed offshore grid develop-ment. The analysis considered the differences in the development of combined solutions,shore-to-shore standalone lines, and farm-to-shore standalone lines. The research alsodevelops an analytical framework composed by three guiding principles, namely theplanning principle, competition and the ‘beneficiary pays’ principle.
Chapter 2. Mapping the Literature 13
The planning principle states that transmission expansion should be coordinatedwith the demand for transmission, also considering economies of scale and network ex-ternalities. This principle may be simpler to achieve in an onshore grid, in which trans-mission planning is usually done in a centralized fashion. The second principle high-lights the importance of the competition in the investment on offshore assets. The com-petition can be introduced by tendering the lines, for instance. This mechanism reducesthe asymmetry of information created by a TSO-led model between the TSO and the reg-ulator. The third and last principle is the “beneficiary pays” concept. Allocation costs tothose who benefit from the investment is an efficient way of sending economic signalsfor investment. Agents are expected to internalize the costs into their decision.
After defining the types of infrastructure and the guiding principles of the analyticalframework, the report investigates case studies for each type of infrastructure. In re-gard to shore-to-shore lines, three interconnectors are analyzed, namely the NorNed, theEstlink, and the Nemo interconnectors. For farm-to-shore investments, not projects butnational regulatory practices are evaluated. In this section, the countries considered areGermany, the United Kingdom, and Sweden. Finally, combined solutions are considered.The analyzed projects are Kriegers Flak, the Cobra cable and the Moray Firth projects.
The conclusions of the research identifies five key difficulties and propose respectiveremedies for the obstacles mentioned, as shown in the following table.
TABLE 2.1: Difficulties and Remedies for Offshore Grids
Key difficulties Remedies
National frames for transmission invest-ments that are not aligned
Harmonize regulatory frames for off-shore transmission investments towardsthe three guiding principles of an eco-nomically sound frame discussed in thereport, i.e. planning, competition andbeneficiaries pay.
National renewable support schemes thatare not aligned Multi-stakeholder settingwith winners and losers
Harmonize the renewable supportschemes for offshore wind farms
Offshore grid technology developmentconstrained by typical R&D market fail-ures
Facilitate the ex-ante allocation of costsand benefits of offshore transmission in-vestments
Sequential decision process in a contextof uncertainty and irreversibility
Speed-up offshore grid technology devel-opment
Source: Meeus et al., 2012
Chapter 2. Mapping the Literature 14
2.2.6 ISLES Project
The Irish-Scottish Links on Energy Study (ISLES) is an initiative from the govern-ments of Scotland, the Republic of Ireland and Northern Ireland to study a potentialoffshore grid in the region. More than a research project on the benefits of an integratedsolution, ISLES aims a concrete implementation in the near future. The project is partof the PCI3 list. This project is particularly relevant for the meshed offshore discussion,as the reports produced also provide insights applicable to other meshed offshore initia-tives.
The project was divided into two phase. The first one, called ISLES I, was devel-oped from 2010 until 2012. The primary objective of this phase of was to evaluate thefeasibility of the project. Already at this phase of the project, important concepts of themeshed grid were explored. While one report examines the economic and business case(ISLES Project, 2012b), the second deals with regulatory issues on a cross-jurisdictionalenvironment (ISLES Project, 2012a).
In the economic report (ISLES Project, 2012b), the project makes important consider-ations on market design, for instance, in which market the offshore wind farms will be-long to4. Based on these market configurations, the second report (ISLES Project, 2012a)investigates what would be the regulatory barriers in which one. Comparing a “busi-ness as usual” scenario with an “integrated regulatory concept”, topics like the degreeof complexity in developing from status quo, the risk of EU legal challenge, difficultiesin financing, misalignments in the treatment of generation resource across jurisdictions,and stakeholders’ resistance are studied. These considerations are important not only inthe context of the ISLES project, but they be adapted to the analysis of a larger meshedoffshore grid scenario.
The second phase of the project, called ISLES II, was concluded in 2015, and it isalso a valuable source for the meshed offshore grid discussion. In the report “NetworkRegulation and Market Alignment Study” (ISLES Project, 2015), the project makes severalrecommendations addressing barriers to the coordinated development. Benefits of themeshed grid are also identified and calculated.
3Project of common interest 1.9.2, under the Northern Seas offshore grid corridor.4These aspects of the meshed offshore grid are further explored in the Chapter 3.
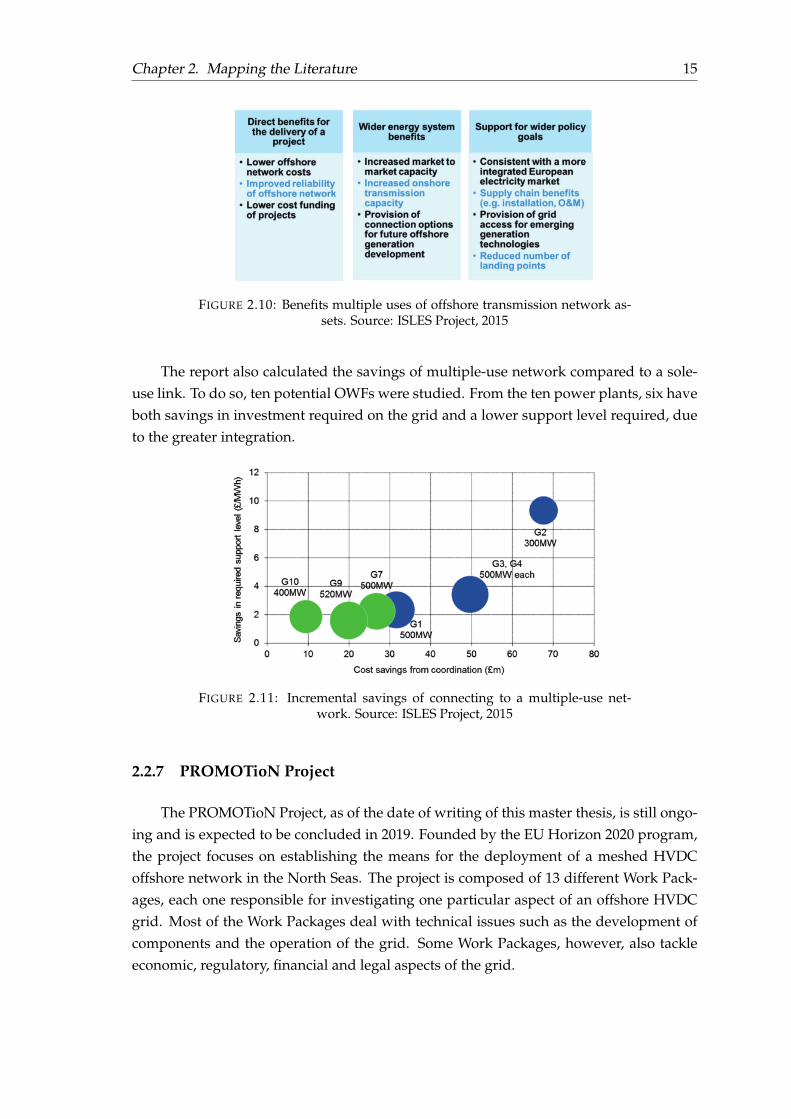
The report also calculated the savings of multiple-use network compared to a sole-use link. To do so, ten potential OWFs were studied. From the ten power plants, six haveboth savings in investment required on the grid and a lower support level required, dueto the greater integration.
FIGURE 2.11: Incremental savings of connecting to a multiple-use net-work. Source: ISLES Project, 2015
2.2.7 PROMOTioN Project
The PROMOTioN Project, as of the date of writing of this master thesis, is still ongo-ing and is expected to be concluded in 2019. Founded by the EU Horizon 2020 program,the project focuses on establishing the means for the deployment of a meshed HVDCoffshore network in the North Seas. The project is composed of 13 different Work Pack-ages, each one responsible for investigating one particular aspect of an offshore HVDCgrid. Most of the Work Packages deal with technical issues such as the development ofcomponents and the operation of the grid. Some Work Packages, however, also tackleeconomic, regulatory, financial and legal aspects of the grid.
Chapter 2. Mapping the Literature 16
From what has already been published, two reports may be of interest for one study-ing the regulation of the meshed offshore grid. The first one is the Deliverable 1.3 (PRO-MOTioN Project, 2016) offers a comprehensive literature review of the meshed offshoregrid discussion. The Deliverable 1.4 (PROMOTioN Project, 2016) provides a referencecase and topology identification for further analysis of a meshed solution in the NorthSeas.
Further publications are expected on regulatory and economic matters.
2.3 Academic Literature
2.3.1 S.T. Schröder, “Wind energy in offshore grids”, DTU Management En-gineering, 2013
Sascha T. Schröder presented in 2013 his Ph.D. thesis (Schröder, 2013) that combinesa series of studies regarding offshore grids. The topics analyzed by the author includecapacity allocation, market design, compressed air storage in offshore grids, joint supportschemes and curtailment of renewables. The biggest contribution of this Ph.D. thesis isin the operation phase of a meshed offshore grid. Market design rules indeed impose abig challenge for the development of a meshed solution.
The previous studies made an effort in identifying possibilities for OWF participa-tion in the market (e.g. NSCOGI, 2012b). Schröder goes one step further and considersthe effects of the balancing mechanism in an offshore scenario. He argues that, depend-ing on the imbalances rules and the spot rules applied, sub-optimal results may arise, asOWF developers will try to maximize profits. As the author explains “the results displayedin Paper III5 indicate that a regulatory constellation leading to strategic gaming can arise andthat it may be desirable to avoid it for optimal socio-economic outcomes.”
The Ph.D. thesis also discusses relevant topics such as joint support schemes for thedeployment of OFWs and capacity allocation.
2.3.2 H. Müller, “A Legal Framework for a Transnational Offshore Grid inThe North Sea”, University of Groningen, 2015
The Ph.D. wrote by Müller (Müller, 2015) thesis provides an extensive legal analysisof the offshore grid. The establishment of this infrastructure in the North Seas may en-counter several legal barriers, as the development will take place in a multi-jurisdictionalenvironment. Considering also that the meshed offshore grid will be located on thesea, not only national and European legislation is applicable, but also international law.
5Schröder, S. T. (2011) Electricity market design in offshore grids – strategic incentives under differentregulatory regimes
Chapter 2. Mapping the Literature 17
Therefore, the author analyzes these three legal layers (international, European and na-tional) and identifies what the possible legal barriers are.
The analysis is made for four different types of connection, a similar classification tothe one proposed by the OffshoreGrid project (OffshoreGrid, 2011). The author lists thetypes of connection as radial connections, offshore hubs, connection with two or morecountries, and connections in a meshed grid, as illustrated by Figure 2.12. For each struc-ture, the author identifies the relevant legislation in the three layers, points barriers andfinally proposes recommendations for a future approach.
Regarding national law, the author selects four coastal states for the analysis, namelyGermany, Denmark, The Netherlands, and the United Kingdom. Müller observes a trendin these four states towards a more coordinated approach to both offshore wind devel-opment and offshore network development. On the infrastructure side, he notes thatnational regulation development tends to happen in a stepwise manner. On a first stage,the lines connecting the OWF to the shore are considered as part of the OWF’s infrastruc-ture, and therefore the developer is the one responsible for building such connection. Ona second stage, when distances from the shore rise, the connection becomes a separateactivity and is transferred to the TSO. On a third stage, not only the TSO is responsiblefor building the connection, but also to cluster wind farms into hubs. This step is alreadybeing taken by Germany, The Netherlands, and Belgium.
2.3.3 Key Publications on Periodic Journals
Over the past few year, the interest for meshed offshore grids has grown, and a num-ber of important publications have already been made. The following paragraphs try tosummarize the most relevant contribution on the economics and regulation of meshedoffshore grids.
Some papers explore specifically economic and regulatory characteristics of offshorewind power. Although they don’t address the meshed offshore grid directly, they provideimportant interpretation of the current scenario in offshore wind. These researches areuseful for a later use in the research of a meshed scenario. Green and Vasilakos (2011)explores the economics behind offshore wind, with great focus on the support policiesnecessary to develop the technology.
Fitch-Roy (2015) carries an important analysis of the governance in offshore wind.He establishes a framework consisting of four criteria. The first one is the allocation of theseabed, in which he identifies that government can use an “open-door” approach, mean-ing that OWF developers are responsible for proposing the siting, a “zoned” approach,where governments define some broad zones in which construction is possible, and a“defined-site” approach. The second criterion is the granting of development rights.Some countries oblige developers to go through multiple permitting agents, while other
Chapter 2. Mapping the Literature 18
have a “one stop shop” approach. The third criterion is the responsibility for the connec-tion. In some countries this is done by the developer, in others, it is the TSO’s responsi-bility, and in some others a third party is responsible. The last criterion is the financialsettlement, meaning the characteristics of the support scheme. Using this frameworkto analyze five countries (United Kingdom, Germany, Denmark, Belgium, and Nether-lands), the author observes that countries seem to be moving towards similar governancearrangements. He argues that for some of the governance aspects (e.g. support schemes),the EU has a bigger role in leading the harmonization. For some other aspects, the EUhas acted in a more reactive way. The paper suggests that some policies of the earlier in-novative countries might have been “uploaded” to the EU level, and later “downloaded”by the other Member States.
Modeling the meshed offshore grids, calculation its overall benefits and estimatingits future topology under different scenarios is already a well-explored topic in the lit-erature. Gorenstein Dedecca and Hakvoort (2016) provides an extensive review of theresearch projects and academic papers on this subject, as well as a classification of themodels used. Hadush, De Jonghe, and Belmans (2015) provides a particular model forCBCA calculation on the offshore grid design.
Chapter 2. Mapping the Literature 19
2.4 Summary of Meshed Offshore Grid Literature
TABLE 2.2: Summary of Meshed Offshore Grid Literature
Off
shor
eGri
dPr
ojec
t
NSC
OG
I
Nor
thSe
aGri
d
EC20
14
EC20
16
TH
INK
Rep
ort
ISLE
SPro
ject
PRO
MO
TioN
Schr
öder
Mül
ler
Modeling Meshed Offshore GridsIdentification of Types of Topologies x x x x xModeling Costs and Benefits x x x x x xModeling the Expected Grid x x x x x
Legal Aspects x
Regulatory and Economic AspectsPlanning x x x xPermitting x x xCoordination Onshore-Offshore x x x x x x
InvestmentCBA Methodology x xCBCA Methodology x x xJoint Support Schemes x xInvestment Incentives x xFinancing of Meshed Offshore Grids x x x
Market DesignTrading Rules(bidding zones) x x xCapacity Allocation Rules x x xBalancing Rules x xAncillary Services x xGrid Access and Transmission Charging x
Chapter 2. Mapping the Literature 20
FIGURE 2.12: Types of connections by H. Müller. Source: Müller, 2015
Option 1: radial connection of offshore wind farms and point to point connection
Option 2: clustering of offshore wind farms via offshore hubs
Option 3: connection of offshore wind farms with two or more countries
Option 4: connection of offshore wind farms into a meshed offshore grid
21
Chapter 3
Meshed Offshore Grid: Pieces of apuzzle
The development of a meshed offshore grid in the North Seas is expected to bringgreat benefit to the region, as mentioned in Chapter 1. However, many barriers will haveto be overcome before the deployment of such infrastructure can be completed. Theseassets will apply new technologies, will lie on a multi-jurisdictional environment, andwill depend on the coordinated actions of several agents. Moreover, it is a greenfielddevelopment, taking into account that no hybrid asset has ever been built. To makethe meshed offshore grid a reality, many aspects have yet to be understood, developed,and linked together, like the pieces of a jigsaw puzzle, revealing, in the end, the desiredpicture. The objective of this chapter is to provide the reader with an overview of whatare the many pieces of this puzzle, and what are the challenges in understanding themand overcoming them. In this context, this chapter also provides a literature review,following the mapping developed in Chapter 2.
Figure 3.1 provides an illustration of this puzzle and suggests some of the most im-portant pieces. The pieces included there are not exhaustive, and their linking serve avisual purpose more than establishing a precise relationship among the several issuessurrounding meshed offshore grids. Although imprecise, the puzzle analogy is still use-ful to illustrate the idea that the development of a meshed offshore grid will depend onmultiple different aspects, and that these aspects are all linked together.
Pieces of a jigsaw puzzle have notches that attach to other pieces or have cuts toallow other pieces to be attached. Similarly, when evaluating economic and regulatoryaspects of the meshed offshore grid, certain aspects of one regulatory matter will influ-ence another one. This characteristic has to be taken into account by one researching thesetopics. Defining the boundaries of the research can be challenging when topics seem tooverlap. For this reason, looking at the global picture is also relevant defining where onepiece ends and the other starts.
Chapter 3. Meshed Offshore Grid: Pieces of a puzzle 22
FIGURE 3.1: Meshed Offshore Grid: Pieces of a puzzle.
FIGURE 3.2: Example of a piece’s notch1
1Based on the work by Keyaerts, Schittekatte, and Meeus (2016). More details are presented later in thischapter.
Chapter 3. Meshed Offshore Grid: Pieces of a puzzle 23
This thesis proposes an analysis for two of these pieces, namely investment incen-tives, and transmission allocation costs. The effort made in this chapter is to understandthe boundaries of these pieces, where they are located in the global picture, and what arethe interactions of the two analyzed pictures with the others.
3.1 Technology
The first row of the puzzle shown in Figure 3.1 is composed of technological aspectsof meshed offshore grids. The first consideration to be made regarding these issues isthe technology choice. A meshed offshore grid is expected to be built with High-VoltageDirect Current (HVDC) technology. This technology has several advantages over the ACtechnology in an offshore environment, but for a meshed HVDC grid be possible severalcomponents and procedures have yet to be developed.
The use of HVDC started more than 50 years ago, and the main application for suchtechnology is to interconnect asynchronous systems, long-distance transport of electric-ity, and the use of submarine and underground cables (Hertem, Gomis-Bellmunt, andLiang, 2016). For the connection of an HVDC line to an AC system, two main tech-nologies are available. The first one is the current source converter or line commutatedconverter (LCC) HVDC. The second is the voltage source converter (VSC) HVDC. Thelatter is a recent development which according to Hertem, Gomis-Bellmunt, and Liang(2016) is seen as a "game changer and as the key enabling technology for future (DC) grids".
For submarine power transmission, DC technology is usually the chosen technologydue to technical and economic reasons. The fact that overhead lines cannot be used,limits the use of both AC and DC cables, making the DC choice usually more beneficialin most cases. AC submarine cables currently do not allow higher voltages than 275 kVand 400 MVA per system, while DC cables, in combination with VSC technology, arebeing installed in voltages as high as 320 kV, having a rating of over 1200 MW per system(Hertem, Gomis-Bellmunt, and Liang, 2016). In economic terms, DC cables tend to bebetter suited for longer distances.
The PROMOTioN Project (PROMOTioN, 2016) divides the technical requirementsfor an HVDC offshore grid according to four interfaces. The first one is the interfacebetween HVDC Meshed Offshore Grid (MOG) and the OWF. The second is the interfacebetween MOG and a possible Offshore Consumption. The third is the connection of theMOG to the onshore grid. Finally, the fourth is the operability of the MOG.
Chapter 3. Meshed Offshore Grid: Pieces of a puzzle 24
FIGURE 3.3: Visualisation of the four interfaces. Source: PROMOTioN(2016)
For each interface, either equipment or procedures (or both) have yet to be devel-oped. For procedures, the recently published Network Code on HVDC Connections2 al-ready provides a starting point, but several topics have to be further investigated. This isparticularly the case for the interface MOG Operability, regarding protection and powerflow control. Several components also have to be further developed for the use in ameshed offshore grid. They include components such as offshore VSC, offshore DiodeRectifier Unit (DRU), and HVDC circuit breakers.
As the objective of this thesis is not focused on the technical aspects of meshed off-shore grids but rather on the regulatory and economic topics, we refer to the PROMO-TioN Project (PROMOTioN, 2016) for the reader that searches for further details on tech-nological matters.
2COMMISSION REGULATION (EU) 2016/1447 of 26 August 2016 establishing a network code on re-quirements for grid connection of high voltage direct current systems and direct current connected powerpark modules
Chapter 3. Meshed Offshore Grid: Pieces of a puzzle 25
3.2 Regulatory, Economic, Financial and Legal Aspects
Apart from the technical components and procedures, several regulatory, economic,financial and legal aspects of meshed offshore grids have to be defined. This are repre-sented in Figure 3.1 in rows 2, 3 and 4. The topics there represented are not exhaustive,but they illustrate what may be central challenges. They also provide a visual idea of thecomplexity involved in this system.
In some sense, regulation will influence or define most of these aspects, except thosestrictly legal. The regulation impacting the development of the grid are those both at thenational level and at European level. In the following subsections of this chapter, we tryto provide the reader with a brief overview of the main aspects concerning each of theillustrated pieces.
3.2.1 Cost-Benefit Analysis
The Cost-Benefit Analysis (CBA) is a valuable tool for project evaluation and selec-tion, especially for Trans-European projects. This economic assessment aims the identi-fication cost and benefits of an individual project, and based on the information, decideif the project should be developed or not (if benefits are higher than costs). Accordingto Meeus and et al. (2013), “the purpose of CBA is to evaluate the economic effects of adding aproject to a forecasted future, i.e. the so-called baseline.” 3. This project effect can be calculatedusing the “Take Out One at the Time” (TOOT) or the “Put IN one at the Time” (PINT)method (ENTSO-E, 2017).
In the spirit of the TEN-E Regulation, this methodology is used by ENTSO-E’s toelaborate the Ten-Year Network Development Plan (TYNDP) and is also important tohelp regional groups and project promoter when applying for the Projects of CommonInterest (PCI) list. This methodology, however, is still evolving. Currently, ENTSO-Epresents the methodology as “CBA 1.0”. ENTSO-E recently proposed a “CBA 2.0”, butACER issued the Opinion 05-2013 in which the Agency declares that while “the draftCBA Methodology 2.0 provides for some improvements compared to the CBA Methodol-ogy 1.0”, “the draft CBA 2.0 Methodology also misses to implement various recommen-dations and includes some backwards steps when compared to the CBA Methodology1.0”(ACER, 2013).
If institutions at the European level do not agree completely on a common CBAmethodology, neither does the Academia. Keyaerts, Schittekatte, and Meeus (2016) argue
3Note that concepts of cost-benefit analysis are also used in slightly different contexts. Most of projectsdiscussed in Chapter 2 (e.g. NSCOGI (2012d), European Commission (2016), OffshoreGrid (2011), andGorenstein Dedecca, Hakvoort, and Herder (2017)) propose a cost and benefit calculation in a system-wideperspective, usually assuming that a central transmission system planner will carry the planning of themeshed offshore grid. These approaches, although they also calculate costs and benefits, they do not nec-essarily apply the methodology used today by ENTSO-E, regional groups and project promoters. In thissection, the considered CBA is the one proposed by ENTSO-E, following the provision in the TEN-E Regu-lation.
Chapter 3. Meshed Offshore Grid: Pieces of a puzzle 26
that CBA methodology should comply with three basic principles. The first one is tobetter consider the interaction of the evaluated project with the other possible projects.It means improving the clustering of projects and the baseline definition. The secondprinciple is the use of harmonized and disaggregated cost and benefits reporting. This isespecially important in a meshed offshore grid, as this information will be the basis forthe CBCA. Disaggregating cost and benefits among the participant countries can facilitatethe CBCA negotiation. The third principle is the full monetization of the value of projects.This allows a more objective comparison among projects.
3.2.2 Cross-border Cost Allocation
After a CBA is completed and a project is shown to be economically viable, costshave to be shared among different countries if the project is to be developed in a cross-border environment. This process is known as Cross-border Cost Allocation (CBCA).According to the TEN-E Regulation 4, project promoters should present an investmentrequest to NRAs in all involved countries. This request should include: (a) the CBA,(b) a business plan showing financial viability and (c) a CBCA proposal. NRAs havethen to agree on a final CBCA based on the investment request, on the interaction withpromoters and considering congestion rents or other charges, and revenues stemmingfrom the Inter-TSO Compensation Mechanism 5. If NRAs do not reach an agreement,ACER can decide on the final CBCA. This CBCA procedure is required by the TEN-ERegulation for all PCI projects. Although other projects can be developed bilaterallywithout being on the PCI list, most cross-border projects are also on the list, consideringthat once they become PCIs they can also receive financial support from the EU.
As of the writing of this master thesis, since the publication of the first PCI list in2013, 24 investment requests were made (both for gas and electricity infrastructures).From the 24, only 2 CBCAs were decided by ACER(ACER, 2017). All the others wereagreed upon by NRAs.
Apart from negotiation procedures mandated by the TEN-E Regulation and ob-served in the past few years, some authors have also proposed more objective method-ologies to calculated the split of costs among nations. This is especially true for hybridoffshore lines. The uncertainties for hybrid assets come from the fact that final benefitswill also depend on certain market design rules, like the capacity allocation. Anotherconcern is regarding the agents benefiting from the asset. In a regular interconnector (on-shore or offshore), the beneficiaries are the two project promoters. If the promoters arethe national TSOs, the ultimate beneficiary is the consumer. However, on a hybrid asset,the OWFs will also be a beneficiary. Depending on the capacity of the interconnection“belonging” to the OWFs, benefits and cost allocation will change. Considering these
4Article 12 of the REGULATION (EU) No 347/2013 of 17 April 20135For more information on the Inter-TSO Compensation Mechanism, please see Chapter 4.
Chapter 3. Meshed Offshore Grid: Pieces of a puzzle 27
difficulties, NSCOGI (2012a) evaluated six different cost allocation methods using ninecriteria for a tee-in project. Benefit allocation was also analyzed.
Hadush, De Jonghe, and Belmans (2015) explores the effect of welfare distributionand cost allocation on offshore grid design using a stylized model considering two coun-ties, two offshore wind farms and an offshore interconnector. The model optimizes if theOWFs should connect to the interconnector in a tee-in configuration, or directly to theirrespective shores, as illustrated by figure 3.4. The authors use the model to evaluate themethods presented by NSCOGI and they also propose an original method, called Pro-portional to Incremental Net Benefit (PINB). The NorthSeaGrid Project (NorthSeaGrid,2015) also applies several methods of CBCA to three different case studies.
FIGURE 3.4: Possible connection for OWFs. Source: Hadush, De Jonghe,and Belmans (2015)
These studies show that there is no single CBCA methodology that is better than allthe other in all circumstances. Besides, the mentioned researches apply CBCA methodsusually to simple tee-in case studies. More complex topologies have yet to be analyzed.
On the one hand, the CBCA process nowadays is more a negotiation than the appli-cation of an objective methodology. On the other hand, several studies advocate for theuse of applied methodologies. Many more definitions have yet to be done to define whatis the most suitable CBCA procedure for a meshed offshore solution.
3.2.3 Permitting
Another aspect that can be a barrier to the delivery of meshed offshore grids is thepermitting process project promoters have to go through. Infrastructures in a meshedoffshore grid will be built in a multi-jurisdictional environment, meaning that the projectwill possibly be subject not to one set of rules and legislation, but as many as the numberof countries involved. That can lead to delays and even to the non-completion of projects.
In fact, this is a problem many PCIs face today. According to ACER (ACER, 2016),as of 2015, 37% of the projects were delayed or were rescheduled. Most of current PCIsdeal with one or two different jurisdictions. This problem can become more severe in
Chapter 3. Meshed Offshore Grid: Pieces of a puzzle 28
the case of three or more jurisdictions if anticipatory mitigation measures are not taken.The TEN-E Regulation already mandates the “establishment of a competent authority orauthorities integrating or coordinating all permit granting processes (‘one-stop shop’)”and that PCIs should receive a ’priority status’ at the national level. These measures areto ensure that these more complex projects are developed in a timely fashion.
The problem of permitting nowadays is not exclusive for PCIs. Another criticalcomponent of what will become the meshed offshore grid also suffers from this issue:the OWF and their connections to the main grid. Fitch-Roy (2015) identifies three mainseabed tenure allocation models. The first is the “open-door” approach, in which OWFdevelopers should propose location of the OWF. The second one is a “zoned” approach,in which the competent national authority sets zones in which the OWFs can be devel-oped. The third is the “defined-site”, in which OWFs are assigned to a specific location(usually by an auction). The main implications of these models for permitting proceduresare that in an “open-door” approach, national institutions tend to be more reactive, andmost of the permitting procedure has to be done by the project promoter, often throughmany different institutions. In a “defined-site” approach, the country carries at least apreliminary evaluation of the site and the permitting tends to happen in a more coordi-nated way.
In Sweden, for example, there is no “one-stop shop” approach for clearances. There-fore the developers’ proposal has to go through a process of permitting that involvesseveral agencies (Jacobsson, Karltorp, and Dolff, 2013). This has an adverse impact onthe attractiveness for new projects, as not only costs increase, but also there is a severerisk of delay, or even worse, denial of permission by an agency. An example of these risksis illustrated by the example of a 2.5 GW offshore project that was denied permission todue to opposition from the military in 2016, even though the area is identified as of na-tional interest (Sweden denies permit for $7.4B offshore wind farm because the project wouldinterfere with its military | Wind Energy News; Radowitz, 2016).
3.2.4 Financing
The problem of financing for the meshed offshore grid is the problem if TSOs willbe able to collect the resources they need to invest in the meshed offshore grid6. Thisis not only a problem for the development of meshed offshore grids but for all the pan-European transmission infrastructure that will be needed in the coming years.
This topic is explored in depth by Henriot (2013), who points in the direction that, ifthe general trend of transmission tariffs persist, TSOs will not be able to finance the total-ity of investments they are expected to. He explains that there are basically three ways of
6Here we consider the problem of financing for TSOs. Note that other agents can also be project devel-opers in a meshed offshore grid. A merchant type of investment may also be possible. The OWF developermay also invest in assets that go beyond the connection OWF-to-grid. However, we assume that TSOs willplay a bigger role in the development of meshed offshore grids, at least in the early stages. This assumptionis later justified in Chapter 5.
Chapter 3. Meshed Offshore Grid: Pieces of a puzzle 29
in which TSOs can finance their investments: “investors can raise debt (loans from commer-cial banks or institutions, corporate bonds), fund investment internally by retaining earnings, orfind external sources of equity”. Since liberalization, TSOs have financed their investmentswith debt emission, and as a result, the gearing of European TSOs raised to 60-70%7.Debt emission, however, has a limit, as it increases the risk of TSOs for lenders. Retainedearnings depend on the tariff increase, and equity injections are limited as many TSO’sare still publicly owned. Therefore, the author concludes that:
Under current trends in the evolution of transmission tariffs, the investment pro-grams established in the EC Roadmap and the TYNDP published by ENTSO-Ewill be unsustainable in the long-term. To avoid severe degradation of the TSOsfinancial profile, a significant increase in tariffs will be required. Alternative fi-nancing strategies, such as issuing additional equity, or restraining dividends,could help achieving the whole- scale investment volumes at lower costs for con-sumers. However these financing strategies cannot substitute fully to an increasein tariffs. (Henriot, 2013)
The concerns raised by Henriot (2013) were also shared by ENTSO-E in their re-port “Fostering Electricity transmission investments to achieve Europe’s energy goals:Towards a future-looking regulation” (ENTSO-E, 2014)
3.2.5 Investment Incentives
Giving the right incentives for TSOs to invest in offshore grids is also necessary.Moreover, considering that these assets will be built jointly by one or more countries,incentives have to exist on all shores for the project to happen. This piece of the puzzle isstudied in depth in Chapter 5.
This piece is strongly related to the financing of assets. In fact, Glachant et al. (2013)identify that regulatory regimes that offer a higher remuneration to TSOs tend to providebetter financeability as well.
3.2.6 Transmission Charging
If investment incentives deal with the remuneration and risk allocation for TSOs,transmission cost allocation is the way in which TSOs will charge the allowed revenuesfrom the grid users. This topic is explored in depth in Chapter 4.
The main challenges in meshed offshore are how G-Charges would be collected fromOWFs connected to the meshed offshore grid.
7Gearing is the ratio of the company’s debt to equity. A gearing of 60% means that 60% of the capital of acompany is debt and 40% is equity.
Chapter 3. Meshed Offshore Grid: Pieces of a puzzle 30
3.2.7 Coordination Onshore-Offshore
One of the keys to a successful implementation of an integrated approach to off-shore grid development is the coordination among various stakeholders. The interactionbetween the onshore grid developer, traditionally performed by TSOs, and offshore griddevelopers will be crucial for the development of an integrated solution in the future.
Fitch-Roy (2015) observes that as of today, the responsibility for the connection fromfarm to the shore belongs to different parties in the various countries. He identifies threemain models. The first one is the “TSO model” in which the TSO is the one responsiblefor building the connection from the main grid to the OWF. The second model is the“generator model”, in which the OWF developer is the responsible for the connection tothe main grid. The third is the “third party model”, in which neither the TSO or the OWFdeveloper is in charge of the connection, but a third party. The main example for thismodel is the UK’s Offshore Transmission Owner (OFTO) model.
These different models lead to more or less complexity when coordination onshore-offshore grids. The TSO model, for instance, is expected to provide good coordination,as the same company is responsible for both onshore and offshore grids. In a developersmodel, coordination becomes more difficult, but a better locational signal is sent to thedeveloper (as they will have to bear also the cost of the connection). In the third partymodel, coordination also becomes more challenging, but an element of competition isadded, and thus the cost of the connection tends to be lower.
Coordination will become even a bigger challenge if other types of developers par-ticipate in the construction of a meshed offshore grid. For interconnection, for instance,merchant companies are allowed to build cross-border lines, and they may take part in afuture meshed offshore grid.
Unbundling in the seas: a matter of interpretation
One of the principles of the European power sector is the unbundling of activities.Mandated by the Third Regulatory Package, energy supply and network operationshould be done by separate entities. Therefore, one could argue that the connectionfarm-to-shore, as a transmission asset, should not be owned or operated by OWFdeveloper. This, however, is subject to interpretation. Some countries consider theconnection as part of the transmission activity, and therefore either the TSO or athird party should be responsible for it. For others, this connection is part of thegeneration asset, as it is only connecting one power plant to the main grid, andtherefore it can be owned by the OWF developer.
Chapter 3. Meshed Offshore Grid: Pieces of a puzzle 31
3.2.8 RES Support Schemes
Support schemes will have and important impact for OWF developers. As of to-day, almost all offshore wind project count on support schemes to make the businessplan viable 8. European countries have adopted very different support schemes for re-newables. They include feed-in tariffs, feed-in premiums, contracts for difference andtradable quota systems 9.
Unharmonized national support mechanisms may not be able to provide efficientincentive in a meshed offshore system. Cooperation mechanisms for renewable sup-port may be a solution. Three cooperation mechanisms for renewable support schemes,namely statistical transfers, joint projects, and joint support schemes, were introducedby the EC as part of the Directive 2009/28/EC. The aim of introducing these alternativesfor cooperation was to encourage and enable greater cross-border cooperation betweenmember states on renewable energy policies. However, cooperation mechanisms for re-newable support have rarely been utilized by the EU states. The EU, however, is pushingfor a higher use of cooperation mechanisms.
In November of 2016, the European Commission presented a package of measurescalled “Clean energy for all Europeans” but wildly know by the industry as the “WinterPackage”. The regulation now defines cooperation mechanisms as “required”, and not"optional" anymore. This requirement comes from the target established in the new Arti-cle 5 of the RES Directive, that mandates the support to RES projects located in the otherMember States. The new Article 5 states that “Member States shall ensure that support forat least 10% of the newly-supported capacity in each year between 2021 and 2025 and at least15% of the newly-supported capacity in each year between 2026 and 2030 is open to installationslocated in other Member States.” According to the new regulation, this opening can be doneby “opened tenders, joint tenders, opened certificate schemes or joint support schemes”.
Besides increasing use the use of cooperation mechanisms, another barrier has yetto be overcome for RES support in meshed solutions. Most of the national legislationstoday require that renewable power plant receiving support should feed in only the gridfrom the country in which they receive the support. In a meshed offshore grid, this maynot be assured, as OWFs flows can end up in different countries from those they receivethe financial support.
3.2.9 Capacity Allocation
Market design will also have a big impact on the profitability of projects in a meshedoffshore grid. Considering hybrid assets, in which part of the line is dedicated to inter-connect systems and the other part is dedicated to connecting the OWF to the main grid,
8Note that, as mentioned in Chapter 1, in 2017 Germany had the first e0 bid on an offshore auction.9For details on the mechanics of these mechanisms, see Batlle, Pérez-Arriaga, and Zambrano-Barragán
(2012) and Del Río et al. (2015).
Chapter 3. Meshed Offshore Grid: Pieces of a puzzle 32
defining what portion "belongs" to the interconnection and to the OWF is not a trivialtask. On the one hand, the current regulation 10 establishes that renewables should havepriority access. On the contrary, the regulation 11 also establishes that all capacities of in-terconnectors must be provided to Market Coupling. This conflict of regulatory regimeswill yet have to be harmonized for a meshed offshore grid.
3.2.10 Biding Zones
Another market design issue is the definition of where OWFs will be able to sell theirenergy. It was previously said that today, considering that most OWFs receive financialsupport, they are expected to sell the energy in the country from which they receivethe support. However, imagining a future in which this legal constraint is relaxed or afuture in which support schemes are no longer necessary, OWFs would be free to bid intodifferent bidding zones.
NSCOGI (2012b) explores different alternatives for this question. Indeed, the defi-nition of where is the bidding zone boundary have several impacts, including capacityallocation, benefit allocation and leads to behaviors and depending on balancing respon-sibilities (Schröder, 2013). The report presents two virtual cases, as illustrated in Figure3.5. In the first one, the line is a hybrid asset, and therefore the OWF will have a “virtual”connection to the main grid, and the remaining capacity of the line is for interconnectionpurposes. In the Virtual Case 2, the limit of the system is defined after the OWF, andtherefore the OWF has all the capacity of the line available as a connection to the maingrid.
FIGURE 3.5: Virtual Case Studies 1 and 2. Source: NSCOGI (2014)
Based on this two Virtual Case studies, four options for bidding zones are consid-ered:
1. OWF is in fixed bidding zone under virtual case 1
10Art. 16 (2) Directive 2009/28/EC11Regulation 714/2009 and CACM Network Code
Chapter 3. Meshed Offshore Grid: Pieces of a puzzle 33
2. OWF is in a floating bidding zone
3. OWF is in its own bidding zone
4. OWF is in fixed bidding zone under virtual case 2
This four options will lead to different outcomes in the behavior of the OWFs.
3.2.11 Governance Models
Important definitions have yet to be made regarding the governance of the meshedoffshore grid. Several types of agents are expected to invest, own and participate (or atleast impact) in the operation of the meshed offshore grid. Defining who are these agentsand what are their responsibility is a key for the completing of the meshed offshore grid.
One the center of this discussion is the definition of who will operate the meshedoffshore grid. Several TSOs are expected to invest in this infrastructure, but probablyone entity will be responsible for the operation. Some studies propose the creation of a“Regional ISO” (Konstantelos, Moreno, and Strbac, 2017) for the operation of a meshedoffshore grid.
3.2.12 Legal Barriers
As shown by (Müller, 2015), many are the legal challenges to be overcome. Asmeshed offshore grids will be developed on the sea, not only national and Europeanlaw is applicable, but also international law. The United Nations Convention on the Lawof the Sea (UNCLOS) establishes many of the rights for jurisdiction on the sea.
One simple example of a legal barrier is the one state’s right to lay cables in anotherstate’s EEZ, as illustrated by Figure 3.6 below.
FIGURE 3.6: State’s right to lay cables in another state’s EEZ. Source:Müller (2015)
Chapter 3. Meshed Offshore Grid: Pieces of a puzzle 34
This rather simple situation might have a difficult legal interpretation. Under UNC-LOS, states are allowed to lay cables in the EEZ of other states, but that does not neces-sarily mean that state laying the cable has jurisdiction over it, as concludes Müller:
“I conclude that the states have a clear right to lay cables in other states’ EEZ,but that this right does not expressly provide for the jurisdiction to also regulatethe cable. As this outcome depends on interpretation, this might create legaluncertainty. Due to this unclear situation, states could also resort to generalrules of international law.”(Müller, 2015)
3.3 Assembling the Puzzle
Meshed offshore grids will just become a reality when the pieces of the puzzle aresufficiently understood, organized and linked together. In some sense, differently than atraditional jigsaw puzzle, in which one piece connects only to a maximum of four otherpieces, here every topic influences the other, to some degree.
As we all know, some strategies exist for one starting the assembly of a jigsaw puzzle.Starting with the corner pieces is usually a recommended one. In the meshed offshorepuzzle, this strategy can also be valid. It is necessary to identify, though, what are the‘corner pieces’ in each type of issue (technology, regulation, economics, and legislation)12. If the meshed offshore grid is not expected to happen in a big bang approach, asmentioned in Chapter 1, neither is the understanding of all the issues surrounding thisinfrastructure.
In economics and regulation of offshore grid, the ‘corner pieces’ seem to be thoseregarding planning and investment. A good CBA (already necessary for purposes otherthan offshore grids) will unlock the development of a good CBCA (by means of an ob-jective methodology or a more objective negotiation process). With these two pieces inplace, certain types of assets can be easier fostered, such tee-in connections between twocountries. On another key aspect, setting appropriate economic incentives and ensuringgood financeability for TSOs may foster the development of hub connections. On a laterstage, these infrastructures can be connected into a meshed solution. By then, topics likebidding zones will be mature enough.
12Not necessarily the same from figure 3.1. As already mentioned, the figure is only illustrative.
35
Chapter 4
Transmission Tariff Design in aMeshed Offshore Context
4.1 Introduction
According to the report prepared for the European Commission (European Commis-sion, 2016), transmission tariff design is expected to have an impact on the developmentof offshore wind farms (OWF). Although transmission tariff represents only a smallerfraction of the total costs of an OWF project, it may have an impact on the location andbusiness case of these projects. For example, if the methodology of calculating transmis-sion tariff in a location imposes an additional risk to the developer, the developer mayprefer to move to a different location with a more favorable tariff structure, under theassumption that other parameters such as support schemes, market design, and windavailability are similar.
ACER has explicitly expressed its concerns regarding the unharmonized transmis-sion tariff methodologies in Europe, especially about tariffs for producers (ACER, 2015a;ACER, 2015b). Among the main concerns regarding transmission tariffs is the allocationof costs to generators also known as G-charges which vary significantly among countries.
In this chapter, first we provide the reader with an understanding of the theoreticalaspects of transmission tariff design. This is followed by an analysis of the level of trans-mission tariff regime harmonization between the different countries of the North Seas.Finally, we evaluate different methodologies for calculating G-charge in the context ofmeshed offshore wind infrastructure development.
4.2 Transmission Cost Allocation Methods
The transmission of electricity is an activity that is traditionally characterized asa natural monopoly, and therefore the revenues of the transmission system operatorsare regulated by National Regulatory Agencies (NRAs). Independent of the regulatorymodel being used, whether it is a cost-plus approach or incentive regulation approach,
Chapter 4. Transmission Tariff Design in a Meshed Offshore Context 36
costs would eventually be recovered from grid users which can be both generation andload. Subsequently, various approaches for allocating these costs have been used in prac-tice and been proposed in literature.
The cost of transporting electricity from generators to consumers can be separatedinto two components. The first one being the cost of the infrastructure itself (i.e. invest-ment, operation, and maintenance), and the second being the cost incurred due to theexistence of the given infrastructure (e.g. losses, generating rescheduling due to networkconstraints and ancillary services) (Lévêque, 2003). These two components should be al-located in such way that it provides the users with an economically efficient investmentsignals and, at the same time the costs are allocated to the beneficiaries.
The cost incurred by TSOs due to the existence of the infrastructure can generallybe recovered using market mechanisms, such as auctioning for limited capacities. Analternative option is the use of nodal pricing, which not only enables the recovery of the“use of the grid” costs but also sends an efficient short-run economic signal (Lévêque,2003). In theory, congestion management by either auctioning or nodal pricing will gen-erate revenues for the TSO that can be used to recover the total cost of the infrastructure.Nevertheless, as shown by Marin et al. (1995), in reality these revenues may be far fromsufficient to recover the entire cost of the infrastructure. This is mainly due to the lumpycharacteristic of transmission investments and because these investments are not madeexclusively to increase capacity, but for several other reasons such as improving the se-curity of supply, integrating renewables etc. (Pérez-Arriaga, 2013). Consequently, theunrecovered part of costs must be recovered by the application of another charge, calledComplementary Charges (CC).
The CC can be further subdivided into Connection Charges and Use of the SystemCharges (UoS). The former is a user-specific type of charge, in which users pay part (orentirety) of the investment for which they are exclusively responsible as there is a clearcost causality. This may consist of their connection to the main grid and possibly thecost of necessary reinforcements. The latter,the UoS are generally known as transmissiontariffs.
While designing transmission tariffs, there are two main aspects that are key for en-suring an effective and an efficient design. The first aspect is distribution of transmissioncosts between the different grid users (the “how much” question) and the second is theform of recovery of these costs (the “how” question). Finally, in an interconnected systemsuch as the EU, the cross-border coordination between TSOs for allocating transmissioncosts is critical for the success of the overall transmission cost allocation.
Chapter 4. Transmission Tariff Design in a Meshed Offshore Context 37
Tracing meshed offshore grid costs: from CBA to Transmission Tariffs
A meshed offshore grid will be achieved by the joint investment in transmissionlines, as is the case for interconnectors nowadays. Each of these assets have a cost,that eventually must be recovered from its users. Considering the multi-partycharacteristics of these assets, their costs follow a slightly more complicated pathuntil they reach the final user.
As explored in chapter 3, the Cost-Benefit Analysis (CBA) is the tool used toidentify efficient investments. The CBA is expected to provide decision-makerswith geographic disaggregated costs and benefits.
Consequently, a Cross-border Cost Allocation (CBCA) process is conducted, inwhich costs are split among parties. Usually these costs are split based on theinformation contained in the CBA. However, they may also be influenced by thenegotiation among parties.
Once the CBCA is agreed upon, the asset is included in the TSO’s RegulatoryAsset Base (RAB). The TSO then starts to recover these costs from the users via thetransmission cost allocation methods discussed in this chapter.
In a brief summary, the CBA identifies costs and benefits, the CBCA divides costsamong parties, and transmission allocation methods divide costs once more, nowamong users.
4.2.1 Alternatives for Transmission Cost Distribution Among Grid Users
The methods for transmission cost distribution can broadly be divided into threegroups: economic methods, network utilization methods and methods without locationalcomponents (Pérez-Arriaga, 2013).
Economically Based Methods
In these methods, transmission tariffs are designed based on the cost causality prin-ciple. According to this principle, the cost of building a new infrastructure should beallocated to those users that make the construction of this new infrastructure necessary.Therefore, users should be charged only for the use they make of the grid.
The primary method in this category is called the “Beneficiary pays” method. Inthis method, the benefits from construction of new lines for each user are calculated. The
Chapter 4. Transmission Tariff Design in a Meshed Offshore Context 38
costs are then allocated relative to the benefit accrued by each user. In this case, benefitsare defined as the “financial impact for a grid user associated with the existence of a gridfacility or suite of facilities” (Pérez-Arriaga, 2013). The benefits from the new line aretherefore the incremental change in benefit for the user due to the existence of the newfacility as compared to the pre-existing situation. As one can expect, the difficulty withthis method lies on assessing the benefits for existing lines, as many assumptions and in-formation are needed. In practice, this method has been used for developing regulationsadopted in Argentina and California (Pérez-Arriaga, 2013).
Network Utilization Methods
Since economic benefits are hard to compute, some methods use a proxy for the ben-efits instead, namely the usage of the network. The first method on this category is the“contract path”. It is a fairly rudimentary method that has been used more used in thepast (Pérez-Arriaga, 2013). In this method, the seller and the buyer of electricity agreeupon the most logical path for the energy flow thus the cost is allocated in accordance tothis agreement. The “contract path” method is therefore based on commercial transac-tions rather than the actual energy flows. The main critique for this method lies in the factthat energy flows (the real cause of transmission costs) are independent of commercialtransactions, thus the method may not reflect the actual costs and inefficient allocation ofcosts. This is especially true for meshed networks.
A second method used for calculating the usage of the network by agents is called the“marginal participation”. In this method, costs are allocated based on the marginal effecteach user has on the line by a variation of 1 MW in its consumption or production (Rubio-Odériz, 2000). For technical reasons, however, this variation will always depend on thechoice of a reference node in the system, and therefore results may change according tothis choice. A third method for usage computation is the “average participation” method.In this method, a heuristic rule is used to “determine the fraction of the flow of eachline that can be attributed to each generator” (Pérez-Arriaga, 2013). In other words, thismethod is based on the proportionality principle, as illustrated below in the examplefrom Rubio-Odériz (2000).
FIGURE 4.1: Average Participation Example. Source: Rubio-Odériz, 2000
Following the simple rule of proportionality, generator G1 should be responsible for15 X 20/50 MW of the flow in line L1 and 35 X 20/50 MW of the flow in line L2. The samereasoning applies to generator G2.
Chapter 4. Transmission Tariff Design in a Meshed Offshore Context 39
Other methods for electricity usage calculation are the “Aumman-Shapley” methodand the “Long Run Marginal Cost” (LRMC) method. The former is a an optimization/game-theoretic approach, while the latter is a “based on the circuit flows resulting from a givengeneration-load pair, and on the network superposition property” (Junqueira et al., 2007).
Methods Without Locational Components
The third category consists of methods that do not include a locational component.That is to say, these methods do not account for cost causality, but merely try to al-locate costs of transmission in the least distortive way or in a simple and presumednon-discriminatory way. The most commonly used method of this type is the “PostageStamp”. In this method a uniform rate is applied to all users based on a simple metricsuch as the capacity connected, or the energy injected or withdrawn from the grid. Thisis the simplest and most common method used by electric utilities (Orfanos et al., 2011).
Another form of tariff with no locational component is the “Ramsey Pricing”. In thismethod, costs are allocated based on the elasticity of users. The method aims to allo-cate most of the costs to users that are least elastic to energy prices (Pérez-Arriaga, 2013).This means that in practice, most of costs will be allocated to consumers, and within con-sumers, residential consumers would bear the most costs, as they don’t react to prices asmuch as industrial consumers.
G-Charges
Generators are also grid users and thus beneficiaries of transmission lines,therefore they too should be responsible for the cost incurred for developing thegrid. However, G-charges are often seen as unnecessary, as the cost will be passedto the consumers anyway. Nevertheless, this is not entirely true, as argued byPérez-Arriaga (2013) and Hirschhausen, Ruester, and Glachant (2012). Besidesrecovering the cost of the grid, transmission tariffs can be used to send a locationalsignal for the siting of new capacity. Therefore, G-charges will be internalizedin the investment decision of developers leading to efficient siting of the newcapacity from a grid development perspective.
Chapter 4. Transmission Tariff Design in a Meshed Offshore Context 40
In fact, opinions diverge when it comes to the best format for charging thegenerators. More specifically on the case of wind farms, the EWEA (2014)recently issued a position paper in which it is argued that locational and powerbased G-charges tend to penalize wind power plants as the location of the windfarms is based on the availability of resources, and not on the proximity tothe load centers. The output of a wind farm is usually a fraction of its installedcapacity; thus, the use of a capacity-based charge would penalize such a generator.
On the other hand, a charge based on the installed capacity is less market distortivethan a charge based on electricity production, as it is a fixed cost and will notimpact the bidding of agents on the market.
4.2.2 Dimensions of Recovering Transmission Costs From Grid Users
Once the “how much” is defined, the next step is designing the format for recoveringthis tariff from the user. Even in this case several options have been used in practice anddiscussed in theory. These extend from the type of charging (if energy or capacity-based)to periodicity of the charge. These designs could have an impact on agents’ decisions,thus making them a critical part of tariff design.
The key dimension of transmission cost recovery is the metric that would be utilizedto charge the users. It can be an energy-based charge (e/MWh), capacity-based charge(e/MW), a fixed (access-based) charge (e) or a combination of these options. Each oneof these formats will have different implications on agents’ decisions, in particular forgenerators. An energy-based tariff would lead to additional variable costs for the gen-erators, changing their competitive position in the spot market. On the other hand, acapacity-based charge, will add a fix cost for the generator, and it could have an impacton investment decisions in new capacity (Pérez-Arriaga, 2013).
Another dimension that is relevant specifically in a “energy-based charge” systemis the temporal dimension. The tariffs charged to a user can be based upon the time ofuse (Pérez-Arriaga, 2013). For example, tariffs can be differentiated within the day (peak,off-peak) or between seasons (summer, winter).
Finally, the periodicity of charge updates is also a relevant aspect. Pérez-Arriaga(2013) argues that tariffs should be calculated ex-ante and not updated for a reasonableperiod of time. In this way, signals are stable and predictable, which is extremely desir-able from the perspective of investment decisions. On the other hand, if tariffs are notupdated regularly and flow patterns are evolving fast the cost causality principle can bedifficult to apply.
Chapter 4. Transmission Tariff Design in a Meshed Offshore Context 41
4.2.3 Iter-TSO Compensation Mechanism
The task of allocating transmission costs becomes even more complicated in inter-connected systems having different regulatory regimes as is the case in the EuropeanUnion.
Before the liberalization of the power sector in Europe, users had to pay a tariff feein cross-border power transaction (Hirschhausen, Ruester, and Glachant, 2012). Thisresulted in the so-called “tariff pancaking”, as at every border a different fee would becharged. This was considered as a barrier to the development of an integrated Europeanelectricity market and thus brought into focus the need for a harmonized cross-bordertarification mechanism.
In response, an Inter-TSO Compensation Mechanism (ITC) was created. Initial theinter-TSO compensation mechanism was implemented on a voluntary basis and waslater transformed into a mandatory instrument. The ITC preserves a “single systemparadigm” for network users (Olmos and Pérez-Arriaga, 2007), meaning that transmis-sion tariffs are only paid in their country of origin, but they give access to the wholeEuropean grid. The ITC serves then as a balancing mechanism for countries, in whichthey receive compensation for the use of their network by external agents and conversely,pay a charge for the use they make of other countries’ networks. In the end a net pay-ment is computed for each country, either positive or negative. It should be noted thatalternatively, a pan-European system of transmission tariffs could be an alternative solu-tion for cross-border coordination of transmission tariffs, as it was considered before theimplementation of the ITC (Olmos and Pérez-Arriaga, 2007).
4.3 North Seas Countries’ Mapping
In this section, we map and analyze the level of harmonization in the methods oftransmission cost allocation adopted by different countries of the North seas, with espe-cial focus on their transmission tariffs. In this analysis we compare ten countries: Bel-gium, Denmark, France, Germany, Great Britain, Ireland, the Netherlands, Northern Ire-land, Norway, and Sweden.
For each country, seven relevant dimensions of transmission charges were analyzed.The information presented in this section is based on the ENTSO-e Overview of Trans-mission Tariffs in Europe: Synthesis 2016 (Entso-E, 2016). This report in produced yearlyby ENTSO-e and contains key information on transmission tariff structures across Eu-rope. Further details come from the other reports and the websites of various TSOs.
The Dimension of transmission charges under consideration:
• G-L charges: The proportion of network costs allocated to generation (if any) andload.
Chapter 4. Transmission Tariff Design in a Meshed Offshore Context 42
• Type of connection charges: Deep charges are characterized by users paying theconnection to the main grid and for the necessary reinforcements. In a shallowcharge, users pay only for the connection to the main grid. In a super-shallow, theTSO or a third-party is responsible for the connection. It’s important to notice thatin some countries, connection charges differ among users. In this thesis we focusonly on the connection charge regime used for offshore connections.
• Temporal price signal: Whether the tariff design considers time of use to indicatethe difference in usage level of the network at certain period in time. The existenceof time of use price signal based on periods of congestion. These different periodsmay be within the day (e.g. peak, shoulder and off-peak) or for different seasons ofthe year (e.g. summer, winter).
• Locational price signal: Whether the tariff design considers location of use to indi-cate the difference in usage level of the network in a particular area. The locationalsignals may come from the application of a network utilization method, or be basedon a simpler metric such as distance from a certain point.
• Inclusion of losses: If losses are included in the tariffs.
• Inclusion of system services: If system services such as ancillary services and bal-ancing energy are included into tariffs.
• Energy-related and capacity-related components: The proportion in which trans-mission costs are recovered via energy-based components (e/MWh), capacity-basedcomponents (e/MW), fixed components (e) or a combination of the three.
As shown in detail below, the ten countries have very different transmission costallocation practices, which can lead to different investment and operational decisions.An aspect that draws one’s attention is the difference in transmission costs allocated tothe generator (G-charge). On one side, some countries apply a very low (or none) G-charge and a super-shallow connection cost, meaning that very little of the transmissioncosts will be recovered from generators, and that the costs are almost completely leviedon consumers. On the other side, some countries have a higher G-charge and can evenhave a deep connection cost. In these cases, generators will have to bear a greater part ofthe transmission cost recovery.
Chapter 4. Transmission Tariff Design in a Meshed Offshore Context 43
FIGURE 4.2: Transmission Costs Levied on Generators
4.3.1 Belgium
Belgium allocates 93% of the transmission costs to load and 7% to the generators.Regarding locational price signal, Belgium does not differentiate tariffs according to thelocation of agents. Losses are only included in the tariffs to the networks below 150kV.The losses from networks with higher voltages are paid by agents according to the per-centage of net offtakes, differentiated for peak hours off-peak hours (Elia, 2017a). Costsof ancillary services are included in the transmission tariff, such as reactive power, powerreserves, and black-start based (Elia, 2017a).
On connection costs, Belgium applies mostly a shallow charge. For onshore connec-tions everything is socialized, except installations between the grid user and the substa-tion and the connection bay at the substation (ACER, 2015b). For offshore connection,the Belgian TSO Elia is responsible for bearing up to 25 Meof the cable cost from farm toshore (Jong, 2008).
Chapter 4. Transmission Tariff Design in a Meshed Offshore Context 44
TABLE 4.1: Summary of the transmission tariff structure in Belgium
G-L charges G: 7% ; L: 93%Temporal price signal YesLocational price signal NoInclusion of losses NoInclusion of system services YesEnergy-related and power-related components for G Energy-basedType of connection charges Shallow
4.3.2 Denmark
Denmark charges a small portion of transmission costs to generators. They are re-sponsible for 3% of the costs, while consumer bear 97%. Tariffs for consumers are dividedinto three types: grid tariffs, system tariffs and Public Service Obligations (PSO). In thesecond semester of 2016, they summed up 32.9 øre/kWh, and the PSO tariff accounts for75% of this total. The tariff for producers, however, is only 0.3 øre/kWh. Wind turbinesand local CHP units that remain subject to purchase obligation are exempt from the gridtariff, according to the Danish TSO Energinet.dk (Energinet.dk, 2016).
Denmark applies no seasonal price signal nor locational signal for transmission charg-ing. However, losses and system services are included in the tariff charged by the TSO.The tariffs are energy-based. The connection cost is super shallow to partially shallow,but for the most relevant portion of offshore projects, a super-shallow approach is used .
TABLE 4.2: Summary of the transmission tariff structure in Denmark
G-L charges G: 3% ; L: 97%Temporal price signal NoLocational price signal NoInclusion of losses YesInclusion of system services YesEnergy-related and power-related components for G Energy-basedType of connection charges Super-Shallow
4.3.3 France
France charges only generators connected to the 150 – 400kV grid through an energy-based tariff. The proportion of transmission costs borne by generators accounts for 2%of the total (Entso-E, 2016). It’s interesting to note that France has five different temporalcharges: summer/winter, mid-peak/off-peak, and peak hours. These temporal differen-tiations are applied to voltage levels below 350 kV. For higher voltages, just the usageduration is considered. No location differentiation is applied, however. One aspect to
Chapter 4. Transmission Tariff Design in a Meshed Offshore Context 45
note is the difference in connection charges depending on the type of agent. Genera-tors pay 100% of their connection to the substation, while consumers pay 70% of theirmain connection, network development costs due to RES integration are mutualized ona regional basis (Entso-E, 2016).
TABLE 4.3: Summary of the transmission tariff structure in France
G-L charges G: 2% ; L: 98%Temporal price signal Yes (5 types)Locational price signal NoInclusion of losses YesInclusion of system services YesEnergy-related and power-related components for G Energy-basedType of connection charges Shallow
4.3.4 Germany
Germany applies no transmission tariffs to generators. All transmission costs areborne by consumers in a non-temporal and non-locational dependent tariff (Wilks andBradbury, 2010). Regarding connection charge, the ENTSO-e report classifies it as shal-low to super-shallow, as grid users pay for their connection line and substation (Entso-E,2016). For offshore wind farms, however, the connection cost is super-shallow. The de-veloper doesn’t pay for the line, and the cost is socialized by the TSO (Fitch-Roy, 2015).Losses and system services are included in transmission charges.
TABLE 4.4: Summary of the transmission tariff structure in Germany
G-L charges G: 0% ; L: 100%Temporal price signal NoLocational price signal NoInclusion of losses YesInclusion of system services YesEnergy-related and power-related components for G -Type of connection charges Super-shallow
4.3.5 United Kingdom
Great Britain
In GB, the transmission grid is owned, maintained and operated by three Transmis-sion Operators (TOs), while the system in its entirety is operated by a single System Op-erator (SO). Costs of transmission are levied as 3 different charges: connection charges,
Chapter 4. Transmission Tariff Design in a Meshed Offshore Context 46
Transmission Network Use of System (TNUoS) charges and Balancing Services Use ofSystem (BSUoS) charges.
Connection charges in GB are considered shallow (Entso-E, 2016). Both load andgeneration are responsible for paying their connection to substation they will be con-nected to, if the asset are to be used exclusively by the new entrant. The TNUoS is paidby all users of the transmission network, including generator, the only exemption beinginterconnectors (Ofgem, 2015). These charges are differentiated by location in order toreflect the costs that the users impose onto the grid. The SO also recovers the cost ofbalancing the system through the BSUoS. Losses are not included in the transmissioncharges.
TABLE 4.5: Summary of the transmission tariff structure in Great Britain
G-L charges G: 23% ; L: 77%Temporal price signal NoLocational price signal YesInclusion of losses NoInclusion of system services YesEnergy-related and power-related components for G Capacity-basedType of connection charges Shallow
Northern Ireland
Northern Ireland follows a similar approach as the rest of the UK and Ireland. Cur-rently, 75% of costs are borne by consumers, and the remaining 25% are paid by gener-ators in a capacity-based charge. The Transmission Use of System (TUoS) paid by userscomprises of three components: Network Charges, System Support Services and Col-lection Agency Income Requirement (SONI, 2017). These components are responsiblefor recovering the use of the network infrastructure, system services (including ancillaryservices) and to balance revenues of the Moyle interconnector, respectively. The SystemSupport Services and Collection Agency Income Requirement are not levied on genera-tors, only on consumers. Connection charges are shallow. Both consumers and generatorover 1MW of installed capacity pay 100% of the connection to the main grid (Entso-E,2016).
Chapter 4. Transmission Tariff Design in a Meshed Offshore Context 47
TABLE 4.6: Summary of the transmission tariff structure in Northern Ire-land
G-L charges G: 25% ; L: 75%Temporal price signal YesLocational price signal YesInclusion of losses NoInclusion of system services NoEnergy-related and power-related components for G Capacity basedType of connection charges Shallow
4.3.6 Ireland
The generators in Ireland pay 25% of transmission costs, while consumers bear 75%of the total. Users are levied a Transmission Use of System Charges (TUoS). This charge ismeant to recover two components: costs the use of transmission infrastructure and costsarising from the operation and security of the transmission system (Eirgrid, 2015). TheTUoS is divided into three categories: Demand Transmission Service (DTS), GenerationTransmission Service (GTS), and Autoproducer Transmission Service (ATS). Generatorsare also entitled to pay both network charges and system services associated with theirinjection of electricity in the grid and periodic withdraw for consumption by start-upand standby equipment (Eirgrid, 2015). The connection costs in Ireland are consideredshallow. Demand pays 50% of the connection while generators pay 100% (Entso-E, 2016).
TABLE 4.7: Summary of the transmission tariff structure in Ireland
G-L charges G: 25% ; L: 75%Temporal price signal NoLocational price signal YesInclusion of losses NoInclusion of system services YesEnergy-related and power-related components for G Capacity basedType of connection charges Shallow
4.3.7 The Netherlands
According to TenneT, the Dutch TSO, users of the transmission grid pay both con-nection tariffs and transmission services tariffs (TenneT, 2017b). Connection tariffs aredivided into two parts: initial connection tariff and periodic connection tariff. The initialconnection tariff is the cost of building the line from the user to the grid. This connectioncharge is identified by Entso-E (2016) as shallow. However, for offshore connection, ac-cording to the new regulation, the responsibility for the connection goes to the TSO, andtherefore a super-shallow charge is applied. Besides the initial connection charge, users
Chapter 4. Transmission Tariff Design in a Meshed Offshore Context 48
must pay a periodic connection tariff, meaning the cost of maintaining and eventuallyreplacing the installation built for the new agent.
The transmission services tariffs, on the other hand, is composed of two other com-ponents, namely the non-transmission-related consumer tariff, that includes administra-tive costs of managing the grid, and the transmission-related consumer tariff, that re-covers the cost of transporting the electricity in a capacity-based charge. It is importantto note that generators are not charged for transmission costs. Together with Germany,these two countries are the only ones that don’t apply a use-of-transmission charge ongenerators.
TABLE 4.8: Summary of the transmission tariff structure in The Nether-lands
G-L charges G: 0% ; L: 100%Temporal price signal NoLocational price signal NoInclusion of losses YesInclusion of system services YesEnergy-related and power-related components for G -Type of connection charges Super-shallow
4.3.8 Norway
Transmission tariffs in Norway are based on costs referring to the agent’s connectionpoint, and therefore are location specific (NVE, 2017). These tariffs are also determinedbased on marginal losses. Generators pay 38% of the total transmission costs, whichmakes Norway one of the countries with the highest G-charge share of the sample ofcountries. Charges on generators are composed of an energy-base tariff and a fixed com-ponent. The latter is a lump-sum paid based on a 10-years historical production average.This amount is calculated every year.
Connection costs are identified by ENTSO-e as being shallow 2016. However, ac-cording to NVE (2017), “the generator may be charged related to investments needed toincrease the capacity of the existing network”, suggesting a deep approach.
TABLE 4.9: Summary of the transmission tariff structure in Norway
G-L charges G: 38% ; L: 62%Temporal price signal YesLocational price signal YesInclusion of losses YesInclusion of system services YesEnergy-related and power-related components for G Lump-sum + Energy basedType of connection charges Shallow/Deep
Chapter 4. Transmission Tariff Design in a Meshed Offshore Context 49
4.3.9 Sweden
Sweden applies a capacity charge to grid users, and it is expected that generatorsshould pay around 30% of the cost of transmission (ACER, 2015a). Entso-E (2016), how-ever, estimates that G-charges cover 41% of the regulated cost, this is indeed the higherG-charge share of all ten countries analyzed.
The Swedish TSO also applies a very strong locational price signal to users. Thetransmission charge for generators decreases linearly from North to South, according tothe latitude of the user. This is due to general power flow from North to South, and it aimsat giving incentives for producers to install their facilities in the South, therefore reducingcongestions (ACER, 2015a). Connection charges are deep in the Sweden, meaning thatusers must not only pay for the infrastructure necessary for connecting to the main gridbut also reinforcements in the main grid if those are needed.
TABLE 4.10: Summary of the transmission tariff structure in Sweden
G-L charges G: 41% ; L: 59%Temporal price signal NoLocational price signal YesInclusion of losses YesInclusion of system services YesEnergy-related and power-related components for G Capacity basedType of connection charges Deep
4.3.10 Summary
The summary shows several types of tariff structures across countries, and that thereis certainly a lack of harmonization. Tariffs are different in the form they are charged andin the level of charging, sending varying levels of economic signals to users, especiallygenerators.
Chapter 4. Transmission Tariff Design in a Meshed Offshore Context 50
TABLE 4.11: Summarizing transmission charging design in the North Seas
Share of G-charges
Seasonal Signal
Locational Signal
Losses included
System services included
Type of Tariff for G
Type of Connection
Charge
Belgium 7% Yes No No Yes Energy based Shallow
Denmark 3% No No Yes Yes Energy based Super shallow
France 2% Yes No Yes Yes Energy based Shallow
Germany 0% No No Yes Yes - Super shallow
Great Britain 23% No Yes No Yes Capacity based Shallow
Ireland 25% No Yes No Yes Capacity based Shallow
Netherlands 0% No No Yes Yes - Super shallow
Northern Ireland
25% Yes Yes No No Capacity based Shallow
Norway 38% Yes Yes Yes YesLump-sum + Energy based
Shallow/Deep
Sweden 41% No Yes Yes Yes Capacity based Deep
4.4 Transmission Tariffs in a Meshed Offshore Grid Context
Considering the unharmonized situation of transmission charges in the countries ofthe North Sea, in the next step we analyze what its impact would be on the developmentof a meshed offshore grid. We focus our analysis on evaluating different methodologiesfor calculating G-charge in the context of meshed offshore wind infrastructure develop-ment. G-Charge Payments in Meshed Offshore Grids.
In a meshed offshore grid scenario, it is unclear how, whether and where an offshorewind farms would pay G-charges. In that scenario, offshore wind farms will be connectedto what is being called by the literature as a “hybrid asset” (NSCOGI, 2012a; EuropeanCommission, 2016), which is both an interconnector and a connection to the main gridfor the wind farm.
According to Regulation (EC) No 714/2009, an interconnector is defined is as a“transmission line which crosses or spans a border between Member States and whichconnects the national transmission systems of the Member States”. This actually wouldmean that OWFs are not connected to a specific system, but are in-between systems. This
Chapter 4. Transmission Tariff Design in a Meshed Offshore Context 51
is a very unique situation, which makes designing of transmission tariffs (if any) for off-shore wind farms in a meshed network complicated. The literature on the topic is ratherscarce, as this barrier is often identified as having a “low impact on the development ofNorth and Irish Seas energy systems”. Nevertheless, it is a barrier that demands greaterattention (European Commission, 2016).
(European Commission, 2016, p. 89) report suggest that “assuming a market cou-pling that will decide where the power will flow to, one can say that the assignmentof transmission charges will be estimated between the countries based on the powerflows.We can imagine that this could be done a posteriori, and the offshore plant op-erators could get a bill to pay at the end of each month or year”. This can be consideredas one alternative for dealing with the problem, but not the only one.
In this section, we analyze different alternatives for setting transmission tariffs forOWFs in a meshed offshore grid. First, we discuss a list of alternatives that can be con-sidered. This is followed by the description of the transmission tariff design dimensionsnecessary to make a tariff design legally, economically and technically sound. Finally,these dimensions are used to evaluate the different transmission tariff designs.
4.4.1 Alternatives for G-Charge in a Meshed Offshore Grid
OWF pays in the country of origin
In the first method considered, the OWF pays G-charges defined by the country it islegally located, which may be considered as the status quo situation. In such a scenario,the OWF is considered equivalent to any other generation unit that may be present onthe mainland. To understand what “legally located” means, we refer the concept of “ju-risdiction”. Jurisdiction is defined as the right of a state to govern over a certain territory,property or person Müller, 2015. On an onshore grid context, jurisdiction is easily recog-nizable, as states have the sovereignty to govern activities on their land. In an offshorecontext, jurisdiction is determined by international law.
The fundamentals of law relating to the sea are established by the United NationsConvention on the Law of the Seas (UNCLOS). There are different maritime zones de-fined by UNCLOS, and as a rule, the greater the distance from the shore of a particularzone, the lesser is the jurisdiction a country has over it. In this chapter, we focus on Ter-ritorial Zone (TZ) and the Exclusive Economic Zone (EEZ). The first one is comprisedby the distance of 12-nautical miles from the shore, and is considered as an extensionof the land of a state. Therefore, states have full jurisdiction over it. The second rele-vant maritime zone for our discussion is the EEZ, which comprised a 200 nautical miles’distance from shore. In this maritime zone, countries have a limited jurisdiction, called“functional jurisdiction”. That means that a “coastal state has the right to legislate overactivities that are related to the economic exploitation of that zone but not over otheractivities” .
Chapter 4. Transmission Tariff Design in a Meshed Offshore Context 52
OWFs are located either in the TZ or EEZ and consequently countries have jurisdic-tion over them. However, the same is not true for interconnectors, for instance. Thesedifferences in jurisdiction can lead to a series of legal issues (e.g. an OWF located in onecountry’s EEZ connected to another country’s shore).
We limit our definition to consider that an OWF is legally connected to the statethat has jurisdiction over it, meaning that the OWF is located within a state’s TZ or EEZ.Therefore, the OWF will pay G-charges according to the rules of that state, regardless ofthe actual energy flow.
It is worth noting that in a meshed offshore grid, many times OWFs will be con-nected at the borders of interconnected systems. Therefore, the direct flow of electricityfrom these OWFs is uncertain. The energy may flow to different systems than to the onethat they are legally connected. Under this tariff alternative, we consider that the OWFwill pay G-charges to the country of “origin” notwithstanding the actual flow of energy.The differences in network usage would be then settled using an Inter-TSO Compensa-tion Mechanism.
OWF pays ex-post, according to measured energy flows
This alternative is based on the proposition made by the European Commission re-port (European Commission, 2016), in which “transmission charges will be estimatedbetween the countries based on the power flows”. This would be done a posteriori, andeach OWF owner would receive a bill to pay at the end of a given period. In a meshedoffshore grid scenario, it is plausible to imagine that depending on its electricity flowsand the number of interconnected systems, a single OWF would have to pay several dif-ferent tariffs as each network operator would bill the generator based on the tariff in theirregion and the use of their network by the OWF.
A key technical aspect to be considered for implementing such a tariff design in prac-tice would be metering of the flows. Some form of metering of the flows into differentsystems would have to be done, in order to compute the tariff that the offshore windwould have to pay. As the objective of this report is not to consider the technical solu-tions for a meshed offshore grid, but rather the economic and regulatory implications ofsolutions, we assume that this metering is technically possible and costs for this systemare acceptable.
OWF pays according to the bidding zone it sells its energy
In this option, the G-charges for the OWF would be based upon their commercialtransactions. More precisely, the OWF would pay G-charges proportionate to the energythat it sells in the different zones. This option assumes that OWFs will be allowed to selltheir energy in different zones. Currently OWFs are obliged to inject their generation only
Chapter 4. Transmission Tariff Design in a Meshed Offshore Context 53
into the system of the country that provides them with renewable support. The questionwhether OWFs would be allowed to participate in multiple markets in the future is stillunclear. This option makes sense only if the OWF is allowed to sell to all bidding zonesit is connected through the meshed offshore grid. If the wind farm is only allowed to sellin the country of origin, then this option becomes equal to the first option.
NSCOGI (2012b) explores the different possible market designs to integrate offshorewind farms connected to a meshed offshore grid. Regarding where the OWF bids, threeoptions are mentioned. In the first one, the OWF bids only in the national bidding zonewhere it is domiciled. In the second, the OWF can bid in different national bidding zones.In the third one, OWFs have their own offshore bidding zone. The alternative proposedhere is based on the second market design proposed by NSCOGI, in which OWFs are freeto bid in several bidding zones.
OWF is exempt of G-Charges
We observed previously that the transmission tariff designs amongst countries sur-rounding the North Seas are still unharmonized. On the other hand, a meshed offshoregrid would make the direction of flow of energy from the connected OWFs unpredictable.This unharmonized transmission tariff structures along with the unpredictability of theflows make efficient allocation of transmission costs to OWFs an arduous process. Itraises concerns regarding the risk that an incorrect allocation could lead to inefficientoutcomes and consequently have negative implication on investment incentives in off-shore wind.
Taking into consideration this concern, a radical alternative could be to simply ex-empt offshore wind farms from paying any G-charge that may be applicable to onshorepower generators. It should be noted that such an alternative would implicitly and ex-plicitly provide an incentive to offshore wind as compared to other onshore renewabletechnologies that would have to pay transmission tariffs. Also, in order implement, itwould require a greater regional perspective where all stakeholder countries implementthis “special transmission tariff exemption” for offshore wind.
OWF pays a regional offshore tariff
In this tariff design alternative, the OWFs would be required to pay a “regional off-shore tariff”. Under this option, a common G-charge would be established for OWFsin North Seas, and they would be only subject to this charge, and not the national G-charges applied to onshore generators. Once collected, the offshore G-charge would bedistributed among the countries involved in the mechanism, helping TSOs to recovernot only the cost of the meshed offshore grid itself, but also the cost of the main grid,considering the use the OWFs make use of the onshore network.
Chapter 4. Transmission Tariff Design in a Meshed Offshore Context 54
This regional tariff could be achieved in several scenarios. One option could be bi-lateral agreements between the participating countries to set an offshore G-charge value.Another alternative could be the creation of an Offshore Transmission System Opera-tor (OTSO) to operate the meshed offshore grid which would then have the mandate todecide the G-charge.
As proposed by Konstantelos, Moreno, and Strbac (2017), a regional ISO “could neu-tralize various types of ‘conflicts of interest’ by taking a country-agnostic view of welfareand being independent of network ownership. A regional ISO could also ensure that off-shore wind power across the North Seas is efficiently transferred among countries andwould be in a better position to evaluate the efficiency of transmission investment andthus to undertake strategic planning functions associated with the transnational powersystem.” However, it should be noted that such a regional approach and creation of anOTSO would require a strong political will and consensus.
4.4.2 Criteria for Assessing G-Charge Alternatives
We use a framework consisting of six criteria to evaluate the five transmission tar-iff allocation alternatives for offshore wind farms in a meshed grid scenario. This set ofcriteria is built based on existing legislation and the literature with an aim to provide aninsight into the legal, technical and economic soundness of these alternatives for com-puting G-charge to OWFs.
Cost Causality
The first criterion is cost causality, meaning that costs should be allocated to thosethat are responsible for the investment. It is equivalent to the “beneficiary pays” concept, as a transmission line is built when all the benefits of a given project exceed its costs(Pérez-Arriaga, 2013). This principle should help both the decision of when to build anew line (total benefits higher than total costs) as well as the allocation of such costs tothe ones that benefit from them.
Based on this concept of cost causality, it is reasonable to assume that generatorsshould also participate in the grid cost recovery, as they too benefit from a transmissiongrid. Note that part of the costs incurred may also be allocated to generators as connec-tion costs or through congestion mechanisms. It is also important to note that currently,many national transmission tariff designs do not comply with this criterion.
Commercial Transaction Independence
According to Pérez-Arriaga (2013), another important principle in transmission tariffdesign is that they should not depend on commercial transactions. As it is well known,
Chapter 4. Transmission Tariff Design in a Meshed Offshore Context 55
energy flows in power grids are independent of commercial agreements, and transmis-sion tariffs are aimed at the recovery of the physical use of the grid, caused by powerflows. Therefore, commercial transactions and grid usage can be completely different foreach user.
It is also contended in literature that, not only are commercial transactions unsuitableas a proxy for grid utilization, but they can also lead to tariff “pancaking”. This “ tariffpancaking” means that users would have to pay several transmission charges depend-ing on the number of administrative regions their transaction “crosses” (Pérez-Arriaga,2013). Thus, while evaluating transmission tariff alternatives, their level of dependenceon commercial transactions is a critical aspect.
Predictability and Stability ans Signaling
According to Pérez-Arriaga (2013), transmission tariffs are not only a way TSOs re-cover their costs, but also a mechanism to send economic signals to users. In order forthese economic signals to be efficient, the should be stable (over time) and predictablefor all agents in order to reduce the regulatory risk. This stability and predictability oftariffs is especially relevant for investment decisions. Pérez-Arriaga (2013) recommendthat ex-ante calculation would be the most effective way of setting tariffs. In the contextof this thesis, this criterion would aid in assessing the level of stability and predictabilityof the proposed tariff structures.
Transmission tariffs are not only a way TSOs recover their costs, but also a mecha-nism to send economic signals to users. In order for these economic signals to be efficient,the should be stable (over time) and predictable for all agents in order to reduce the regu-latory risk. This stability and predictability of tariffs is especially relevant for investmentdecisions. Pérez-Arriaga (2013) recommends that ex-ante calculation would be the mosteffective way of setting tariffs. In the context of this thesis, this criterion would aid inassessing the level of stability and predictability of the proposed tariff structures.
Transparency
The Regulation (EC) No. 714/2009 states that “the precondition for effective compe-tition in the internal market in electricity is non-discriminatory and transparent chargesfor network use including interconnecting lines in the transmission system.” Therefore,G-charges for offshore wind farms should be calculated using a transparent methodol-ogy.
Chapter 4. Transmission Tariff Design in a Meshed Offshore Context 56
Non-Discrimination
In conjunction to the statement made by the EU Regulation, transmission tariffsshould be established in a non-discriminatory fashion. As Lévêque (2003) explains, “non-discrimination means that conditions for access to the transmission network must notintroduce biases between generators and between industrial customers that compete inthe market. Users are authorized to gain a competitive advantage over their rival on thebasis of their merit only, not because they would benefit from better conditions for theuse of the grid.”
The non-discrimination principle, though, does not mean that the regulator is notallowed to set different prices for transmission services for different users. Tariffs can(and should) be cost-reflective without being a contradiction to the non-discriminatoryprinciple. The tariff applied to agents should be based on the cost that they impose onthe system and not their type (Lévêque, 2003).
The THINK report (Hirschhausen, Ruester, and Glachant, 2012) also highlights avoid-ance of distortion in competition as a key aspect of an effective transmission tariffs design.Transmission tariffs should be designed in such a way that they have the least possibleimpact on competition and aid in creating a level-playing field for all agents. This canbe especially difficult in a multinational environment with unharmonized tariff designs.Nevertheless, if some G-charge solution is to be implemented for OWFs, it should bedesigned in the least distortive way.
It is important to note that the non-discriminatory principle can be analyzed at dif-ferent degrees. The first one considers discrimination on a national level, that is: amongthe same type of users within a specific jurisdiction. In fact, this is the concept used by theRegulation (EC) No. 714/2009. In a second degree, the non-discrimination can be seen ata pan-European level in which interaction between users in different countries is consid-ered. As long as tariff designs are not equal across the Union, this type of discriminationwill exist. That is precisely the reason why the EU is pushing for a harmonization of tariffprocedures. In the following analysis, we focus on the first type of non-discrimination(within national borders), as this is the mandated by the current regulation.
4.5 Analysis of the Alternatives
Considering the five options and the five criteria described above, we propose thefollowing analysis to evaluate what would be the most suitable solutions for G-chargingpayments in a meshed offshore grid scenario. Table 4.3 presented below summarizes themain aspects of each option, followed by comments on each one.
Chapter 4. Transmission Tariff Design in a Meshed Offshore Context 57
FIGURE 4.3: Illustration of the analysis of Options for G-Charge Payments
• Country of origin: Prima facie, paying G-charges only in the country of originalong with an inter-TSO compensation mechanism might be a reasonable solutionin a meshed offshore situation from the cost causality perspective. Cost causal-ity, however, may not be ensured, due to the unpredictability of energy flows in ameshed grid. Therefore, the cost allocation method implemented by the country oforigin and the robustness of the inter-TSO compensation mechanism would havea significant impact on ability of this method to adhere to the cost causality prin-ciple. Tariffs for OWF would be independent of commercial transaction. As it canbe observed the mapping of the countries, in the current scenario tariffs are calcu-lated ex-ante thus making them predictable. As each country is required to com-ply with EU regulation, this mechanism is expected to be transparent. The sameapplies to non-discrimination, a feature mandated by EU regulation. It is worthnoting though that in the current situation, unharmonized tariffs designs betweencountries could create distortions in competitions.
• Paying ex-post based on flows: This solution will presumably meet the cost causal-ity goal, as it will be based on the actual power flows injected by wind farms in eachcountry. It will also be clearly independent from any commercial transaction. How-ever, the other criteria are hardly met. The calculation will be ex-post and wouldbe ineffective in providing a stable economic signal and thereby increasing risksfor offshore wind farm developers. It may create distortion in competition, as theOWF will have a different G-charge as compared to other users. Thus, it would notadhere to the non-discriminatory criterion. As the process involves metering bydifferent TSOs and complexity in auditing these values by the generator, the levelof transparency of this methodology may be considered low.
Chapter 4. Transmission Tariff Design in a Meshed Offshore Context 58
• Paying at bidding zones: As in this system the OWF pays the tariff dependingupon the zone in which it sells electricity, this tariff structure clearly does not meetthe cost causality principle. The physical flow of energy from a particular OWF in ameshed grid could be completely different compared to the commercial transactionthat the generator executes. It is clear that this tariff structure is strongly dependenton commercial transactions. As different G-charge regime is used for governingOWFs as compared to other generators, existence of discrimination is evident. Themethodology is transparent as all calculations are based on commercial transactionsand easy to measure and audit.
• Exemption: As the OWF does not pay any transmission tariff while being an ac-tive user of the transmission infrastructure, this method it fails in allocating costsaccording to benefits and clearly does not meet the cost causality principle. Theoption is independent of commercial transactions and transparent. If applied onlyto OWFs while other generators continue to pay G-charges this method would cre-ate distortions in the market and can be considered discriminatory. If transmissiontariffs are harmonized to zero G-charge in all countries around the North Seas, thenthe only criterion not met would be the cost causality and may be considered dis-criminatory between users but would not distort competition between generators.
• Regional Tariff: The adherence of regional tariff mechanism to the principle ofcost causality principle would depend upon the OTSO’s or the nation’s ability toimplement a robust regional transmission tariff. The dependence on commercialtransaction depends upon the method that the OTSO or the nations agree to usefor implementing the transmission tariffs and the same holds true with the level oftransparency. As it would be a special mechanisms for OWFs in a meshed grid, thissystem could be considered discriminatory and may create competition distortionbetween offshore and other generators.
4.6 Interim Conclusions
In this chapter, the impact of transmission tariff on offshore grids is discussed. Ageneral overview of transmission cost allocation is presented to guide the discussion.
A mapping of how ten nations adjacent to the North Seas deal with several aspects oftransmission tariff design was presented. From this mapping, we can conclude that trans-mission tariffs are still unharmonized across the countries surrounding the North Seas.Both, the amount of transmission costs levied on generation, and the form of transmis-sion charges vary considerably. This scenario could be considered detrimental from theperspective of developing a meshed offshore wind infrastructure and therefore greaterharmonization may be required .
Chapter 4. Transmission Tariff Design in a Meshed Offshore Context 59
Further, the impact of transmission tariffs on a meshed offshore grid is analyzed. Itis not clear, for instance, where OWFs will pay G-charges in a meshed context. Therefore,we proposed five alternatives and analyzed them based on five criteria. The criteria werechosen to assess the ability of the G-charge payment alternatives to legally, technicallyand economically viable.
In our analysis, the alternative in which an OWF pays their G-charges in the coun-tries they are located is the least regret one, as it adheres most closely to the criteria usedin this analysis. The method where the tariffs of the OWF are calculated based on actualflows would adhere to the cost causality principle and be independent of commercialtransactions. However, transmissions charges may be hard to predict and audit. There isalso a risk of discrimination as this method would be offshore specific. Charging OWFsbased on the bidding zones where they sell electricity would mean that the tariff is fullydependent of commercial transactions, does not follow the cost causality principal andis discriminatory. On the other hand, such a tariff could be predictable and transparent.If the OWF are exempted from paying transmission tariffs, the cost causality principlewould not be met and the method would be discriminatory. However, the tariff wouldbe independent of commercial transactions and transparent. The alternative in which re-gional tariff set by an offshore-TSO is strongly dependent on how the tariff would be setby the Offshore-TSO.
60
Chapter 5
Economic Incentives for Investmentin Meshed Offshore Grids
In this chapter, another particular aspect of the development of a meshed offshoregrid will be analyzed, namely the economic incentives for TSOs to invest in a meshedoffshore grid. As already mentioned in Chapter 3, meshed offshore grids will representa big investment for TSOs, and possibly a riskier type of investment. Therefore, thischapter tries to answer the following question:
Are the current economic incentives for TSOs suitable for the investment in a meshedoffshore grid in the North Seas?
In order to answer this question, firstly a series of definitions are needed to under-stand precisely the boundaries of the research and the reasoning behind the choices forthe research scope. The second step is defining the methodology used in the assessmentof the problem. A third step consists of data gathering and interpretation according tothe chosen methods. Finally, an answer can be proposed and conclusions made.
5.1 Definitions
5.1.1 Economic Incentives
Since the liberalization of the power sector, the concept of incentives has often beenused in the industry. The so-called "incentive regulation" is the main standard practiceamong European regulators. However, although the concept is commonly used, its def-inition is not always stated and such lack of definition can be misleading. One can firstdefine “economic incentives for investment” as the economic drivers for TSO investingin a new asset. That definition, though, would lead to the conclusion that the outcome ofthe CBA, for instance, is part of the economic incentive. The definition, although valid,offers a very broad perspective. Considering the puzzle described in Chapter 3, manypieces would be part of this concept of incentives. Therefore, a narrower definition isneeded.
Chapter 5. Economic Incentives for Investment in Meshed Offshore Grids 61
Economic theory has a particular definition for incentives. It deal with the principal-agent problem, considering the information asymmetry between them, as explained byLaffont and Martimort (2002):
“The starting point of incentive theory corresponds to the problem of delegating atask to an agent with private information. This private information can be of twotypes: either the agent can take an action unobserved by the principal, the caseof moral hazard or hidden action; or the agent has some private knowledge abouthis cost or valuation that is ignored by the principal, the case of adverse selectionor hidden knowledge. Incentive theory considers when this private informationis a problem for the principal, and what is the optimal way for the principal tocope with it. Another type of information problem that has been raised in theliterature is the case of nonverifiability, which occurs when the principal and theagent share ex post the same information but no third party and, in particular,no court of law can observe this information. One can study to what extent thenonverifiability of information is also problematic for contractual design.” (p. 4)
The definition above can be easily translated to the power business context. Theregulatory authority is the principal, and the regulated company is the agent. Indeedregulators delegate certain activities to utilities, and information asymmetry is created.Therefore, incentives are used by the regulator to steer utilities’ actions towards the de-sired outcomes in the presence of information asymmetry.
In a more practical way, ACER (2014) defines regulatory incentives in the followingway:
“By incentives, the Agency means any regulatory measures, financial, coercive,moral, etc., which aim to motivate a project promoter to take a particular courseof action (e.g. commissioning an infrastructure project by a defined deadline). Inthis recommendation, regulatory incentives comprise risk mitigation regulatorymeasures and monetary reward or penalty schemes to achieve such purpose.”
It’s important to note that the passage above highlights the fact that incentives arenot only monetary measures. Coercive and moral incentives can also be used by regula-tors. A typical example of moral incentive is the “sunshine regulation”, that is intendedto simple “name and shame” bad utilities creating, therefore, a moral push for improve-ment (Decker, 2014). Another important remark from ACER’s definition is regarding theconsideration of “risk mitigation regulatory measures and monetary reward or penaltyschemes”.
The European Commission (2014b) also understands incentives as the influence overthe risk-reward ratio in order to foster investments.
In this study, regulatory incentives are defined as mechanisms incorporated inthe regulation that facilitate or stimulate investments. The purpose of such mech-anisms is to influence the risk-reward ratio resulting from the regulation. In
Chapter 5. Economic Incentives for Investment in Meshed Offshore Grids 62
general, such mechanisms can facilitate or stimulate investments in two ways,namely by mitigating risks for project promoters and/or by increasing rewardsfor project promoters. (European Commission, 2014b)
Therefore,
Economic incentives are understood here as the appropriate risk-reward ratio oninvestment set by the regulator.
We note though that both ACER and the Commission define the risk mitigation andreward adjustment as “regulatory incentives”. However, in order to avoid confusionwith other regulatory measures that can influence the regulated company’s decision, weuse instead the concept of "economic incentives".
Therefore, economic incentives are not to be confused with economic drivers andother drivers for the project developer’s actions. In the meshed offshore grid, manyother aspects will lead TSOs to investments or discourage them. In some sense, theseaspects can be seen is Figure 3.1. The outcome of the CBA analysis, and after, the CBCAnegotiation will heavily influence the TSO’s decision, as well as legal and financeabil-ity conditions. However, these are not considered economic incentives here, but exoge-nous investment drivers to this analysis. They are part of the investment function for theproject promoter, but they are considered ceteris paribus.
5.1.2 Economic Incentives for Whom?
The definition of economic incentives developed above already states that we ana-lyze the risk mitigation and reward or penalty measures for TSOs, and therefore we limitour analysis to this type of regulated company. Although that is the general situationfor investments in onshore assets in European countries, as most of them apply a TSOmodel, that is not the only governance option for transmission investment.
As mentioned in Chapter 3, the literature identifies that a meshed offshore grid willbe composed of hybrid assets, also called multi-purpose assets. These assets are charac-terized by the fulfillment of two purposes at the same time: they are both a connectionfor the OWF to the main grid, and they are also interconnectors. Looking at who devel-ops these two types of assets at the present days, we realize that TSOs are not the onlyinvestors.
For the case of farm-to-shore connection, Fitch-Roy (2015) identifies three possibleagents responsible for installing these lines and other components, namely the TSOs, thewind farm developers and third parties (as is the case in the UK, with the OFTO model),as mentioned in Chapter 3. However, although this three participants can be responsible
Chapter 5. Economic Incentives for Investment in Meshed Offshore Grids 63
for the development of the connection farm-to-shore, it seems there is a tendency forTSO-led model, as shown by Müller (2015):
“A comparable development can be observed concerning the park-to-shore cablesconnecting the offshore wind farms. As a first step, the North Sea states have con-sidered these cables between the offshore wind farm and the onshore grid as partof the installation, for which the wind farm developer was responsible. With theincreasing scale of offshore wind energy and the increasing distance from shore,this approach is gradually changing: as a second step, the park-to-shore cables areconsidered as a separate activity, either under the responsibility of the nationalTSO, such as in Denmark, Germany and expectedly in the Netherlands, or underthe responsibility of a third party such as the OFTO.” (p. 145)
This conclusion is also reinforced by Fitch-Roy (2015):
“There has been innovation in the way offshore wind farms are connected to theonshore transmission system and in all five cases a ‘generator model’ connectionhas been abandoned in favour of two alternative models, possibly due to the re-quirements of the EU’s third electricity liberalization package.” (p. 13)
“Also, the cost and returns to scale for offshore wind grid connections that canaccount for up to 20% of a project’s capital expense create a powerful functionalargument at the member state level for TSOmodels (European Commission, 2008;BVG, 2010)1 with the UK’s third-party approach an interesting exception.” (p.13)
Therefore, we can conclude that most of offshore farm-to-shore connection are doneby TSOs today in the countries of the North Seas. On the other hand, are TSOs also themain developers of offshore interconnections?
There are two main business models for cross-border interconnection investment,namely the regulated investment model and the merchant investment model. The firstone refers to the interconnectors built by TSOs, while the second regards investmentsmade by private agents. The revenue source for these two models is different. In the reg-ulated model, the TSO will recover the cost of the interconnector through transmissiontariffs, as explained in chapter 4. The merchant model, however, is a profit-driven invest-ment, and investment costs can be recovered either through the congestion rents or thesale of financial (or physical) transmission rights (Poudineh and Rubino, 2017). Becauseof this profit-seeking characteristic of merchant lines, they are expected to be done in anunder-investment way, in order to maintain price differences.
Under European regulation, the regulated model is preferred and presented as thestandard model for transmission investment:
1European Commission. (2008). Offshore wind energy: Action needed to deliver on the energy policyobjectives for 2020 and beyond; BVG. (2010). A Guide to an Offshore Wind Farm. London: The CrownEstate.
Chapter 5. Economic Incentives for Investment in Meshed Offshore Grids 64
Each independent system operator shall be responsible for granting and managingthird-party access, including the collection of access charges, congestion charges,and payments under the inter transmission system operator compensation mech-anism in compliance with Article 13 of Regulation (EC) No 714/2009, as well asfor operating, maintaining and developing the transmission system, and forensuring the long-term ability of the system to meet reasonable demandthrough investment planning. When developing the transmission system, theindependent system operator shall be responsible for planning (including autho-risation procedure), construction and commissioning of the new infrastructure.For this purpose, the independent system operator shall act as a transmissionsystem operator in accordance with this Chapter. The transmission system ownershall not be responsible for granting and managing third-party access, nor forinvestment planning. Directive 2009/72/EC, Article 13(4)
The merchant model, although possible under EU regulation, is treated as an excep-tion, and has to meet certain criteria to be allowed. These criteria are set in the out inarticle 17(1) of Regulation (EC) No 714/2009, and are five:
• Investment must enhance competition in electricity;
• Risk is such that the investment would not take place unless an exemption is granted;
• The interconnector must be owned by a natural or legal person which is separatefrom the system operators;
• Charges are levied on users of that interconnector;
• No part of the capital or operating costs of the interconnector has been recoveredfrom any component of charges made for the use of transmission linked by theinterconnector; and
• The exemption must not be to the detriment of competition or the effective function-ing of the internal market in electricity, or the efficient functioning of the regulatedsystem to which the interconnector is linked.
According to Poudineh and Rubino (2017), only five exemptions for merchant inter-connectors were granted in the EU, and in most cases, they included additional condi-tions to ensure regulatory compliance. Therefore, we can also conclude that for intercon-nectors, the TSOs are the main project developers.
In a meshed offshore grid context, several business models can be imagined, com-bining characteristic of the already existent businesses models from farm-to-shore con-nections and interconnections. However, considering that today, for both types of trans-mission assets, the TSO has the leading role, we focus the following analysis on this kindof project developer.
Chapter 5. Economic Incentives for Investment in Meshed Offshore Grids 65
Moreover, some other characteristics of the meshed offshore grid also reinforce theconclusion that TSO business model will be the main one, at least in the early devel-opments of a meshed grid in the North Seas. The first one is the fact that anticipatoryinvestments are expected to be made. Meshed offshore grids will most probably not bedeveloped in a “big-bang” approach, but rather in a “step-by-step”. Müller (2015) con-firms this idea when he observes that, first connections farm-to-shore were developed byOWF developers, then TSOs assumed this task, and in a third stage they should evenbuild the hubs for the OWFs. This is already being developed by TSOs from Germany,Belgium and The Netherlands. The Dutch program of offshore investment is even calledthe “socket at the sea” (Loyens Loeff, 2014). Elia, the Belgium TSO, also mention theinitiative on their website:
“Until now, all North Sea wind farms have been connected individually to the on-shore grid. With the creation of a modular grid or ‘power socket’, wind farms willbe connected to a high-voltage substation located on an offshore platform, whichwill, in turn, be connected to the onshore grid. The exact design of the modulargrid and its regulatory framework are currently being examined, in collaborationwith the various stakeholders.” (...) “In the long term, the modular grid infras-tructure will then be connected to an international platform using direct-currentconnections. These make it possible to transmit greater quantities of power overlonger distances. Some of Belgium’s neighboring countries, like the United King-dom and the Netherlands, are also working to develop grids in their territorialwaters in the North Sea.” (Elia, 2017c)
Besides the anticipatory investments, meshed offshore grids may also be riskier asexplored in the next section, and therefore good financeability will be required. For allthe reasons mentioned above, we choose for analyzing economic incentives for TSOs,although other business models may be possible in a meshed offshore grid.
5.1.3 Is a Meshed Offshore Grid Riskier?
We defined that economic incentive is the risk and the reward allocated to the TSOfor a certain investment, and thus, the risk is an important component. In this section,we verify if the level of risks in meshed offshore grids is higher than those for othertypes of investment in transmission assets. For this purpose, we define the possible typesof investment in transmission assets considering their general characteristics in termsof responsible agents, planning procedures and jurisdictions involved. Then, we use aframework of risk assessment to qualitatively understand what are the exclusive risksin meshed offshore grids, or at least the ones that can be considerably higher for thisinfrastructure, compared to the other types of investment.
Chapter 5. Economic Incentives for Investment in Meshed Offshore Grids 66
Types of Transmission Asset Investments
Transmission investment has been a very stable activity for many decades. The mainconcern of utilities was to expand national grids to cope with demand increase and en-sure the security of supply. In the last decades in Europe, however, other reasons arealso driving transmission investment. The need for interconnection is now more relevantthan never, as Europe tries to consolidate the internal market of electricity. Europeanrenewables targets also have an impact in transmission investment, as corridors may berequired to carry electricity from cheap non-dispatchable generation to where renew-ables can not be so largely installed. Therefore, a bigger portion of the new investmentsin transmission will be cross-border, as it is indeed shown by ENTSO-E (2014) in Figure5.1. An increasing part of investments come from the Ten-Year Network DevelopmentPlan (TYNDP), that include mainly cross-border investments.
FIGURE 5.1: Transmission Investment volumes in Europe: Past versus Fu-ture. Source: ENTSO-E (2014)
Investment in transmission assets, as of today, can be divided into three types. Thefirst one can be defined as the expansion of the grid. It is composed of reinforcementsmade by TSOs to adapt the network to new demand profiles and replace old assets. Thetransmission expansion planning (TEP) is usually done by the use of optimization toolsby entities at national level (Niharika, Verma, and Mukherjee, 2016). The TEP is carriedusually by the system operator and approved by the regulator, especially in the case inwhich a TSO model is in place, to avoid perverse incentives.
Chapter 5. Economic Incentives for Investment in Meshed Offshore Grids 67
The second type of investment in transmission assets is the connection of a user tothe grid. This type of investment is different from the TEP for a number of reasons.The first one is that these assets are not centrally planned by the system operator, butis spontaneously demanded by the user. For this type of asset, the causality of the costis usually easily recognizable, as a single line will connect a single user. Therefore, thiscost can be easily allocated to the user demanding such connection. As explained in moredetail in Chapter 4, regulatory frameworks can do this cost allocation in three ways: deep,shallow and super-shallow. A deep connection charge means that the user is responsiblefor the payment of the infrastructure connecting the user to the grid and the requiredreinforcements if needed. The shallow connection charge is when the user pays only theinfrastructure to connect to the grids, and on the super-shallow approach, the user doesnot have to pay for the connection and this cost is socialized.
The third type of investment in transmission assets is regarding cross-border inter-connectors. This type of assets, although it can be forecasted by the TEP, is usually con-ceived in a bilateral negotiation or regional level. That is due to the fact that these typeof assets involve more than one country, and therefore the investment decision followsa joint analysis and negotiation process, as described in Chapter 3. They can be identi-fied at the European level by the TYNDP, or bilaterally by project promoters in differentcountries.
Considering the characteristics of what a meshed offshore would be, it does not com-pletely fit in any of the three categories mentioned above. This means that a new typeof investment in transmission asset will arise. Maybe this new type is not exclusively tothe offshore grid, but also extendable to the concept of a supergrid or and HVDC grid. Infact, the meshed offshore grid is identified by the Hertem, Gomis-Bellmunt, and Liang(2016) as a sub-case of a Supergrid. This new type of investment will bring several differ-ences from the previous ones. One project may be developed not in one or two countries,but in several countries. This adds complexity and changes the planning and permittingprocess, as several agents have to be satisfied with the benefits and the sharing of costs.The investment decision for this projects will come from a regional discussion necessar-ily. The permitting process will potentially more complex as well, as several legislationswill have to be obeyed in this multijurisdictional environment. Market rules in this assetswill also have specificities not found in other parts of the system (e.g. capacity allocationand bidding zones described in chapter 3).
Risks in Meshed Offshore Grids
The TEN-E Regulation, when referring to investment incentives for PCIs in article 13,states that ACER should “shall facilitate the sharing of good practices and make recom-mendations” regarding dedicated incentives and benchmark of best practice by nationalregulatory authorities, and regarding “a common methodology to evaluate the incurredhigher risks of investments in electricity and gas infrastructure projects”. Therefore, to
Chapter 5. Economic Incentives for Investment in Meshed Offshore Grids 68
analyze if meshed offshore grids would be riskier than onshore expansion, user connec-tions and interconnectors, we make use of the risk assessment framework developed byACER in the Recommendation 03/2014 (ACER, 2014).
The methodology for risk evaluation developed by ACER is composed of five cat-egories. According to the agency, “all project risks can, in general, be subsumed underfive categories of risk from the perspective of the project promoter”. The five categoriesare:
• The risk of cost overruns: The risk that of costs of a project turn out to be higherthan expected
• The risk of time overruns: The risk that development and construction of a projecttakes longer than anticipated
• The risk of stranded assets compensated: Risk that there is not demand for theservice the project offers after construction
• Risks related to the identification of efficiently incurred costs: The risk that costsare not considered as being efficiently incurred by the regulator
• Liquidity risk: The risk of not being able to meet financial commitments
For each of the above-mentioned categories, and considering the differences formeshed offshore investments, we comment in which way meshed offshore grids wouldbe riskier than the other types of transmission investments.
For the risk of cost overruns, the major uncertainty is the technology to be employedin the developments of meshed offshore grids. As shown in chapter 3, this the offshorenetwork is expected to be developed in HVDC technology, and many components andoperational procedures are still being developed. As such, the early investments in the in-tegrated solution will be more likely to cost overruns than more established transmissioninfrastructures such as the ones used in grid expansion, user connection and interconnec-tion.
The risk of time overruns will be heavily impacted by the multijurisdictional envi-ronment in which meshed offshore grids will be developed. As shown in Chapter 3, thisis already a problem for many PCIs being developed as of today. Although European reg-ulation pushes for a “one-stop shop” permitting process for PCIs, more countries will beinvolved in meshed solutions, and if procedures are not well coordinated, time overrunscan happen.
The risk of stranded asset is also big in meshed offshore grids. This is mainly due totwo factors. Firstly, from the perspective of a project promoter, investments in a meshedsolution will be always dependent on the investment of other project promoters. Thisis already the case in interconnectors, but as this type of investment involves only twoparties and investments are usually not modular, this risk becomes considerably lower.In the case of hybrid and modular projects, many parties are involved. Not only the grid
Chapter 5. Economic Incentives for Investment in Meshed Offshore Grids 69
investments will impact the outcome in meshed solution, but also the development of theOWFs. OffshoreGrid (2011) shows that this dependency on the development of OWFs.If the grid is developed, but some of the expected OWFs are not, a portion of the gridwill be stranded. Another possibility is the non-development of some part of the gridby another grid developer. This case was already observed in the Kriegers Flak project.Originally, this was a project expected to interconnect Germany, Denmark, and Sweden,as well as OWFs, as illustrated in figure 5.2. However, Sweden decided not continuewith the project that is now being developed just by Germany and Denmark. Althoughthis withdrawing from Sweden happened before the beginning of the deployment by theother countries, and therefore no stranded asset was created, it could also happen afterthe construction was initiated. It is important to note that these assets cannot be rede-ployed. Using the concept from Williamson (1988), these investments are characterizedby a big asset specificity 2
FIGURE 5.2: Kriegers Flak: original project. Source:http://www.offshorewind.biz
Regarding the risk related to the identification of efficiently incurred costs, it is veryrelated to the perception of the NRAs, but it can be related to the uncertainty faced byproject promoters in the planning phase. The main consideration for the meshed offshoregrid is the fact that this network is still a greenfield development. Thus, uncertainty isstill high and the efficiency of the investment cannot be safely predicted.
For the last type of risk, the liquidity risk, we don’t observe a unique characteristicin meshed offshore grids, but rather a risk for the financeability of TSOs in general, asdiscussed in Chapter 3.
2“Asset specificity has reference to the degree to which an asset can be redeployed to alternative uses and by al-ternative users without sacrifice of productive value. This has a relation to the notion of sunk cost.” (Williamson,1988)
Chapter 5. Economic Incentives for Investment in Meshed Offshore Grids 70
TABLE 5.1: Summary of main risk factors in meshed offshore grids
Risk categoryExclusive or highly relevant riskfactor for meshed offshore grid
Stranded assetsAsset specificity and dependenceon other party’s investment
Identification of efficient investmentsGreenfield investment, scenariodependence
Liquidity risk -
5.1.4 Countries analyzed
For the following analysis, five countries were chosen, namely the United Kingdom,Germany, Denmark, The Netherlands, and Belgium. These five countries were chosenbecause of their relevance to the development of offshore wind power. As of 2016, theyaccounted for 97.8% of the installed offshore wind capacity in Europe (Wind Europe,2017).
FIGURE 5.3: Offshore installed capacity - Cumulative share by country(MW). Source: Wind Europe (2017).
Chapter 5. Economic Incentives for Investment in Meshed Offshore Grids 71
5.2 Methodology
In the previous section, we define the scope of the research and we analyze qualita-tively how riskier investments in a meshed offshore grid would be in comparison withthe other three types of investments in transmission infrastructure. In this section, wedefine how to assess if the national regulatory frameworks offer enough incentives forthis riskier type of investments.
This analysis is divided into two parts. In the first one, the default national regu-latory frameworks are analyzed. In the second, ‘dedicated incentives’ for riskier invest-ments will be evaluated.
5.2.1 Default National Regulatory Frameworks
As shown by Meeus and Keyaerts (2014), a default national regulatory frameworkis usually applied to remunerate all transmission projects, independent of their charac-teristics and risk profiles. This is a common practice since most regulatory regimes treatinvestments on a portfolio basis. In general, when the TSO makes an investment, thenew asset is included in the regulatory asset base (RAB), and the RAB is remuneratedaccording to a weighted average cost of capital (WACC), composed by the cost of debt(CoD) and return on equity (RoE).
WACC =Debt
Debt+ Equity∗ CoD +
Equity
Debt+ Equity∗RoE (5.1)
The CoD is the cost of external capital while the RoE is the return on the share-holder’s capital. To calculate the RoE, regulators usually rely on the capital asset pricingmodel (CAPM) (Pérez-Arriaga, 2013).
RoE = Rf + β ∗ (Rm−Rf) (5.2)
where
Rf is the risk-free rate of interest,
Rm is the expected return on an efficient market portfolio, and
β is the volatility of the value of the company’s financial assets (shares) compared toaverage market volatility.
By analyzing both the WACC and CAPM models, one can easily see that no projectis considered individually, but in a portfolio fashion. In fact, ACER (2014) notes that
“This very common risk evaluation approach focuses on the identification of thelevel of systematic risk for the overall transmission activity through the “beta”
Chapter 5. Economic Incentives for Investment in Meshed Offshore Grids 72
coefficient, which is usually included in the formula for the weighted average costof capital (WACC).” (pg. 3)
While the systematic risk is expected to be considered by the CAPM model, project-specific risks are not. These are to be balanced through the portfolio effect, meaning thatone project’s loss is supposed to be compensated by other project’s gain.
Therefore, considering the portfolio-based characteristic of default national regula-tory frameworks, in the first part of the analysis, these default frameworks are analyzedto assess if they provide economic incentives for riskier investments. To carry this analy-sis, we use an analytical framework based on the one developed by Glachant et al. (2013).
In this Research Report published by the Florence School of Regulation, Glachantet al. provides an in-depth analysis of incentives for investments by European TSOs. Thereport recognizes the large volume of investments needed in transmission assets in thecoming years and poses the question if national regulatory regimes can cope with theneed for investment. Thus, an analytical framework is developed. National regulatoryregimes are analyzed based on four main economic aspects of regulatory regimes. Theyare defined as the capability to:
1. Sufficiently remunerate TSO investments and to ensure their financeability.
2. Reduce the risk born by the TSO.
3. Incentivise TSO cost reduction.
4. Transfer efficiency gains and redistribution to final users.
To analyze if these economic aspects hold on regulatory regimes, five main charac-teristics are investigated for each country.
1. The length of the regulatory period
2. The scope of the revenue cap (TOTEX versus building blocks)
3. The tools to define allowances and efficiency targets (benchmarking versus cost andefficiency audit)
4. The practical setting of the capital remuneration
5. The adjustment mechanisms
The way regulators set these characteristics impact directly on the economic proper-ties of the regulatory regime. For instance, the scope of the revenue cap will have a directinfluence on the capability to reduce the risk borne by the TSO and to incentivize costreduction. On the one hand, if the revenue cap is applied on TOTEX3, there is a higherrisk for the TSO and a high incentive for total cost reduction. On the other hand, if therevenue cap is applied only on controllable OPEX, there is reduction of risk for the TSO
3TOTEX stands for total expenditures. It includes the CAPEX, or capital expenditures, and the OPEX, oroperational expenditures.
Chapter 5. Economic Incentives for Investment in Meshed Offshore Grids 73
(as the TSO will not bear the risk for CAPEX and non-controllable OPEX) and the incen-tives for cost reduction are also limited (no incentive for cost reduction on investment, forinstance). The same reasoning applies to every characteristic and every economic aspect.
The research report defines two extreme regulatory regimes. The first one is the“risk of gold plating zone”, in which TSOs have a very high remuneration and bear avery low risk. On this region, TSOs have very high incentives to invest, and possiblythey will over-invest. The other extreme is the zone called “risk of underinvestment”.This hypothetical regime is characterized by high incentives for cost reduction and a lowremuneration.
The study carries an analysis of five different countries using the framework de-scribed above. The selected countries are: Belgium (regulatory period from 2012 to2015), France (regulatory period from 2013 to 2016), Germany (regulatory period from2014 to 2018), Great Britain (regulatory period from 2013 to 2021) and the Netherlands(regulatory period from 2014 to 2016). The report concludes that a misalignment amongregulatory regimes exists, and that a harmonization is desirable if the needed Europeaninvestment is to be made.
The methodology used here is based on the report by Glachant et al. (2013). First, weinvestigate the five characteristics mentioned above for each national regulatory frame-work. For each characteristic, certain choices made by the regulator will put more or lessrisk to the regulated company, or more or less remuneration.
The length of the regulatory period, for instance, increases the risk for the regulatedcompany as it gets longer. In general, a long regulatory period gives a higher incentivefor cost reduction, as the shorter the regulatory period gets, the closer it is of a cost-plusregulation. Also, a longer regulatory period incorporates more uncertainties, as the ex-ante assumptions will impact the utility for a longer period. A big regulatory period alsoincreases the regulatory risk, as the regulator may be tempted to review the revenue capduring the regulatory period (Glachant et al., 2013).
The scope of the revenue cap is also an important instrument of risk allocation. Con-sidering one extreme, the revenue cap can be based on the TOTEX of the regulated com-pany. Thus the company has incentives to reduce costs on the operations but also onthe investments. With this configurations, the regulator considerably increases the riskfor the TSO. On another extreme, the revenue cap can be applied only on the so-called“controllable OPEX”, meaning that both CAPEX and the part of the OPEX that the com-pany has less control over are treated as pass-through items. The risks, in this case, aretransferred from the TSO to the grid users. In between these two extremes, other formsof “building block” approaches are possibles, allocating more or less risk to the utilities.
The tools to define the revenue caps can also impact on the risk born by the TSO.Three main tools are used for this purpose. The first and maybe more common is theefficiency audit, and it is based on the detailed analysis of costs of the TSO. The momentof this detail analysis matters. An ex-post efficiency audit introduces risk for the TSO,
Chapter 5. Economic Incentives for Investment in Meshed Offshore Grids 74
and therefore can be combined with ex-ante evaluation of investments (Glachant et al.,2013). Another way of setting the revenue cap is through a menu of contracts. In thismethod, the regulator offers to the TSO several possible levels of risks with differentallowed revenues. The third method of revenue cap setting is through benchmarking,also called yardstick. This method usually tries to set an efficiency frontier from a sampleof companies. For this method, the important feature is the comparability between thesample and the regulated company (Glachant et al., 2013).
The fourth characteristic to be analyzed is the remuneration itself and the tools to setit. As already mentioned, most regulatory regimes define a WACC for the TSO. Withinthe WACC, the treatment of the CoD may vary. The regulator can accept the real CoD orestimated it. The gearing (ratio between debt and equity) is also an important measure.If not properly set, it will increase or decrease the remuneration for the TSO. The RoEmay also vary considerably, and in it is the expected return for the TSO over the servicesthey provide.
Finally, we also analyze if the default regulatory mechanisms also provide adjust-ment mechanisms, usually to correct distortions created by ex-ante assumptions. Oneexample is the volume adjustment. The OPEX estimation, and consequently the revenuecap, take into consideration an assumption of future demand. If the assumption provesto be wrong, regulators can adjust the revenues accordingly ex-post. In fact, the adjust-ment can be used not only to ex-ante assumptions but also to other exogenous factorsthat may impact the TSO’s outcome.
After analyzing each of the five characteristics of the five selected countries, we plot,in a stylized and illustrative way, the relative position of the default national regulatoryframeworks according to risk and reward, as proposed in Figure 5.4 below. The plot isbased on the work by Glachant et al. (2013) and shows three diagonal regions. The leftupper corner is the "risk of under-investment" area, in which TSOs bear very high riskand have a low remuneration. The mid-upper diagonal section represents a situation inwhich the TSO has elevated risks and not so high remuneration. In this regions of theplot, TSOs are incentivized to reduce costs in the short term and therefore consumptionof electricity is expected to be higher as the tariffs reduce (Glachant et al., 2013). Themid-lower section represents the situation in which TSOs have a high remuneration inproportion to the risks born. This situation is expected to incentivize investments, bringcost reduction in the long term and short term benefits for shareholders (Glachant et al.,2013). Lastly, the bottom-right corner is the "risk of gold plating" region, that should beavoided by regulation, as TSOs would be incentivized to over-invest.
Chapter 5. Economic Incentives for Investment in Meshed Offshore Grids 75
FIGURE 5.4: Stylized plot of Economic Incentives provided by Default Na-tional Regulatory Regimes.
5.2.2 Dedicated Incentives
Glachant et al. (2013) provides one approach when analyzing the capacity of thenational regulatory regimes in providing efficient economic incentives for investments.The analysis focus on the general regulatory framework, and therefore apply to all in-vestments. Keyaerts and Meeus (2015), however, points an alternative direction when itcomes to incentivising specific types of investment:
"Glachant et al. (2013)4 argue that in the tradeoff between the investment riskand the remuneration of the transmission firm, the national regulatory frameworkshould ensure that the remuneration is sufficient for all investment, including theinvestment that is subject to greater cost uncertainty. This approach is fine to theextent that the necessary investment is comparable to regular investment. How-ever, it could be less costly to offer dedicated incentives only to the strategicallyimportant investment, on a case-by-case basis, whereas regular investment re-mains subject to standard regulatory treatment. These dedicated incentives com-prise a customization of one or more of the main regulatory parameters, which arethe length of the regulatory period, the return on equity, the specified efficiencytargets, and the scope of the revenue cap." (Keyaerts and Meeus, 2015)
On the referred paper, Keyaerts and Meeus (2015) explore how these dedicated in-centives can be set, and offer to the reader an analysis of the mechanisms used in twocountries, Italy and the United States. The former apply a fixed additional remuneration
4The author refer to Glachant et al. (2013)
Chapter 5. Economic Incentives for Investment in Meshed Offshore Grids 76
if the project is considered strategical and meet some requirements, while the latter car-ries a detailed case-by-case analysis that may lead to additional remuneration and riskmitigation measures.
In this context, the second part of the analysis for each country is focused on thepresence of dedicated incentives for riskier investments, with special focus to offshoreinvestment. In fact, this is already mandated by the TEN-E Regulation for PCIs. Article13(1) states that
"Where a project promoter incurs higher risks for the development, construction,operation or maintenance of a project of common interest falling under the cate-gories set out in Annex II.1(a), (b) and (d) and Annex II.2, compared to the risksnormally incurred by a comparable infrastructure project, Member States and na-tional regulatory authorities shall ensure that appropriate incentives are grantedto that project in accordance with Article 37(8) of Directive 2009/72/EC, Article41(8) of Directive 2009/73/EC, Article 14 of Regulation (EC) No 714/2009, andArticle 13 of Regulation (EC) No 715/2009."
5.3 Case Studies: Default Regulatory Frameworks
5.3.1 Great Britain
In Great Britain, the Office of Gas and Electricity Markets (Ofgem) is the NationalRegulatory Authority and therefore regulate the TSOs in England, Scotland and Wales.They are four: National Grid Electricity Transmission (NGET), responsible for Englandand Wales, Scottish Hydro-Electric Transmission Limited (SHET), responsible for theNorth of Scotland, and Scottish Power Transmission Limited (SPT), responsible for theSouth of Scotland (Ofgem, 2017c). 5
The Great Britain was a pioneer in the implementation of incentive regulation inthe early 90’s with the RPI-X system (Nixon, Review, and Finance, 2009). The RPI-Xis still one of the main regulatory regimes for incentive regulation. In this regime, theregulator establishes ex-ante the yearly allowed revenue for the upcoming regulatoryperiod. The regulated company will receive that revenue adjusted for the inflation (RPI)and an efficiency index X. This efficiency index is an incentive for the company to reducecosts. If the company does not reach such cost reductions, they will operate at a loss,while if they can reduce expenses in a higher ratio than the X factor, the company canaccount for the extra money as profit.
5Note that we analyze the Great Britain and not the United Kingdom as a whole. That is because inNorthern Ireland, another regulatory regime is in place, set by the Northern Ireland Authority for UtilityRegulation (the Utility Regulator), different from the one set by Ofgem in Great Britain.
Chapter 5. Economic Incentives for Investment in Meshed Offshore Grids 77
However, in 2010, Ofgem announced a profound change in the regulatory regime.The new framework in place since 2013 is called RIIO, standing for “Revenue = Inno-vation + Incentives + Output”. It shifts from the idea of regulating inputs to regulatingoutputs. Regulated companies should provide outputs to their customers at the mini-mum cost. These outputs are divided into six categories: customer satisfaction, reliabil-ity and availability, safety, conditions for connection, environmental impact, and socialobligation (Ofgem, 2010). Utilities should elaborate a business plan at the beginning ofthe regulatory period stating how they plan to achieve such outputs. This business planis evaluated by Ofgem and serves as a reference when setting the allowed revenues.
Length of the Regulatory Period
The regulatory period lasts for eight years. In fact, it is still the first regulatory pe-riod for the RIIO framework (referred as RIIO-T1 for the transmission companies (Ofgem,2013a)). It started in 2013 and will finish in 2020. In the middle of the regulatory period, amid-period review is expected to happen. This review was just completed for the first pe-riod for National Grid. As a result, Ofgem reduced National Grid’s spending allowancesby £185 million (Ofgem, 2017b), adjusting the required revenues accordingly to the re-duction of necessary investments.
Scope of the Revenue Cap
The revenue cap follows a TOTEX approach in GB, meaning that both OPEX andCAPEX are subject to a cap establish by Ofgem. The TOTEX revenues are divided intotwo types, namely fast money and slow money. The former is a percentage of the TOTEXthat the utility is allowed to recover in one year. The rest of the TOTEX, called slowmoney, is included in the Regulatory Asset Value (RAV), is depreciated and remuneratedaccording to a WACC (National Grid, 2016).
FIGURE 5.5: RIIO regulatory building blocks. Source: National Grid(2016).
Chapter 5. Economic Incentives for Investment in Meshed Offshore Grids 78
Definition of Efficiency Targets
The RIIO framework is a combination of output incentives and cost efficiency incen-tives. For the cost efficiency incentives, a menu of contracts is used (Glachant et al., 2013).The mechanism is called Information Quality Incentives (IQI). This mechanism aims togive an incentive for companies to declare their real costs when submitting their businessplans, as they will be rewarded (or penalized) according to the real cost incurred at theend of the period. This also functions as a way of sharing efficiency gains with the finalconsumers.
Setting of the Capital Remuneration
RIIO bases its remuneration on a WACC calculated by Ofgem. According to Ofgem(2010),
“The allowed return has two main roles in the regulatory framework. First, itprovides a fair return to existing investors in network companies and second itis the value which facilitates investment in new infrastructure. Under the RIIOmodel, we will continue to set an allowed return on the basis of a single weightedaverage cost of capital (WACC).” (p. 108)
The cost of debt is indexed to the 10 years moving average of the pound sterlingNon-Financials A and BBB 10+ year’s indices published by iBoxx (Glachant et al., 2013),2.38% for 2016/17 (National Grid, 2016).
For the cost of equity, the CAPM is used (Ofgem, 2010). According to National Grid’sannual report, their cost of equity was defined in 7% and the gearing in 60%. For the othercompanies, the gearing ranges from 55 to 60% (CEER, 2016).
TABLE 5.2: National Grid’s cost of capital allowed under RIIO. Source:National Grid, 2016
Adjustments
Although the long regulatory period, the framework has a mid-period for adjust-ments. Also, two reopeners in May 2015 and May 2018 were possible for the TSO torequire additional revenues (Glachant et al., 2013).
Chapter 5. Economic Incentives for Investment in Meshed Offshore Grids 79
The TSO is also hedged against volume risk under the RIIO regulation (Glachantet al., 2013).
5.3.2 Germany
Transmission activity in Germany is performed by four different companies, namelyTenneT, 50Hertz, AMPRION, TransnetBW. The regulator responsible for setting the frame-work for the four companies is the BNetzA.
FIGURE 5.6: TSO geographic coverage in Germany. Source: Bayer (2014).
Incentive regulation was introduced in 2009. For transmission businesses, the regu-latory period is of five years, and currently, the second regulatory period is in place. Notmuch has changed from the first to the second regulatory period, except for the regula-tory parameters (Glachant et al., 2013).
Length of the Regulatory Period
The regulatory period in Germany is 5 years (CEER, 2016).
Scope of the Revenue Cap
A TOTEX approach is used to set the revenues cap, but not all the costs are included.The base level cost is composed by permanently non-controllable costs and generallycontrollable costs (Bundesnetzagentur, 2017). The efficiency level is applied to the gen-erally controllable costs to create what is called a block of efficient controllable cost. TheTSO should then reduced the remaining part, the inefficient block, over the course of theregulatory period.
Chapter 5. Economic Incentives for Investment in Meshed Offshore Grids 80
Definition of Efficiency Targets
The define the efficiency levels the German regulator uses a benchmarking tech-nique. Gas, distribution, and transmission are treated separately. For transmission, theprocedure considers not only the four TSOs operation in Germany but an internationalsample including TSOs from other Member States of the EU (Bundesnetzagentur, 2017).
Setting of the Capital Remuneration
Germany also uses a WACC methodology for the remuneration and the CAPMmodel to compute the RoE (Glachant et al., 2013). Currently the RoE before corporatetax is 9.05% and after tax is 7.39% (Bundesnetzagentur, 2017). Subtracting the inflation of1.56 % (CEER, 2016), the real post-tax RoE is 5.83%.
Adjustments
Volumes are also offset by the regulatory framework in Germany. At the end of thefifth year of the regulatory period, the difference is calculated and taken into considera-tion when calculating the revenue cap or the following period.
5.3.3 Denmark
Denmark has only one TSO, Energinet.dk. The Danish TSO is regulated by the Dan-ish Energy Regulatory Authority (DERA), an independent NRA.
Energinet.dk was created in 2009, following the unbundling need imposed by theThird Package (Lockwood, 2015). Nevertheless, the company is completely state-owned,and is not allowed to build equity or share profits with its owner, the Danish Ministry ofEnergy, Utilities and Climate (Danish Energy Regulatory Authority, 2015).
Therefore, Energinet.dk is under a strict cost-plus regulatory framework, designed torecover only the “necessary costs” in efficient operation and a “necessary cost of capital”(Danish Energy Regulatory Authority, 2015). The cost of capital, however, refers to theCoD only, as no RoE is included. Any surplus collected by the TSO has to be transferredback to the consumers, and similarly, any deficit will be offset by the tariff.
Length of the Regulatory Period
No regulatory period is applied in Denmark, as it is under a cost-plus regulation.Costs are scrutinized annually by DERA.
Chapter 5. Economic Incentives for Investment in Meshed Offshore Grids 81
Scope of the Revenue Cap
Also not applicable to cost-plus regulation. In fact, not even the concept of cost-plus is the most appropriate, as the “plus” is missing. The regulatory framework aims torecover only the cost incurred by the TSO.
Definition of Efficiency Targets
An annual scrutiny is carried by DERA to determine the allowed costs to be recov-ered. According to the Danish Energy Regulatory Authority (2015), Energinet.dk partic-ipated in two European benchmarks of TSOs, and that these benchmarks are importantfor “DERA’s economic regulation and assessment of Energinet.dk”.
It is important to note that, according to CEER (2016), “the regulation does not fa-cilitate the determination of general efficiency requirements for Energinet.dk. However,DERA may determine that a specific cost - or the amount thereof - does not constitute anecessary cost at efficient operation and therefore may not be included (or only partiallyincluded) in Energinet.dk’s tariffs”.
Setting of the Capital Remuneration
As mentioned before, Energinet.dk is not entitled to a RoE. Instead, only an interestrate to ensure the real value of the company’s capital base as of 1 January 2005 (CEER,2016).
Adjustments
According to Danish Energy Regulatory Authority (2015), differences in the real ef-ficient cost incurred and the revenues corrected by the tariff can be offset in the followingyear.
5.3.4 The Netherlands
The Dutch TSO TenneT was appointed as the independent operator at the beginningof the liberalization of the electricity sector in The Netherlands (Glachant et al., 2013).TenneT is regulated by the Authority for Consumers and Markets (ACM). They are cur-rently entering the 7th regulatory period, starting in 2017 and finishing in 2021.
The regulatory regime in The Netherlands can be summarized as a TOTEX revenuecap with the application of an RPI-X formula for the remuneration of transmission ser-vices (Glachant et al., 2013).
Chapter 5. Economic Incentives for Investment in Meshed Offshore Grids 82
Length of the Regulatory Period
The regulatory periods range from 3 to 5 years. The current regulatory period wasset to 5 years, instead of 3 of the previous period (2014-2016).
Scope of the Revenue Cap
The revenue cap is based on the TOTEX (OPEX, new and old investment in the RAB)(Glachant et al., 2013).
Definition of Efficiency Targets
The revenue cap and efficiency targets are calculated two year prior to the beginningof the new regulatory period. The regulator looks at the incurred costs by the regulatedcompany and uses it as a baseline for the upcoming period. The efficiency targets arethen defined (the X factor). For that purpose, two analysis are used. The first is a bench-mark to define an “efficient cost reference”, while the second is an expected productivityimprovement due to technological advancements (Glachant et al., 2013).
Setting of the Capital Remuneration
The remuneration is computed using the WACC formula, considering a gearing of50% (CEER, 2016). Different WACCs are used for new assets and for existing assets.The WACC for the new period will also decrease linearly until the end of the regulatoryperiod. The real pre-tax WACC for existing assets was set at 4.3% and will decrease to3.0% in 2021. For new assets, it will start at 3.6% and finish also at 3.0% (TenneT, 2017a).The RoE for The Netherlands we calculate at 3.54% 6
Adjustments
According to TenneT (2017a), adjustments mechanisms previously existent were ex-cluded for the new regulatory period:
“the ACM abolished the bonus malus system with capped risk for TenneT TSONL for the procurement costs for grid losses, reactive power and congestion man-agement for transport services. Instead, the ACM has incentivised limiting thesecosts by setting a fixed budget on the basis of historic costs and additionally ap-plying a frontier shift on these costs; this effectively exposes TenneT TSO NL tofull price and volume risk.” pg. 7
6RoE calculated based on the parameters presented by CEER (2016). The formula used was RoE =Rf + β ∗Mp, where Mp is the Market Premium, and is defined as Mp = Rm−Rf . The risk-free rate usedis real, and therefore this computation provides a real post-tax RoE, ensuring comparability with the otherscountries.
Chapter 5. Economic Incentives for Investment in Meshed Offshore Grids 83
5.3.5 Belgium
Regulated by the CREG (an acronym for Commission for Electricity and Gas Reg-ulation in Dutch and French), Elia System Operator is the only TSO in Belgium. Thecompany is partially owned by municipalities and partially owned by common share-holders as the company is listed on Euronext 7. The company also owns 60% of 50Hertz,one of the TSOs operating in Germany.
The regulatory framework applied can be defined as a revenue cap based on a “build-ing block” approach with incentive mechanisms for cost reduction.
Length of the Regulatory Period
The regulatory periods are set for four years. The current regulatory period startedin 2016 and finishes in 2019. It is the third regulatory period in Belgium (Elia, 2017b).
Scope of the Revenue Cap
The revenue cap is applied on “building blocks”, meaning that part of the expen-ditures are subject to incentive regulation, and part is passed through to the consumer.Costs are divided mainly into two categories, namely non-controllable elements and con-trollable elements. The former include depreciation of tangible fixed assets, ancillary ser-vices 8, costs related to line relocation imposed by a public authority, and taxes (Elia,2017b). These costs are not subject to efficiency targets. The controllable elements are thecosts over which Elia has control, and therefore are subject to efficiency measures.
The efficiency gains are shared with the consumers. If incurred costs are lower thanthe allowed budget, 50% of the gains are accounted as profit for Elia. On the contrary,any over spending is a loss for the company (Elia, 2017b).
Definition of Efficiency Targets
The efficiency target (X-factor) is determined based on benchmarking and dynamicproductivity targets (Glachant et al., 2013). The benchmark aims to set an “efficient andcomparable network” for comparison. The dynamic productivity targets (“frontier shift”)accounts for the increase in productivity due to technical advancements in the transmis-sion business.
7European stock exchange seated in Amsterdam, Brussels, London, Lisbon and Paris8except for the reservation costs of ancillary services excluding black start, which are called “Influenceable
costs”
Chapter 5. Economic Incentives for Investment in Meshed Offshore Grids 84
Setting of the Capital Remuneration
Elia receives a so-called “fair remuneration on capital invested”. This methodologyis basically a WACC with an implicit gearing of 67%. Therefore, 33% of the RAB is remu-nerated according to the RoE formula (see formula 4.2) and the remaining 67% receivethe risk-free rate (OLO, Belgium 10-year linear bonds) and an additional of 70 base points(Elia, 2017a).
According to the current parameters provided by CEER (2016), the RoE is 2.74% 9.The low RoE is because of the recent decreased in the OLO. However, other dedicatedincentives contribute to compensate this effect, as shown by Elia (2017b):
Despite the decrease in the yearly average OLO, from 0.86% in 2015 to 0.49% in2016, the regulated net profit increased by e8.5 million thanks to the full realisa-tion of the mark-up investments plan and high efficiencies, which the consumersare also benefiting from.
Adjustments
Both volume correction and a non-controllable costs settlement are applied ex-post.
5.3.6 Summary and Interpretation
Table 5.3 shows a summary of the characteristics of the default national regulatoryregimes in the five countries analyzed. In front of every characteristic, an arrow showsthe effect it has on remuneration or risk allocation. An arrow pointing up means higherrisk is being allocated to the TSO (the country’s flag will move up on the plot), and anarrow pointing down means a reduction in risk for the TSO. Similarly, an arrow pointingto the right means higher remuneration, and an arrow point left, lower remuneration.
Following the summary of characteristics, the plot is made comparing the level ofeconomic incentive provided by each default national regulatory framework. The po-sition of each country is illustrative, and although the axises of the graphic representscales, no inference on the actual amount can be made. It serves rather as a comparativeillustration of a qualitative analysis.
9Calculated based on (CEER, 2016), following the same procedure as for the calculation of the RoE in TheNetherlands.
Chapter 5. Economic Incentives for Investment in Meshed Offshore Grids 85
TABLE 5.3: Summary of Default National Framework’s Characteristics
Length of the
Regulatory Period↓ 4 years ↑ 5 years ↓ Yearly
↑ 8 years (with a
mid‐period
review)
↑ 5 years
Scope of Revenue Cap
↓ Building blocks
(non‐controllable
elements are pass
through)
↑ TOTEX
approach
↑ TOTEX
approach
↑ TOTEX
approach
Definition of Efficiency
Targets
↑ Benchmarking
↑ Dynamic
efficiency targets
↑ Benchmarking
↑ Outputs and
cost efficiency
goal
↓ Regulatory
assessment of
costs
↓ Menu of
contracts (IQI)
↑ Benchmarking
↑ Benchmarking
↑ Dynamic
efficiency targets
Capital Remuneration
← RoE 2,74%
(Post‐tax real,
G=67%)
→ RoE 5,83%
(Post‐tax real,
G=60%)
→ RoE 7,00%
(Post‐tax real,
G=60%)
← RoE 3,54%
(Post‐tax real,
G=50%)
← Decreasing
WACC
Ex‐post Adjustments
↓ Volume
correction
↓ Non
controllable costs
settlement
↓ Volume
Adjustment
↓ Mid‐period
review
↓ Volume
adjustment
↑ Reduced
hedging against
price and Volume
risk.
"Cost‐plus"
mechanism. TSO is
not allowed to
have profits.
FIGURE 5.7: Plot of stylized economic incentives from default national reg-ulatory frameworks.
+
1
·- ..... ---·- ..... ·-·-- .... -·-·-. ·;~-
Risk of under ./ investment ./
11
•' .·
.·
_.. .·
~ ·--·--
Incentives for cost reduction
--.. ..
.·
.· .· .·
Re m u neration
•' .. ··
+
.• .. ..
~·~ ~·~
.··
.·
,• .-··
.•
Risk of gold : platlng:
llle position of each re¡¡ulatory reglme ls lllus!To!ltlve
Chapter 5. Economic Incentives for Investment in Meshed Offshore Grids 86
5.4 Case Studies: Dedicated Incentives
As introduced earlier, another way of dealing with riskier investments for TSOs is bythe implementation of dedicated incentives. These incentives are supposed to go on topof the default national regulatory framework and they can behave in several ways. Theycan lead to a higher remuneration on the specific investment, or they can mitigate risksfor the project developer (thus transferring the risk to grid users). According to Meeusand Keyaerts (2014), the remuneration increase is mainly done in two ways, namely afixed premium for eligible project or through a case-by-case assessment and individualpremium. The risk mitigation is done by exemption from the default CAPEX efficiencybenchmarking, increasing the regulatory period, advance timing of development costrecognition or advance timing of construction cost recognition. Associated with the ded-icated incentive, usually, an ex-ante assessment of eligibility is also implemented in orderto control the cost efficiency of the investments that eventually will receive the dedicatedincentive.
The motivation behind the implementation of such mechanisms can vary. Firstly, wenote that European regulation already mandates the existence of dedicated incentives forPCIs, following the TEN-E Regulation, as presented earlier. However, some countries gobeyond that legal requirement, implementing mechanisms that are not limited to PCIsonly. Meeus and Keyaerts (2014) show that
“At first sight, the dedicated frameworks seem to be motivated by temporary ex-ceptional challenges. Countries refer to promoting competition, electricity mar-ket integration or prioritizing strategically important or socially desirable invest-ment at national level. They argue that to meet their challenges, it is necessary totemporarily speed up the needed “exceptional investments”.” (p. 2)
Considering the five countries included in our analysis, four of them have some formof dedicated incentive’s scheme. The exception is Denmark, as the regulatory model ap-plied to that country is in essence very different from the others. In this section, weanalyze the dedicated incentive schemes in the remaining four countries, with particu-lar attention for mechanisms that would be relevant in a meshed offshore grid context,namely the ones regarding offshore wind farm connections and the ones for interconnec-tions (including offshore interconnectors).
5.4.1 Great Britain
Dedicated incentives in Great Britain are not all concentrated in one package of mea-sures. Although there is a main program called Strategic Wider Works (SWW), otherpolicies and decisions also serve the purpose of dedicated incentives, as described below.
The regulator in Great Britain acknowledges the fact that a big volume of invest-ments will be needed within the current regulatory period, and that some projects may
Chapter 5. Economic Incentives for Investment in Meshed Offshore Grids 87
not have be included in when setting the parameters for the upcoming period (Ofgem,2013b). Therefore, the SWW scheme allows TSOs to bring projects forward once the aremature enough. Once the TSO presents the project for consideration under the SWW,Ofgem carries a project assessment to verify if the request is justified. If so, the projectcan be developed by the TSO, and outputs and allowed revenues are adjusted. However,another option is also being developed, as an onshore competition model is being pro-posed. The project will be also tendered and thus developed by competitively appointedtransmission owners (CATOs) (Allen & Overy, 2016). For that tender, case-by-case incen-tives and risk allocation measures will be set. The legislation on this model is still beingdeveloped (Ofgem, 2017a).
Another dedicated framework for specific assets is the Offshore Transmission Owner(OFTO) model. This framework deals specifically with offshore connections. Since 2009,connection farm-to-shore are built not by the TSO, but by the developer, that transfers theownership to a competitively appointed OFTO after completion (Ofgem, 2014b). Now,Ofgem wants to go one step further and promote the “OFTO build” model, in which theconstruction of the connection will also be a responsibility of the OFTO. Ofgem (2014b)explains the importance of the OFTO build framework:
“The extended OFTO build framework ensures OFTO build remains a viable andfit for purpose option with flexibility to respond to both the current and future re-quirements of offshore generators and to adapt to specific project characteristics.”(p. 6)
Lastly, a particular regime may also be applied to interconnections. This was the casefor the NEMO interconnector, a 1 GW subsea cable linking Belgium and the UK. For thisinfrastructure, a “cap and floor” regime was adopted, meaning that the project developeris allowed to receive revenues from the congestion of the interconnection, limited how-ever to a floor, ensuring a minimal revenue for the developer, and a cap, avoiding theoverpayment by users (Ofgem, 2014a).
To calculate the levels of the revenue cap and floor, Ofgem used a “building block”.First, an assessment of efficient costs for the project was carried, followed by a return oncapital assessment and an OPEX assessment (Ofgem, 2014a).
It is interesting to note how Ofgem (2014a) defines the purpose of the cap and floorregime:
"The cap and floor regulatory regime sets a framework for GB interconnector in-vestment. This developer-led approach balances incentivising investment througha market-based approach, with appropriate risks and rewards for the project de-velopers" (p. 5)
Chapter 5. Economic Incentives for Investment in Meshed Offshore Grids 88
5.4.2 Germany
Germany has dedicated incentives schemes for cross-regional, cross-border and off-shore investments (Meeus and Keyaerts, 2014). Thus, we focus on the offshore connec-tions.
Germany was a leader in the deployment of offshore generation, as a part of theirEnergiewende10. The rapid growth in installed capacity, however, represented a challengefor the construction of the connections. In Germany, the TSOs are responsible for theconnections, and are indeed obliged by law to provide the OWFs with the access to themain grid. Before 2012, the TSOs were rather "reactive", and associated with severalreasons, connections faced several delays (Schittekatte, 2016).
After 2013 the regime for offshore connections changed, leading TSOs to a more“proactive” posture. An Offshore Grid Development Plan (O-NEP) was made and up-dated yearly, and the completion date became binding for the TSOs. In 2017 anotherchange in the framework came into place (TenneT, 2017a), as the Offshore Wind Act(Windenergie-auf-See-Gesetz) came into effect. The support scheme changed from thefixed feed-in premiums to auctions.
Although the connections are mandated by law for TSOs, some additional incentivesare given in the form of risk mitigation. The offshore connections are usually approvedby BNetzA under the so-called investment measures. Under this category, offshore con-nections are qualified as permanently non-influenceable costs to which no efficiency tar-gets apply. Also, costs are directly included in the revenue cap based on planned costs(TenneT, 2017a).
5.4.3 The Netherlands
In The Netherlands, the TSO is also responsible for the connection farm-to-shore,and as in Germany, special risk mitigation measures apply.
On September 2016, the Dutch regulator ACM published, along with the other infor-mation on the new regulatory period, the rules for offshore grid investment from 2017-2021 (TenneT, 2017a). Offshore grid investments are remunerated while under construc-tion and no benchmark/theta or frontier shift will apply in this first regulatory period.The maximum depreciation period for offshore grid assets is 20 years. The WACC thoughis the same as for onshore investments. And TenneT (2017a) notes that “in future regu-latory periods, the efficiency of offshore investments may be assessed using an interna-tional TSO benchmark”.
10Energy transition, in German. Represents the process of moving towards a low-carbon, environmentallysound, energy supply, and it is marked by the increase of RES penetration and the phase-out of nuclearpower plants.
Chapter 5. Economic Incentives for Investment in Meshed Offshore Grids 89
5.4.4 Belgium
Belgium offers dedicated incentives for ‘strategic investment projects’, that consistsmainly on an additional remuneration over the project (Elia, 2017b). Strategic invest-ments are mainly aimed at improving EU integration and may be entitled to receive anadditional markup. According to Elia (2017b), “this additional remuneration is calcu-lated as a percentage of the cumulative actual amount dispensed (investment amountsare capped per year and per project).” The additional incentive, however, is linked tothe OLO rate (free-risk rate). The markup is applied at full rate if the OLO rate is equalor below 0.5%. If the OLO is higher, the markup is reduced proportionally, capped at2.16%. The application of the additional remuneration is also conditioned to on timecommissioning of the investment, subject to penalties otherwise.
5.4.5 Summary and Interpretation
Table 5.4 shows a summary of the dedicated incentives with a focus on offshore in-vestment. For both Germany and the Netherlands, the schemes are focused on reducingthe risk for TSOs, while for Belgium and Great Britain, additional remuneration is pro-vided. The latter can also offer risk mitigation measures.
TABLE 5.4: Summary of Dedicated Incentives Schemes
Increased Remuneration X X
Risk Mitigation Measures
Exemption from capex efficiency benchmarking X X
Advance timing of cost recognition X X X
Reduced depreciation period X
The Figure 5.8 below combines the economic incentives plot of default national reg-ulatory regimes with the effect that dedicated incentives for offshore investment. Thefigure shows that dedicated incentives for Belgium, The Netherlands and Germany pro-vide a push towards the central diagonal line of the graphic, a position where economicincentives would be balanced.
Chapter 5. Economic Incentives for Investment in Meshed Offshore Grids 90
FIGURE 5.8: Plot of stylized economic incentives including the effect ofdedicated incentives.
5.5 Interim Conclusions
The investment in a meshed offshore grid is expected to bring more risk for theTSO than other types of investment in transmission assets (e.g. expansion of the onshoremain grid, connection of users and interconnectors). Therefore, appropriate economicincentives will be a major driver for the development of such infrastructures.
Traditionally, transmission businesses have been remunerated on a portfolio basis.The TSO invests, the investment is included in the RAB, and a WACC is applied to RABas a whole. Similarly, risk allocation has been set considering the business as a whole, andnot taking into consideration the specificity of individual projects. This model is still thecore of transmission regulation of many countries in Europe, including the five analyzedin this chapter. However, the recent increase of pan-European investments, many of themriskier than the traditional national transmission investments, has raised concerns aboutthe suitability of the default economic incentives for riskier and strategic investments.An evidence for this analysis is the provision in the TEN-E Regulation stating that na-tional regulatory regimes should provide additional incentives for PCIs if needed. Also,the dedicated incentive schemes analyzed in this chapter were implemented in recentyears. In Great Britain, the OFTO model dates from 2009, and the OFTO build modelis being implemented. In Germany, dedicated incentives for offshore connections wereimplemented in 2012. In Belgium and The Netherlands, the characteristics of the dedi-cated incentives mentioned started in early 2017. Therefore, in recent years, a new type of
Chapter 5. Economic Incentives for Investment in Meshed Offshore Grids 91
case-by-case regulation started being implemented and now coexists with the traditionalportfolio regulation.
The need for investments in riskier assets can be met both through the portfolioregulation and through case-by-case regulation, although both have drawbacks. On theone hand, Glachant et al. (2013) observes that a harmonization of default frameworksonto a target area of slightly higher remuneration than risks (an “investment friendlyparadigm”, as called by the authors) would unlock the necessary pan-European invest-ments needed in the coming years. This solution proposes an adaptation of frameworksin a portfolio regulation fashion. Although possible and effective, the solution can alsohave disadvantages. Firstly, the regulator risks setting incentives that will overpay all theother regular investments in order to incentivize the riskier assets. Secondly, perverse in-centives can be created, as TSOs will first invest in less risky investment, neglecting theriskier infrastructure, the very motive for which higher incentives were set.
On the other hand, case-by-case regulation can be applied to specific groups of as-sets. However, this type of regulation also has its downsides. Case-by-case regulationcan increase significantly the complexity of the regulatory process. Moreover, it can in-crease asymmetry of information, specially in cases in which uncertainty surrounds theinvestment. The transparency of the revenue setting can also become questionable, asthe allowed revenue becomes the sum of various individual analysis made in differentperiods of time.
Faced with such dichotomy, the observation of the past few years shows that reg-ulators have opted for the case-by-case regulation as means to incentivize necessary in-vestments. Default regulatory frameworks have not converged towards a investmentfriendly paradigm. The adopted case-by-case regulation, however, has not substituteportfolio regulation nor it seems it will. Countries appear to search for the right balancebetween the two forms.
In this context, dedicated incentives for investments in a meshed offshore solutioncan be an appropriate tool for incentivizing the development of this infrastructure. Theanalysis of the current economic incentives show that most countries are still on the“short term cost reduction” zone, and therefore adjustments in incentives may be neededin a meshed offshore context. These dedicated incentives for meshed offshore assets cantake into consideration the specificities of meshed offshore grids, including the risk pro-file of such investments and the appropriate remuneration. For that matter, future re-search is needed to assess these parameters quantitatively.
92
Chapter 6
Conclusions
In this work, two regulatory aspects regarding the development of a meshed offshoregrid in the North Seas were analyzed. Firstly, transmission charges were investigatedfrom an offshore grid perspective. This thesis found that neither academia or regulatorsagree upon one single transmission allocation method. A mapping of the practice in tencountries surrounding the North Seas shows unharmonized procedures being applied.This can impact the investment and operation decisions of OWFs developers, and there-fore impact the outcomes of a meshed offshore grid. The harmonization of transmissioncost allocation practice would certainly be beneficial for the development of the inte-grated offshore grid. Another explored question was how OWFs will pay G-charges in ameshed offshore grid, considering that these power plants are connected in between sys-tems, on waters subject to international law. Five options were developed and analyzedagainst five criteria, considering that G-charges should comply with legal, economic, reg-ulatory and technical principles. We conclude that, on an unharmonized environment oftransmission charging, none of the five options scores high for every criterion. Instead,a trade-off is found among them. Paying G-charges in the country where the OWF islegally connected seems to be the less distortive option, although not perfect. A regionaloffshore tariff can also be considered, but it would depend firstly on the governance be-hind such arrangement and secondly on the methodology employed.
The second part of this thesis is devoted to the study of economic incentives for TSOsin the North Seas with a focus on offshore investments. For this study, the definition ofthe research boundaries and concepts used was crucial. Understanding the differencebetween the investment in offshore grids and other types of transmission assets was alsoimportant. It allowed specific risks in meshed offshore grids to be identified and to con-clude that meshed offshore grids are expected to be riskier that other types of investmentsin transmission grids.
To assess if countries provide economic incentives for riskier investments, a twofoldstudy was conducted to five countries of the North Seas, namely Belgium, Denmark,Germany, Great Britain, and The Netherlands. Firstly, the methodology developed byGlachant et al. (2013) was used to assess how default national regulatory regimes providetheir TSOs with the economic incentives for investments. One first important conclusion
Chapter 6. Conclusions 93
is that not all TSOs are driven by economic incentives. That is the case of Denmark,where a nonprofit state-owned TSO model is in place. For the TSOs that are economi-cally driven, we conclude that default frameworks still have ‘short-term cost reduction’configuration, with limited incentives for investments in riskier investments.
Secondly, we analyze the frameworks of dedicated incentives for specific types ofassets, with special attention to offshore investments. We follow the work done by Meeusand Keyaerts (2014) in identifying how countries use dedicated incentives to providea fine-tuning of risks and rewards for particular investments. We observe that for thefive countries analyzed, designs vary. Belgium and Great Britain focus on additionalremuneration, while Germany and The Netherlands offer risk mitigation measures.
We then combine the two analysis in a novel way, showing the effect of dedicated in-centives for offshore investment over the default national regulatory regimes. We observea logic for the options in the dedicated incentives’ design, as countries try to compensaterisk or remuneration, according to the characteristics of their default frameworks. Thisanalysis also calls for a future quantitative work, as no conclusion on the size of the effectcan be made from this qualitative study.
94
Bibliography
ABB Communications (2009). No Title. URL: http://www.abb.com/cawp/seitp202/1cd713ef8cad0387c12575ee002d1358.aspx.
ACER (2013). Opinion 05-2013.— (2014). RECOMMENDATION OF THE AGENCY FOR THE COOPERATION OF EN-
ERGY REGULATORS No 03/2014. Tech. rep.— (2015a). “Opinion of Regulators No. 09/2014 the Agency for the Cooperation of En-
ergy”. In:— (2015b). Scoping Towards Potential Harmonisation of Electricity Transmission Tariff Struc-
tures. Tech. rep. Prepared by Cambridge Economic Policy Associates Ltd.— (2016). “Consolidated report on the progess of electricity and gas projects of common
interest for the year 2015”. In:— (2017). “Overview of cross-border cost allocation decisions Status update as of Jan-
uary 2017”. In:Allen & Overy (2016). “Competitive Tenders for Onshore Transmission”. In: January.Batlle, C., I. J. Pérez-Arriaga, and P. Zambrano-Barragán (2012). “Regulatory design for
RES-E support mechanisms: Learning curves, market structure, and burden-sharing”.In: Energy Policy 41, pp. 212–220. ISSN: 03014215. DOI: 10.1016/j.enpol.2011.10.039.
Bayer, E (Agora Energiewende) (2014). “Report on the German power system”. In: Octo-ber, p. 103.
BMWi (2017). Bundesnetzagentur announces successful bids in first auction for offshore windfarms.
Bundesnetzagentur (2017). The main tools of incentive regulation in Germany. URL: https://www.bundesnetzagentur.de/EN/Areas/Energy/Companies/GeneralInformationOnEnergyRegulation/
IncentiveRegulation/Tools/IncentReg_Tools-node.html.CEER (2016). “CEER Report on Investment Conditions in European Countries”. In: C15-
IRB-28-03, p. 180.Cole, Stijn et al. (2015). “Cost-benefit analysis of a coordinated grid development in the
Danish Energy Regulatory Authority (2015). 2015 National Report Denmark. Tech. rep.Decker, Christopher (2014). Modern Economic Regulation: An Introduction to Theory and
Del Río, Pablo et al. (2015). “Overview of Design Elements for RES-E Auctions. ReportD2.2 (a)”. In: 2.October.
Egerer, Jonas, Friedrich Kunz, and Christian von Hirschhausen (2013). “Developmentscenarios for the North and Baltic Seas Grid - A welfare economic analysis”. In: Util-ities Policy 27, pp. 123–134. ISSN: 09571787. DOI: 10.1016/j.jup.2013.10.002.URL: http://dx.doi.org/10.1016/j.jup.2013.10.002.
Eirgrid (2015). “Statement of Charges 2015/2016”. In: October 2015.Elia (2017a). Electrical Losses on the Federal Transmission System. URL: http://www.elia.
be/en/grid-data/electrical-losses-fed-transm-system.— (2017b). “Making the energy transition happen - Annual Report 2016”. In:— (2017c). North Sea. URL: http://www.elia.be/en/projects/grid-projects/
North_Sea.Energinet.dk (2016). Current tariffs. URL: http : // www . energinet. dk / EN /El /
gebyrer.aspx.ENTSO-E (2014). “Fostering Electricity transmission investments to achieve Europe’s en-
ergy goals : Towards a future-looking regulation ENTSO-E”. In:Entso-E (2016). “ENTSO-E Overview of transmission tariffs in Europe : Synthesis 2016”.
In: Network June, pp. 1–24.ENTSO-E (2017). “Guideline for Cost Benefit Analysis of Grid Development Projects Ver-
sion for ACER official opinion”. In: July 2016.European Commission (2014a). “Study of the Benefits of a Meshed Offshore Grid in
Northern Seas Region”. In: European Commission. URL: https://ec.europa.eu/energy/sites/ener/files/documents/2014_nsog_report.pdf.
— (2014b). Study on regulatory incentives for investments in electricity and gas infrastructureprojects. ISBN: 9789279436826. DOI: 10.2833/28189.
— (2015). Wind energy is crucial for the EU’s renewable energy targets. URL: https://ec.europa.eu/energy/en/news/wind-energy-crucial-eus-renewable-
energy-targets.— (2016). Study on regulatory matters concerning the development of the North Sea offshore
energy potential. delivered by PwC, Tractebel Engineering and ECOFYS, p. 300. ISBN:9789279572463. DOI: 10.2833/987989. URL: http://bookshop.europa.eu/en/study-on-regulatory-matters-concerning-the-development-of-
the-north-sea-offshore-energy-potential-pbMJ0416250/.European Parliament (2011). EU Energy Strategy in the South Mediterranean. Tech. rep.EWEA (2014). “EWEA position paper on priority dispatch of wind power”. In: The Euro-
pean Wind Energy Association, pp. 1–27. URL: http://www.ewea.org/fileadmin/files/library/publications/position-papers/EWEA_position_on_
priority_dispatch.pdf.Fitch-Roy, Oscar (2015). “An offshore wind union? Diversity and convergence in Euro-
Glachant, Jean-Michel et al. (2013). Incentives for investments: Comparing EU electricity TSOregulatory regimes. December, pp. 1–110. ISBN: 9789290841586. DOI: 10.2870/80768.
Gorenstein Dedecca, João and Rudi A. Hakvoort (2016). “A review of the North Seasoffshore grid modeling: Current and future research”. In: Renewable and SustainableEnergy Reviews 60, pp. 129–143. ISSN: 18790690. DOI: 10.1016/j.rser.2016.01.112. URL: http://dx.doi.org/10.1016/j.rser.2016.01.112.
Gorenstein Dedecca, João, Rudi A. Hakvoort, and Paulien M. Herder (2017). “Transmis-sion expansion simulation for the European Northern Seas offshore grid”. In: 125.Ta-ble 1, pp. 805–824. ISSN: 03605442. DOI: 10.1016/j.energy.2017.02.111.
Green, Richard and Nicholas Vasilakos (2011). “The economics of offshore wind”. In:Energy Policy 39.2, pp. 496–502. ISSN: 03014215. DOI: 10.1016/j.enpol.2010.10.011. URL: http://dx.doi.org/10.1016/j.enpol.2010.10.011.
Hadush, Samson Y., Cedric De Jonghe, and Ronnie Belmans (2015). “The Effect of WelfareDistribution and Cost Allocation on Offshore Grid Design”. In: IEEE Transactions onSustainable Energy 6.3, pp. 1050–1058. ISSN: 19493029. DOI: 10.1109/TSTE.2014.2325911.
Henriot, Arthur (2013). “Financing investment in the European electricity transmissionnetwork: Consequences on long-term sustainability of the TSOs financial structure”.In: Energy Policy 62, pp. 821–829. ISSN: 03014215. DOI: 10.1016/j.enpol.2013.07.011.
Hertem, Van Dirk, Oriol Gomis-Bellmunt, and Jun Liang (2016). HVDC Grids: For Offshoreand Supergrid of the Future. IEEE Press. ISBN: 9781118859155.
Hirschhausen, Christian Von, Sophia Ruester, and Jean-michel Glachant (2012). EU In-volvement in Electricity and Natural Gas Transmission Grid Tarification, pp. 1–100. ISBN:9789290840763. DOI: 10.2870/35676.
Hirtenstein, Anna. Sweden denies permit for $7.4B offshore wind farm because the projectwould interfere with its military | Wind Energy News. URL: https://www.wind-watch.org/news/2016/12/30/sweden- denies- permit- for- 7- 4b-
its-military/.ISLES Project (2012a). “Cross Jurisdictional Report on Regulation”. In: April, p. 58. URL:
http://www.scotland.gov.uk/Resource/0039/00395577.pdf.— (2012b). “Economic and Business Case Report”. In: April, p. 58. URL: http://www.
scotland.gov.uk/Resource/0039/00395577.pdf.— (2015). “Network Regulation and Market Alignment Study”. In: June.Jacobsson, Staffan, Kersti Karltorp, and Frederik Dolff (2013). “Towards a Strategy for
Offshore Wind”. In: 2011, pp. 160–171.Jong, Remenco de (2008). “The challenges of a Belgian offshore wind park: Water is the
driver, not wind”. In: August.Junqueira, Max et al. (2007). “An Aumann-Shapley approach to allocate transmission
service cost among network users in electricity markets”. In: IEEE Transactions on
Power Systems 22.4, pp. 1532–1546. ISSN: 08858950. DOI: 10.1109/TPWRS.2007.907133.
Keyaerts, Nico and Leonardo Meeus (2015). “The experience of Italy and the US with ex-ceptional regulatory incentives for exceptional electricity transmission investments”.In:
Keyaerts, Nico, Tim Schittekatte, and Leonardo Meeus (2016). “Standing still is movingbackward for the ABC of the CBA”. In: FSR policy brief. DOI: 10.2870/57918.
Konstantelos, Ioannis, Rodrigo Moreno, and Goran Strbac (2017). “Coordination and un-certainty in strategic network investment: Case on the North Seas Grid”. In: EnergyEconomics 64, pp. 131–148. ISSN: 01409883. DOI: 10.1016/j.eneco.2017.03.022.URL: http://linkinghub.elsevier.com/retrieve/pii/S0140988317300889.
Laffont, Jean-Jacques and David Martimort (2002). The Theory of Incentives. Princeton Uni-versity Press. ISBN: 0691091838.
Lévêque, François (Editor) (2003). Transport Pricing of Electricity Networks. ISBN: 9781441953551.Lockwood, Matthew (2015). “The Danish system of electricity policy-making and regu-
lation”. In: May.Loyens Loeff (2014). “North Sea offshore wind Developments in Belgium and the Nether-
lands”. In: November.Marin, J. et al. (1995). “Marginal pricing of transmission services: An analysis of cost
recovery”. In: IEEE Transactions on Power Systems 10.1, pp. 546–553. ISSN: 15580679.DOI: 10.1109/59.373981.
Meeus, Leonardo and et al. (2013). THINK Report Topic 10 - Cost Benefit Analysis in the Con-text of the Energy Infrastructure Package, p. 55. ISBN: 9789290841166. DOI: 10.2870/60065. URL: http://www.eui.eu/Projects/THINK/Research/Topic10.aspx.
Meeus, Leonardo and Nico Keyaerts (2014). “The role of the EU and ACER to ensure anadequate regulatory framework for projects of common interest”. In:
Meeus, Leonardo et al. (2012). “THINK: Topic 5: Offshore Grids: Towards a Least RegretEU Policy: Final Report”. In: pp. 1–7. DOI: 10.2870/35516. URL: http://think.eui.eu.
Müller, Hannah Katharina (2015). “Developing a legal framework for a transnational off-shore grid in the North Sea PhD thesis”. In: December, pp. 5–6.
National Grid (2016). “Annual Report 2016/2017”. In:Niharika, Sumit Verma, and Vivekananda Mukherjee (2016). “Transmission expansion
planning: A review”. In:Nixon, Hannah, Regulatory Review, and Regulatory Finance (2009). “Regulating Energy
Networks for the Future : RPI-X @ 20 History of Energy Network”. In: Energy NetworkFebruary.
NorthSeaGrid (2015). “WP5 Final Report Alternative cross - border cost allocation meth-ods for sharing benefits and costs of integrated offshore grid infrastructures”. In:March.
pdf.— (2013b). “Strategic Wider Works (SWW) - Factsheet”. In: November.— (2014a). “Decision on the cap and floor regime for the GB-Belgium interconnector
project Nemo”. In: December.— (2014b). “OFTO Build : Providing additional flexibility through an extended frame-
work Updated policy proposals”. In:— (2015). “2015 Great Britain and Northern Ireland National Reports to the European
EN.pdf.— (2017a). Competition in onshore transmission. URL: https://www.ofgem.gov.uk/
electricity/transmission-networks/competition-onshore-transmission.— (2017b). Ofgem reduces National Grid’s spending allowances for its transmission price con-
European union”. In: IEEE Transactions on Power Systems 22.4, pp. 1507–1522. ISSN:08858950. DOI: 10.1109/TPWRS.2007.907118.
Orfanos, G. A. et al. (2011). “Evaluation of transmission pricing methodologies for poolbased electricity markets”. In: 2011 IEEE PES Trondheim PowerTech: The Power of Tech-nology for a Sustainable Society, POWERTECH 2011 218903, pp. 1–8. DOI: 10.1109/PTC.2011.6019255.
Pérez-Arriaga, Ignacio J (Editor) (2013). “Regulation of the Power Sector”. In:Poudineh, Rahmatallah and Alessandro Rubino (2017). “Business model for cross-border
interconnections in the Mediterranean basin”. In: Energy Policy 107.June, pp. 96–108.ISSN: 03014215. DOI: 10.1016/j.enpol.2017.04.027.
PROMOTioN (2016). “Deliverable 1 . 1 : Detailed description of the requirements that canbe expected per work package”. In: 691714.
PROMOTioN Project (2016). “Deliverable 1.3 : Synthesis of available studies on offshoremeshed HVDC grids”. In: 691714. URL: https://www.promotion-offshore.net/fileadmin/PDFs/D1.3_PROMOTioN_Deliverable_1.3_Synthesis_
of_available_studies.pdf.Radowitz, Bernd (2016). Sweden denies permit for up to 2.5GW offshore array on military
grounds.Rubio-Odériz, Fcolavier (2000). “Marginal pricing of transmission services: a compar-
ative analysis of network cost allocation methods”. In: IEEE Transactions on PowerSystems 15.1, pp. 448–454. ISSN: 08858950. DOI: 10.1109/59.852158.
Schittekatte, Tim (2016). A Network on the Sea: Benefits and Obstacles in Europe. URL: https://medium.com/florence- school- of- regulation/six- countries-
defining-offshore-wind-dc4af2c515ae.Schröder, Sascha T. (2013). Wind energy in offshore grids. January. ISBN: 9788792706027.SONI (2017). Transmission Use of System Charges. URL: http://www.soni.ltd.uk/
Customers/TUOSTariffsandBilling/.TenneT (2017a). “Fixed-to-Reset Rate NC7.1 Perpetual Capital Securities Prospectus”. In:
Wilks, Mike and Simon Bradbury (2010). “Electricity transmission use of system charg-ing: theory and international experience”. In: Energy November, pp. 1–68.
Williamson, Oliver E. (1988). “The Logic of Economic Organization”. In: 4.1, pp. 65–93.Wind Europe (2017). “The European offshore wind industry - Key trends and statistics
2016”. In: Key trends and statistics 2016 January, p. 33.Woolley, Olivia (2013). “Governing a North Sea grid development: The need for a regional
framework treaty”. In: Competition and Regulation in Network Industries 14.1, pp. 73–97. ISSN: 17835917.