Ikmal Lukman Director for Sectors Investment Promotion BKPM
The Investment Coordinating Board of the Republic of Indonesia
2
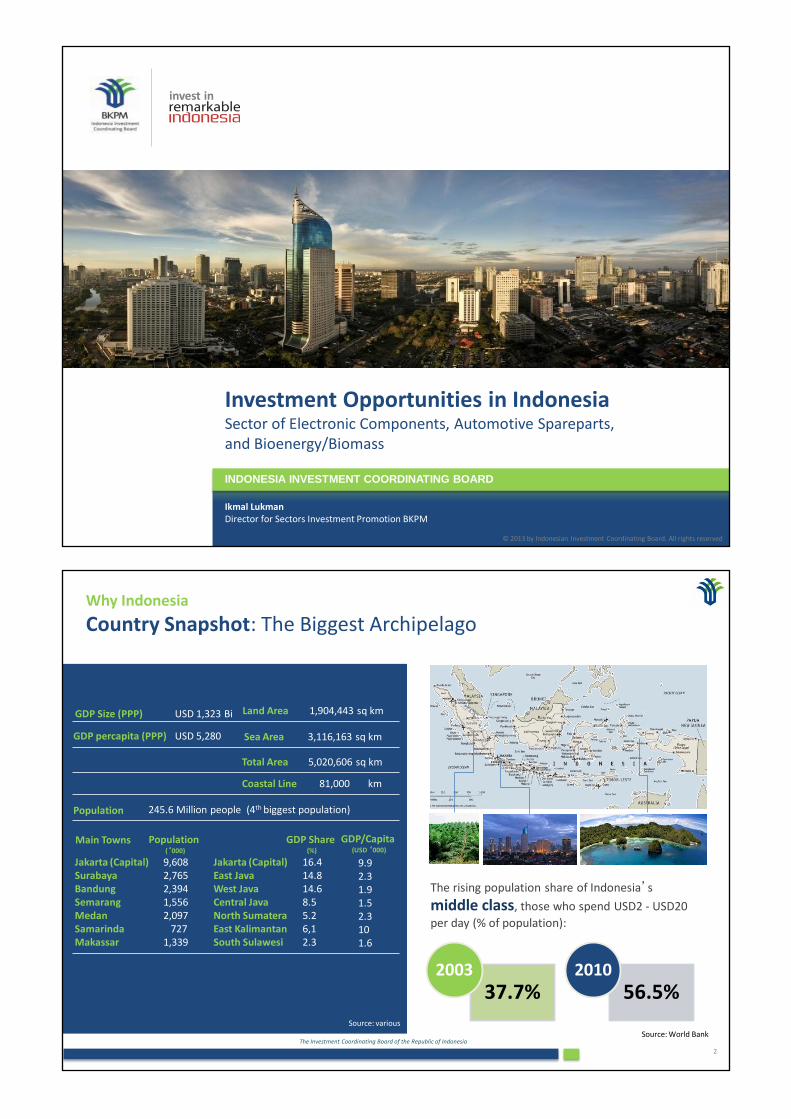
Land Area 1,904,443 sq km
Sea Area 3,116,163 sq km
Total Area 5,020,606 sq km
Coastal Line 81,000 km
Population 245.6 Million people (4th biggest population)
Main Towns
Jakarta (Capital) Surabaya Bandung Semarang Medan Samarinda Makassar
9,608 2,765 2,394 1,556 2,097 727 1,339
Population (‘000)
Jakarta (Capital) East Java West Java Central Java North Sumatera East Kalimantan South Sulawesi
16.4 14.8 14.6 8.5 5.2 6,1 2.3
GDP Share (%)
The rising population share of Indonesia’s
middle class, those who spend USD2 - USD20
per day (% of population):
37.7% 2003
56.5% 2010
GDP Size (PPP) USD 1,323 Bi
GDP percapita (PPP) USD 5,280
Source: World Bank
Source: various
GDP/Capita (USD ‘000)
9.9 2.3 1.9 1.5 2.3 10 1.6
Why Indonesia
Country Snapshot: The Biggest Archipelago
The Investment Coordinating Board of the Republic of Indonesia
3
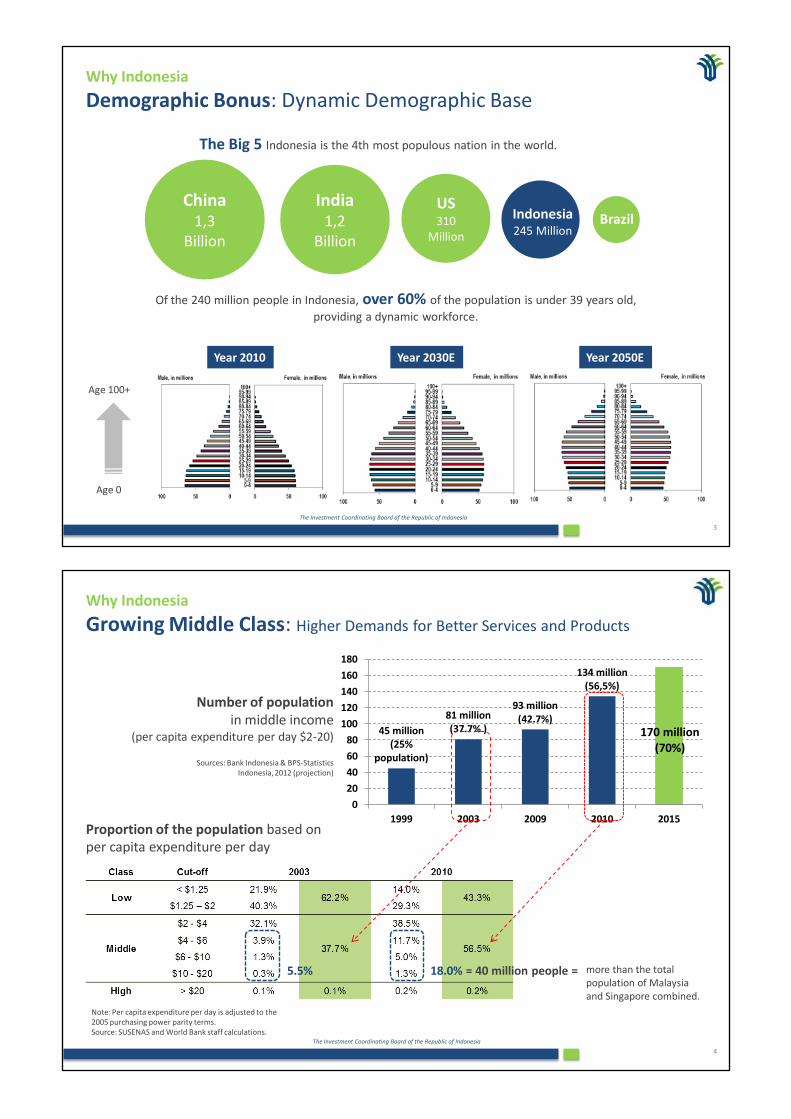
China 1,3
Billion
India 1,2
Billion
US 310
Million
Indonesia 245 Million
The Big 5 Indonesia is the 4th most populous nation in the world.
Brazil
Of the 240 million people in Indonesia, over 60% of the population is under 39 years old,
providing a dynamic workforce.
Age 100+
Age 0
Year 2010 Year 2030E Year 2050E
Why Indonesia
Demographic Bonus: Dynamic Demographic Base
The Investment Coordinating Board of the Republic of Indonesia
4
45 million (25%
population)
81 million (37.7% )
93 million (42.7%)
134 million (56,5%)
170 million (70%)
0
20
40
60
80
100
120
140
160
180
1999 2003 2009 2010 2015
Sources: Bank Indonesia & BPS-Statistics Indonesia, 2012 (projection)
Number of population in middle income
(per capita expenditure per day $2-20)
Note: Per capita expenditure per day is adjusted to the 2005 purchasing power parity terms. Source: SUSENAS and World Bank staff calculations.
Proportion of the population based on per capita expenditure per day
5.5% 18.0% = 40 million people =
Why Indonesia
Growing Middle Class: Higher Demands for Better Services and Products
more than the total population of Malaysia and Singapore combined.
The Investment Coordinating Board of the Republic of Indonesia
5
Why Indonesia
The Second Fastest Economic Growths among G20 Countries in 2012
Nominal GDP Growth Projection
0.0 2.0 4.0 6.0 8.0 10.0
Brazil
Korea
Mexico
Turkey
Russia
Argentina
Saudi Arabia
Indonesia
India
China
2017
2013
2012
The IMF projects Indonesia will be at
the top 3 fastest economic growths among G20 countries.
International Monetary Fund; World Economic Outlook Database, April 2012.
China 7.8 %
India 5.5 %
Indonesia 6.2 %
Indonesia’s 2012 growth hits 6.2% The Financial Times, 5 February 2013
The Investment Coordinating Board of the Republic of Indonesia
6
McKinsey Global Institute:
The Archipelago Economy:
Unleashing Indonesia's
Economic Potential
September 2012
Why Indonesia
Indonesia Today…
The Investment Coordinating Board of the Republic of Indonesia
7
McKinsey Global Institute
September 2012
Why Indonesia
Indonesia Today… and Indonesia in 2030
The Investment Coordinating Board of the Republic of Indonesia
8
Why Indonesia
Abundant Opportunity
• The burgeoning consuming class will give rise to new markets, including transportation, housing and utilities. The new wave of consuming class in Indonesia is huge opportunity.
• With an additional 90 million consumers expected in Indonesia, consumer spend in urban areas could increase at 7.7% a year to become a USD 1.1 trillion business opportunity by 2030.
Consumer Spend in 2011 and 2030
The Investment Coordinating Board of the Republic of Indonesia
9
(in IDR Trillion) 2010 2011 2012 2013 2014 Total
FDI 147.9 172.8 204.1 272.6 329.0 1,126.4
DDI 60.6 67.2 79.4 117.7 177.9 502.8
Total Target 208.5 240.0 283.5 390.3 506.9 1,629.2
(USD 181.0 Billion)
Assumption: USD 1 = IDR 9.000
Total Investment realization to achieved in 2010-2014: USD 181.0 billion
Achievement 208.5 251.3 313.2 N/A N/A 773.0
(USD 85.9 Billion)
Investment Performance
Overall Investment Target: BKPM Strategic Plan 2010-2014
Source: BKPM
0
200
400
600
2010 2011 2012 2013 2014
FDI DDI
Investment Realization Target (in IDR Trillion)
The Investment Coordinating Board of the Republic of Indonesia
10
Singapore: USD 4.9 Bn
(19.8%)
Japan: USD 2.5 Bn
(10%)
South Korea: USD 1.9Bn
(7.9%)
United States: USD 1.2 Bn
(5.1%)
Mauritius: USD 1.1 Bn
(4.3%)
Others: USD 13 Bn
52.9%
The cumulative of investment realization from January to
December 2012 is IDR 313.2 trillion (USD 34.8 billion) or 110.5% from target in 2012 (IDR 283.5 trillion).
Compared to same period in 2011 (IDR 251.3 trillion), it
increased about 24.6%.
Source: BKPM
Investment Realization by Origin Country 2012
2.3 3.9 2.3 4.2 6.8 8.4 10.2 6
10.3 14.9 10.8
16.6 19.5
24.6
2006 2007 2008 2009 2010 2011 2012
DDI FDI
8.3
14.2 17.1
15.0
23.4
27.9
34.8
Investment Performance
Overall Investment Realization
Source: BKPM
(USD Billion)
The Investment Coordinating Board of the Republic of Indonesia
11
Food Industry Rp.11,2 T (12,1%)
Non Metallic Mineral Industry
Rp.10,7 T (11,6%)
Mining Rp.10,5 T (11,5%)
Food Crops and Plantation
Rp.9,6 T (10,4%)
Transportation, Storage and
Telecommuni-cation
Rp.8,6 T (9,3%)
Others Rp.41,6 T (45,1%)
Mining USD.4,3 B
(17,3%)
Transportation, Storage and
Telecommunication USD.2,8 B
(11,4%)
Chemical and Pharmaceutical
Industry USD.2,8 B
Metal, Machinery and Electronic
Industry USD.2,5 B
(10,0%)
Motor Vehicles & Other Transport
Equipment Industry USD.1,8 B
(7,5%)
Others USD.10,4 B
(42,5%)
Investment Performance
Overall Investment Realization : Jan-Dec 2012, Based on Sector
Foreign Direct Investment Domestic Direct Investment
Source: BKPM
The Investment Coordinating Board of the Republic of Indonesia
12
West Java USD.4,2 B
(17,1%)
Jakarta USD.4,1 B
(16,7%)
Banten USD.2,7 B (11,1%)
East Java USD.2,3 B
(9,4%)
East Kalimantan USD.2,0 B
(8,2%)
Others USD.9,2 B
(37,5%)
East Java Rp.21,5 T (23,3%)
West Java Rp.11,4 T (12,3%)
Jakarta Rp.8,5 T (9,3%)
East Kalimantan Rp.5,9 T (6,4%)
Central Java Rp.5,8 T (6,3%)
Others Rp.39,1 T (42,4%)
Foreign Direct Investment Domestic Direct Investment
Investment Performance
Overall Investment Realization : Jan-Dec 2012, Based on Location
Source: BKPM
The Investment Coordinating Board of the Republic of Indonesia
13
Java 59%
Outside Java 41%
Java 56%
Outside Java 44%
A series of improvement of investment climate in both central and local
government’s services have been responded positively by domestic and foreign
investors, and increased the investment distribution outside Java Island.
Source: BKPM
Investment Performance
Investment Challenge: More Equal Investment Distribution
Total Investment 2012 Total Investment 2011
Java
I N D O N E S I A
The Investment Coordinating Board of the Republic of Indonesia
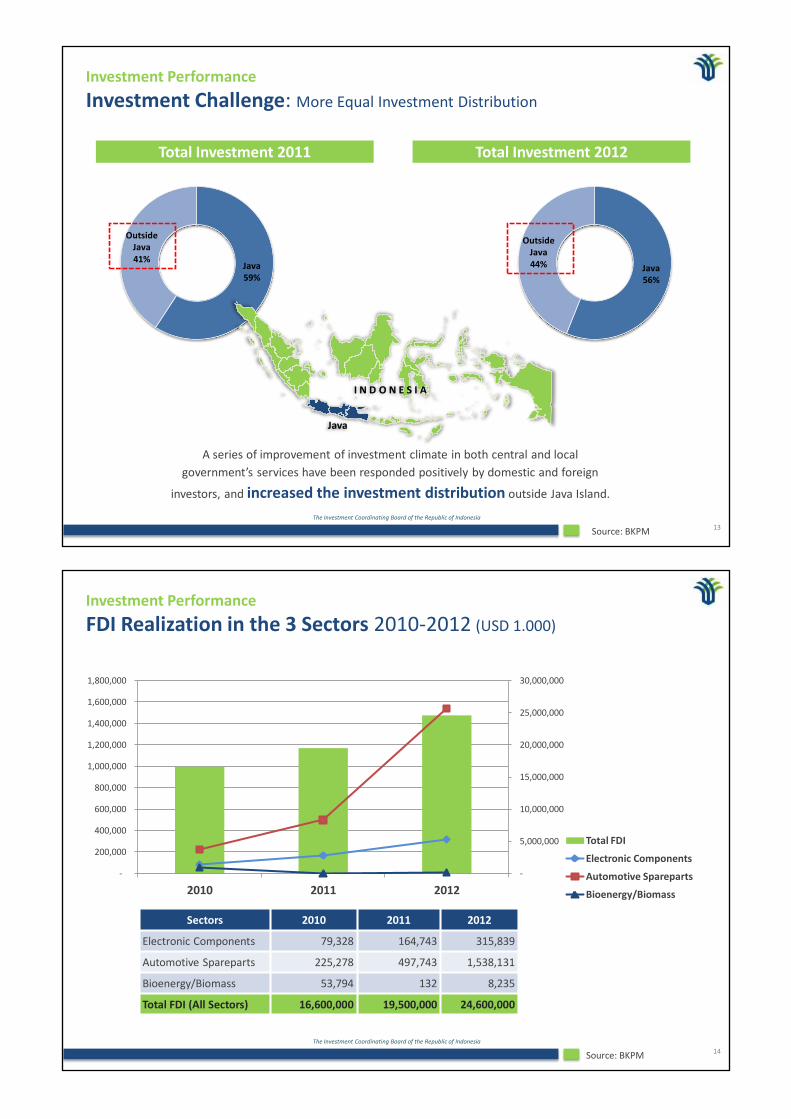
14
Investment Performance
FDI Realization in the 3 Sectors 2010-2012 (USD 1.000)
Source: BKPM
-
5,000,000
10,000,000
15,000,000
20,000,000
25,000,000
30,000,000
-
200,000
400,000
600,000
800,000
1,000,000
1,200,000
1,400,000
1,600,000
1,800,000
2010 2011 2012
Total FDI
Electronic Components
Automotive Spareparts
Bioenergy/Biomass
Sectors 2010 2011 2012
Electronic Components 79,328 164,743 315,839
Automotive Spareparts 225,278 497,743 1,538,131
Bioenergy/Biomass 53,794 132 8,235
Total FDI (All Sectors) 16,600,000 19,500,000 24,600,000
The Investment Coordinating Board of the Republic of Indonesia
15
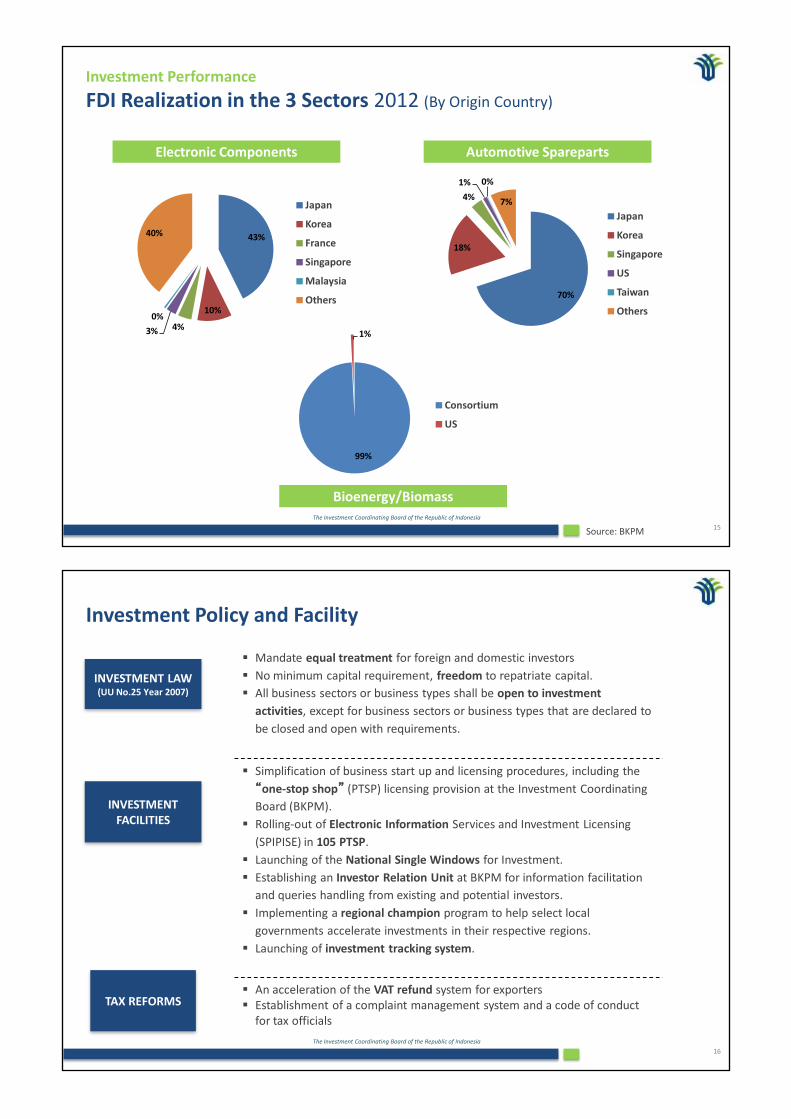
Investment Performance
FDI Realization in the 3 Sectors 2012 (By Origin Country)
Source: BKPM
70%
18%
4%
1% 0%
7%
Japan
Korea
Singapore
US
Taiwan
Others
43%
10%
4% 3%
0%
40%
Japan
Korea
France
Singapore
Malaysia
Others
99%
1%
Consortium
US
Electronic Components Automotive Spareparts
Bioenergy/Biomass
The Investment Coordinating Board of the Republic of Indonesia
16
INVESTMENT LAW (UU No.25 Year 2007)
INVESTMENT FACILITIES
Mandate equal treatment for foreign and domestic investors
No minimum capital requirement, freedom to repatriate capital.
All business sectors or business types shall be open to investment
activities, except for business sectors or business types that are declared to
be closed and open with requirements.
Simplification of business start up and licensing procedures, including the
“one-stop shop” (PTSP) licensing provision at the Investment Coordinating
Board (BKPM).
Rolling-out of Electronic Information Services and Investment Licensing
(SPIPISE) in 105 PTSP.
Launching of the National Single Windows for Investment.
Establishing an Investor Relation Unit at BKPM for information facilitation
and queries handling from existing and potential investors.
Implementing a regional champion program to help select local
governments accelerate investments in their respective regions.
Launching of investment tracking system.
An acceleration of the VAT refund system for exporters Establishment of a complaint management system and a code of conduct
for tax officials
TAX REFORMS
Investment Policy and Facility
The Investment Coordinating Board of the Republic of Indonesia
17
TAX ALLOWANCE
Government Regulation No. 12 of 2001 jo No. 31 of 2007 Exemption of value added tax of imported capital goods, machinery,
or equipment (except spare parts) which cannot be produced domestically
Submit tax-free letter to the Director General of Taxes
In December 2011, parliament passed a new land acquisition bill (stipulated as Law No 2/2012) which provides certainties in land pricing and timing of land acquisition process.
This will accelerate the construction of desperately needed roads, ports and airports to be better connect an archipelago of 17,500 islands spanning some 5,000 kilometers.
Government Regulation No.52 year 2011, 30% reduction of corporate net income based on investment value for
six years, 5% each year. The imposition of income tax on dividends paid to foreign tax subject
amounting to 10%, or a lower rate according to Tax Treaty Agreement. Tax facilities that could be granted to investors under certain
conditions has been issued. By this regulation, the tax allowance will be eligible for 129 business segments, expanded from 38 segments in the previous regulation.
VAT FACILITIES
LAND ACQUISITION
BILL
Investment Policy and Facility
The Investment Coordinating Board of the Republic of Indonesia
18
Investment Policy and Facility
Negative Investment List Presidential Regulation No.36 of 2010
The regulation stipulates the list of business fields closed to investment and business fields open,
with conditions, to investment and it comes into force as of May 2010.
The Negative Investment List is reviewed every 3 years.
In 2010 revision, 40 business sectors are more open for investors.
Closed business fields are certain business fields that
are prohibited from conducting any investment activities.
Closed
Business fields open, with conditions, are certain business fields that may conduct investment
activities under certain requirements.
Open with conditions All of business fields
in the 3 sectors:
Electronic components,
Automotive spareparts,
Bioenergy/biomass
are open to foreign investment without conditions.
Other
The Investment Coordinating Board of the Republic of Indonesia
19
1. Tourism and culture 2. Transportation (for public transportation services) 3. Public health services 4. Mining
5. Construction 6. Telecommunication 7. Port
Facility
Exemption from import duty on the import of machines for a period of 2 years.
Exemption from import duty on the imports of goods and materials for production for a maximum period of 2 years.
Exemption from import duty on the imports of goods and materials for production for a period of 4 years, is granted to a company which is using the locally-produced machines at least 30% of the total value of machines for its production.
Criteria
The imports of machines, goods and materials which may be exempted from import duty are granted to a company engaging in activities of:
a. an industry which produces goods and/or b. an industry which produces services.
Service industry which is eligible for the facility:
Exemption from import duty may be granted to the extent that the machines, goods and materials: a. are not produced in Indonesia; b. are produced in Indonesia but the they do not meet the required specifications; c. are produced in Indonesia but the quantity is not sufficient for the need of the industry.
Investment Policy and Facility
Import Duty Facilities Regulation of The MoF No. 176/PMK.011/2009
The Investment Coordinating Board of the Republic of Indonesia
20
Investment Policy and Facility
Tax Holiday Regulation of The MoF No. 130/PMK.011/2011
Facility
• A taxpayer can be granted a tax relief facility for a period of between 5 and 10 years, starting from the commencement of its commercial production
• After the expiration of the tax holiday, the taxpayer will be entitled to an income tax reduction of 50% for a further 2 years.
• By considering the purpose of maintaining the competitiveness of national industries and the strategic value of certain business activities, the duration of the tax relief and reduction can be extended based on a decision by the Minister of Finance
Criteria
• Constituting a pioneer industry:
1. Basic metal industries;
2. Oil refinery industries and/or basic organic chemicals originating from oil and natural gas;
3. Machinery industries;
4. Industries in the field of renewable resources;
5. Communication devices industries.
• Having a new investment plan having obtained the approval of competent authorities in a minimum amount of IDR 1 trillion (USD 112 million).
The Investment Coordinating Board of the Republic of Indonesia
21
CONSIDER Is it an open business field? What are the recommendation requirements? Is the proposed business field allowed to obtain fiscal facilities?
FILLING OUT OF APPLICATION
FORM Enclosing all required documents
SELF ASSESSMENT Check List
FRONT OFFICE Examination of the application form and
the attachments by FO Officer
APPLICATION RECEIVED Complete and correct
BACK OFFICE Process of Issuing the Approval/License
APPLICATION RECEIPT & PIN FOR
INVESTMENT TRACKING SYSTEM
APPLICATION RETURNED Due to incompleteness or incorrectness
with notes about the incomplete data, etc. ADMINISTRATION Administration of the
numbering of the
Approval/License
NO
YES
Investment Procedure
Mechanism for Approval and Licensing
The Investment Coordinating Board of the Republic of Indonesia
22
22
Investor
Notary
Ministry of Law and
Human Rights
Registration License
Principle License
Implementation Permits 1. Location Permit 2. Building Construction Permit (IMB) 3. Nuisance Permit UUG/HO 4. Company Registration Certificate (TDP), etc.
Non-Fiscal Facility Producer Importer Registration Number (API-P) Fiscal Facility 1. Customs Facility Approval for Capital
Goods 2. Corporate Income Tax Facility Proposal
Business License
Investor Registration
Application for Principle License
Submission of the Company’s Deed of
Establishment (Articles of Association)
Submission of Certificate of Incorporation
Application for Business License
COMMERCIAL PHASE
PREPARATION PHASE
CONSTRUCTION PHASE
1 1a
Investor Registration
Investor Registration
1b
1c
2
4
3
5
6
7 Fiscal Facilities
Customs Facility Approval for Raw Materials
8
Investment Procedure
Investment Phase
The Investment Coordinating Board of the Republic of Indonesia
23
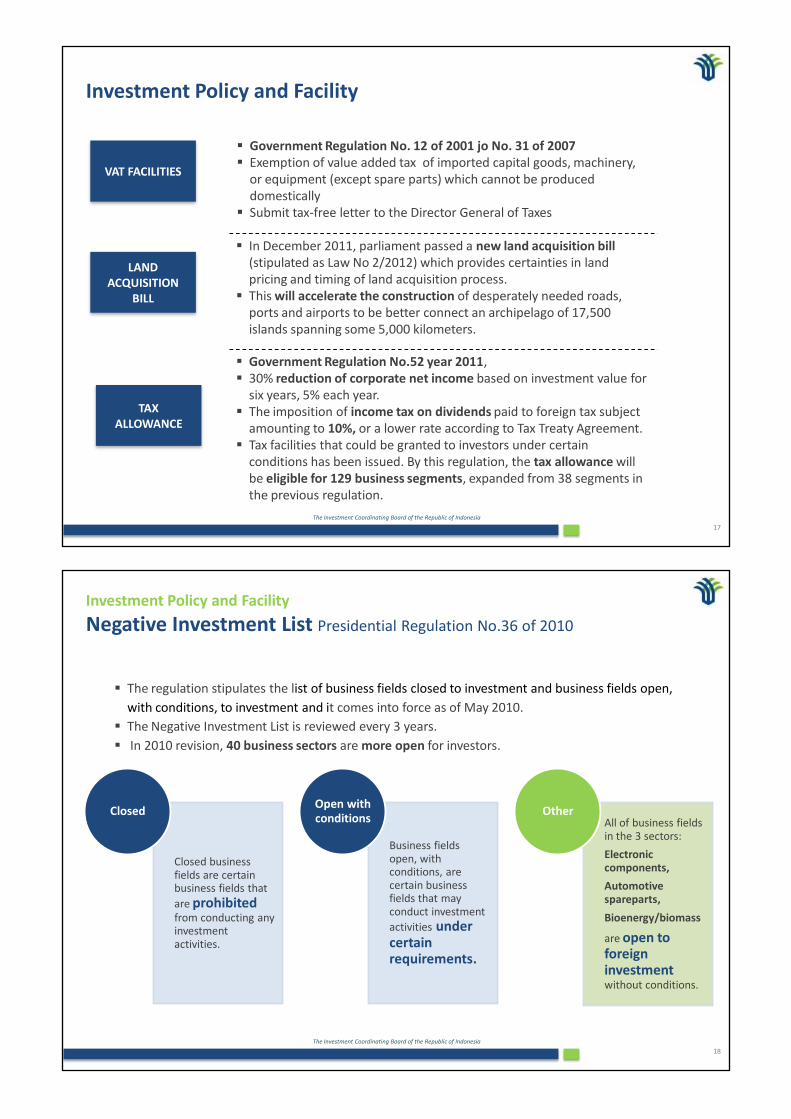
License SOP (days)
1 2 3 4 5 6 7
Investment Registration
Investment Principal License
Representative Office
Permanent License
Producer Importer Identity Number (API-P)
Import Duty Exemption Approval
- Capital Goods
- Raw materials for 2 years operation
Investment Procedure
The Length of Time to Obtain Investment Licenses at BKPM
The Investment Coordinating Board of the Republic of Indonesia
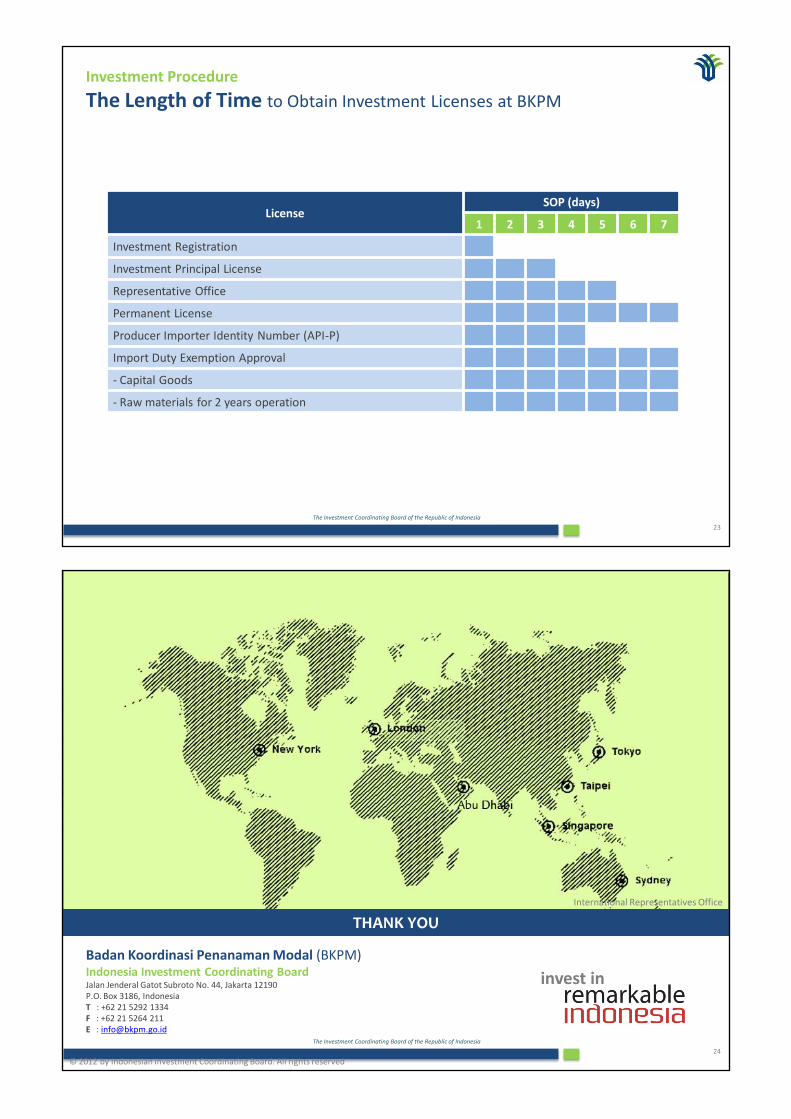
Badan Koordinasi Penanaman Modal (BKPM) Indonesia Investment Coordinating Board Jalan Jenderal Gatot Subroto No. 44, Jakarta 12190 P.O. Box 3186, Indonesia T : +62 21 5292 1334 F : +62 21 5264 211 E : [email protected]