22
INVESTMENT OPPORTUNITIES IN THE GCC SUITABILITY MAPS FOR GRID-CONNECTED AND OFF-GRID SOLAR AND WIND PROJECTS

INVESTMENT OPPORTUNITIES IN THE GCCSUITABILITY MAPS FOR GRID-CONNECTED AND OFF-GRID SOLAR AND WIND PROJECTS

Copyright © IRENA 2016
Unless otherwise stated, this publication and material featured herein are the property of IRENA and are subject to copyright by IRENA.
Material in this publication may be freely used, shared, copied, reproduced, printed and/or stored, provided that all such material is clearly
attributed to IRENA and bears a notation that it is subject to copyright (© IRENA 2016).
Material contained in this publication attributed to third parties may be subject to third-party copyright and separate terms of use and
restrictions, including restrictions in relation to any commercial use.
About IRENA
The International Renewable Energy Agency (IRENA) is an intergovernmental organisation that supports
countries in their transition to a sustainable energy future, and serves as the principal platform for
international cooperation, a centre of excellence, and a repository of policy, technology, resource and
financial knowledge on renewable energy. IRENA promotes the widespread adoption and sustainable use of
all forms of renewable energy, including bioenergy, geothermal, hydropower, ocean, solar and wind energy,
in the pursuit of sustainable development, energy access, energy security and low-carbon economic growth
and prosperity.
Acknowledgements
IRENA would like to acknowledge the data providers of the Global Atlas for Renewable Energy, in particular those
mentioned in this study: Mines ParisTech, Danish Technical University, European Commission – Joint Research Centre,
Geomodel, the United Nations Environment Programme, Oakridge National Laboratory and the OpenStreetMap
Foundation.
The methodology used in this study originates from a study carried by IRENA in 2013. IRENA would like to express its
sincere gratitude to past contributors that helped to develop the methodology: Jafaru Abdulrahman (ECREEEa), Xabier
Nicuesa Chacon (CENERb), Daniel Getman (NRELc), Hosni Ghedira (Masdar Institute), Carsten Hoyer Klick (DLRd), Bart
de Lathouwer (OGCe), Lionel Menard (MINES ParisTech), Ivan Moya (CENERb), Dave Renne (ISESf), Christoph Schillings
(DLRd), Sandor Szabo (EU-JRCf), David Villar (ECREEEa), Lucien Wald (MINES ParisTech) and Thomas Wanderer (DLRd).
GIS analysis was conducted in-house by Jacinto Estima.
Report and analysis by: Abdulmalik Oricha Ali, Jacinto Estima and Nicolas Fichaux
Feedback: [email protected]
a ECOWAS Centre for Renewable Energy and Energy Efficiency; b Centro Nacional de Energías Renovables; c National
Renewable Energy Laboratory; d Deutsches Zentrum für Luft- und Raumfahrt (German Aerospace Center – DLR);
e Open Geospatial Consortium; f International Solar Energy Society; g Joint Research Centre – European Commission
DisclaimerThe designations employed and the presentation of materials featured herein are provided on an “as is” basis, for informational
purposes only, without any conditions, warranties or undertakings, either express or implied, from IRENA, its officials and agents,
including but not limited to warranties of accuracy, completeness and fitness for a particular purpose or use of such content.
The information contained herein does not necessarily represent the views of the Members of IRENA, nor is it an endorsement of any
project, product or service provider. The designations employed and the presentation of material herein do not imply the expression
of any opinion on the part of IRENA concerning the legal status of any region, country, territory, city or area or of its authorities, or
concerning the delimitation of frontiers or boundaries.

CONTENTS » The Global Atlas for Renewable Energy – supporting the energy transition 5
» Outcome 5
» Recommended use 6
» Sample Maps 6
» Simple conversion to equivalent power capacity 9
» Context for assessing renewable energy potential 10
» An opportunity-based approach to market prospection 10
» A simple and replicable suitability approach 11
» A note on spatial resolution 13
» Application to the GCC – Step 1: selected dimensions and presentation of the datasets used for the analysis 14
» Application to the GCC – Step 2: thresholding values 17
» Application to the GCC – grid-connected wind energy 18
» Application to the GCC – off-grid wind energy 19
» Application to the GCC – grid-connected solar photovoltaic 20
» Application to the GCC – off-grid solar photovoltaic 20
» References 21
LIST OF FIGURES » Figure 1: Download suitability maps from the IRENA Global Atlas 6
» Figure 2: WIND POWER – Grid-connected (left) and off-grid (right). Example of suitability
for renewables projects of 60% or higher at a grid distance of 75 km 7
» Figure 3: SOLAR PHOTOVOLTAIC – Grid-connected (left) and off-grid (right).
Example of suitability for renewables projects of 60% or higher at a grid distance of 75 km 8
» Figure 4: Technical potential for grid-connected and off-grid wind systems in the GCC
The results are presented by suitability class 9
» Figure 5: Technical potential for grid-connected and off-grid photovoltaic systems in the GCC
The results are presented by suitability class 9
» Figure 6: Illustration of the comparative advantages of a suitability analysis 11
» Figure 7: Illustration of the IRENA suitability approach for two dimensions 12
» Figure 8: Illustration of the IRENA’s opportunity-based approach to finding suitable
investment locations 12
LIST OF TABLES » Table 1: Total technical potential (GW) for the GCC 9
» Table 2: Steps to convert suitability scores to technical potential 10
» Table 3: Spatial resolution of the datasets used in this analysis 15


INVESTMENT OPPORTUNITIES IN THE GCC 5
The Global aTlas for renewable enerGy – supporTinG The enerGy TransiTionWith the recent adoption of the Paris agreement to reduce greenhouse gas emissions, renewable energy has emerged as a critical part of any global solution to address the threat of climate change. To accelerate the necessary energy transition, countries will need to engage in detailed analysis of their technical potential for the development of renewables. This does not entail quantifying the energy resources over large areas, but rather carrying out specific, detailed assessments of suitable sites for investments in the near future. This analysis provides a continent-wide pre-feasibility assessment of solar and wind opportunities across the GCC, for both grid-connected and off-grid systems.
The International Renewable Energy Agency (IRENA) is working to help countries double the global share of renewable energy by 2030, from a current level of 18% (IRENA, 2014a). The energy transition has started already, as shown by the latest renewable energy statistics 1. Reaching 36% of the world’s total final energy consumption (TFEC) from renewable energy sources is technically feasible and economically viable, and its impact will be positive for both the climate (IRENA, 2015a) and socio-economic conditions (IRENA, 2014b). Investment is expected to nearly double from current levels to USD 500 billion annually by 2020, and from there to USD 900bn by 2030 (IRENA, 2015a).
Attracting larger investments to the sector requires both financial engineering and improved market conditions. Governments have started their policy reform. According to data from the Renewable Energy Policy Network for the 21st Century (REN21, 2015) at least 164 countries have renewable energy targets and 145 have approved renewable-energy policies to achieve them. Setting ambitious targets helps stimulate interest in new markets (IRENA, 2015b), however their implementation requires further planning and analysis to locate the best locations for renewables development (IRENA, 2013a; IRENA, 2013b).
One of the IRENA initiatives to stimulate investment in renewables is the Global Atlas for Renewable Energy (Global Atlas). Featuring data from a consortium of 67 countries and 50 data providers, the Global Atlas is the world’s largest collection of the most recent and most accurate public maps of renewable-energy resources. The Global Atlas supports public and private entities in performing map-based pre-feasibility analyses. Maps are instruments particularly well suited to perform strategic analyses because they provide a common language to engage in dialog with local communities; they help companies and investors to complete high-level evaluations of projects; and support citizens’ understanding of these projects and their potential impact.
OUTCOMEThis analysis used a specific and innovative methodology to provide a continent-wide pre-feasibility assessment of the solar and wind opportunities for the GCC, for both grid-connected and off-grid systems. Datasets employed have spatial resolutions of 1 km for solar irradiation and 1 km for wind.
The final outcome includes a high resolution map (1 km resolution) displaying suitability for projects on land. This was done by assigning numerical values to several suitability dimensions and merging these into a single value. These dimensions include the resource intensity, distance to power grids, population density, land cover, topography, altitude, and protected areas. The final maps are available in GIS format for display and download through the IRENA Global Atlas.
In addition to the maps, aggregate figures of equivalent installed capacity per sub-region (technical potential, in GW) are provided for illustrative purposes.
1 http://resourceirena.irena.org/gateway/dashboard/

6 GLOBAL ATLAS FOR RENEWABLE ENERGY
RECOMMENDED USEThe user of the IRENA maps should be mindful that, despite their high resolution, results remain sensitive to the selection and ranges of input data. The maps provide a valid overview at continental and regional levels but may not be relevant in local contexts. The primary reason is that as the area under study decreases in size there should be an accompanying increase in detail, including more information about local conditions. Examples that may not be factored in the larger maps covering larger territory displayed in this analysis include local conditions such as land ownership, intermittent land use, protected landscapes, sensitive ecosystems, and grid capacity in comparison to electricity demand .
The value proposition of this study is therefore not to deliver a final map or assessment but instead to introduce a consistent and replicable methodology for evaluating renewable energy potential using a peer-reviewed opportunity-based approach, which is more detailed option in contrast with more common exclusion-based approaches.
This new approach can generate maps that can be used to identify ideal sites for projects and to initiate a dialog with regional and local entities and communities. They will be iteratively updated through the IRENA Global Atlas as more information becomes available.
SAMPLE MAPSA wide range of these maps are accessible at http://irena.masdar.ac.ae/?map=2146, and below are a sample of them, at a grid distance of 75 km, to further explain the concept.
DOWNLOAD RESULTS The resulting suitability maps can be downloaded in GIS-compatible format from the Global Atlas for Renewable Energy at: http://irena.masdar.ac.ae/?map=2146.
Figure 1: Download suitability maps from the IRENA Global Atlas.

INVESTMENT OPPORTUNITIES IN THE GCC 7
Figure 2: WIND POWER – Grid-connected (upper) and off-grid (lower). Example of suitability for renewables projects of 60% or higher at a grid distance of 75 km. The maps are available on the IRENA Global Atlas website. They display prospective areas in yellow (60-70%), ones with more suitability in orange (70-80%), and those with the most (>80%) in red. The upper map includes a zoom on the Dhofar province (Sultanate of Oman), which demonstrates suitability scores above 90%. In this area, Masdar’ s 50MW Dhofar wind farm will represent 7 percent of total installed generation capacity in the Dhofar Governorate.

8 GLOBAL ATLAS FOR RENEWABLE ENERGY
Figure 3: SOLAR PHOTOVOLTAIC – Grid-connected (upper) and off-grid (lower). Example of suitability for renewables projects of 60% or higher at a grid distance of 75 km. The maps are available on the IRENA Global Atlas website. They display prospective areas in yellow (60-70%), ones with more suitability in orange (70-80%), and those with the most (>80%) in red. The upper map includes a zoom on Dubai, which demonstrates suitability scores above 90%, in relation with the very low PV electricity cost announced for the most recent installations.

INVESTMENT OPPORTUNITIES IN THE GCC 9
SIMPLE CONVERSION TO EQUIVALENT POWER CAPACITYThe suitability maps were converted into equivalent GW of potential using simple assumptions. The objective of this exercise is not to provide definite values of wind or solar technical potential, but to help the reader grasp the scale of the opportunities highlighted by the maps.
Using a simple approach yields information relevant to shape policy without courting confusion with specific investment or demand scenarios or energy-system modelling.
One example is the installation density. In these maps it is the same for both grid and off-grid systems, so they can be compared in a qualitative manner and not as absolute values. For this study, off-grid projects are defined as utility-scale projects for mines, large industry or sizeable communities far from existing grids.
A simple conversion is then used to calculate technical potential (Table 2). The results show that equipping just 1% of the land surface with a suitability score above 60% would translate into 888 GW of technical potential, considering a distance to the grid of 75 km.
Figure 4: Technical potential for grid-connected and off-grid wind systems in the GCC. The results are presented by suitability class. The total values reach 65 GW for wind grid-connected, and 34 GW off-grid.
Figure 5: Technical potential for grid-connected and off-grid photovoltaic systems in the GCC. The results are presented by suitability class. The total values reach 505 GW for solar PV grid-connected, and 283 GW off-grid.
Table 1: Total technical potential (GW) for the GCC, 75km from the grid, for a suitability above 60%
Wind, grid-connected 65 GW
Wind, off-grid 34 GW
Solar, PV grid-connected 505 GW
Solar, PV off-grid 283 GW
TOTAL 888 GW
WIND GRID-CONNECTED 75 KM
SOLAR GRID-CONNECTED 75 KM
WIND OFF-GRID 75 KM
SOLAR OFF-GRID 75 KM

10 GLOBAL ATLAS FOR RENEWABLE ENERGY
ConTexT for assessinG renewable enerGy poTenTial Evaluation of technical potential and the mapping of opportunities are not exact sciences. There are no identified standards or best practices to perform geospatial analysis for renewable energy developments, so each study is unique. They provide assessments that depend heavily on the approach selected and the input data. For example, the IPCC referenced assessments of global renewable energy potential ranging from 85 to 580 exajoules per year (EJ/y) for wind and 1,575 to 49,837 EJ/y for direct solar energy (IPCC, 2011). Both versions are scientifically correct despite the large discrepancy in their findings.
Most studies were developed through modelling, and are for use in advocacy. Their aim has been to assess and communicate the role renewable energy can play in the future energy mix, and to investigate solutions to keep the global temperatures from rising more than two degrees Celsius, which is considered a threshold past with the consequences of climate change would be much worse.
However with the recent adoption of the Paris agreement, the role of this type of analysis is changing. It is evolving from a focus on assessing potential (GW values) to finding the best opportunities for investment. Reflecting that, the approach used by IRENA to create these maps is innovative. The primary value of these maps is to show where ideal or adequate locations for development can be found.
AN OPPORTUNITY-BASED APPROACH T0 MARKET PROSPECTIONThe Global Atlas for renewable energy currently includes 2,000 renewable energy resource maps. Each dataset has different spatial extent, different spatial resolutions, and underlying production and validation methods. For the GCC, the Global Atlas features solar and wind maps from United Arab Emirates, Saudi Arabia, Kuwait 4.
The advantage of national maps is that the validation process is more extensive and supported by long-term measurement campaigns. The disadvantage is that production and algorithms can differ by country, so aggregating them into a regional analysis would be inaccurate.
For consistency across several nations, datasets of continental or global detail are required, and their quality at this scale has improved. Until recently, continental or global datasets available in the public domain were provided at a spatial resolution of 10 km or more, and most were validated against ground measurements from the meteorological network. Datasets at a resolution of 5 km (or better) across countries have only recently been made available to the public, thanks to bilateral partnerships facilitated by IRENA5. These datasets have been validated extensively and documented so that users can understand the degree of uncertainty and decide for themselves how appropriate they are in guiding their decisions. According to IRENA (2013c), the resource data used in this study fall into the POTENTIAL+BUSINESS category for both solar and wind.
However, even very accurate renewable energy resource maps provide information of limited use for policy makers. For decision making and planning purposes, major additional dimensions need to be factored in. This can be achieved by combining the most relevant constraints and producing maps of suitable areas.
As no standard approach exists, IRENA has convened an international consortium involving public and private entities experts in solar and wind potential analysis to develop a suitable method (described hereafter). The outcome was tested in West Africa (IRENA, 2013a; IRENA, 2013b).
Table 2: Steps to convert suitability scores to technical potential
Step Objective Selected values for illustration purpose Output
1.Sum of the total surface above
a given suitability threshold Suitable surface = total surface with suitability > 60% km2
2.Assume a minor share of the
suitable surface would be equipped with devices2
1% km2
3.Assume an average installation
density
Wind: 4 MW / km2
Solar: 30 MW/km2MW/km2
4.Calculate the technical
potential3P = Suitable surface x 1% x density GW
2 IRENA, 2014b 3 For wind: IRENA (2014-b), for solar PV: IEA-ETSAP and IRENA (2013), and actual projects. These values are conservative. 4 Shared by Masdar Institute, KACare and KISR, respectively 5 Solar GHI 3 km and wind speed 5 km from Vaisala, DTU Global Wind Atlas 1 km, MINES ParisTech/Transvalor HelioClim3 solar dataset 1 km (partial access

INVESTMENT OPPORTUNITIES IN THE GCC 11
A SIMPLE AND REPLICABLE SUITABILITY APPROACHIRENA’s method is an opportunity-based approach, and it was developed as a response to the changing needs of policy makers, as they move from assessing potential to determining ideal areas for development. It offers a contrast to what has been the norm until now: an exclusion-based approach. To better understand the newer method it is useful to first describe the older one.
Most studies of geospatial analysis for assessing solar or wind potential have to this point followed the exclusion-based approach. As a starting point for calculating renewables potential this analysis first excluded land that is not available for renewables developments, for various reasons. The most common are distance to the grid, slopes terrain that is difficult to build on, protected areas, elevation, lakes and rivers. In some cases the distance to settlements, roads, load centres, protected areas, specific geological conditions, urban areas or military areas are also reasons to remove some land from the analysis.
The next step is to multiply the available surface by a density of installations in Megawatts per square kilometre (MW/km2). An assumed power curve or load factor of a typical installation is then combined with the resource available at each point in order to calculate a value in kilowatt-hours (kWh). This value is called a technical potential. Typically, values of the technical potential are summed up in order to assume a value at the level of a region or a country.
The main limitation of exclusion-based approaches is that they do not account for locations where developments are legally prohibited, technically impossible, or those where developments are unlikely for any particular reason. Maps based on exclusion criteria can often be challenged on the basis of the uncertainty of the input data, or where one or more aspects of the analysis could not be considered. Sensitivity analyses for such an approach also show large variations in the final value of technical potential.
The availability of GIS technology and the tremendous increase in computing power now allow for a more nuanced alternative. IRENA’s alternative is the opportunity-based approach (Figure 6). Instead of categorising land as either available or unavailable for development of renewables projects, these instead rank the quality of areas for development by assigning a score to each relevant factor (for example distance to the grid and population density), and using that output to create a suitability map (showing for example areas with both high population density and far from the grid) (IRENA, 2013a; IRENA, 2013b). This offers users more than a simple yes or no for an answer. (Figure 7).
Figure 6: Illustration of the comparative advantages of a suitability analysis. From an initial image (left), a transfer function is applied to each pixel to create a new map. With conventional exclusion methods, shown in the upper images, the function is a simple threshold. The consequence is a loss of information in the final image. The continuous transfer functions shown in the lower images, a feature of IRENA’s opportunity-based approach, preserves more information. IRENA uses a linear transfer function for the sake of simplicity, however others could be used to capture more information, such as the sigmoid function.
12 GLOBAL ATLAS FOR RENEWABLE ENERGY
The maps created based on IRENA’s opportunity-based approach can be used to initiate discussions with stakeholders and authorities to reach a better understanding of local conditions and renewables potential. During these discussions specific areas can be identified as promising and more thorough investigations can be targeted. These options can include considering adding assumptions to feasibility studies and running more detailed models to build more realistic estimates of technical potential (Figure 8).
Distance to the Grid
Renewable Energy Resource Intensity
PopulationDensity
Protected Areas
Others- Intermittent land use- Land ownership- Roads and transportation- Emblematic landscapesLand
Cover
Topography WHAT IS A GOOD SITE?
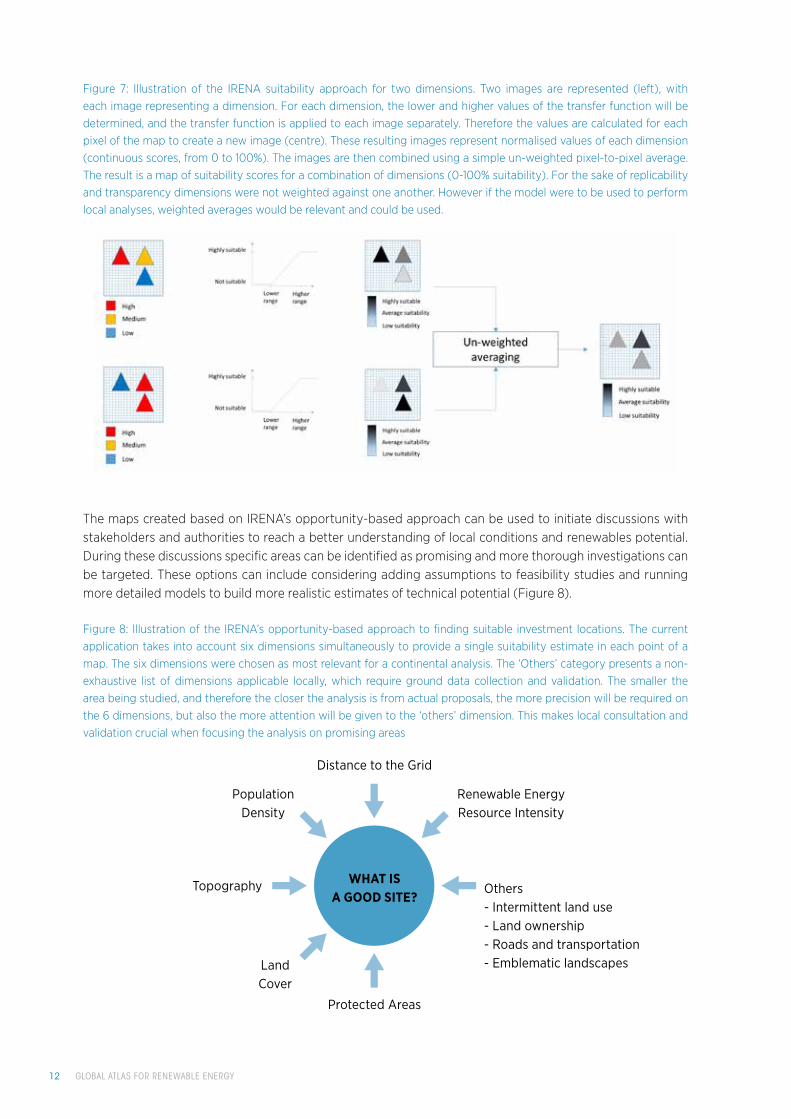
Figure 7: Illustration of the IRENA suitability approach for two dimensions. Two images are represented (left), with each image representing a dimension. For each dimension, the lower and higher values of the transfer function will be determined, and the transfer function is applied to each image separately. Therefore the values are calculated for each pixel of the map to create a new image (centre). These resulting images represent normalised values of each dimension (continuous scores, from 0 to 100%). The images are then combined using a simple un-weighted pixel-to-pixel average. The result is a map of suitability scores for a combination of dimensions (0-100% suitability). For the sake of replicability and transparency dimensions were not weighted against one another. However if the model were to be used to perform local analyses, weighted averages would be relevant and could be used.
Figure 8: Illustration of the IRENA’s opportunity-based approach to finding suitable investment locations. The current application takes into account six dimensions simultaneously to provide a single suitability estimate in each point of a map. The six dimensions were chosen as most relevant for a continental analysis. The ‘Others’ category presents a non-exhaustive list of dimensions applicable locally, which require ground data collection and validation. The smaller the area being studied, and therefore the closer the analysis is from actual proposals, the more precision will be required on the 6 dimensions, but also the more attention will be given to the ‘others’ dimension. This makes local consultation and validation crucial when focusing the analysis on promising areas

INVESTMENT OPPORTUNITIES IN THE GCC 13
A NOTE ON SPATIAL RESOLUTIONWhile the calculations are performed every 1 km across the continent, the information content is limited by the less-detailed dataset used for the calculations. The following section provides further information on the datasets used for the analysis, and Table 3 provides a brief summary of their spatial resolution. It is important to note that if the final result is calculated at a 1 km resolution, and the actual information content is also 1 km.
Dimension Spatial resolution
Wind speed 1 km
Solar irradiance (GHI) 1 km
Grid Linear – validated over Google maps, expected error lower than 100 m. However, dataset can be incomplete.
Population density 1 km
Slope / topography Approx. 100 m
Land cover Approx. 300 m
Protected areas Polygons
Table 3: Spatial resolution of the datasets used in this analysis.

14G
LOBAL ATLAS FO
R RENEW
ABLE ENERG
Y
Application to the GCC – Step 1: selected dimensions and presentation of the datasets used for the analysis Table 4: Presentation of the dimensions considered for the GCC analysis, dataset selection and discussion on the limitations.
Dimension Wind Solar Grid-connected
Off-grid Datasets and limitations
Wind speed at 100 m in metres per second (m/s))
X X X
DTU Global Wind Atlas, 1 km spatial resolution. The Global Wind Atlas provides a high resolution wind climatology at 50, 100, 200 m hub heights above the surface for the world (onshore and 30 km offshore). These layers have been produced using microscale modelling in the Wind Atlas Analysis and Application Program (WAsP) and capture small-scale spatial variability of wind speeds due to high resolution orography (terrain elevation), surface roughness and surface roughness change effects. The layers shared through the IRENA Global Atlas are served at 1km spatial resolution. The full Atlas contains data at a higher spatial resolution of 250 m. Some of the IRENA Global Atlas tools use this data for aggregated statistics.
Limitations: The map is the outcome of a simulation. It is validated globally but not locally, which would require ground validation. The average annual values do not provide indications of the inter-annual variability. However, the average value is built on a multi-decade data archive and inherently captures the past inter-annual variability. It however cannot anticipate the values which may appear in the future.
Solar irradiation (GHI)
X X X
HelioClim-3 version 5 Global Horizontal Irradiation map, computed over the years Feb. 2004-Dec. 2014. The HelioClim surface solar radiation (SSR) databases, HelioClim-1 and HelioClim-3, are based on Surface Solar Radiation (SSR) estimation from Meteosat Second Generation images. The satellite-based method used to estimate the SSR is named Heliosat-2 and was proposed and developed MINES ParisTech / ARMINES / Transvalor. The HelioClim databases are commercialised by Transvalor and are available, with other solar-related web-services, at www.soda-pro.com.
Credits: MINES ParisTech / ARMINES / Transvalor – HC3v5 – Dec. 2015.
Limitations: The map is the outcome of estimates from satellite data. These estimates have been validated against measurements performed at ground level at a few meteorological stations. The average annual values do not provide indications of the inter-annual variability. However, the average value is built on a decade data archive and inherently captures the past inter-annual variability. It however cannot anticipate the values which may appear in the future.

INVESTMENT O
PPORTUNITIES IN THE G
CC15
Dimension Wind Solar Grid-connected
Off-grid Datasets and limitations
Grid distance (km)
X X X X
Open Street Map®, extracted for global power lines. This map shows the power lines for the world. The power lines have been reviewed for geographical accuracy using Google Earth. Most of the lines checked on the map seem to correspond with the actual location as confirmed by high resolution aerial images on Google Earth.
Limitations regarding the dataset: The dataset is incomplete in certain areas and provides less information than ideal on the voltage capacity of some of the lines. This dataset was extracted from the OpenStreetMap® initiative. OpenStreetMap® is open data, licensed under the Open Data Commons Open Database License (ODbL) by the OpenStreetMap Foundation (OSMF).
Limitations regarding our approach: Connecting to the grid is not solely dependent on the distance between the grid and new connection point, as the local situation on the ground can be far more complex. The feasibility of grid connection depends the cost of doing so compared with the overall project cost. Larger projects may allow for dedicated lines to be deployed. Planned grid extensions were not considered in this demonstration, so it therefore provides only a snapshot of the current situation. The possibility of connecting to the line does not guarantee that any capacity will be available to transport additional energy. For off-grid applications, the presence of a transmission line in the vicinity of a population centre does not guarantee that the centre will be connected to that grid.
Population density (persons/km2)
X X X X
The LandScan 2014 Global Population Database was developed by Oak Ridge National Laboratory (ORNL) for the United States Department of Defense (DoD). It presents a probable population density by square kilometre everywhere on Earth.
Limitations: Although the dataset is updated annually, sudden movements of populations (conflicts, flood) may not be captured by this dataset.
Slope (%) X X X X
Dataset available from the Global Atlas. Terrain maps show the elevation above sea level on the land and depth of the ocean and sea bottom. The map was developed from Shuttle Radar Topography Mission (SRTM) and SRTM Water Body Dataset (SWBD).
The detailed SRTM3 data with grid resolution of three arcsec (~90 m at the equator) are available between the latitudes of 60°N and 50°S, which represent most land.
16G
LOBAL ATLAS FO
R RENEW
ABLE ENERG
Y
Dimension Wind Solar Grid-connected
Off-grid Datasets and limitations
Land cover
X X X X
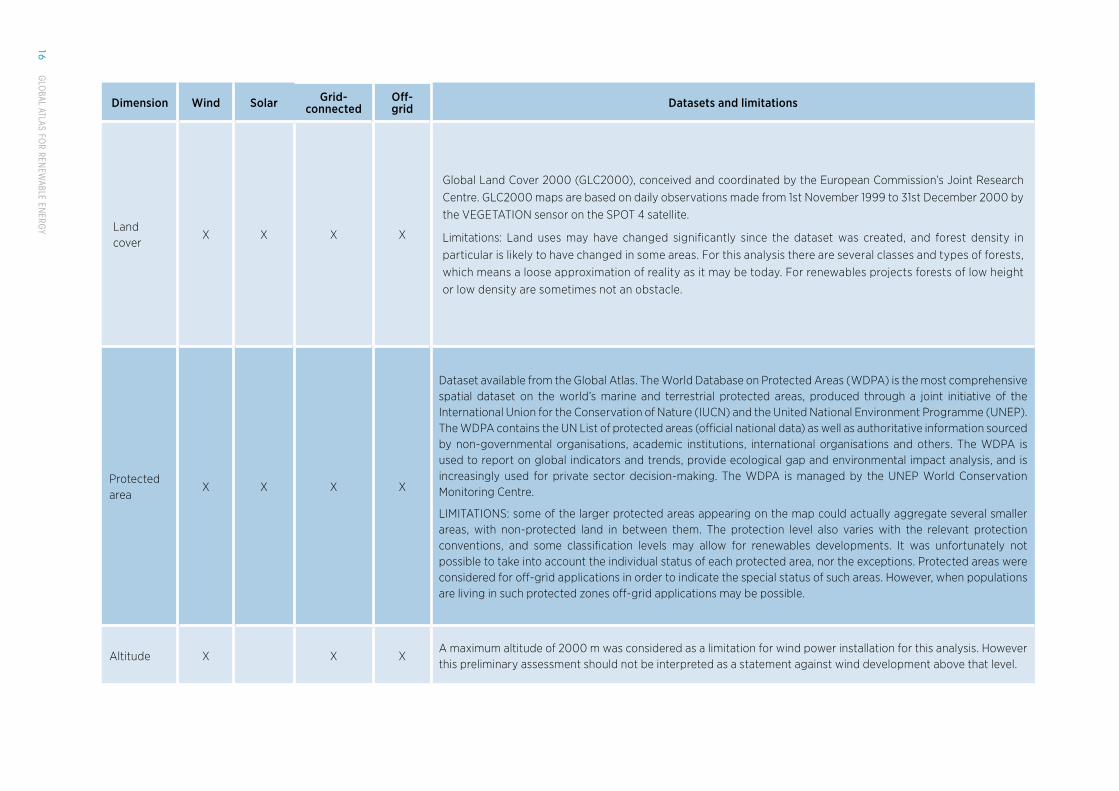
Global Land Cover 2000 (GLC2000), conceived and coordinated by the European Commission’s Joint Research Centre. GLC2000 maps are based on daily observations made from 1st November 1999 to 31st December 2000 by the VEGETATION sensor on the SPOT 4 satellite.
Limitations: Land uses may have changed significantly since the dataset was created, and forest density in particular is likely to have changed in some areas. For this analysis there are several classes and types of forests, which means a loose approximation of reality as it may be today. For renewables projects forests of low height or low density are sometimes not an obstacle.
Protected area
X X X X
Dataset available from the Global Atlas. The World Database on Protected Areas (WDPA) is the most comprehensive spatial dataset on the world’s marine and terrestrial protected areas, produced through a joint initiative of the International Union for the Conservation of Nature (IUCN) and the United National Environment Programme (UNEP). The WDPA contains the UN List of protected areas (official national data) as well as authoritative information sourced by non-governmental organisations, academic institutions, international organisations and others. The WDPA is used to report on global indicators and trends, provide ecological gap and environmental impact analysis, and is increasingly used for private sector decision-making. The WDPA is managed by the UNEP World Conservation Monitoring Centre.
LIMITATIONS: some of the larger protected areas appearing on the map could actually aggregate several smaller areas, with non-protected land in between them. The protection level also varies with the relevant protection conventions, and some classification levels may allow for renewables developments. It was unfortunately not possible to take into account the individual status of each protected area, nor the exceptions. Protected areas were considered for off-grid applications in order to indicate the special status of such areas. However, when populations are living in such protected zones off-grid applications may be possible.
Altitude X X XA maximum altitude of 2000 m was considered as a limitation for wind power installation for this analysis. However this preliminary assessment should not be interpreted as a statement against wind development above that level.

INVESTMENT OPPORTUNITIES IN THE GCC 17
Application to the GCC – Step 2: thresholding values
or each dimension listed in Table 1, a range of values needed to be specified in order to allocate a progressively cumulative score. The lowest score, zero, indicates the minimum acceptable value. It increases linearly to one (100%), when a suitable value is reached and maintained at 100% beyond this value.
The method is sensitive to several assumptions:
» The minimum and the maximum suitability thresholds are based on expert knowledge. In an ideal situation, energy authorities and planners would be able to modify the dimensions and carry sensitivity analyses.
» A linear increment was selected for this demonstration, but other mathematical functions can be proposed to model the incremental suitability of a dimension. A commonly used mathematical function is the sigmoid (S-shape function). Changing the function would affect the results.
» The final score is the average of all the individual scores. Some methods (not used in this demonstration) may propose increasing or decreasing the weightings some of the scores in order to increase the influence of a particularly important dimension.
» Some dimensions did not allow for a scoring system more complex than a yes-or-no answer, such as protected areas and land cover. In such cases the score is set to 0 in protected areas and 100% for all those unprotected. Those dimensions act as exclusions and were considered only in the last stage of the calculations.

18 GLOBAL ATLAS FOR RENEWABLE ENERGY
Application to the GCC – grid-connected wind energy
For grid-connected wind energy, three scenarios are proposed in order to visualise the influence of the distance to the grid on the final scores. The analysis awards a higher score to areas with lower population densities, because more space can be made available for large renewable energy installations in these areas. Forested land and water bodies were not deemed suitable for installations. Protected areas are considered as part of the last step of the analysis, in order to highlight areas where specific regulations apply.
Dimension Min score (0%) at Max score (100%) at
Wind speed at 100 m (m/s) 4.5 7 and more
Grid distance – centralised (km) 75, 100 and 150 0
Population density – centralised (persons/km2)
500 0
Slope (%) 20 0
Land cover (exclusion)Forests + water bodies and water bodies only
Other categories
Protected areas (exclusion) 0 for protected areas 1 outside
Altitude (exclusion) 0 above 2000 m above sea level 1 below 2000 m above sea level
Dimension Value Score
Wind speed (m/s) 6 (6-4.5)/(7-4.5) = 0.6
Grid distance [range 0 – 150] (km)
50 1 – (50 / 150) = 0.66
Population density (persons/km2)
100 1 – (100/500) = 0.8
Slope (%) 5 1 – (5/20) = 0.75
Land cover Grassland 1
Protected area No 1
Altitude (m) 500 1
Final score ((0.6+0.66+0.8+0.75)/4)*1*1*1 = 70%
Example of the final score calculation

INVESTMENT OPPORTUNITIES IN THE GCC 19
Application to the GCC – off-grid wind energy
For off-grid applications, three scenarios are proposed, based on the distances of sites from the grid to which they might eventually be connected.
The approach considers higher score for locations further from the grid. However, off-grid applications can also be eligible if they are close to transmission lines. As discussed in the previous section, the proximity of a transmission line to a population centre does not guarantee any grid connection for residents or businesses there, especially given the disparity, for example, between a 220 V household connection and a high-voltage, 400,000 V power line.
Considering that the objective of the United Nations’ Sustainable Energy for All (SE4All) initiative is to provide universal access to energy, no minimum threshold was considered for population density for off-grid projects. Protected areas, although not directly relevant because communities may be located in such areas, still appear on the final maps to highlight that in such areas specific or different legislation may apply.
Dimension Min score (0%) at Max score (100%) at
Wind speed at 100 m (m/s) 4.5 7 and more
Grid distance – decentralised (km)
075, 100 and 150 and max above those distances
Population density – decentralised (persons/km2)
0 Maximum above 0
Slope (%) 20 0
Land cover (exclusion)Forests + water bodies and water bodies only
Other categories
Protected areas (exclusion) 0 for protected areas 1 outside
Altitude (exclusion) 0 above 2000 m above sea level 1 below

20 GLOBAL ATLAS FOR RENEWABLE ENERGY
Application to the GCC – grid-connected solar photovoltaic
For grid, connected solar PV, three scenarios are proposed in order to visualise the influence of the distance to the grid on the final scores. The analysis awards a higher score to areas with lower population densities, because more space can be made available for large renewable energy installations in these areas. Forested land and water bodies were not deemed suitable for installations. Protected areas are considered as part of the last step of the analysis, in order to highlight areas where specific regulations apply.
Application to the GCC – off-grid solar photovoltaic
For off-grid developments, three scenarios are proposed that are dependent on a minimum distance for off-grid projects to the grid to be considered. However, as highlighted earlier, the presence of a transmission line in the vicinity of a population centre does not guarantee that the centre will be connected to that grid. Off-grid applications can also be eligible if they are close to transmission lines.
Considering that the objective of SE4All initiative is to provide universal access to energy, no minimum threshold was considered for population density for off-grid projects. Protected areas, although not directly relevant because communities may be located in such areas, still appear on the final maps to highlight that in such areas specific or different legislation may apply.
Dimension Min score (0%) at Max score (100%) at
Yearly global irradiation (kWh/m2)
1500 2100 and more
Grid distance – centralised (km) 75, 100 and 150 0
Population density – centralised (persons/km2)
500 0
Slope (%) 35 0
Land cover (exclusion)Forests + water bodies and water bodies only
Other categories
Protected areas (exclusion) 0 for protected areas 1 outside
Dimension Min score (0%) at Max score (100%) at
Yearly global irradiation (kWh/m2)
1500 2100 and more
Grid distance – decentralised (km)
075, 100 and 150 km and maximum above those distances
Population density – decentralised (persons/km2)
0 Maximum above 0
Slope (%) 35 0
Land cover (exclusion)Forests + water bodies and water bodies only
Other categories
Protected areas (exclusion) N/A 1 outside

INVESTMENT OPPORTUNITIES IN THE GCC 21
referenCes » Infomines, 2013, South America Mining Map, 2013, www.infomine.com/maps/posters/southamerica/.
» IPCC (Intergovernmental Panel on Climate Change) (2011), IPCC Special Report on Renewable Energy Sources and Climate Change Mitigation. Prepared by Working Group III of the Intergovernmental Panel on Climate Change [O. Edenhofer, R. Pichs-Madruga, Y. Sokona, K. Seyboth, P. Matschoss, S. Kadner, T. Zwickel, P. Eickemeier, G. Hansen, S. Schlömer, C. von Stechow (eds)]. Cambridge University Press, Cambridge, United Kingdom and New York, NY, USA.
» IRENA (The International Renewable Energy Agency) (2013a), Unleashing the wind potential in ECOWAS: Seeking areas of opportunity for grid-connected and decentralised wind applications, www.irena.org/DocumentDownloads/Publications/GA_ECOWAS_Wind_Web.pdf.
» IRENA (2013b), Unleashing the solar potential in ECOWAS: Seeking areas of opportunity for grid-connected and decentralised PV applications, www.irena.org/DocumentDownloads/Publications/GA_ECOWAS_Solar_Web.pdf.
» IRENA (2013c), Data quality for the Global Renewable Energy Atlas – Solar and Wind, www.irena.org/DocumentDownloads/Publications/Global%20Atlas_Data%20_Quality.pdf.
» IRENA (2014a), REmap 2030 – A Renewable Energy Roadmap, www.irena.org/remap/.
» IRENA (2014b), The Socio-economic Benefits of Solar and Wind Energy, www.irena.org/DocumentDownloads/Publications/Socioeconomic_benefits_solar_wind.pdf.
» IRENA (2015a), Rethinking Energy: Renewable Energy and Climate Change, www.irena.org/rethinking/.
» IRENA (2015b), Renewable Energy Target Setting, www.irena.org/DocumentDownloads/Publications/IRENA_RE_Target_Setting_2015.pdf.
» REN21 (Renewable Energy Policy Network for the 21st Century) (2015), Renewables 2015 Global Status Report, www.ren21.net/status-of-renewables/global-status-report/.

IRENA Headquarters
Masdar City
P.O. Box 236, Abu Dhabi
United Arab Emirates
www.irena.org
Copyright © IRENA 2016


