45
Investment Themes in Optical Networking September 2001 Bill Magill – Optical Components & Systems
| Date post: | 18-Dec-2015 |
| Category: |
Documents |
| Upload: | whitney-hines |
| View: | 216 times |
| Download: | 0 times |

Investment Themes in Optical Networking
September 2001
Bill Magill – Optical Components & Systems

2
Overview
Optical networking: defining the ecosystem
State of the industry
Looking forward: the bad and the good
Identifying the pain
Relieving the pain
Hot growth opportunities
Creating a Metric Of Interest
Investment summary

3
Defining The Ecosystem

4
Man
ufac
turi
ng S
ervi
ces
Man
ufac
turi
ng E
quip
men
t
Test
& M
easu
rem
ent E
quip
men
t
Food Chain In The Optical Networking Industry
Materials & Methods: Wafers, Fiber Preforms, Processes
Discrete components: passives, actives, planar
Modules & Subsystems: amplifiers, switches, ADMs, transponders
Systems: access, metro, long haul
Kigre Glass

5
Optical Networking Means Transparent Optical Solutions
STS-1 grooming:
Ciena CoreDirector
Sycamore SN16000
Corvis CorWave OCS
switching:
Calient DiamondWave
Lucent LambdaRouter
Corvis CorWave ON
O-ADM ring/mesh management:
Opthos IW 1000
Movaz RAYstar
Matisse D2WDM
OSP (amp, disp comp, DGE):
NP Photonics
Yafo
ZettaLight
MSPP, aggregation:
Cisco ONS 15454
Astral Point ON 7000
Ciena MetroDirector K2
LH Core
MetroCoreMetro
Access
mux & termination:
Ciena MultiWave
PhotonEx PX Ultra
Nortel OPTera
access:
AllOptic GigaForce
Paceon BPon
Quantum Bridge QB

6
The Optics Ecosystem – Systems & Subsystems
True Optical Switches
Calient Movaz
Lucent GlimmerGlass
Naynav Corvis Alcatel
Cinta Nortel Tellium
Optical Switch Plans?
Ciena
Sycamore Tellabs
Optical Add-Drops
Opthos
Matisse
AcceLight
WDM Terminals
Calient Lucent
Nortel Cisco
Alcatel Hitachi
Fujitsu NEC
Siemens Sycamore
Tellabs Reversi
Ultra Long-Haul
Corvis Innovance
Solinet Nortel
PhotonEx
O-ADM, OXC
OXC
WDMTerminals
OSP
OSPs
NP Photonics Optellios
Teem Photonics Phaethon
Zettalight Yafo
Xtera JDS Uniphase
Southampton Ph Corning
Optical Access
AllOptic Eluminent
Marconi Paceon
Optical Solutions OKI
Quantum Bridge
Siara TeraWave
PON
7
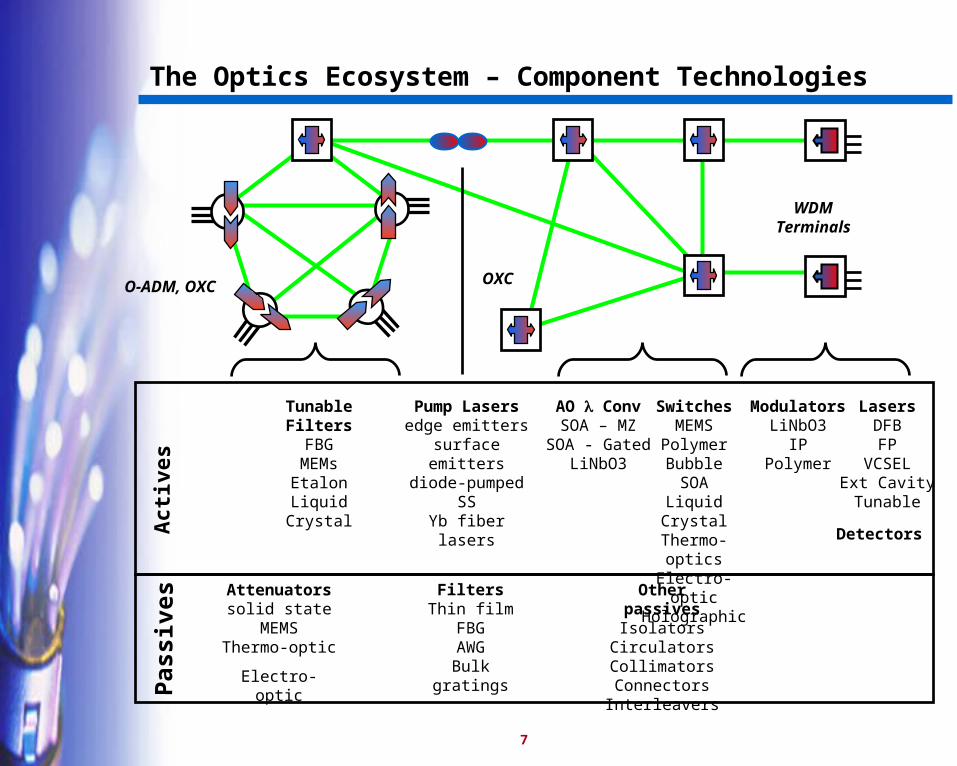
The Optics Ecosystem – Component Technologies
O-ADM, OXC OXC
WDMTerminals
LasersDFBFP
VCSELExt CavityTunable
ModulatorsLiNbO3
IPPolymer
Detectors
SwitchesMEMS
PolymerBubbleSOA
Liquid CrystalThermo-opticsElectro-opticHolographic
AO ConvSOA – MZ
SOA - GatedLiNbO3
Tunable FiltersFBG
MEMsEtalon
Liquid Crystal
Pump Lasersedge emitters
surface emittersdiode-pumped SS
Yb fiber lasers
Act
ives
Pas
sive
s Attenuatorssolid state
MEMSThermo-optic
Electro-optic
FiltersThin film
FBGAWG
Bulk gratings
Other passivesIsolators
CirculatorsCollimatorsConnectorsInterleavers

8
Select Companies Developing Active Components and Subsystems
Broadview, 9/01

9
Select Companies Developing Passive Components and Subsystems
Broadview, 9/01
10
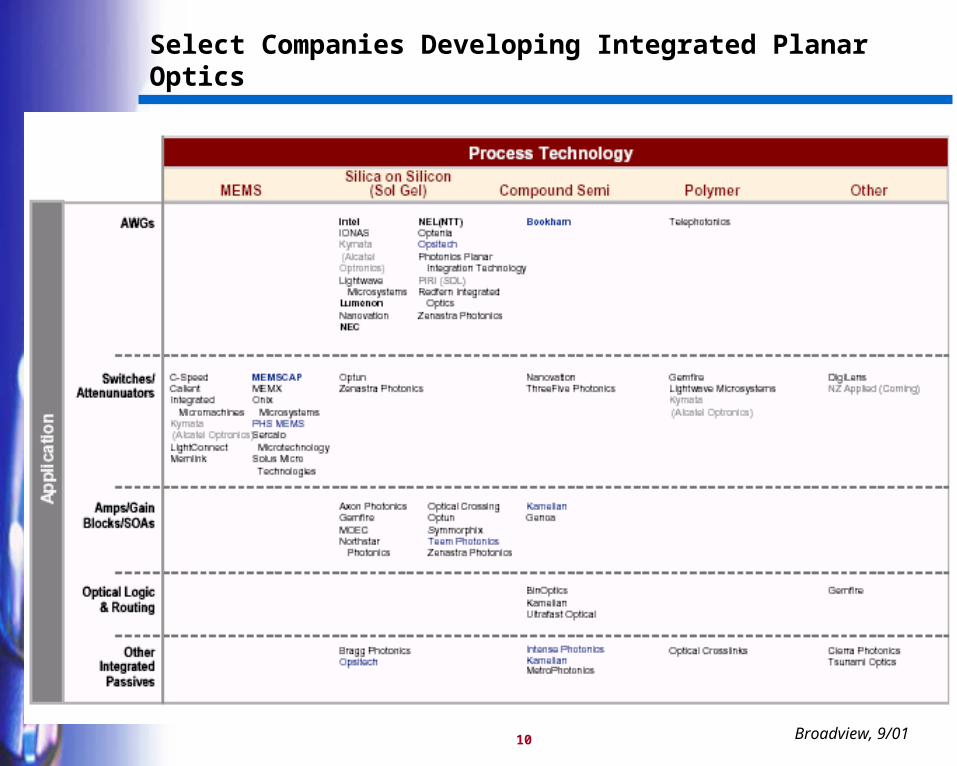
Select Companies Developing Integrated Planar Optics
Broadview, 9/01

11
State Of The Industry

12
Internet Traffic Growth Has Slowed
60%
80%
100%
120%
140%
160%
180%
200%
1999 2000 2001 2002 2003 2004
An
nu
al G
row
th
Recovery
Soft Landing
Contraction
RHK, 5/01

13
Carriers Over-invested Into The Slowing Growth
Carrier Spending Ratios
0.0
1.0
2.0
3.0
4.0
5.0
6.0
1996 1997 1998 1999 2000 2001
Averaged Carrier Revenues Divided By Average Capex

14
System Suppliers Have Seen Demand Dry Up …
TTM CY01E % Change % Ch. 00/99Ciena 1,520 1,611 6 98Alcatel 27,101 23,760 -12 36Lucent 24,800 23,200 -6 naNortel 26,500 22,400 -15 31ONI 160 250 56 1,866
Revenue Growth Comparison ($M)

15
… And The Market Outlook Revised Down, …
Recovery
Soft Landing
Contraction
$18
$23
$28
$33
$38
$43
$48
$53
2000 2001 2002 2003 2004
Bill
ion
sNov '00
RHK cuts NA Optical Transport Market Outlook by ~25% in May.

16
… And Down Further …
RHK Forecast Revision: NA Optical Transport Market
0.0
5.0
10.0
15.0
20.0
25.0
30.0
2000 2001 2002
$ B
illi
on
May 01 Fcst Range
Sept 01 Fcst Revision
RHK cuts NA Optical Transport Market Outlook by another 40% in September.

17
… And Inventories Build Up
On March 1 2 Year Avg % DifferenceAlcatel 145.0 103.4 40Ciena 108.5 86.1 26Cisco 80.9 58.6 38Lucent 102.8 102.4 0Nortel 87.8 78.0 13
Days of Inventory
18
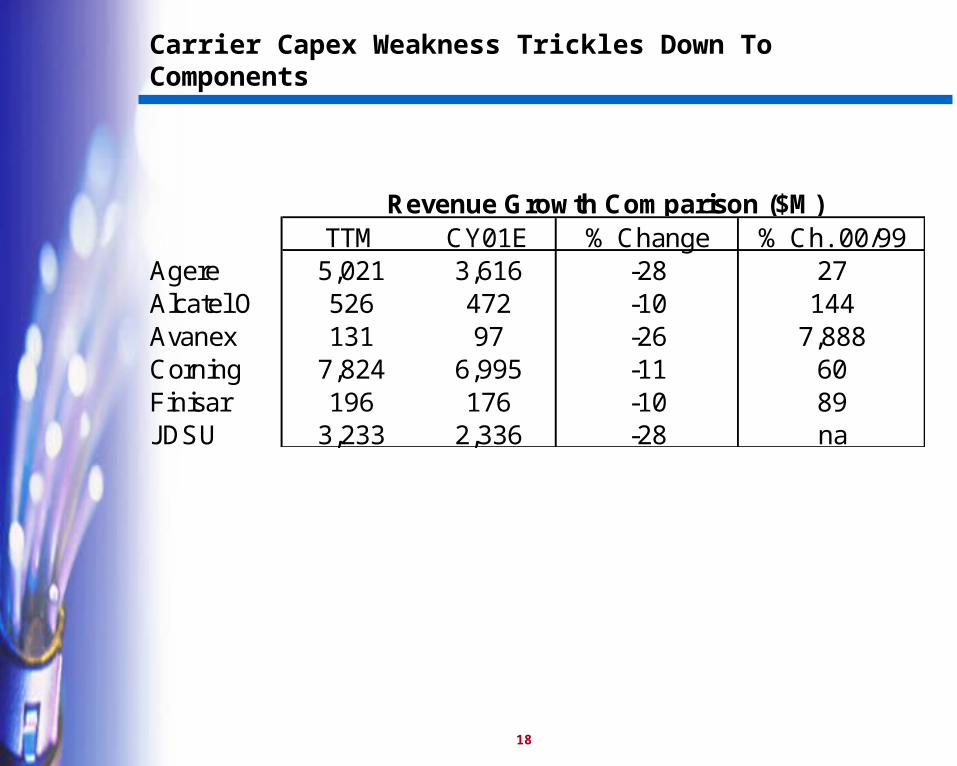
Carrier Capex Weakness Trickles Down To Components
TTM CY01E % Change % Ch. 00/99Agere 5,021 3,616 -28 27Alcatel O 526 472 -10 144Avanex 131 97 -26 7,888Corning 7,824 6,995 -11 60Finisar 196 176 -10 89JDSU 3,233 2,336 -28 na
Revenue Growth Comparison ($M)

19
Optical Equipment Stocks Have Been Hammered in 2001
Since January 2001:
JPM Equipment Index down 60%. (Includes all major telecom equipment suppliers.)
JPM Component Index down 55%. (Includes all major telecom optical and electronic component suppliers.)
Nasdaq off 25%

20
Everyone Is Unhappy
Carriers – Service spending by enterprise customers in a slump.
System OEMs – Carrier demand is slow.
Components Suppliers – OEM customers are sick.
Investment Banks – No equity market for IPOs. Little equity power for M&A, and everyone hoarding cash.
VCs – Where are the exits?

21
Looking Forward

22
The Bad And The Good
The Bad:– Aggregate carrier spending could be flat to down for next 1-4 years, due to recent
capex/revenue imbalance– Aggregate long-haul spending will be flat to down given over-investment and capacity glut – No catalyst (killer application or economic recovery) on near term horizon to re-accelerate
spending
The Good:– Optical networking helps improve the capex/revenue imbalance– Carriers’ restrained spending will favor optical networking equipment– No capacity glut in access or metro– Inventory overhang should dissipate by mid-02– Long-term outlook remains unchanged: unyielding bandwidth expansion and shifting traffic
dynamics will force the adoption of an optical networking model– Installed base of optical systems at early stage of technology maturity curve
23
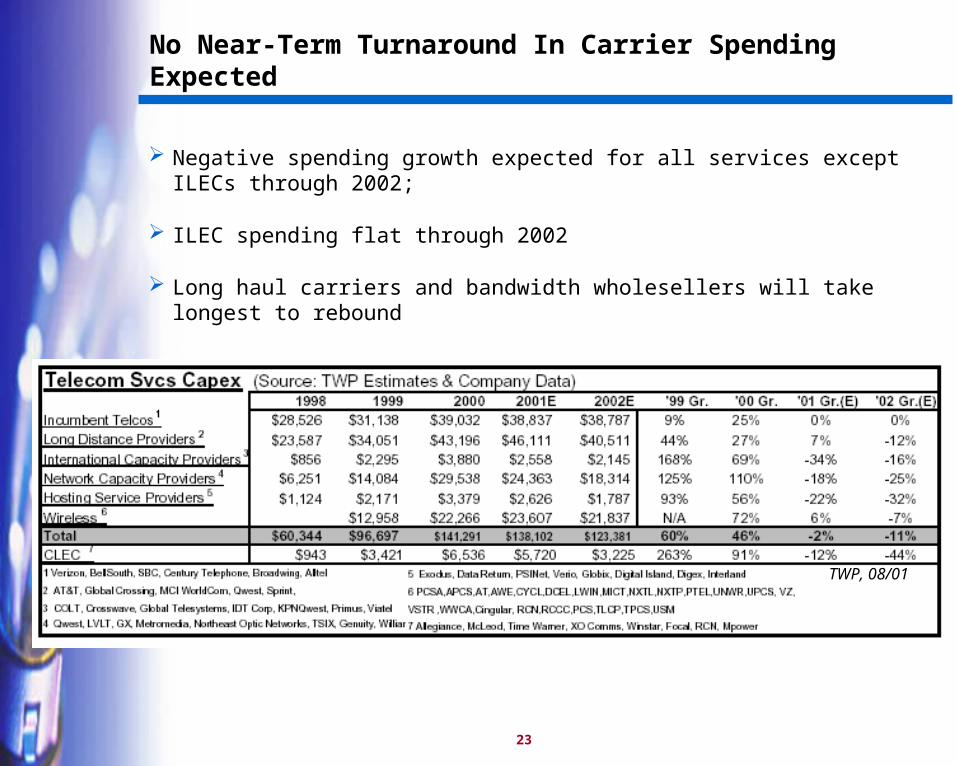
No Near-Term Turnaround In Carrier Spending Expected
Negative spending growth expected for all services except ILECs through 2002;
ILEC spending flat through 2002
Long haul carriers and bandwidth wholesellers will take longest to rebound
TWP, 08/01

24
Carriers Will Work Capex/Sales Ratios Down To Previous Levels

25
No Catalyst On Near Term Horizon To Re-accelerate Spending
Internet traffic volumes still double annually, but growth down by more than 40% from 2000.
Video-on-demand too expensive
Interactive gaming too slow, too expensive
DSL, cable modem deployment growth plodding
Bundled services and distributed storage the next killer apps??

26
Gauging The Timing Of A Recovery
2001 2002 2003 2004
Enterprise, Residence
Service Providers
Equipment Vendors
Component Vendors
Global market demand recovers: manufacturing, servicesCorporate profits improveCorporate hiring improves/stabilizesInterest rates remain lowCapex spending rebounds
Enterprise spending recoversNew differentiated services emergeRevenue/Capex ratio stabilizes. ROI improvesCapital markets open upRegulation eases
Carrier’s financial health improvesMetro bottleneck inhibits carrier revenue growthCapacity glut in long haul begins to dissipateNext gen solutions are rolled out, selectedCarriers re-initiate spending programs
System OEM’s health improvesInventory overhang dissipates – weak impactDemand for next gen components increases - strong impactIncreased integration strengthens margins
Sept 01
Rebound in components market could be more
than 2 year out.

27
The Good: Optical Networking Helps Improve the Capex/Revenue Imbalance …
Lowers the hardware cost/bit by 50% or more over legacy SONET gear, which represented 80% of transmission equipment spending in 2000 (CIBC, 7/01).
Provides a scalable platform - pay as you go – that lowers first installed cost.
Promises to lower operating costs by simplifying provisioning and maintenance
CIBC 7/01

28
… While Future-Proofing The Network
Scales in step with growing capacity needs
Transparent, so accommodates any transmission format and service type, including wavelength services
Reduces need for overlay networks

29
Carrier Spending Is Slowing, But The Distribution Will Slant Towards Optical Networking
Global Capex Spending
Annual Growth Rates
2000 2001
Total
Optical
$306B
$370B
$47B $64B
Total Capex Optical Capex
21%
36%
RHK, 2/01

30
Top Down Forecast Suggests Long-Term Market Growth Remains Robust …
CSFB, 09/01
With these updated numbers, redo chart on next slide. 9-17-01

31
… Even By More Conservative Forecasting Assumptions
Service growth held flat through 2004
Capex held to 19-20% of revenue through 2006, not 23%
Optics percent of total capex held to 30% by 2006, not 35%
Top Down Forecast of Optical Networking Markets ($B)
0
10
20
30
40
50
60
70
2000 2001 2002 2003 2004 2005 2006
Sys
tem
s M
arke
t
0
2
4
6
8
10
12
14
16
Co
mp
on
ents
Mar
ket
Systems
Components

32
Optical Networking Still In Its Infancy
Optical Networking Still In Its Early YearsOptical Networking Still In Its Early Years
1950 1960 1970 1980 1990 2000Semiconductors
IBM 1400 Computer
Apple I Computer
Intel 4004Intel 286
MS Windows
Netscape Navigator
Optical components 1990 2000 2010 2020 2030 2040
Ciena MW 1600

33
Venture Investors Continue To See Strong Potential In Optical Networking
1998 1999 2000 2001 YTD
Number of Investments 22 39 110 73
Aggregate Value of Investments ($M) $138 $479 $2,626 $1,907
Median Size of Investment ($M) $5 $12 $19 $13
Aggregate Value of Venture Investments
Broadview, 8/01

34
Identifying The Pain

35
To Lower Costs, Carriers Need To Simplify Their Networks
Existing networks are expensive:
To design: multiple protocols to support: ATM, IP, TDMTo provision: multiple layers to interface and manageTo maintain: large footprint and high box countTo operate: Each O/E/O interface and box interconnect provides a failure point
Transparent networks should be less expensive:
To design: single protocol – wavelengthsTo provision: single physical layerTo maintain – low box countTo operate - no O/E/O conversions
Shift To Transparency
What Is Needed?True optical switching devicesAdaptive, intelligent solutionsModular, scalable systemsManageable optical architecturesLow cost, high-volume, automated manufacturing

36
The Impact Of Network Simplification On Hardware Cost
Network Element Legacy SONET/WDM
System
Next-Gen SONET/WDM
System
Opaque Optical Networking System
DCSONSOC-192 terminalsWDM terminalsNG DCS/ADMsSpacePower
150
1,92030
03,930 sq ft
8.0 MW
000
30960
505 sq ft1.5 MW
015
030
0105 sq ft150 kW
Total Initial Cost $300m $160m $90m
Typical vendors Alcatel, Fujitsu, Nortel, Lucent, NEC
Ciena/Cyras, Cisco/Cerent, White Rock
Ciena, Sycamore, Tellium, Brightlink
JP Morgan, 5/01
Consider a theoretical LH core network with 15 nodes, populated with 64-channel DWDM systems; each channel at OC-192.
37
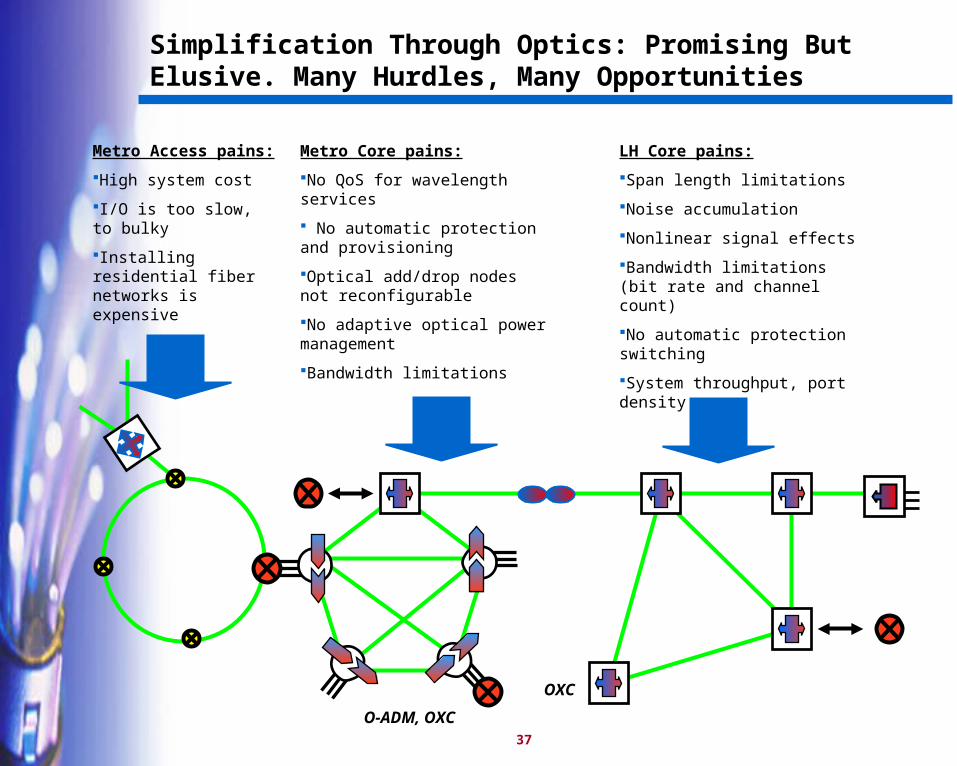
Simplification Through Optics: Promising But Elusive. Many Hurdles, Many Opportunities
O-ADM, OXC
OXC
LH Core pains:
Span length limitations
Noise accumulation
Nonlinear signal effects
Bandwidth limitations (bit rate and channel count)
No automatic protection switching
System throughput, port density
Metro Core pains:
No QoS for wavelength services
No automatic protection and provisioning
Optical add/drop nodes not reconfigurable
No adaptive optical power management
Bandwidth limitations
Metro Access pains:
High system cost
I/O is too slow, to bulky
Installing residential fiber networks is expensive

38
Points Of Pain – The Transition To Optics In Long Haul
Where it hurts The prescription Complication
Span limitations(600 km)
Next generation amplifiers, involving higher powers and distributed amplification. Higher sensitivity receivers. New modulation formats.
Specialty fiber and pump laser technologies immature. High-sensitivity receivers expensive.
Channel limitations(80 channels)
Tighter channel spacing and wide band accessibility
Filter technology slow to improve and wider band amplifiers immature
Noise accumulation Adaptive dispersion compensation Adaptive algorithms slow, devices expensive, large, and lossy
Optical power management is not adaptive
Dynamic gain equalization and management
Adaptive algorithms slow, devices expensive, large, lossy, requiring muxing/remuxing
Non-linear signal interaction
Solutions supporting lower peak and average transmission signal power
Specialty fiber and pump laser technologies immature
Bit rate limitations(10 Gb/s)
Higher speed transceivers High speed optics and driver chips immature, as are alternative modulation solutions
No automatic protection switching
High-speed optical performance monitoring, network management, and optical switching
Commercial solutions for OPM not available. Optical switches remain large and expensive.
Channel blocking due to assignment conflicts
Tunable lasers and all-optical wavelength converters
Low yields, low power, limited tuning range, expensive
System throughput, port density
Transparent optical switching systems and components
Switching engines are tough to manufacture, qualify

39
Points Of Pain – The Transition To Optics In Metro Core And Access
Where it hurts The prescription Complication
No QoS for lambda services High-speed optical performance monitoring
Commercial solutions for OPM not available. Optical switches remain large and expensive.
No automatic protection switching
OPM, plus integrated network management
Commercial solutions not available
Add/drop nodes are not reconfigurable
Low cost wavelength selective switches and tunable filters. Tunable lasers.
Technologies are immature: lossy, power hungry, expensive, low yield, unreliable
Optical power management is not adaptive
Dynamic gain equalization and management
Adaptive algorithms slow, devices expensive, large, lossy, requiring muxing/remuxing
Optical multiplexing is expensive
Lower cost filter assemblies The filters are cheap, the assembly is expensive
Transmitters/receivers are too expensive, too bulky
Tunable lasers and low cost, hot swappable transmitters
Price points are difficult to hit, based on low yields for tunables
Cost/bit of high reliability circuit-based solutions remains expensive for access
Migrate to LAN-originated protocols like Ethernet
Reliability of packet solutions is not carrier class

40
Relieving The Pain

41
Pain Relief
Network Needs Technology Responses
Next generation amplifiers, including higher power amps, lower-cost amplets, wider band amplifying, and distributed amplification
Higher power EDFAsHigher power pump lasers
Lower power EDFA ampletsSOAs
Raman amplifiers and lasersOptical pulse reshaping and retiming
Dynamic gain equalization and management
Dynamic gain equalizersAmplifier arrays
High sensitivity receivers APDs
Enhanced modulation formats Soliton & other ULH solutionsO-TDM solutions
Multilevel transmission solutions
Tighter channel spacing 25-50 GHz WDM filters
Adaptive dispersion compensation Adaptive dispersion compensators (chromatic and PMD)
Higher speed transceivers 40 Gb/s modulators40 Gb/s transceivers
High-speed optical performance monitoring, network management
Optical performance monitoringnetwork management
Tunable lasers and all-optical wavelength converters
Long reach tunable lasersoptical wavelength converters

42
Pain Relief (cont.)
Network Needs Technology Responses
Optical switching systems Optical cross-connect systemsOptical add/drop systems
High-speed, high finesse optical performance monitoring
Optical performance monitoring
Optical switches and tunable filters
MEMs, FBGs, bubble, liquid crystal, EO and TO devices, SOAs, other
technologies
Lower cost filter assemblies CWDM/TFF, AWGs, bulk gratings
Tunable lasers and low cost, hot swappable transmitters
Shorter reach tunable lasersShort and long wavelength VCSELs
SR and VSR transceivers, transponders
43
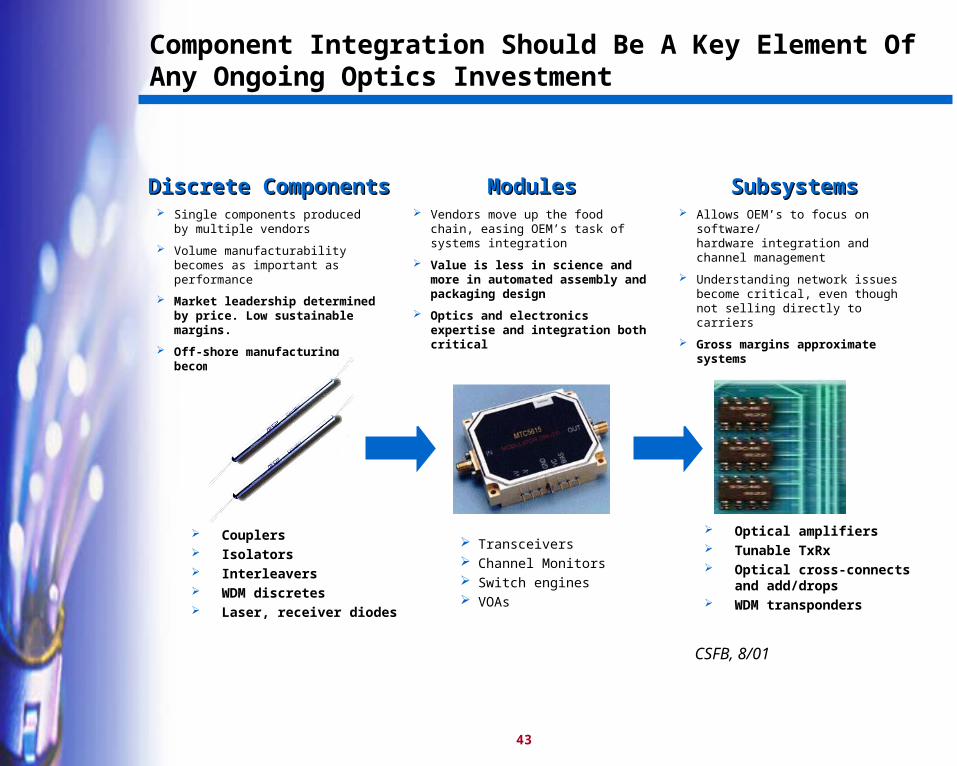
Component Integration Should Be A Key Element Of Any Ongoing Optics Investment
Discrete ComponentsDiscrete Components ModulesModules SubsystemsSubsystems
Transceivers Channel Monitors Switch engines VOAs
Single components produced by multiple vendors
Volume manufacturability becomes as important as performance
Market leadership determined by price. Low sustainable margins.
Off-shore manufacturing becomes norm
Vendors move up the food chain, easing OEM’s task of systems integration
Value is less in science and more in automated assembly and packaging design
Optics and electronics expertise and integration both critical
Allows OEM’s to focus on software/hardware integration and channel management
Understanding network issues become critical, even though not selling directly to carriers
Gross margins approximate systems
Optical amplifiers Tunable TxRx Optical cross-connects
and add/drops WDM transponders
Couplers Isolators Interleavers WDM discretes Laser, receiver diodes
CSFB, 8/01

44
The Impact Of Market Timing On Investment Decisions
Carriers slow spending
Work through inventory
Focus on risk aversion
Little appetite for new gen systems
Little demand for new gen components
Carriers spending re-bounds
Inventory of older gen equipment has been exhausted
New gen solutions will enable dramatic boost to network performance, drop in cost/bit
Opportunity for novel new component technologies. Incremental upgrades to older technologies won’t keep up.
2000 2001 2002 2003 2004 2005 2006
Systems
Components
Market dominated by:
static systems
discrete components
Market dominated by:
Dynamic, automated systems
Integrated, tunable components
Winter of Despair Spring of Hope

45
Investment Conclusions
Invest selectively now for the Spring of Hope
Focus on early stage companies that provide new approaches to network optimization:– Low cost– Integration– Tunable, adaptive– Automated operation– High bandwidth– Transparency
Avoid later-stage companies that provide incremental improvements to older generation equipment. If budget assumes substantial ramp in 2002, 2003 revenue, be wary.– Give little weight to OEM penetration, given the uncertainty of equipment markets and
players
Survive the Winter of Despair– See funding well into 2003– Keep burn low– Avoid high capitalization companies that are vulnerable to extended Winter


