99
1 Investor day 23 June 2011

1
Investor day
23 June 2011
22
Michael Queen
2
Introduction and model for returns

3
Agenda
09:30 Introduction and model for returns Michael Queen
09:45 Update on Private Equity strategy Alan Giddins
10:00 Private Equity – case study (Hyva) Alan Giddins
10:15 Private Equity – case study (SMT) Alan Giddins
10:30 Private Equity – case study (Refresco) Guy Zarzavatdjian
10:45 Break
11:00 Debt Management – the business and opportunity Jeremy Ghose
11:30 Infrastructure model and portfolio Cressida Hogg
12:00 3i Asia and the Americas Robert Stefanowski
12:30 Closing remarks Michael Queen
Lunch
4
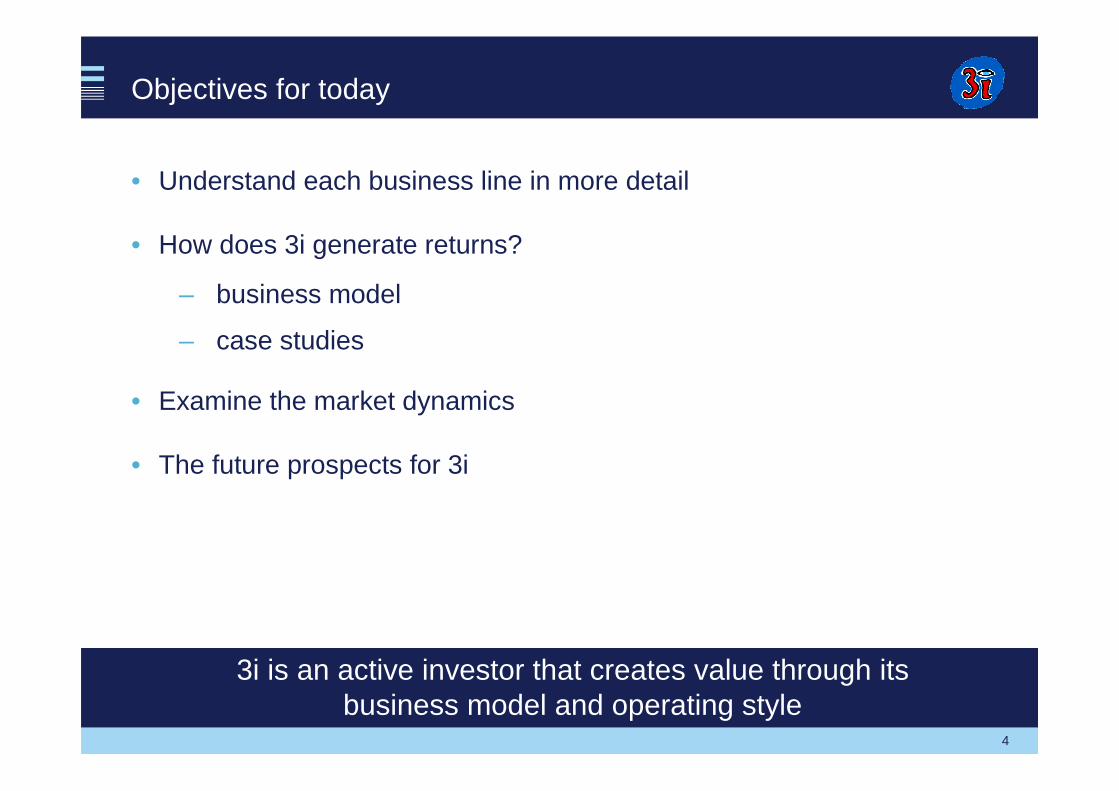
Objectives for today
• Understand each business line in more detail
• How does 3i generate returns?
– business model
– case studies
• Examine the market dynamics
• The future prospects for 3i
3i is an active investor that creates value through its business model and operating style

5
AUM £12.7bn
3i today
3i Group
AUM £3.4bn
Debt Management
Management of funds which invest in senior and mezzanine corporate debt in a wide range of typically large and private companies in Europe
8 managed funds
Infrastructure
Investing primarily in utilities, transportation and social infrastructure in Europe, India and North America
AUM £1.6bn
17 portfolio companies
AUM £2.4bn
52 portfolio companies
AUM £5.2bn
47 portfolio companies
Investing in buyouts with an enterprise value up to €1 billion in Europe and Asia
Minority investing in high-growth businesses with an enterprise value of up to €1 billion in Europe, Asia and the Americas
Private EquityGrowth CapitalBuyouts

6
AUM – by business
3i External funds 3i External funds
3i External funds 3i External funds
3i External funds 3i External funds
Currentposition
Currentposition
Currentposition
Future
Future
Future
Private equity
Debt Management
Infrastructure

7
Model for returns
Private Equity Infrastructure Debt Management
Gross return objectives
Fee income as a share of returns
Reduced volatility
20% 10%
15% 15%15%
12%
Net return objectives

888
Alan Giddins
Update on Private Equity strategy
9
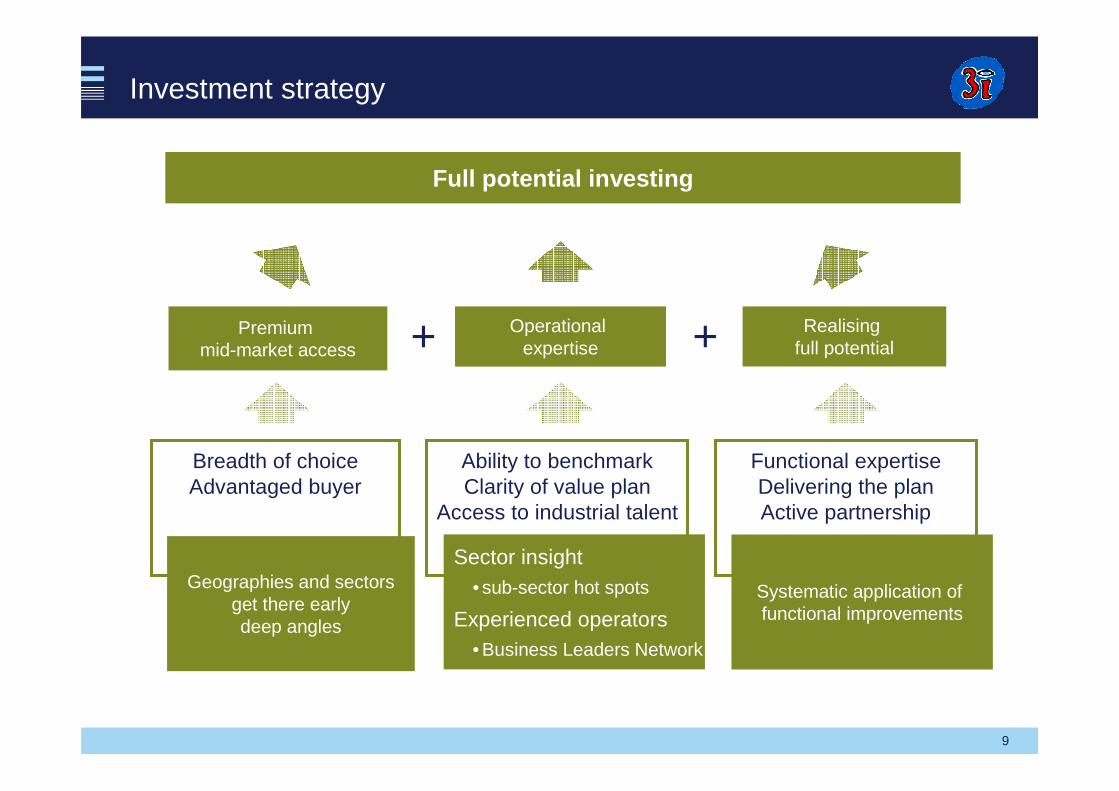
Investment strategy
Breadth of choiceAdvantaged buyer
Ability to benchmarkClarity of value plan
Access to industrial talent
Functional expertiseDelivering the planActive partnership
Full potential investing
Premium mid-market access +Operational
expertise + Realising full potential+
Geographies and sectorsget there earlydeep angles
Sector insight• sub-sector hot spots
Experienced operators• Business Leaders Network
Systematic application of functional improvements
10
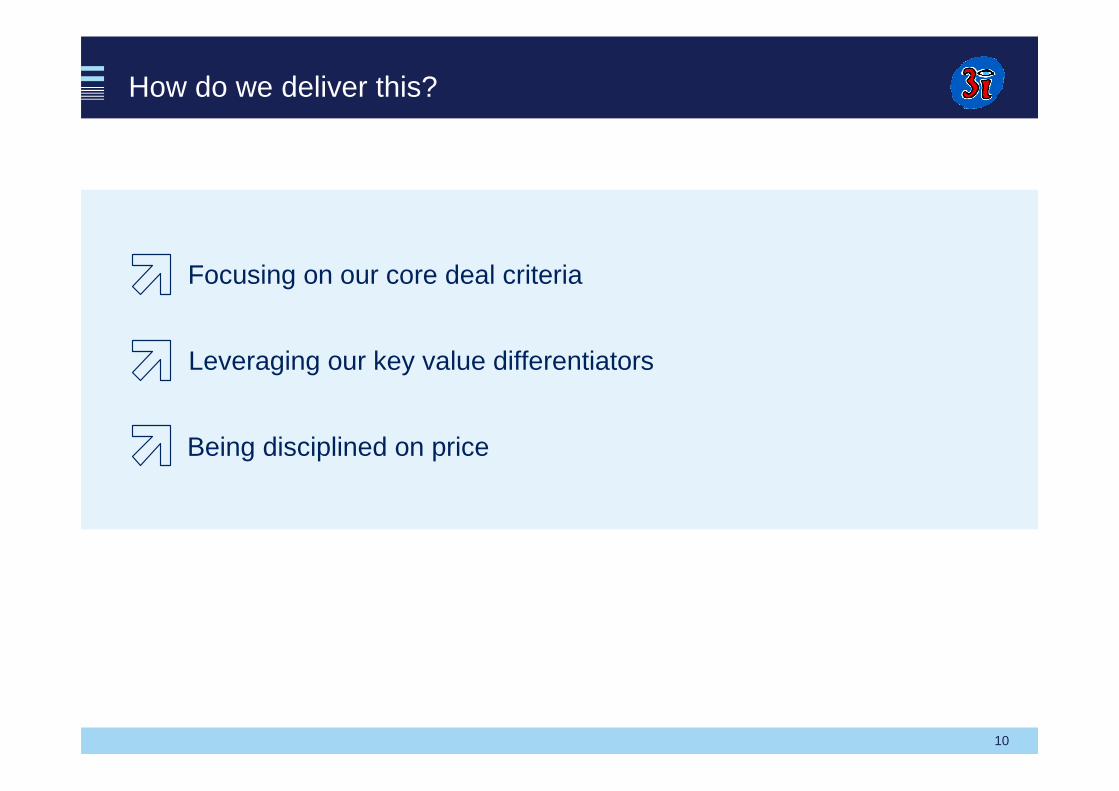
How do we deliver this?
Focusing on our core deal criteria
Leveraging our key value differentiators
Being disciplined on price

11
Core deal criteria
Deals with an EV of €100m - €500m
• Sub-sectors structurally driven by growth themes
• Operational improvement opportunity
• Buy and Build platform
• International business or with potential to expand internationally
• Robust end market which will weather current uncertainties
• Key people differentiator
Our competitive advantage
12
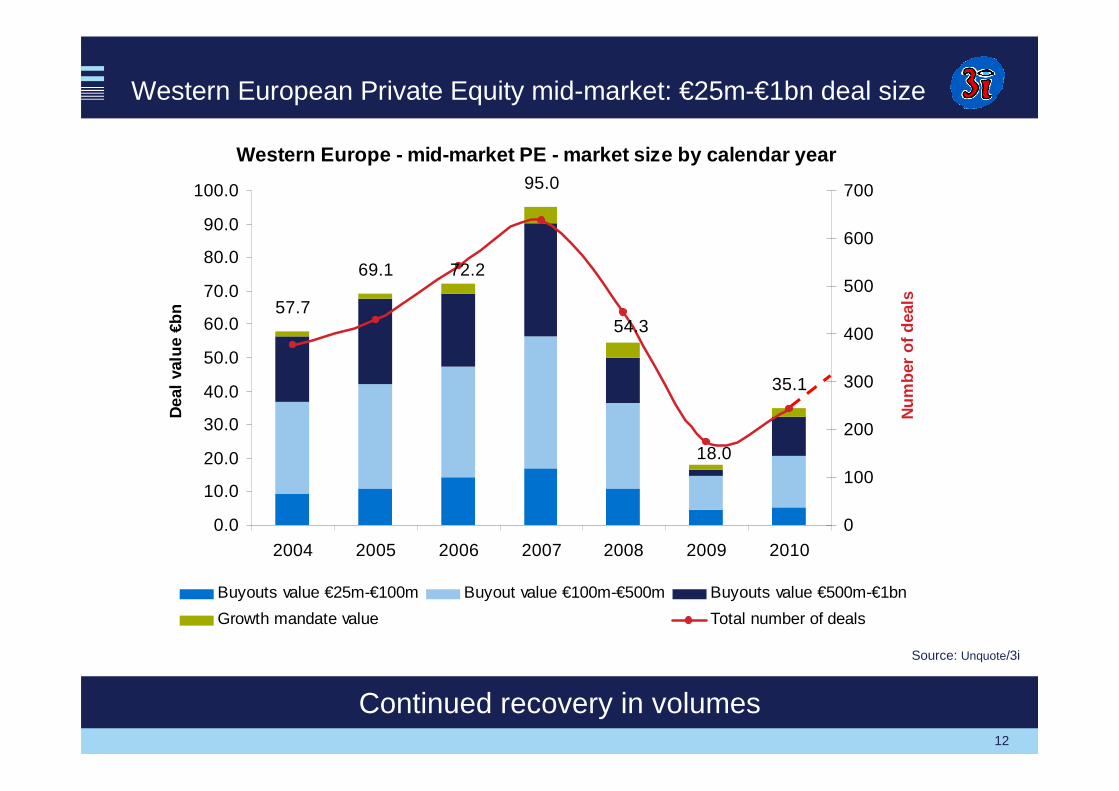
Western Europe - mid-market PE - market size by cal endar year
57.7
69.1
95.0
72.2
54.3
35.1
18.0
0.0
10.0
20.0
30.0
40.0
50.0
60.0
70.0
80.0
90.0
100.0
2004 2005 2006 2007 2008 2009 2010
Dea
l val
ue €
bn
0
100
200
300
400
500
600
700
Num
ber
of d
eals
Buyouts value €25m-€100m Buyout value €100m-€500m Buyouts value €500m-€1bn
Growth mandate value Total number of deals
Western European Private Equity mid-market: €25m-€1bn deal size
Source: Unquote/3i
Continued recovery in volumes

13
155
176
215
264
182
76
122
0
5
10
15
20
25
30
35
40
45
50
2004 2005 2006 2007 2008 2009 2010
Dea
l val
ue €
bn
0
50
100
150
200
250
300
Num
ber
of d
eals
Core target market deal value €m Core target market number of deal
Our target market: €100m - €500m Buyouts and European Growth Capital opportunities*
Source: Unquote/3i* Growth Capital opportunities with a target equity investment between €25m - €125m
We see a future market of 150+ deals in our target space

14
Sector/geographic focus
Consumer
Healthcare
TMT
General Industrial
Business Services
Spain Italy UK Nordic France Germany Benelux
15
Leveraging our key differentiators
Key elements of value add
Global network
Sector expertise
Active partnership
Business Leaders Network
Banking team
16
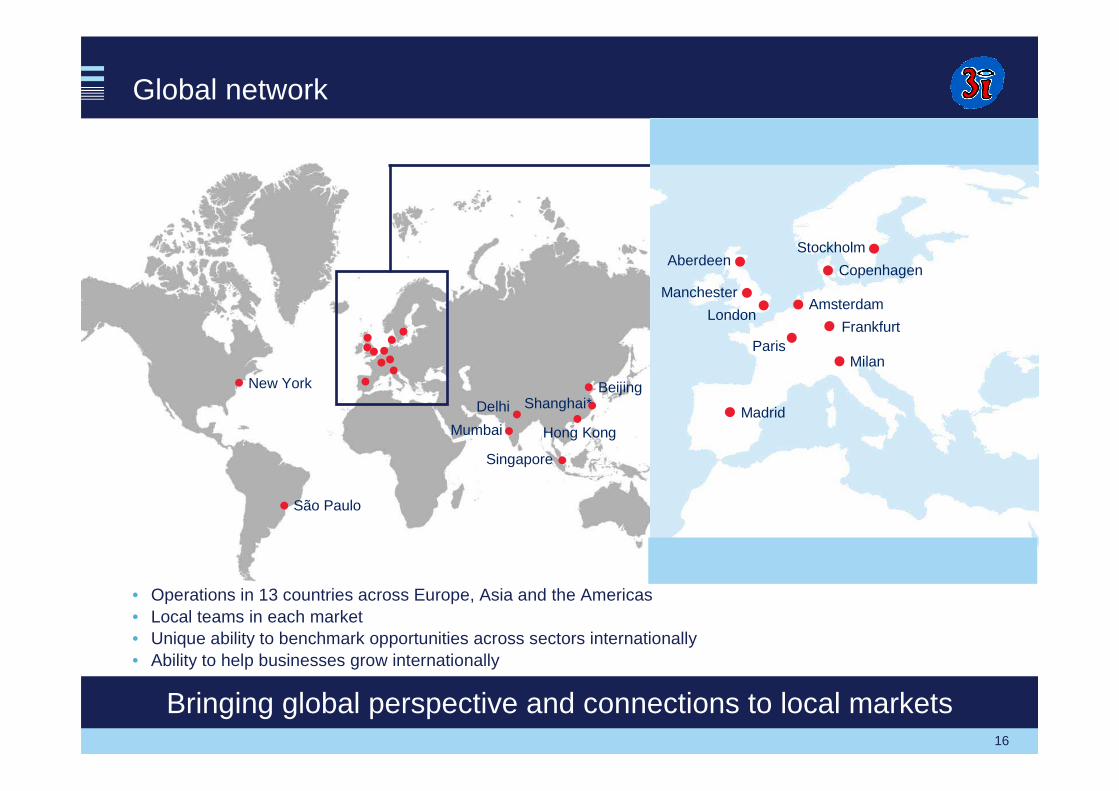
Global network
• Operations in 13 countries across Europe, Asia and the Americas• Local teams in each market• Unique ability to benchmark opportunities across sectors internationally• Ability to help businesses grow internationally
London
Manchester
AberdeenStockholm
Copenhagen
Amsterdam
Frankfurt
Milan
Madrid
Paris
Mumbai
Beijing
Singapore
São Paulo
New York
Delhi Shanghai*
Hong Kong
Bringing global perspective and connections to local markets

17
Services
Product
Sector expertise
Point in the cycle
General Industrial
Automotive TIC
MedTech
Care Services
White collar
Healthcare
Surgical Interventional Instruments
Delivery of Care Services
Diagnostics Instruments
Business Services
Testing, Inspection, Certification
Regulatory compliance
Specialist components
Energy efficient
Demonstrating the benefit of sub-sector insight

18
Active partnership
• Systematic approach to best-in-class capabilities– making companies the best that they can be– driving change and EBITDA improvement– focused on how a business delivers its core functions
• Various governance techniques– SteerCo– PMOs (light and full blown)– Change offices
• Examples
Driving value

19
Business Leaders Network
Chairman: Michel Bleitrach
NXD: Patrick L’Hostis
Chairman: Pete Regan, NXD: Ad Verkuyten
Chairman: Peter Linzbach, NXD: Anders Moberg
Chairman: Peter Chambre
Craig Stinson, Peter Grosch
Chairman: Colin Holmes
Key people differentiator

20
Banking team
• Proactive interaction across the portfolio taking advantage of improving debt markets
– Labco (Jan 2010)/Refresco (May 2011): capitalising on high yield bond markets. Achieved extended maturities, flexible covenants, reduced overall cost and created additional capacity for acquisitions
– Hobbs (April 2011): refinancing of existing debt on quasi-corporate terms
– Xellia (May 2011): achieved 4.5 year covenant reset
– Memora (May 2011): refinanced senior and mezzanine debt with all senior and achieved debt funded acquisition of further stake in SFB
• Ensuring recent financings are on market leading terms
– Amor: competitive pricing for a retail exposed business
– SMT: competitive terms, eg EBITDA equity cures and acquisition flexibility
– OneMed: all senior structure in upper quartiles for distribution-linked business
– Go Outdoors : 3 year debt facility to support store roll-out plans
Making a difference
21
Disciplined on pricing – last eight deals
Average entry multiple of 8.9x EBITDA
Double digit earnings growth budgeted for 2011
On average 5% plus outperformance YTD

22
Conclusion
Relationship with management
Differential knowledge+
International businesses
Active partnership potential
Robust markets
Growth themes
Buy and Build
Knowledge and insight
Consistency DisciplineFocus

232323
Alan Giddins
Private Equity case study – Hyva

24
Case study – Hyva
Return statistics:
• €300m proceeds
• MM: 10x
• IRR: 41%

25
Hydraulic solutions for commercial vehicles
– Stable, cash generative European base with attractive growth in BRIC economies
– But: incomplete management team with founder/CEO retiring
Products
EV €118m buyout completed in 2004
– Sales €146m
– EBITDA margin of 11%
– Western Europe accounts for 78% of sales
Starting point
Hydraulic cylinders
Hydraulic cranes Other
Geographic split
Western Europe 78%
Asia8%
CEE7%
Americas3%
Other4%

26
Accelerated performance during 3i ownership
“Pioneering” “Inter-nationalisation”
“Globalisation” “Crisis” “Recovery”
Sales 1983€18m
Sales 1992€56m
Sales 1999€91m
Sales 2001€129m
Sales 2004€171m
Sales 2006€255m
Sales 2008€448m
Sales 2009€312m
Sales 1996€64m
1979
• Foundation of the company
CAGR ‘2001-08: +19.5%
New economies
Other markets
2009-2010
• Continued strong growth in China
• India and Brazil back to growth in second half 2009
• Restructuring Europe
2010-2012
• Strong growth in all markets except Greater Europe (potential recovery in this region leaving further upside for growth)
• Greater Europe well positioned –post restructuring of the operations base – when markets potentially recover
Hyva accelerated its development to a true global leader under 3i ownership

27
Asia as key growth driver
Yangzhou, China, 2004
Mumbai, India, 2006
Jamshedpur, India, 2007/08
Bangalore, India, 2007/08
Second plant, 2008
New production sites under 3i ownership
18%
8%
63%
7%5%
10%
78%
3%4% 2%
2003 2010
Western Europe Asia Pacif ic Eastern Europe
Americas Other Africa
Accelerated expansion into China and India Making Asia the largest contributor to Hyva
Third plant, 2011Pune, India, 2011
• Accelerated development into Asia with seven new production facilities across the region
• Clear market leader in front-end cylinders in China (42% market share) and India (90% market share)
• Asia now represents 63% of sales for Hyva
• Investments in emerging markets helped the company accelerate out of the recession

28
Change management
- New CEO, CFO and COO
- New NXC
- Upgraded second line management
Organic and acquisitive growth
- 8 new factories in BRIC economies
- Acquisition of Amco Veba
- Acquisition of Tecnomet
Active partnership
- Working capital project
- Cost out
Profitability enhancement
146171
195
255
444 448
312
486
0
100
200
300
400
500
600
2003 2004 2005 2006 2007 2008 2009 2010
0
10
20
30
40
50
60
70
80
Revenue EBITDA
Tripled sales and quadrupled EBITDA
Revenue €m EBITDA €m

29
Topline: tripled
EBITDA: quadrupled
10x MM on initial investment
Successful €525m exit
-Exit to consortium led by Unitas Capital
-Delivering 10x return on our initial investment
-Sales €486m
-EBITDA of €65m
Results

303030
Alan GiddinsCharles Noall, CEO
Private Equity case study - SMT

31
• Identified in 2006 as core sub-sector within Business Services
– regulation– globalisation– trend to outsourcing– health and safety– sector fragmentation
• Appointed Ad Verkuyten (ex-CEO, RTD) as a senior adviser in 2006
Background to testing and inspection
32
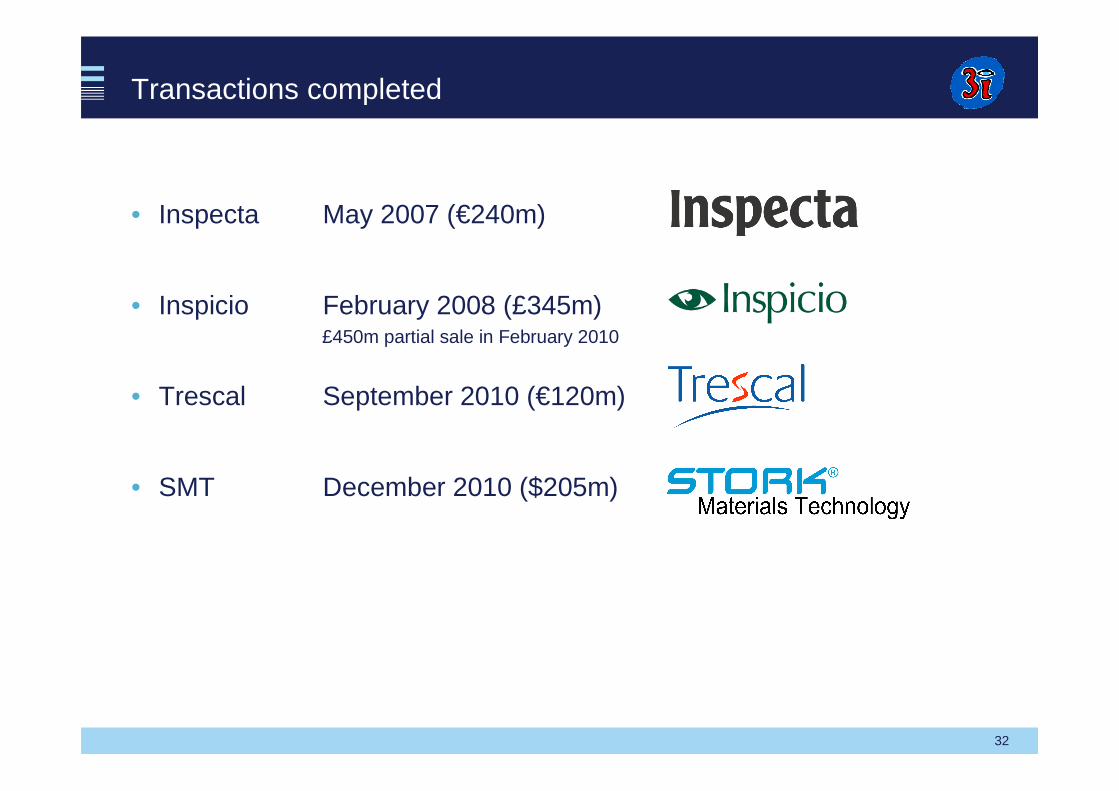
Transactions completed
• Inspecta May 2007 (€240m)
• Inspicio February 2008 (£345m)
• Trescal September 2010 (€120m)
• SMT December 2010 ($205m)
£450m partial sale in February 2010

33
Why is SMT a 3i deal?
3i deal criteria SMT
• Primary buyout
• Targeted sub sector
• Attractive end market verticals
• Operational improvement potential
• International business
• Fragmented market place
�
�
�
�
�
�

34
Business overview
• Broad portfolio of destructive and non-destructive testing
• Differentiated through its focus on providing technically advanced, value-added testing
• Leading positions within highly accredited and attractive end markets
• Benefits from high barriers to entry
• Highly scalable, well invested network with ERP system implementation
• Operational excellence founded upon quality, delivery and client service

35
Operational footprint
London
New York
Minneapolis
Houston
Chicago
Manchester
Glasgow
AmsterdamBerlin
Los Angeles
Paris
Primary end market exposure: � Aerospace and Defence� Oil and Gas� General Engineering� Automotive
12
3
1
2
1
23
4
5
6
7
West Coast – Aerospace and defence� Huntington Beach (SMT&I)� Rancho Dominguez (SMT&I)1
2
East Coast – Aerospace and defence/Power generation� Charlotte (Herron)� Jupiter (EWT)� Newtown (MMA)
1
2
3
Mid West – General Engineering/Automotive� Cleveland (Herron)� Milwaukee (Cellramic)� New Berlin (Technimet)� St. Paul (STCT)
� Des Moines (STCT)� Wausau (STCT)� Wixom (CRS)
1
2
34
5
6
7
1
23
45
6
8
7
1
1
1
Houston – Oil & gas� Houston (STMC)1
Benelux� Hengelo (Intermes BV)� Antwerp (Intermes NV)� Breda (Schielab)� Amsterdam (FDO Inoteq)� Hengelo (FDO Inoteq)� Sittard (Schielab)� Rotterdam (Schielab)� Veendam (Schielab)UK� Aberdeen (MEL)� Sheffield (STL)Germany� Herne
(MTT Werkstofflabor)France� Dunkerque
(Intermes SAS)1
1
1
2
3
4
5
6
7
8
2
1
2
1
Europe – General engineering/oil & gas

36
Test
Destructive testing Testing of industrial materials (eg metals, polymers) for properties including tensile strength, fatigue, hardness, chemical composition, material composition, density and corrosiveness
Non-destructive testing Laboratory and on site testing and inspection of material characteristics of cast, forged or welded products
Product evaluation and qualification testing
Qualification testing of products and systems against industry standards and OEM requirements (eg test performance and endurance in a variety of operating conditions and environments)
Failure analysis and consulting
Investigating root cause and failure mechanisms of industrial and commercial products failing during end use
Calibration Verifying the accuracy of clients’ instrumentation as well as providing measurement of physical quantities and related consultancy
Service offering
Service offering
37
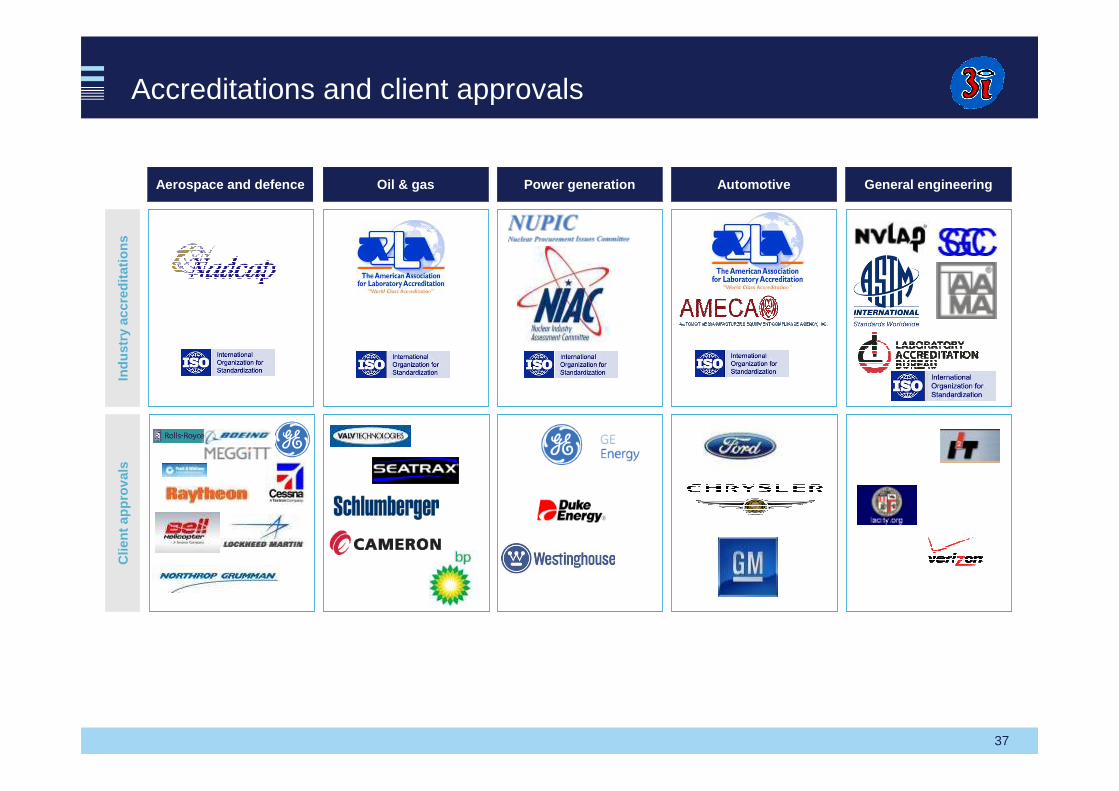
Aerospace and defence Oil & gas Power generation Automotive General engineering
Accreditations and client approvalsIn
dust
ry a
ccre
dita
tions
Clie
nt a
ppro
vals
38
Operational excellence
Excellence in quality and delivery• Investment in information systems (ERP, LIMS, StorkView)
– manages order intake and workflows
– processes test results and generates certificates
– instant client feedback through StorkView portal
• Investment in EMPOWER re-engineering work processes and laboratory configuration to maximise throughput
• Quality and delivery performance metrics are evaluated with operational staff on a daily basis through daily SQDC and production meetings
Core KPIs
• On time delivery
• Right first time
• Lead times
• Late span

39
Financial performance
• Strong 2010 outturn – EBITDA 18% up on budget, reflecting market recovery in second half of the year
• Re-forecast undertaken in February 2011, resulting in a budget revised upward by 11% to $24.0m EBITDA
• Strong YTD 2011 trading with several locations reaching all time record levels in revenue and EBITDA
• Strong operational cash flow
8.2 8.6 8.8
1.6
1.82.1
7.07.58.08.59.09.5
10.010.511.011.5
2010 OP2011 2011 YTD May
EBITDACosts
Monthly average split in EBITDA and costs
40
Strategy: become the preferred global partner by 2014
• SMT’s premium brand recognised as highest quality testing and metallurgical expertise
• Outstanding customer service and relationship management
• Focus on four core industries – Aerospace and Defence, Oil and Gas, Power Generation and Transport
• Position the company as the preferred partner for the top customers in each core industry
• Invest to strengthen its unique set of knowledge-based capabilities
414141
Guy Zarzavatdjian
Private Equity case study - Refresco

42
• Company description
– Europe’s leading private label (“PL”) soft drinks manufacturer and contract manufacturer for A-Brand
– Products range from juices and waters to CSDs and iced/RTD tea
– Proven Buy & Build platform
– 26 plants in nine countries
CAGR = 16%
CAGR = 20%
Company snapshot
Strong financial performance (m)
• Investment
– Completed March 2010
– €84m investment, 20% stake
– Investment used to fund growth
0
200
400
600
800
1,000
1,200
1,400
2000
2001
2002
2003
2004
2005
2006
2007
2008
2009
2010
0
20
40
60
80
100
120
140
Sales
EBITDA
Sales €m EBITDA €m
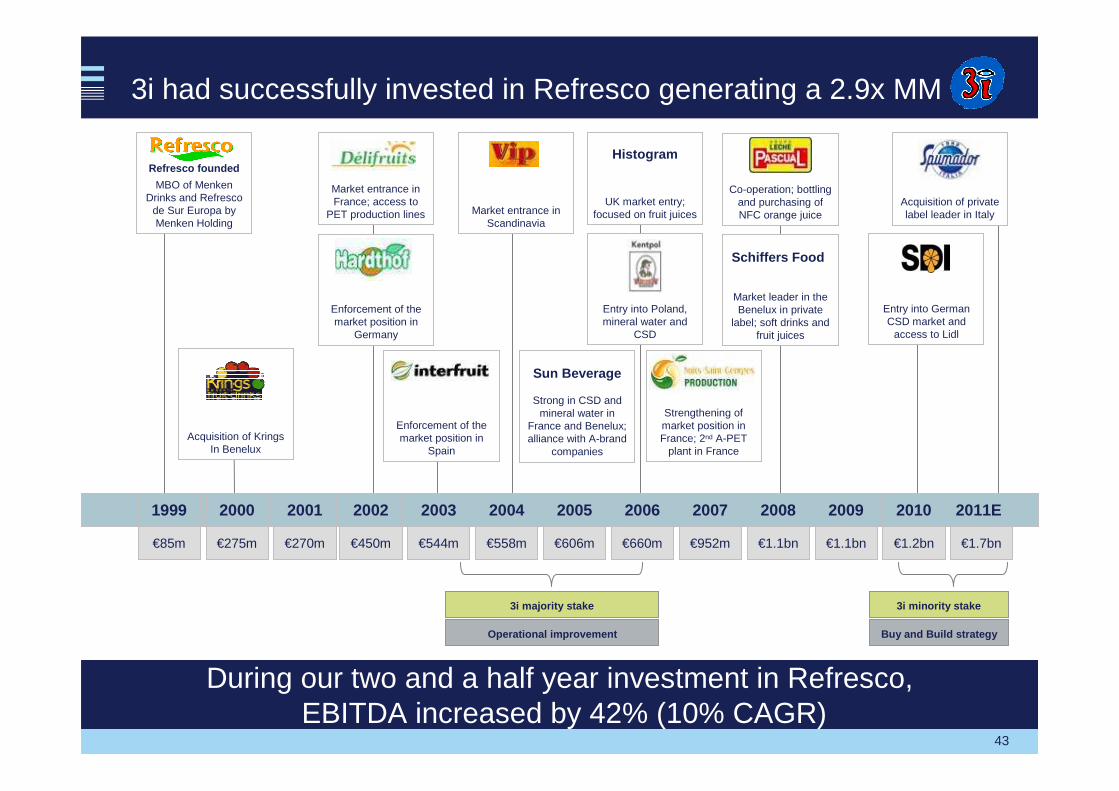
43
3i had successfully invested in Refresco generating a 2.9x MM
Enforcement of the market position in
Germany
Market entrance in France; access to
PET production lines
Acquisition of KringsIn Benelux
Refresco founded
MBO of Menken Drinks and Refresco
de Sur Europa by Menken Holding
Market entrance in Scandinavia
Enforcement of the market position in
Spain
Histogram
UK market entry; focused on fruit juices
Entry into Poland, mineral water and
CSD
Sun Beverage
Strong in CSD and mineral water in
France and Benelux; alliance with A-brand
companies
Strengthening of market position in France; 2nd A-PET
plant in France
Co-operation; bottling and purchasing of NFC orange juice
Market leader in the Benelux in private
label; soft drinks and fruit juices
Schiffers Food
Entry into German CSD market and
access to Lidl
Acquisition of private label leader in Italy
1999
€85m
2000
€275m
2001
€270m
2005
€606m
2004
€558m
2002
€450m
2003
€544m
2008
€1.1bn
2009
€1.1bn
2011E
€1.7bn
2010
€1.2bn
2007
€952m
2006
€660m
Buy and Build strategyOperational improvement
3i majority stake 3i minority stake
During our two and a half year investment in Refresco, EBITDA increased by 42% (10% CAGR)

44
Attractiveness to 3i
Strong underlying industry drivers
3i understanding the business
Management
Scale and geographic footprint
Operational improvement opportunities
45
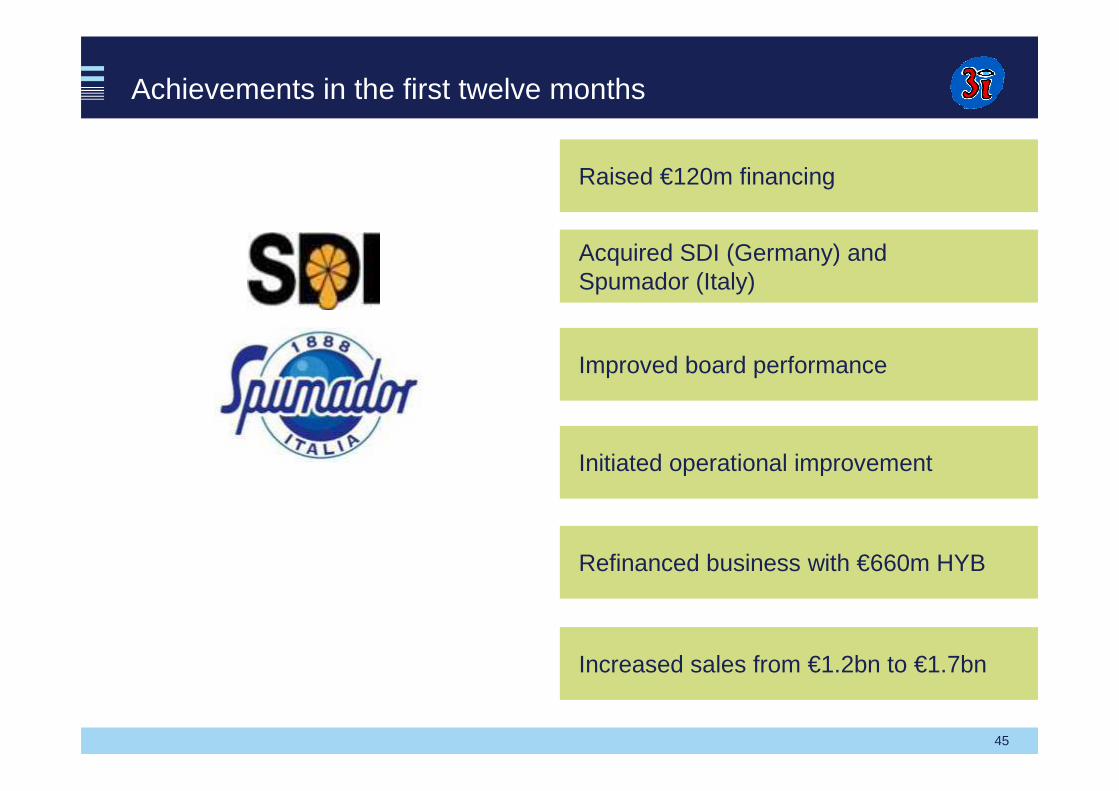
Refinanced business with €660m HYB
Raised €120m financing
Acquired SDI (Germany) and Spumador (Italy)
Improved board performance
Initiated operational improvement
Increased sales from €1.2bn to €1.7bn
Achievements in the first twelve months
46
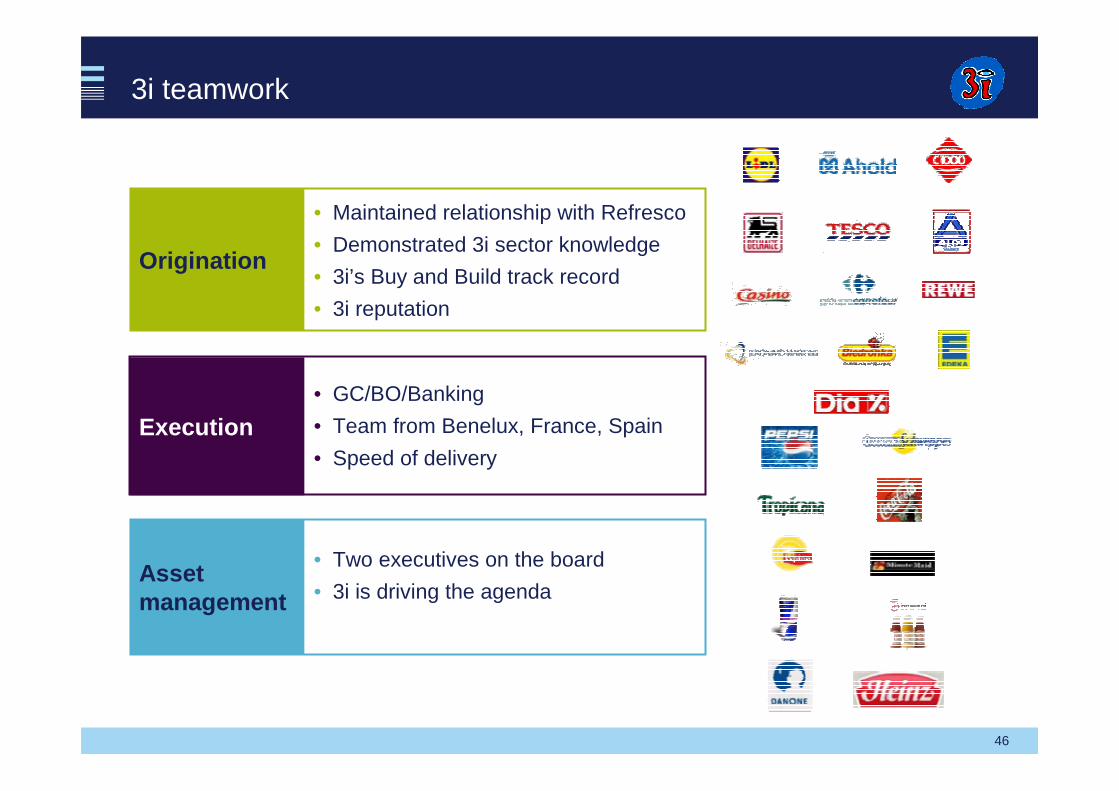
Origination
• Maintained relationship with Refresco
• Demonstrated 3i sector knowledge
• 3i’s Buy and Build track record
• 3i reputation
Execution• GC/BO/Banking
• Team from Benelux, France, Spain
• Speed of delivery
Asset management
• Two executives on the board
• 3i is driving the agenda
3i teamwork
47

484848
Jeremy Ghose
Debt Management – the business and opportunity

49
Our vision
Build a leading global debt management business with a reputation for integrity, professionalism and experience, delivering innovation and expertise and targeting an NPR of 15%.
50
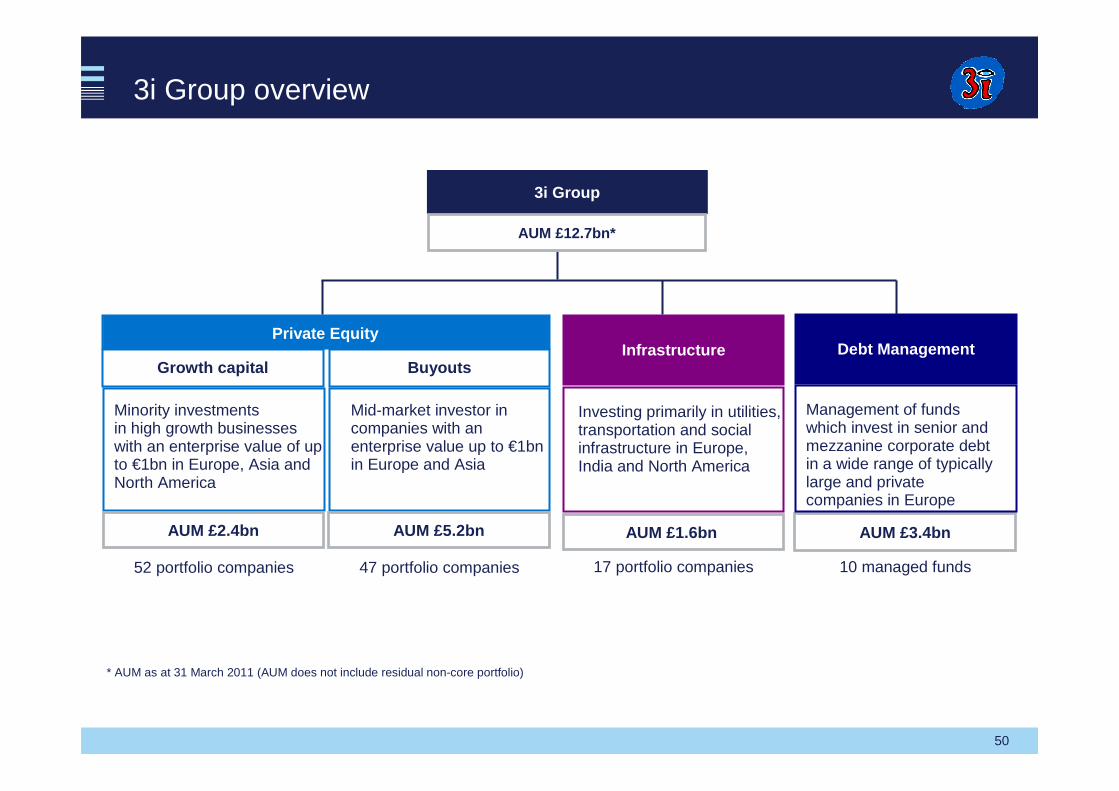
3i Group overview
3i Group
AUM £12.7bn*
AUM £3.4bn
Debt Management
Management of funds which invest in senior and mezzanine corporate debt in a wide range of typically large and private companies in Europe
10 managed funds
Infrastructure
AUM £1.6bn
17 portfolio companies
Buyouts
AUM £5.2bn
47 portfolio companies
Growth capital
AUM £2.4bn
52 portfolio companies
Private Equity
* AUM as at 31 March 2011 (AUM does not include residual non-core portfolio)
Minority investments in high growth businesses with an enterprise value of up to €1bn in Europe, Asia andNorth America
Mid-market investor in companies with an enterprise value up to €1bn in Europe and Asia
Investing primarily in utilities, transportation and social infrastructure in Europe, India and North America
51
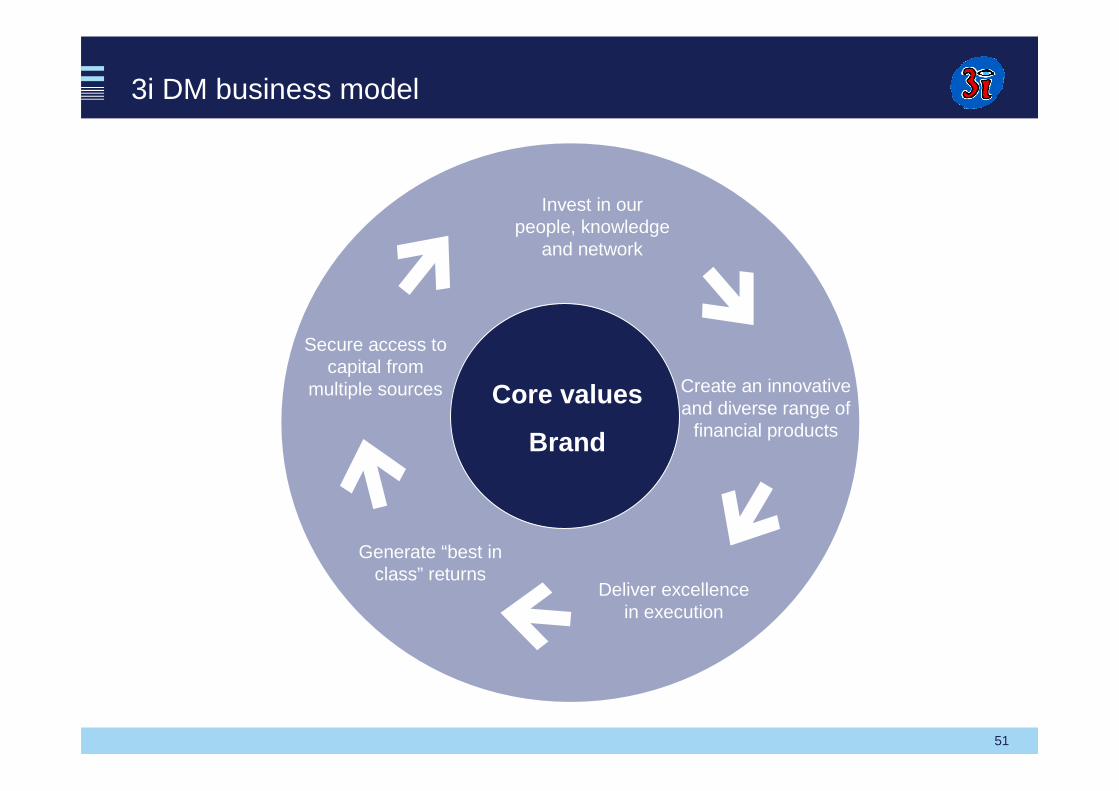
3i DM business model
Core values
Brand
Invest in our people, knowledge
and network
Generate “best in class” returns
Create an innovative and diverse range of
financial products
Secure access to capital from
multiple sources
Deliver excellence in execution

52
Grow our business• Grow organically and by strategic acquisitions/partnerships• Targeted expansion into new regions• Provide innovative solutions to meet investor requirements
One 3i• Demonstrate a commitment to excellence in all our activities • A consistent approach to the way we do business • Build on 3i’s established network and global market presence
Invest• Place value and trust in our people • Strive to deepen our knowledge • Broaden our networks
Our strategy
Build on our reputation• Build a strong relationship with our investors and partners• Reputation as a respected and responsible asset manager• Continual improvement of both our product offering and returns
3iDM strategy

53
3i DM background
3i Debt Management
• Established October 2007 to focus lending on sub-investment grade space in non 3i investments
• 3i Debt Warehouse has delivered 13.6% IRR
• Established 2006 to manage Mizuho Corporate Banks’sub-investment grade fund management activities
• Diversified product offering
• At 31 December 2010, MIM was 6th largest debt fund management platform in Europe
• Generated an average cash yield of 11% across its funds to 31 December 2010
3i Debt Warehouse Mizuho Investment Management
54
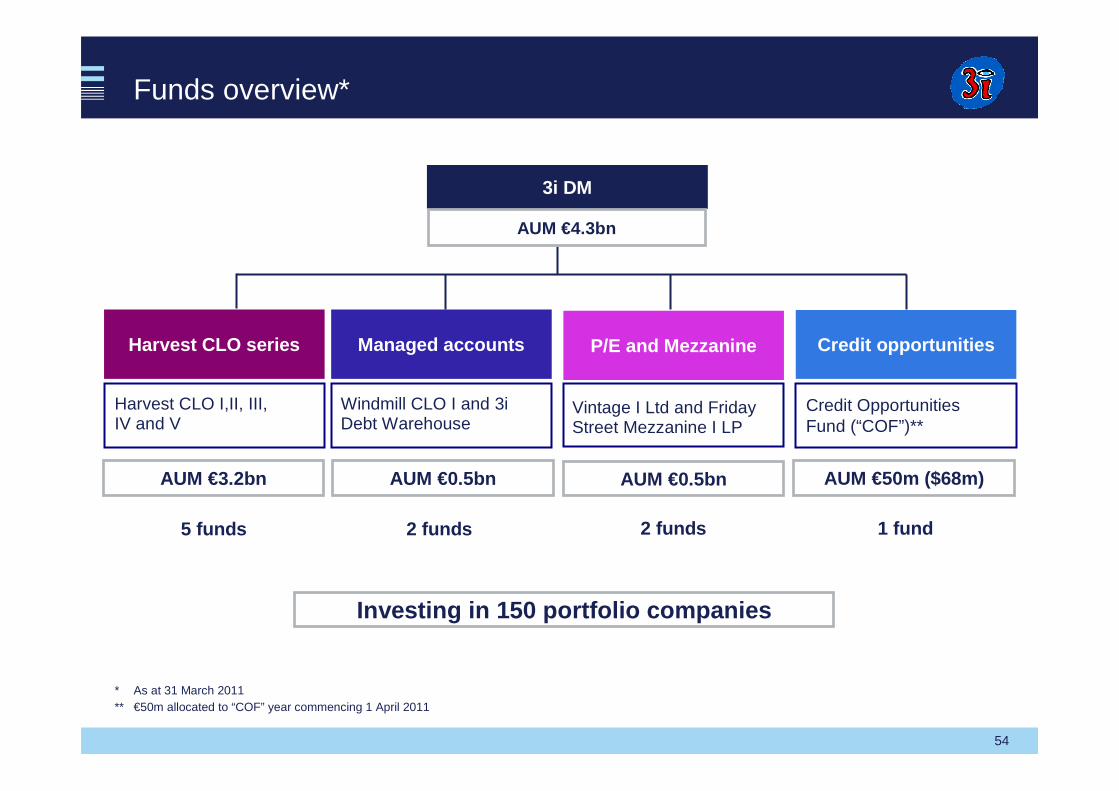
Funds overview*
3i DM
AUM €4.3bn
AUM €50m ($68m)
Credit opportunities
Credit Opportunities Fund (“COF”)**
1 fund
P/E and Mezzanine
AUM €0.5bn
2 funds
AUM €0.5bn
2 funds
AUM €3.2bn
5 funds
* As at 31 March 2011** €50m allocated to “COF” year commencing 1 April 2011
Windmill CLO I and 3i Debt Warehouse
Vintage I Ltd and Friday Street Mezzanine I LP
Managed accountsHarvest CLO series
Harvest CLO I,II, III, IV and V
Investing in 150 portfolio companies
55
Fund performance overview
• Demonstrated strong performance track record
• Second amongst Top 10 European CLO managers* in termsof equity returned
• Private Equity Fund of Funds’ current performance is 4.3x
• 3i Debt Warehouse - 13.6% IRR, 1.4x MM
* Based on total assets under management and average equity returns to 31 December 2010
56
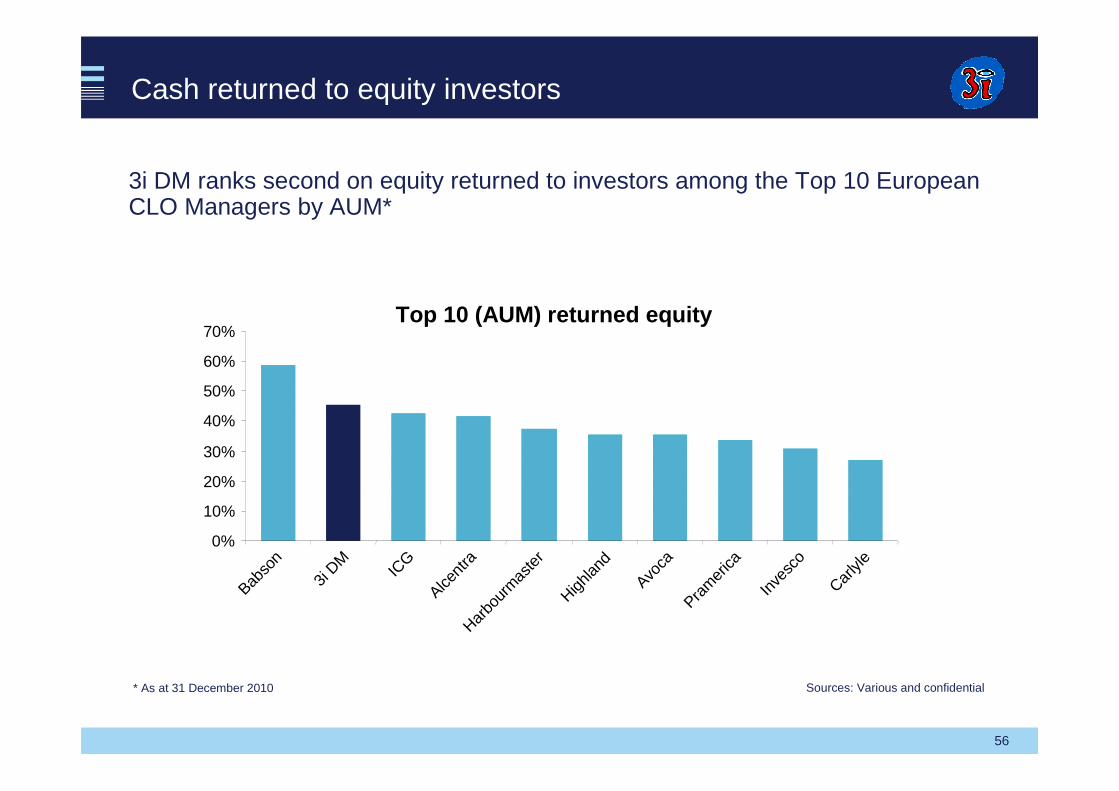
Cash returned to equity investors
3i DM ranks second on equity returned to investors among the Top 10 European CLO Managers by AUM*
Sources: Various and confidential* As at 31 December 2010
Top 10 (AUM) returned equity
0%
10%
20%
30%
40%
50%
60%
70%
Babso
n
3i DM
ICG
Alcent
raHar
bour
mas
ter
Highlan
d
Avoca
Pram
erica
Inve
sco
Carlyl
e
57
Market characteristics
• Market has reopened
• US market new issuance
• Recent European transactions include
– balance sheet trades
– refinancing of existing deals
– bespoke credit opportunities funds

58
Market opportunities
• Attractive competitive environment as banks reduce balance sheet exposure
• Wall of refinancings from €225bn of debt supporting 2006-07 European LBOs
• Performing secondary loans available below par
• More conservatively structured new vintage LBOs
• Attractive returns available to investors for senior secured debt risk
• Outlook (supply vs demand) across the medium term is positive
• $500bn of committed PE capital available to invest over the coming five years
• Lender friendly documentation with improved covenant protection
Returns available on senior secured loans: 12-15% geared, 6-7% ungeared
59
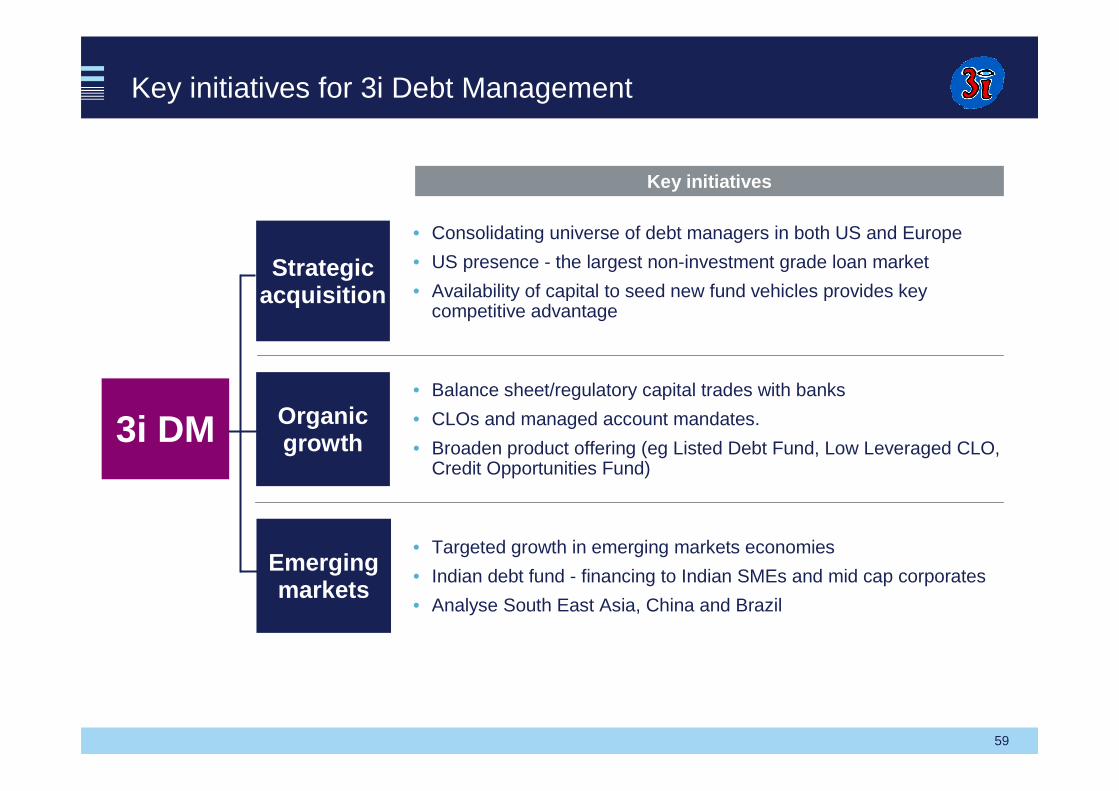
Key initiatives for 3i Debt Management
Strategic acquisition
Organic growth
Emerging markets
Key initiatives
• Consolidating universe of debt managers in both US and Europe
• US presence - the largest non-investment grade loan market
• Availability of capital to seed new fund vehicles provides key competitive advantage
• Balance sheet/regulatory capital trades with banks
• CLOs and managed account mandates.
• Broaden product offering (eg Listed Debt Fund, Low Leveraged CLO, Credit Opportunities Fund)
• Targeted growth in emerging markets economies
• Indian debt fund - financing to Indian SMEs and mid cap corporates
• Analyse South East Asia, China and Brazil
3i DM

60
European and North American initiatives
Diversify product offering
Manager consolidation
New fund launches

61
Emerging economies
Opportunity
Target regions

6262
Cressida Hogg
62
Infrastructure model and portfolio

63
The infrastructure asset class – key characteristics
• Strong market positions
• Capital-intensive businesses
• Some degree of inflation linkage
• Low cyclical volatility
• Predictable, income-oriented returns when operational
• Potential for capital growth
Strong market position; monopolies/regulated market/ strong contracts underpinning revenues
64
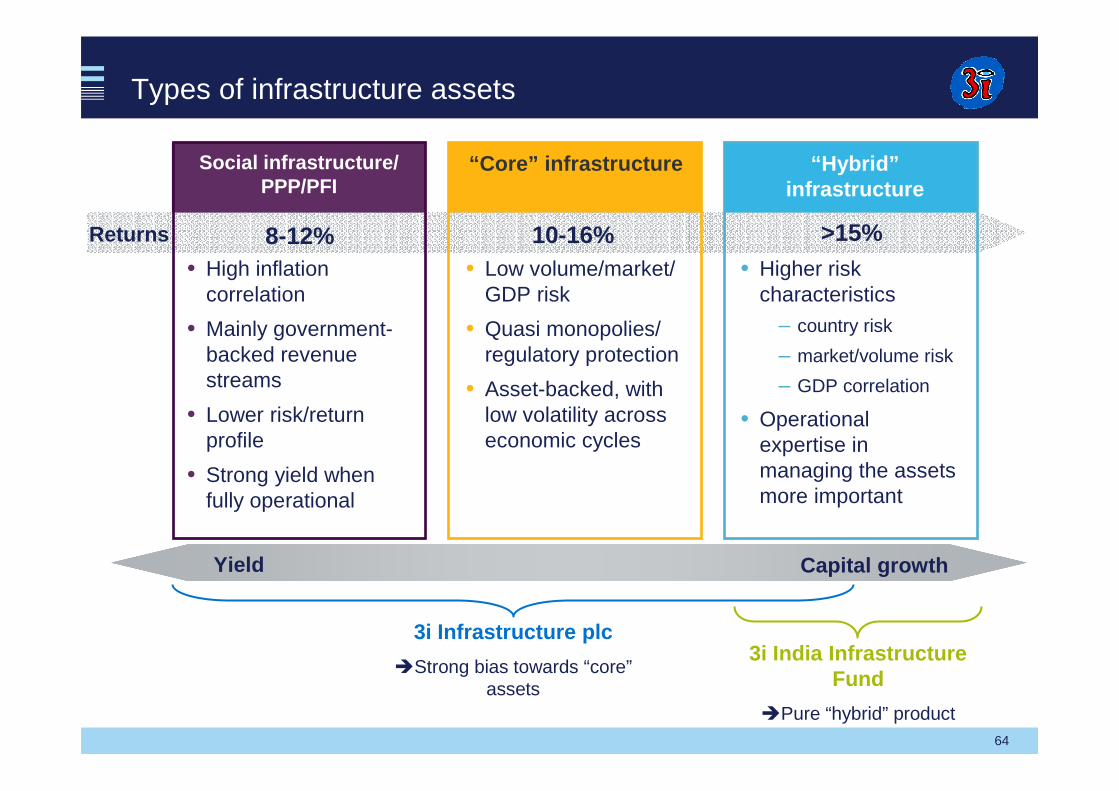
Types of infrastructure assets
Social infrastructure/PPP/PFI
“Core” infrastructure “Hybrid”infrastructure
Returns 8-12% 10-16% >15%• High inflation
correlation
• Mainly government-backed revenue streams
• Lower risk/return profile
• Strong yield when fully operational
• Low volume/market/ GDP risk
• Quasi monopolies/ regulatory protection
• Asset-backed, with low volatility across economic cycles
• Higher risk characteristics
– country risk
– market/volume risk
– GDP correlation
• Operational expertise in managing the assets more important
Yield Capital growth
3i Infrastructure plc
�Strong bias towards “core”assets
3i India Infrastructure Fund
�Pure “hybrid” product

65
Infrastructure at 3i – two investment vehicles
Portfolio value£822m
Assets held directly and indirectly17
Annualised return to shareholders since inception9.9%
Cash remaining£175m
Net asset value£996m
Yield objective5%
Total return objective, net 12%
Gross money multiple since inception1.3x
Assets held directly6
Gross IRR since inception15%
Committed70%
Net asset value$1.0bn
In commitments$1.2bn
Return objective, net 18%
3i Infrastructure plc35.3% direct holding
3i India Infrastructure Fund$250m commitment
• Sector focus on Social Infrastructure, Utilities and Transportation – bias towards “core” infrastructure assets , in line with return objectives
• Geographical focus on Europe, plus $250m commitment to 3i India Infrastructure Fund
• Sector focus on ports, airports, road and power sectors
• Exclusive geographical focus on India
� Investment activity conducted through two investment vehicles
As at 31 March 2011
66
Why being part of 3i makes a difference
Network
Business Leaders’ Network
Corporate relationships
Brand
Active partnership
Advisers and intermediaries
A platform for successful future development
67
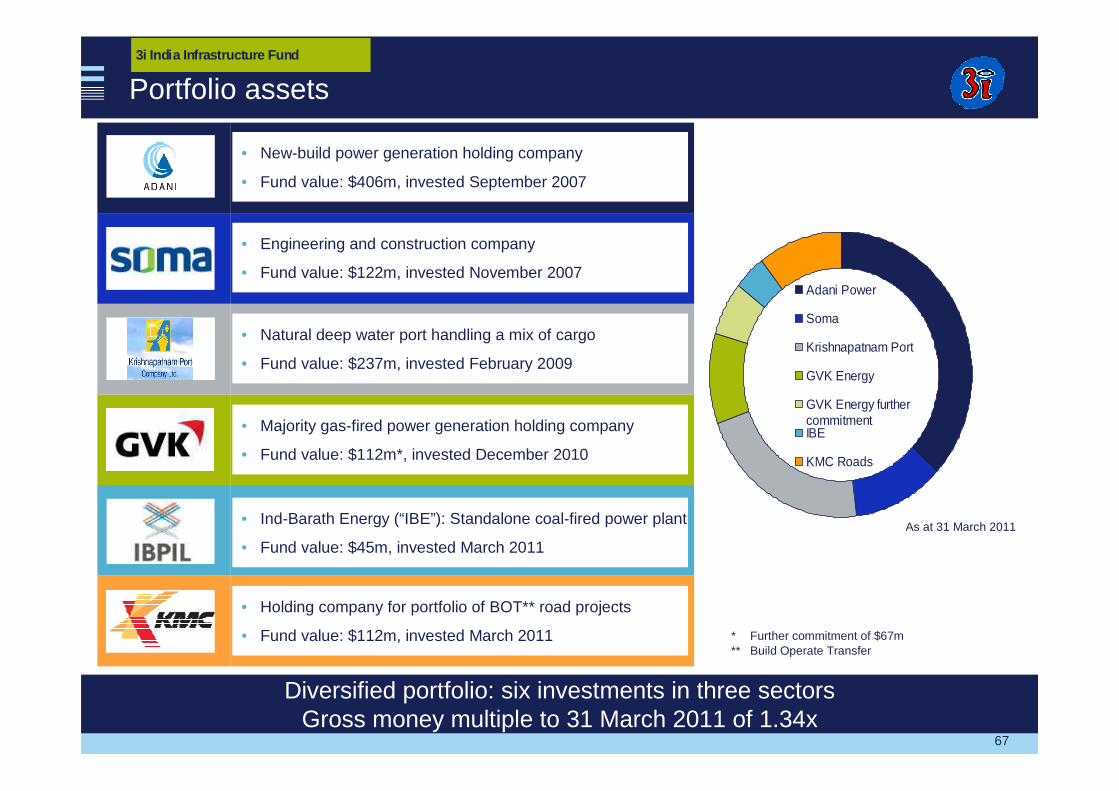
Portfolio assets
Diversified portfolio: six investments in three sectorsGross money multiple to 31 March 2011 of 1.34x
• New-build power generation holding company
• Fund value: $406m, invested September 2007
• Natural deep water port handling a mix of cargo
• Fund value: $237m, invested February 2009
• Majority gas-fired power generation holding company
• Fund value: $112m*, invested December 2010
• Engineering and construction company
• Fund value: $122m, invested November 2007
* Further commitment of $67m** Build Operate Transfer
• Holding company for portfolio of BOT** road projects
• Fund value: $112m, invested March 2011
Adani Power
Soma
Krishnapatnam Port
GVK Energy
GVK Energy furthercommitmentIBE
KMC Roads
As at 31 March 2011• Ind-Barath Energy (“IBE”): Standalone coal-fired power plant
• Fund value: $45m, invested March 2011
3i India Infrastructure Fund

68
Investment approach
• Targeted focus on early stage projects in the power, roads, ports and airport sectors
• Local team with strong track record of investing in infrastructure and operational understanding of target assets
• Partnership with local entrepreneurs with a strong track record of delivery
• Rigorous due diligence
1 2 3Rigorous approach to investment
Best-in-class portfolio management
Realise assets when objectives are met
• Most investments are early-stage
• Active involvement with portfolio companies to monitor implementation of construction phase
• Board representation in each investment
• Ongoing financial support if appropriate
• Limited life LP fund
• Public markets provide viable exit strategy for most assets
Consistent investment strategy
Value from bridging the construction gap
Crystallise value through realisations
3i India Infrastructure Fund

69
Rigorous approach to investment
• $161m investment in February 2009 in one of the largest and most profitable private sector ports in India
• Natural deep water port, operated under a “landlord port” model, under a 30-year concession (extendable to 50 years)
• Asset has progressed significantly since investment
– developed eight berths capable of handling ten ships simultaneously
– cargo volumes almost doubled to 16.0mtpa in 2010/2011
– operations streamlined since investment, reducing turnaround times
• 3iIIF continued to support management in building out the asset - $191m capital expenditure in 2010/2011 includes railway, storage facilities and dredging projects
1Rigorous approach to investment
Krishnapatnam Port Company2Best-in-class portfolio management
3i India Infrastructure Fund
70
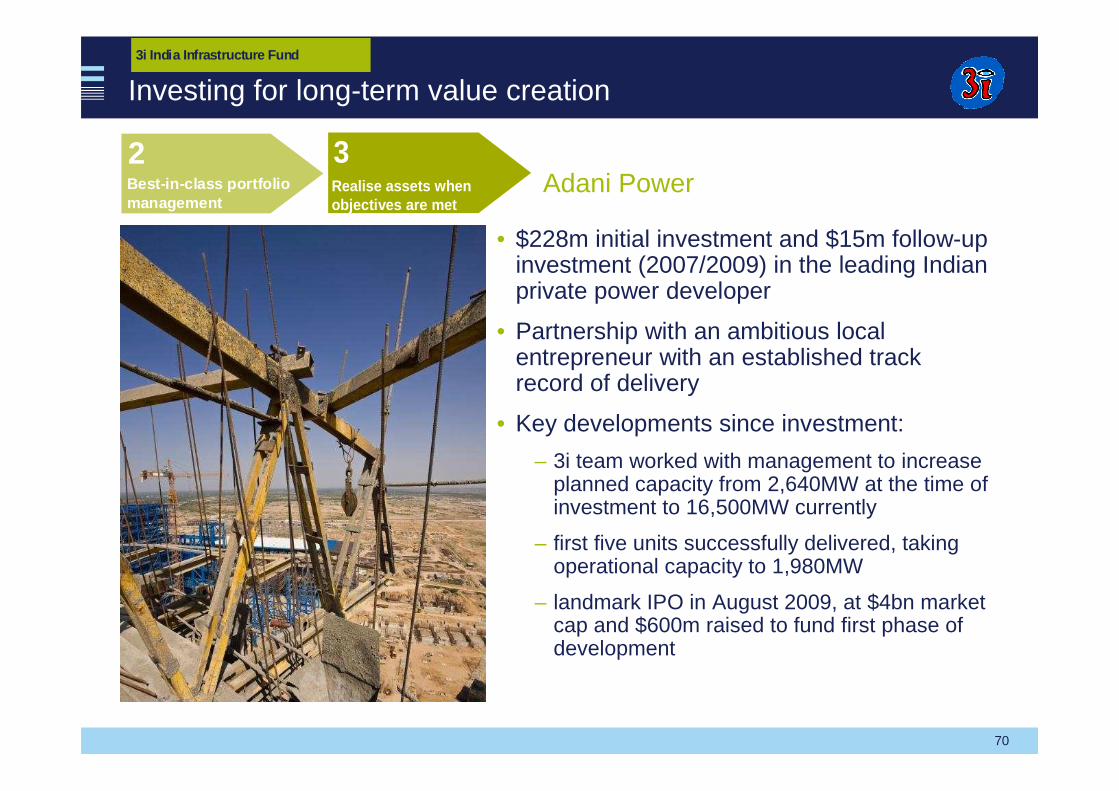
Investing for long-term value creation
3Realise assets when objectives are met
• $228m initial investment and $15m follow-up investment (2007/2009) in the leading Indian private power developer
• Partnership with an ambitious local entrepreneur with an established track record of delivery
• Key developments since investment:
– 3i team worked with management to increase planned capacity from 2,640MW at the time of investment to 16,500MW currently
– first five units successfully delivered, taking operational capacity to 1,980MW
– landmark IPO in August 2009, at $4bn market cap and $600m raised to fund first phase of development
Adani Power2Best-in-class portfolio management
3i India Infrastructure Fund

71
Portfolio assets3i Infrastructure plc
Portfolio value and cash balances of £997m
17 assetsinvested
£822mportfolio value
£175mcash balances
Cash£175m
Portfolio£822m
Value at 31 March 2011 (£m)
Value at 31 March 2010 (£m)
AWG 196 194Eversholt 161 -Oystercatcher 119 119Junior debt portfolio
TDF 37 33NGW Arqiva 32 30Thames Water 21 17Viridian (1) - 43
3i India Infrastructure FundAdani Power 53 58Krishnapatnam Port 31 27Soma Enterprise 16 13KMC Roads 15 -GVK Energy 14 -Ind-Barath Utkal 6 -
PFI portfolioElgin (16 projects) 40 39I2 Loan notes 32 30Octagon 31 29Alpha Schools (11 schools) 18 16
T2C nil nilTotal portfolio asset value 822 648
Cash committed to India 54 95Cash committed to final dividend 23 27Free cash 98 192Total cash 175 314
(1) Sold in October 2010As at 31 March 2011

72
Performance against objectives
Mar 2011
Mar 2010
Mar 2009
Mar 2008
Mar 2007
Diluted NAV per share (post dividend)
Cumulative dividend per share (including final divi dend)
9.9%annualised return to shareholders
5%dividend objective achieved in each year since inception
100.0
110.6
119.0
128.8
139.0
Growth in shareholder returns (pence per share)
3i Infrastructure plc

73
Investment approach
• Proprietary knowledge and networks in target sectors/geographies
• Operational understanding of target assets
• Execution skills (structuring, financing, consortium building)
• Rigorous due diligence
1 2 3Rigorous approach to investment
Best-in-class portfolio management
Investing for long-term value creation
• Active involvement with portfolio companies to deliver improvements in operational performance
• Board representation
• Selective approach to realisations
• Active involvement with portfolio companies to encourage capital investment for long-term value accretion
• In-depth understanding of market and sector dynamics and of long-term value drivers
Consistent investment strategy
Drive income generation from
portfolio companies
Drive capital growth from value accretive
projects
3i Infrastructure plc

74
Consistent investment strategy
• £151m investment in one of the three leading rolling stock companies in the UK, owns c. 29% of the British rail fleet
• Consistent with strategy of building a portfolio weighted towards “core” infrastructure
• Market access and execution skills key to success of the deal:
– early exclusivity/strong partners
– understanding of asset and value drivers
– financing skills
• Comprehensive 100-day post acquisition programme:
– new chairman
– most of the acquisition debt refinanced through three public bonds (£1.1bn), long dated and priced on attractive terms, reducing refinancing risk and interest costs
“Core” asset. Significant origination and execution skills required
1Rigorous approach to investment
2Best-in-class portfolio management
Eversholt
3i Infrastructure plc

75
Drive capital growth
• Since 3iN first invested, the three terminals increased total capacity by 12% and throughput by 25%
• Projects include:
– Singapore – 160,000 m3 expansion project to accommodate demand from adjacent refineries and petrochemical industry approved in 2008
– Amsterdam – 42,000 m3 expansion project to provide dedicated storage for biodiesel products for a new production facility approved in 2009
– Malta – investment in a new 13,000 m3 tank recently approved
• 3iN/investment adviser actively involved in assessing of capital expenditure project proposals
Encouraging portfolio companies to deploy capital in projects that deliver long-term value accretion
3Investing for long-term value creation
Oystercatcher
3i Infrastructure plc

76
Summary
• Differentiated product offering
– two investing vehicles with distinct mandates
– fee stream for 3i – blended return
– aligned incentives
• Establishing a strong track record
– solid track record of asset returns in both vehicles
– on track to achieving return objectives
• Well integrated in 3i
– sharing knowledge and best practice
– using the network as a platform for further expansion
– capitalising on the 3i brand
Well positioned for growth
7777
Robert Stefanowski
77
3i Asia and the Americas
78
Agenda
• Global markets need global players
• How we access global markets
• The opportunities
• Progress to date
• Quintiles case study
• Questions

79
The global economy
Source: IMF & 3i

80
Rapid change creating opportunities
1990 USD trn 2000 USD trn 2010 USD trn 2020 USD trn 2030 USD trn
1 US 5.8 US 10.0 US 14.7 China 25.8 China 77.0
2 Japan 3.0 Japan 4.7 China 6.0 US 24.0 US 39.3
3 Germany 1.5 Germany 1.9 Japan 5.7 India 10.3 India 32.5
4 France 1.2 UK 1.5 Germany 3.3 Japan 6.1 Brazil 12.2
5 Italy 1.1 France 1.3 France 2.6 Brazil 5.1 Indonesia 9.3
6 UK 1.0 China 1.2 UK 2.3 Germany 5.0 Japan 8.4
7 Canada 0.6 Italy 1.1 Italy 2.0 France 3.9 Germany 8.2
8 Spain 0.5 Canada 0.7 Brazil 2.0 Russia 3.5 Mexico 6.6
9 Brazil 0.5 Brazil 0.6 Canada 1.6 UK 3.4 France 6.4
10 China 0.4 Mexico 0.6 Russia 1.5 Indonesia 3.2 UK 5.6

81
Why be global?
To raise capital
To deploy capital
To grow companies
To maximise value in
companies
Opportunities
• Vast pools of capital
• Local teams and results
• 3i 60 year heritage appeals to international investors
Challenges
• Need to build long term relationships
Opportunities
• Faster growing economies
• Companies need to be international
• Consumer led demand
Challenges
• Risk adjusted returns
• Need to be disciplined
Opportunities
• 3i sector expertise
• The right product
• International network
Challenges
• Legal/Compliance/CSR
• Management stretch
Opportunities
• More cross border transactions
• “Being internationally local”
Challenges
• Alignment of interests
• Hold versus sell

82
3i has a presence in key markets
-2% 2% 4% 6% 8% 10%
-1%
12%
0%
1%
1%
2%
India
China
US
Japan Germany
Russia
PolandBelgium
South Korea
Indonesia
CanadaUK
France
Netherlands
Italy
Spain
Brazil
Mexico
Turkey
-1%
-1%
0%
1%
1%
2%
2%
-2 0 2 4 6 8 10 12
GDP Growth
Pop
ulat
ion
Gro
wth
US
Canada
Brazil
Indonesia
UK
Turkey
India
China
South Korea
Spain
Italy Netherlands
Japan
RussiaGermany
Belgium
France
3i presence
No 3i presence
83
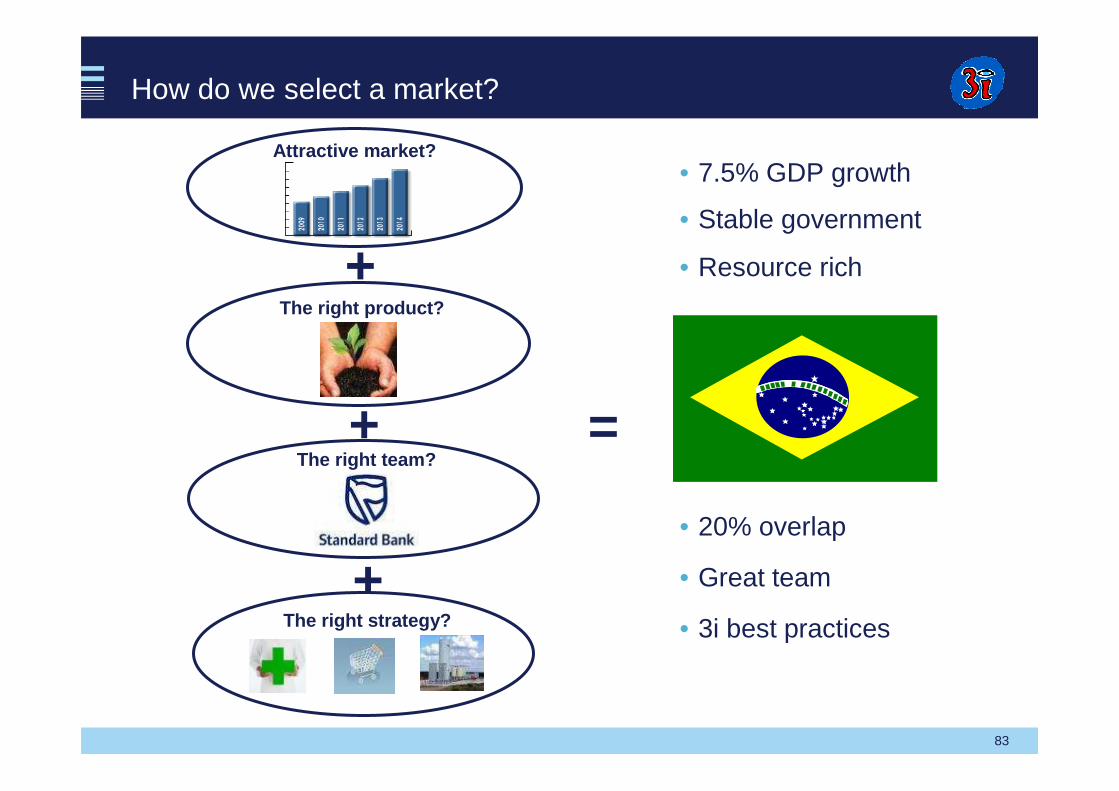
+The right team?
+The right product?
The right strategy?
+
Attractive market?
=
• Stable government
• Resource rich
• 7.5% GDP growth
• 20% overlap
• Great team
• 3i best practices
How do we select a market?

84
3i Brazil
Competitive landscape
$100 m
Small
Available capital
$300 m
Mid size
Large
$50 m
$100 m
DLJ SA PARTNERS
Opportunity
• Four member team recruited from Standard Bank
• Marcelo Di Lorenzo – 14 years’experience with Merrill/Morgan Stanley
• Managed $300m, in 11 investments over time
• Excellent track record
Challenges
• Depreciation of real/inflation
• Increasing capital flows
• Very complex tax/legal code
• Corporate social responsibility

85
How can we compete in the US?
1. We target international deals where we have unique reach and a relevant network
• A clear and most valuable differentiator for 3i
• Not many mid market PE firms have it
2. We are a committed mid-market investor• Equity investments of $50m to $250m
• An area of 3i core competency
• International is key differentiator in this segment
3. We are a growth-oriented investor• Focus on growth industries
• We are builders of businesses not financial engineers
4. Sectors where we can add the most value• Business Services, Healthcare and General
Industrial
• We can leverage 3i’s proven track record and strong network
• These sectors also match up well with our international growth orientation
US sector map
3i US sector expertise
Mid-market
Growing
International
GIBSHCFSCons

86
• Buy and Build
• US acquisition of Breeze International
3i Americas
• Make new investments
– 7% of the existing portfolio
– Gross proceeds >$1.0bn expected
• Internationalise portfolio companies
• Access to capital
– Permanent fund raising capability
– 40% of fund investors based in US
• Potential acquirers
– Caterpillar acquisition of MWM
Germany
UK• Build out of US offices
• Canadian acquisition of SEACOR Environmental
Spain• US investor presence
critical to fulfilling US radio licence requirements
UKBeneluxGermany
US
• Due diligence
• US acquisition support
• US board representation
Global connectivity is a differentiatorOur approach

87
3i Asia
• Make new investments– 7.5% of the existing portfolio
• Match the product to the market
– Growth Capital with local partners
– India Infrastructure
• Internationalise portfolio companies
– Expansion of MWM into Asia
– Mold Masters, Quintiles, John Hardy
• Provide access to capital
– China Sovereign fund cornerstone investor in the Growth Capital Fund
– GIC is a multiple investor across 3i funds (and is a top 20 shareholder)
• Source global buyers
– Unitas Capital acquisition of Hyva
Mumbai
Beijing
Singapore
Hong Kong
ShanghaiNew Delhi
88
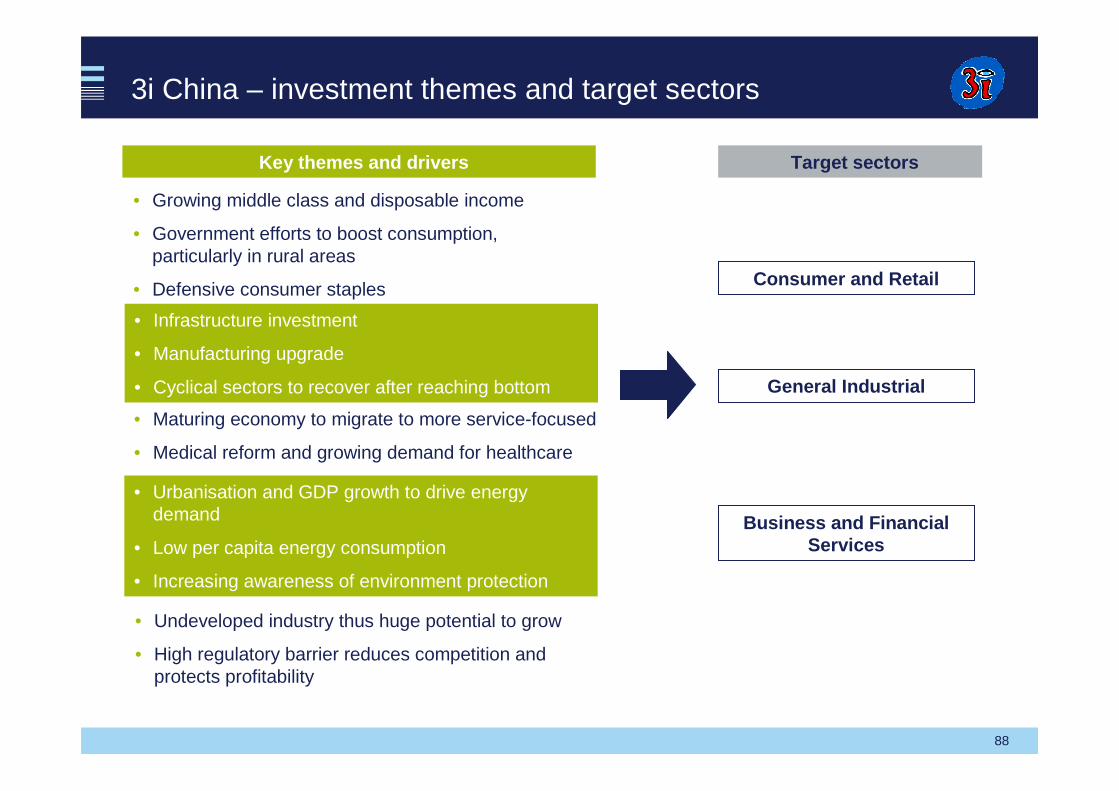
3i China – investment themes and target sectors
• Growing middle class and disposable income
• Government efforts to boost consumption, particularly in rural areas
• Defensive consumer staples
Key themes and drivers
• Urbanisation and GDP growth to drive energy demand
• Low per capita energy consumption
• Increasing awareness of environment protection
• Maturing economy to migrate to more service-focused
• Medical reform and growing demand for healthcare
• Infrastructure investment
• Manufacturing upgrade
• Cyclical sectors to recover after reaching bottom
Target sectors
• Undeveloped industry thus huge potential to grow
• High regulatory barrier reduces competition and protects profitability
Consumer and Retail
General Industrial
Business and Financial Services

89
An example - 3i China
…… Drives the ability to better compete
3i’s strong history in China …..
• 10 year on the ground presence
• 3i China has invested $266m in 11 deals
• $346m cash returned, generating 2.4x and 36.5% IRR for realised portfolio
Shanghai Government
$100mm RMB Fund Allocation
May 2011
1. Blackstone Group
2. TPG
3. Carlyle
4. Hony Capital
5. 3i Group

90
Case study - Quintiles
Americasc.40% of revenue
US Global Headquarters
Central Lab in Brazil
3i Healthcare Team 3i H
ealth
care
Tea
m
3i Healthcare Team Asiac.20% of revenue
Leading CRO in IndiaExpansion into China
Europec.40% of revenue
3i rep on Europe BODChairman in UK

91
Summary
• 3i has a strong international brand and reputation
• Being global does matter! It allows you to:
– access capital
– deploy capital
– grow portfolio companies
– realise maximum value on sale
• Most importantly, 3i’s global network is already delivering across our business and portfolio

9292
Michael Queen
92
Closing remarks

93
Priorities for Private Equity
• Europe
– fully invest Eurofund V and the Growth Fund
– raise combined Growth and Buyout Fund
• Asia
– RMB denominated fund to invest competitively in China
– Southern Asia fund to take advantage of opportunities in India and beyond
– Emerging Titans
• The Americas
– make first investments in Brazil, paving the way for a Brazilian fund
– invest in Growth and Buyout transactions
Private Equity
94
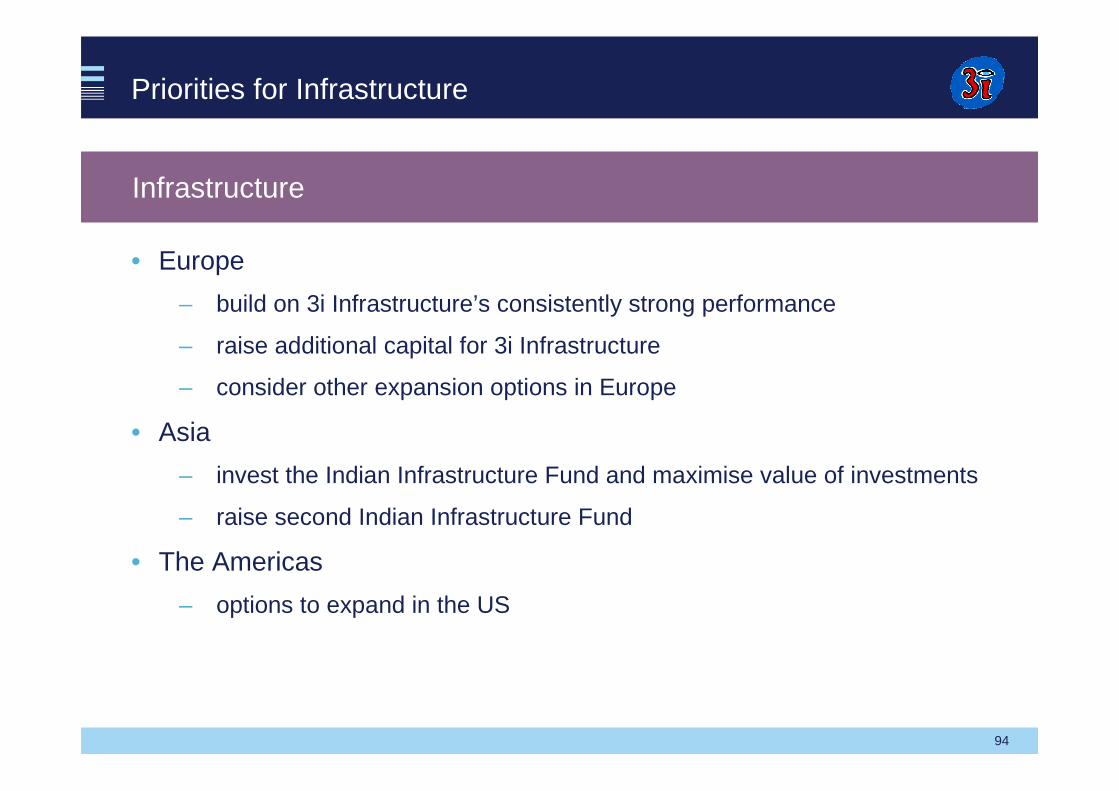
Priorities for Infrastructure
• Europe
– build on 3i Infrastructure’s consistently strong performance
– raise additional capital for 3i Infrastructure
– consider other expansion options in Europe
• Asia
– invest the Indian Infrastructure Fund and maximise value of investments
– raise second Indian Infrastructure Fund
• The Americas
– options to expand in the US
Infrastructure

95
Priorities for Debt Management
• Europe
– bolt-on acquisitions to complement current platform
– raise new funds
– develop fund of fund capabilities
• Asia
– acquisitions to expand geographic reach
– raise new funds
• The Americas
– acquisitions to expand geographic reach
– raise new funds
Debt Management

96
Priorities for 3i Group
Private Equity Infrastructure Debt Management
Gross return objectives
Fee income as a share of returns
Reduced volatility
20% 10%
15% 15%15%
12%
Net return objectives
97
In summary
The business is performing well and is positioned for growth
Each business has a clear strategy for delivering value
Committed to delivering the model for returns consistently

98
9999
June 2011
99
Our international views on 3i


