Investor News Page 1/25 Fresenius SE & Co. KGaA, Investor Relations & Sustainability November 2, 2021 Fresenius improves FY/21 Group guidance for the second time after good Q3 results • Fresenius Medical Care with stronger than projected COVID-19 related headwind • Fresenius Kabi improves EBIT 1 outlook; North America returning to growth; Emerging Markets business with continued healthy financial performance • Helios Germany with ongoing upward trend for elective treatments; activity levels at Helios Spain above pre-pandemic levels • Fresenius Vamed with good performance in the service business; order book in the project business remains at all-time high • Cost and efficiency program on track; savings targets confirmed for FY/23 • Fresenius raises FY/21 Group sales outlook; earnings now expected to be around the top-end of guidance If no timeframe is specified, information refers to Q3/21. € in millions Q3/2021 Growth Growth in constant currency Q1-3/2021 Growth Growth in constant currency Sales 9,324 5% 5% 27,554 2% 5% EBIT 2 1,041 -6% -6% 3,080 -8% -5% Net income 2,3 435 2% 2% 1,345 3% 6% 1 In constant currency 2 Before special items 3 Net income attributable to shareholders of Fresenius SE & Co. KGaA For a detailed overview of special items please see the reconciliation table on page 19. Markus Georgi Senior Vice President Investor Relations & Sustainability Fresenius SE & Co. KGaA Else-Kröner-Straße 1 61352 Bad Homburg Germany T +49 6172 608-2485 F +49 6172 608-2488 [email protected]www.fresenius.com
Fresenius improves FY/21 Group guidance for the second time after good Q3 results
• Fresenius Medical Care with stronger than projected COVID-19 related headwind • Fresenius Kabi improves EBIT1 outlook; North America returning to growth; Emerging
Markets business with continued healthy financial performance • Helios Germany with ongoing upward trend for elective treatments; activity levels at
Helios Spain above pre-pandemic levels • Fresenius Vamed with good performance in the service business; order book in the
project business remains at all-time high • Cost and efficiency program on track; savings targets confirmed for FY/23 • Fresenius raises FY/21 Group sales outlook; earnings now expected to be around the
top-end of guidance
If no timeframe is specified, information refers to Q3/21.
1 In constant currency 2 Before special items 3 Net income attributable to shareholders of Fresenius SE & Co. KGaA For a detailed overview of special items please see the reconciliation table on page 19.
Markus Georgi Senior Vice President Investor Relations & Sustainability Fresenius SE & Co. KGaA Else-Kröner-Straße 1 61352 Bad Homburg Germany T +49 6172 608-2485 F +49 6172 608-2488 [email protected] www.fresenius.com
Stephan Sturm, CEO of Fresenius, said: “More and more people being vaccinated against
COVID-19 is good news. However, the pandemic remains very relevant. It has also more
strongly impacted Fresenius and for longer than could have been foreseen. Yet despite this,
we continue to grow and remain on track to achieve this year’s, again raised, targets.
Launching the Group cost and efficiency program has proved to be the right decision: Our
initiatives will help us to better absorb the burdens caused by the pandemic. At the same
time, they will strengthen our foundations to thrive, long-term, in a challenging environment.
The demand for high-quality, affordable healthcare will be even greater in the future.
Fresenius will continue making an important contribution, while creating value for all
stakeholders.”
COVID-19 assumptions for guidance FY/21
Negative COVID-19 effects at Fresenius have increased sequentially in Q3/21, driven by
significant excess patient mortality at Fresenius Medical Care. Fresenius expects also Q4/21
to be impacted by COVID-19 effects. Meaningfully rising COVID-19 case numbers, the further
evolution of virus mutations as well as stalling vaccination progress could impact Fresenius’
ability to achieve its FY/21 guidance. Additionally, Fresenius expects headwinds from cost
inflation including rising commodity and shipping prices, increasing energy costs, as well as
supply chain constraints in Q4/21. Hence, Fresenius remains vigilant.
Whilst the risk of renewed far-reaching containment measures in one or more of Fresenius’
major markets cannot be excluded, it now appears unlikely. Any resulting significant and
direct impact on the health care sector without appropriate compensation is not reflected in
the Group’s FY/21 guidance. These assumptions are subject to considerable uncertainty.
FY/21 Group sales guidance raised, earnings guidance improved
Based on the Group’s good Q3/21 results and the progress to improve Group-wide
efficiencies, Fresenius raises its sales guidance and improves its earnings guidance. The
Company now projects constant currency sales1 to grow in a mid single-digit range in FY/21.
Previously, the Company projected sales1 growth in a low-to-mid single-digit percentage
range in constant currency. Earnings2,3 growth in constant currency is now expected to be
around the top-end of the low single-digit percentage range.
Implicitly, net income2 for the Group excluding Fresenius Medical Care is now expected to
grow in a low double-digit percentage range in constant currency. Previously, Fresenius
expected high single-digit percentage growth in constant currency.
1 FY/20 base: €36,277 million 2 Net income attributable to shareholders of Fresenius SE & Co. KGaA 3 FY/20 base: €1,796 million, before special items; FY/21: before special items
The guidance implies ongoing COVID-19 related headwinds, primarily at Fresenius Medical
Care, and increasingly noticeable cost inflation across selected markets in Q4/21. It also
reflects negative pricing effects related to tender activity at Fresenius Kabi in China.
Based on expected lower contributions to Group EBITDA from Fresenius Medical Care as well
as assumed cash phasing effects in Q4/21, Fresenius does not expect the net debt/EBITDA1
ratio of 3.55x as of September 30, 2021 to improve in Q4/21.
Progress on efficiency measures to sustainably improve profitability
During Q3/21, Fresenius finalized the concept phase of its cost and efficiency program. At
the same time, first initiatives were already implemented. Fresenius Medical Care is providing
an update on its FME25 transformation program in addition to its Q3/21 results presentation.
Fresenius confirms its expectation that the measures to sustainably enhance profitability and
operational excellence to reach cost savings of more than €100 million p.a. after tax and
minority interest in 2023, with some potential to increase thereafter.
Achieving these sustainable efficiencies will require significant up-front expenses. For the
years 2021 to 2023, those expenses are expected to average more than €100 million p.a.
after tax and minority interest, with the largest portion currently expected to materialize in
2022. They will be classified as special items, consistent with previous practice.
Fresenius expects significant contributions from all four business segments and from the
corporate center in the 2021 to 2023 period. For FY/21, low double-digit million Euro savings
after tax and minority interest from the Group’s cost and efficiency measures are expected to
support the Group’s profitability. These savings and efficiency gains derive from activities in
all four business segments.
1 At LTM average exchange rates for both net debt and EBITDA; pro forma closed acquisitions/divestitures;
excluding further potential acquisitions; before special items For a detailed overview of special items please see the reconciliation table on page 19.
Group sales increased by 5% (5% in constant currency) to €9,324 million (Q3/20:
€8,918 million). Organic growth was 3%. Acquisitions/divestitures contributed net 2% to
growth. Currency translation had no effect on sales growth. Excluding estimated COVID-19
effects1, Group sales growth would have been 7% to 8% in constant currency.
In Q1-3/21, Group sales increased by 2% (5% in constant currency) to €27,554 million
(Q1-3/20: €26,973 million). Organic growth was 4%. Acquisitions/divestitures contributed
net 1% to growth. Currency translation reduced sales growth by 3%. Excluding estimated
COVID-19 effects1, Group sales growth would have been 5% to 6% in constant currency.
2% net income2,3 increase in constant currency
Group EBITDA before special items decreased by 2% (-2% in constant currency) to
€1,700 million (Q3/20: €1,729 million). Reported Group EBITDA was €1,667 million (Q3/20:
€1,729 million).
In Q1-3/21, Group EBITDA before special items decreased by 5% (-1% in constant
currency) to €5,002 million (Q1-3/20: €5,246 million). Reported Group EBITDA was
€4,957 million (Q1-3/20: €5,246 million).
Group EBIT before special items decreased by 6% (-6% in constant currency) to €1,041
million (Q3/20: €1,113 million). The decrease is primarily due to COVID-19 related
headwinds at Fresenius Medical Care. The EBIT margin before special items was 11.2%
(Q3/20: 12.5%). Reported Group EBIT was €1,008 million (Q3/20: €1,113 million).
In Q1-3/21, Group EBIT before special items decreased by 8% (-5% in constant currency)
to €3,080 million (Q1-3/20: €3,361 million). The constant currency decrease is primarily due
to COVID-19 related headwinds at Fresenius Medical Care. The EBIT margin before special
items was 11.2% (Q1-3/20: 12.5%). Reported Group EBIT was €3,035 million (Q1-3/20:
€3,361 million).
1 For estimated COVID-19 effects please see table on page 17 2 Before special items 3 Net income attributable to shareholders of Fresenius SE & Co. KGaA For a detailed overview of special items please see the reconciliation table on page 19.
Group net interest before special items and reported net interest improved to -€126 million
(Q3/202: -€154 million) mainly due to lower interest rates.
In Q1-3/21, Group net interest before special items improved to -€384 million (Q1-3/202:
-€495 million). Reported Group net interest improved to -€384 million (Q1-3/20: -€503
million).
Group tax rate before special items was 23.0% (Q3/202: 22.0%) while reported Group tax
rate was 22.8% (Q3/20: 22.0%).
In Q1-3/21, Group tax rate before special items was 22.4% (Q1-3/202: 22.7%) while
reported Group tax rate was 22.3% (Q1-3/20: 22.7%).
Noncontrolling interests before special items were -€270 million (Q3/20: -€321 million) of
which 91% were attributable to the noncontrolling interests in Fresenius Medical Care.
Reported noncontrolling interests were -€268 million (Q3/20: -€321 million).
In Q1-3/21, noncontrolling interests before special items were -€747 million (Q1-3/20:
-€913 million) of which 91% were attributable to the noncontrolling interests in Fresenius
Medical Care. Reported noncontrolling interests were -€741 million (Q3/20: -€913 million).
Group net income1 before special items increased by 2% (2% in constant currency) to
€435 million (Q3/202: €427 million) driven by Fresenius Vamed and Fresenius Kabi as well as
by the favorable net interest development. Excluding estimated COVID-19 effects3, Group
net income1 before special items would have grown 12% to 16% in constant currency.
Reported Group net income1 decreased to €413 million (Q3/20: €427 million).
In Q1-3/21, Group net income1 before special items increased by 3% (6% in constant
currency) to €1,345 million (Q1-3/202: €1,302 million). Excluding estimated COVID-19
effects3, Group net income1 before special items would have grown 7% to 11% in constant
currency. Reported Group net income1 increased to €1,319 million (Q1-3/20: €1,297 million).
1 Net income attributable to shareholders of Fresenius SE & Co. KGaA 2 Before special items 3 For estimated COVID-19 effects please see table on page 17. For a detailed overview of special items please see the reconciliation table on page 19.
Group total assets increased by 7% (4% in constant currency) to €71,081 million
(Dec. 31, 2020: €66,646 million) given the expansion of business activities and currency
effects. Current assets increased by 10% (7% in constant currency) to €17,334 million
(Dec. 31, 2020: €15,772 million) driven by the increase of cash and cash equivalents, trade
accounts receivables, and inventories. Non-current assets increased by 6% (3% in constant
currency) to €53,747 million (Dec. 31, 2020: €50,874 million).
Total shareholders’ equity increased by 8% (4% in constant currency) to €28,186 million
(Dec. 31, 2020: €26,023 million). The equity ratio was 39.7% (Dec. 31, 2020: 39.0%).
Group debt increased by 5% (3% in constant currency) to €27,191 million (Dec. 31, 2020:
€ 25,913 million). Group net debt increased by 3% (1% in constant currency) to € 24,778
million (Dec. 31, 2020: € 24,076 million).
As of September 30, 2021, the net debt/EBITDA ratio increased to 3.55x1,2 (Dec. 31,
2020: 3.44x1,2) driven by COVID-19 effects weighing on EBITDA as well as increased net
debt. The improvement over June 30, 2021 (3.60x1,2) is driven by the reduction of net debt
in Q3/21 due to the good cash flow performance.
1 At LTM average exchange rates for both net debt and EBITDA; pro forma closed acquisitions/divestitures 2 Before special items For a detailed overview of special items please see the reconciliation table on page 19.
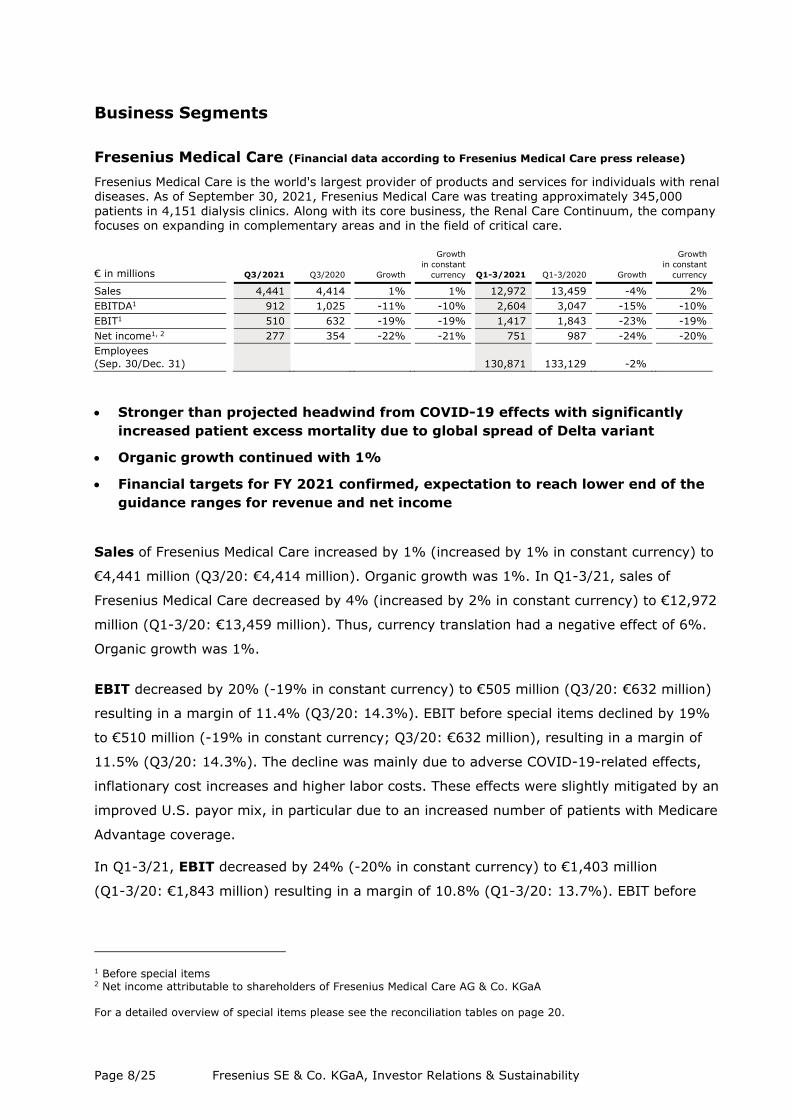
Fresenius Medical Care (Financial data according to Fresenius Medical Care press release) Fresenius Medical Care is the world's largest provider of products and services for individuals with renal diseases. As of September 30, 2021, Fresenius Medical Care was treating approximately 345,000 patients in 4,151 dialysis clinics. Along with its core business, the Renal Care Continuum, the company focuses on expanding in complementary areas and in the field of critical care.1 2
• Stronger than projected headwind from COVID-19 effects with significantly increased patient excess mortality due to global spread of Delta variant
• Organic growth continued with 1%
• Financial targets for FY 2021 confirmed, expectation to reach lower end of the guidance ranges for revenue and net income
Sales of Fresenius Medical Care increased by 1% (increased by 1% in constant currency) to
€4,441 million (Q3/20: €4,414 million). Organic growth was 1%. In Q1-3/21, sales of
Fresenius Medical Care decreased by 4% (increased by 2% in constant currency) to €12,972
million (Q1-3/20: €13,459 million). Thus, currency translation had a negative effect of 6%.
Organic growth was 1%.
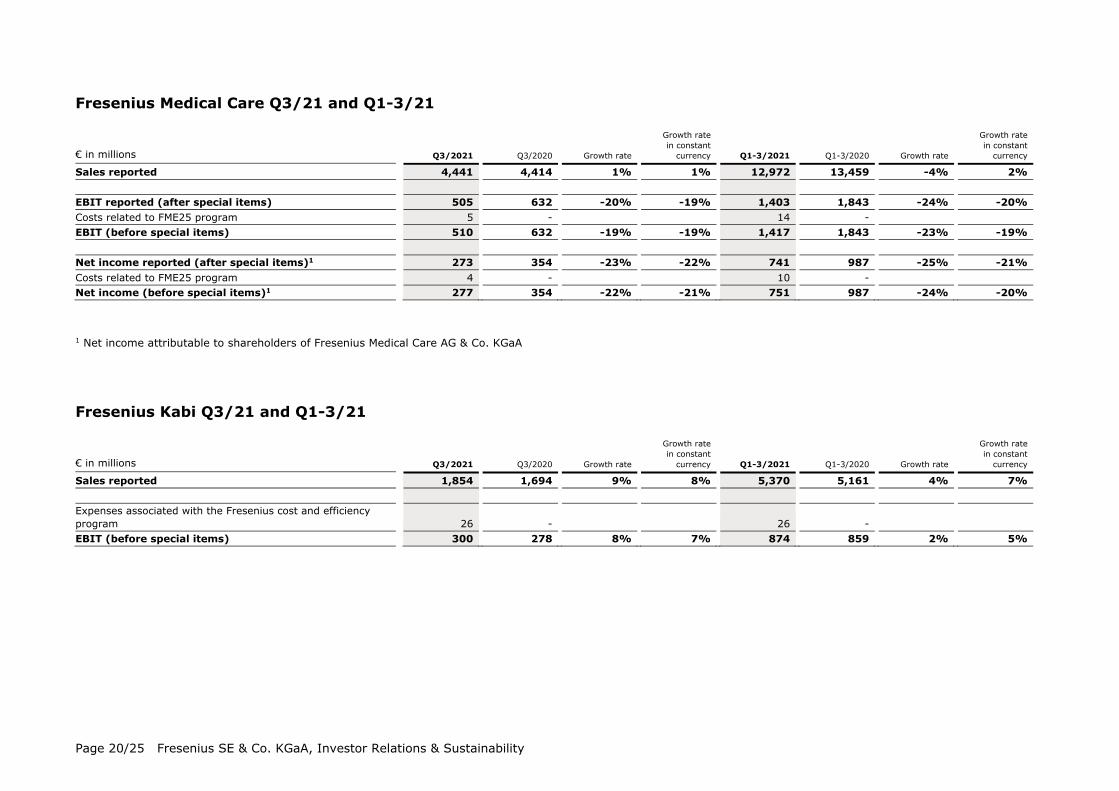
EBIT decreased by 20% (-19% in constant currency) to €505 million (Q3/20: €632 million)
resulting in a margin of 11.4% (Q3/20: 14.3%). EBIT before special items declined by 19%
to €510 million (-19% in constant currency; Q3/20: €632 million), resulting in a margin of
11.5% (Q3/20: 14.3%). The decline was mainly due to adverse COVID-19-related effects,
inflationary cost increases and higher labor costs. These effects were slightly mitigated by an
improved U.S. payor mix, in particular due to an increased number of patients with Medicare
Advantage coverage.
In Q1-3/21, EBIT decreased by 24% (-20% in constant currency) to €1,403 million
(Q1-3/20: €1,843 million) resulting in a margin of 10.8% (Q1-3/20: 13.7%). EBIT before
1 Before special items 2 Net income attributable to shareholders of Fresenius Medical Care AG & Co. KGaA For a detailed overview of special items please see the reconciliation tables on page 20.
special items decreased by 23% (-19% in constant currency) to €1,417 million (Q1-3/20:
€1,843 million) resulting in an EBIT margin before special items of 10.9% (Q1-3/20: 13.7%).
Net income1 decreased by 23% (-22% in constant currency) to €273 million (Q3/20: €354
million) mainly due to effects explained for operating income and a higher tax rate. Net
income1 before special items decreased by 22% (-21% in constant currency) to €277 million
(Q3/20: €354 million).
In Q1-3/21, net income1 decreased by 25% (-21% in constant currency) to €741 million
(Q1-3/20: €987 million). Net income1 before special items decreased by 24% (-20% in
constant currency) to €751 million (Q1-3/20: €987 million).
Operating cash flow was €692 million (Q3/20: €746 million) with a margin of 15.6%
(Q3/20: 16.9%). The decrease was mainly due to continued recoupment of the U.S. federal
government’s payments in the second quarter of 2020 under the CARES Act. In Q1-3/21,
operating cash flow was €1,820 million (Q1-3/20: €3,649 million) with a margin of 14.0%
(Q1-3/20: 27.1%).
For FY/21, Fresenius Medical Care confirms its outlook for revenue2 to grow at a low-to-mid
single-digit percentage rate and net income1,3 to decline at a high-teens to mid-twenties
percentage rate against the 2020 base and is now expecting to be at the lower end of these
guidance ranges4.
For further information, please see Fresenius Medical Care’s press release at www.freseniusmedicalcare.com.
1 Net income attributable to shareholders of Fresenius Medical Care AG & Co. KGaA 2 FY/20 base: €17,859 million 3 FY/20 base: €1,359 million, before special items; FY/21: before special items 4 These targets are based on the 2020 results excluding the impairment of goodwill and trade names in the Latin America Segment of €195 million. They are inclusive of anticipated COVID-19 effects, in constant currency and exclude special items. Special items include costs related to FME25 and other effects that are unusual in nature and have not been foreseeable or not foreseeable in size or impact at the time of giving guidance. For a detailed overview of special items please see the reconciliation tables on page 20
Fresenius Kabi Fresenius Kabi offers intravenously administered generic drugs, clinical nutrition and infusion therapies for seriously and chronically ill patients in the hospital and outpatient environments. The company is also a leading supplier of medical devices and transfusion technology products. In the biosimilars business, Fresenius Kabi develops products with a focus on oncology and autoimmune diseases.12
• North America with healthy organic sales growth; EBIT growth only hindered by a non-cash one-time effect
• Solid organic sales growth in Europe supported by ongoing recovery of elective treatments
• Continued strong Emerging Markets growth driven primarily by Latin America; China slowing down due to price effects post successful participation in VBP tenders
• EBIT outlook3 for FY/21 improved
Sales increased by 9% (8% in constant currency) to €1,854 million (Q3/20: €1,694 million).
Organic growth was 8%. In Q1-3/21, sales increased by 4% (7% in constant currency) to
€5,370 million (Q1-3/20: €5,161 million). Organic growth was 6%. Negative currency
translation effects of 3% in Q1-3 were mainly related to the weakness of the US dollar, the
Argentinian peso and the Brazilian real.
Sales in North America increased by 6% (organic: 6%) to €589 million (Q3/20:
€558 million) driven by extra demand for COVID-19 related products. In Q1-3/21, sales in
North America decreased by 9% (organic: -4%) to €1,669 million (Q1-3/20: €1,827 million).
Sales in Europe increased by 7% (organic: 5%) to €620 million (Q3/20: €581 million)
supported by the ongoing recovery of elective treatments. In Q1-3/21, sales in Europe
increased by 6% (organic: 5%) to €1,880 million (Q1-3/20: €1,778 million).
1 Before special items 2 Net income attributable to shareholders of Fresenius SE & Co. KGaA 3 In constant currency For a detailed overview of special items please see the reconciliation tables on page 20.
Sales in Asia-Pacific increased by 12% (organic: 8%) to €447 million (Q3/20: €399 million)
mainly due to normalizing elective treatment activity in the region. In China, organic growth
is slowing down due to initial negative price effects from successful participation in VBP
(Volume-Based Purchasing) tenders as well as the demanding prior-year base. In Q1-3/21,
sales in Asia-Pacific increased by 17% (organic: 16%) to €1,248 million (Q1-3/20:
€1,069 million).
Sales in Latin America/Africa increased by 27% (organic: 27%) to €198 million
(Q3/20: €156 million) due to ongoing COVID-19 related extra demand. In Q1-3/21, sales in
Latin America/Africa increased by 18% (organic: 26%) to €573 million (Q1-3/20: €487
million).
EBIT1 increased by 8% (7% in constant currency) to €300 million (Q3/20: €278 million) with
an EBIT margin of 16.2% (Q3/20: 16.4%). The increase in constant currency was primarily
driven by the Emerging Markets and European businesses, tempered by an IP R&D write-off
in North America. Adjusted for this one-time effect, North America returned to healthy
growth. EBIT was supported by positive COVID-19 effects. In Q1-3/21, EBIT1 increased by
2% (5% in constant currency) to €874 million (Q1-3/20: €859 million) with an EBIT margin
of 16.3% (Q1-3/20: 16.6%).
Net income1,2 increased by 9% (9% in constant currency) to €206 million (Q3/201:
€189 million). In Q1-3/21, net income1,2 increased by 3% (7% in constant currency) to
€600 million (Q1-3/201: €582 million).
Operating cash flow increased to €393 million (Q3/20: €225 million) with a margin of
21.2% (Q3/20: 13.3%) mainly due to a healthy operational performance. In Q1-3/21,
operating cash flow increased to €868 million (Q1-3/20: €836 million) with a margin of
16.2% (Q1-3/20: 16.2%).
For FY/21, Fresenius Kabi improves its EBIT outlook. The company now projects EBIT1,3
growth in constant currency around the top end of its low single-digit percentage guidance
range. The company continues to expect organic sales growth4 in a low-to-mid single-digit
percentage range. Both sales and EBIT outlook include expected COVID-19 effects.
1 Before special items 2 Net income attributable to shareholders of Fresenius SE & Co. KGaA 3 FY/20 base: €1,095 million, before special items; FY/21: before special items 4 FY/20 base: €6,976 million For a detailed overview of special items please see the reconciliation tables on page 20.
Fresenius Helios Fresenius Helios is Europe's leading private hospital operator. The company comprises Helios Germany and Helios Spain. Helios Germany operates 89 hospitals, ~130 outpatient centers and 6 prevention centers. Helios Spain operates 47 hospitals, 86 outpatient centers and around 300 occupational risk prevention centers. In addition, the company is active in Latin America with 6 hospitals and as a provider of medical diagnostics and reproduction medicine worldwide.
• Helios Germany with ongoing upward trend for elective treatments
• Treatment activity at Helios Spain above pre-pandemic levels in most medical areas
• Strong results in Latin America
• FY/21 outlook confirmed
Sales increased by 9% (10% in constant currency) to €2,622 million (Q3/20:
€2,400 million). Organic growth was 5%. Acquisitions, including the hospital acquisitions
from the Order of Malta in Germany and the fertility business Eugin (consolidated as from
April 1, 2021) contributed 5% to sales growth. In Q1-3/21, sales increased by 12% (12% in
constant currency) to €8,009 million (Q1-3/20: €7,181 million). Organic growth was 7%.
Acquisitions contributed 5% to sales growth.
Sales of Helios Germany increased by 7% (organic: 3%) to €1,640 million (Q3/20:
€1,529 million) driven by positive price and case mix effects. The hospital acquisitions from
the Order of Malta contributed 4% to sales growth. In Q1-3/21, sales of Helios Germany
increased by 6% (organic: 2%) to €4,988 million (Q1-3/20: €4,703 million).
Sales of Helios Spain increased by 8% (9% in constant currency) to €941 million (Q3/20:
€870 million). Organic growth of 8% was driven by a consistently high level of treatments
and ongoing demand for occupational risk prevention (ORP) services. Furthermore, the
hospitals in Latin America showed a good development and contributed 2% to sales growth.
In Q1-3/21, sales of Helios Spain increased by 19% (20% in constant currency) to €2,937
million (Q1-3/20: €2,476 million). Organic growth was 18%.
1 Before special items 2 Net income attributable to shareholders of Fresenius SE & Co. KGaA For a detailed overview of special items please see the reconciliation tables on page 21.
EBIT1 of Fresenius Helios decreased by 1% (0% in constant currency) to €222 million
(Q3/20: €225 million) due to the demanding prior-year base at Helios Spain. The EBIT1
margin was 8.5% (Q3/20: 9.4%). In Q1-3/21, EBIT1 of Fresenius Helios increased by 13%
(14% in constant currency) to €788 million (Q1-3/20: €697 million) with an EBIT margin1 of
9.8% (Q1-3/20: 9.7%).
EBIT1 of Helios Germany increased by 5% to €140 million (Q3/20: €133 million) with an
EBIT margin1 of 8.5% (Q3/20: 8.7%). In Q1-3/21, EBIT1 of Helios Germany decreased by
1% to €442 million (Q1-3/20: €445 million) with an EBIT margin1 of 8.9% (Q1-3/20: 9.5%).
EBIT of Helios Spain decreased by 17% (-17% in constant currency) to €79 million (Q3/20:
€95 million) due to an exceptional Q3/20 driven by post-lock-down catch-up effects. In
addition, higher costs for personnel, personal protective equipment and selected medical
products, among others, had a negative impact. The EBIT margin was 8.4% (Q3/20:
10.9%). The hospital acquisitions in Colombia contributed nicely. In Q1-3/21, EBIT of Helios
Spain increased by 35% (36% in constant currency) to €352 million (Q1-3/20: €261 million)
with an EBIT margin of 12.0% (Q1-3/20: 10.5%).
Net income1,2 decreased by 5% (-4% in constant currency) to €135 million (Q3/20: €142
million). In Q1-3/21, net income1,2 increased by 14% (15% in constant currency) to €501
million (Q1-3/20: €441 million).
Operating cash flow decreased to €157 million (Q3/20: €275 million) with a margin of
6.0% (Q3/20: 11.5%) as the previous year was supported by the accelerated payment
scheme under the German law to ease the financial burden on hospitals. In Q1-3/21,
operating cash flow decreased to €595 million (Q1-3/20: €715 million) with a margin of
7.4% (Q1-3/20: 10.0%).
For FY/21, Fresenius Helios confirms its outlook. The company expects organic sales3 growth
in a mid single-digit percentage range. EBIT4 is projected to grow in a high single-digit
percentage range in constant currency. Both sales and EBIT outlook include expected COVID-
19 effects.
1 Before special items 2 Net income attributable to shareholders of Fresenius SE & Co. KGaA 3 FY/20 base: €9,818 million 4 FY/20 base: €1,025 million; FY/21 before special items For a detailed overview of special items please see the reconciliation tables on page 21.
Fresenius Vamed manages projects and provides services for hospitals and other health care facilities worldwide and is a leading post-acute care provider in Central Europe. The portfolio ranges along the entire value chain: from project development, planning, and turnkey construction, via maintenance and technical management to total operational management.1
Fresenius is a global health care group, providing products and services for dialysis, hospital and outpatient medical care. In 2020, Group sales were €36.3 billion. On September 30, 2021, the Fresenius Group had 314,852 employees worldwide. For more information visit the Company’s website at www.fresenius.com. Follow us on Twitter: www.twitter.com/fresenius_ir Follow us on LinkedIn: www.linkedin.com/company/fresenius-investor-relations This release contains forward-looking statements that are subject to various risks and uncertainties. Future results could differ materially from those described in these forward-looking statements due to certain factors, e.g. changes in business, economic and competitive conditions, regulatory reforms, results of clinical trials, foreign exchange rate fluctuations, uncertainties in litigation or investigative proceedings, and the availability of financing. Fresenius does not undertake any responsibility to update the forward-looking statements in this release. Fresenius SE & Co. KGaA Registered Office: Bad Homburg, Germany Commercial Register: Amtsgericht Bad Homburg, HRB 11852 Chairman of the Supervisory Board: Wolfgang Kirsch General Partner: Fresenius Management SE Registered Office: Bad Homburg, Germany Commercial Register: Amtsgericht Bad Homburg, HRB 11673 Management Board: Stephan Sturm (Chairman), Dr. Sebastian Biedenkopf, Dr. Francesco De Meo, Rachel Empey, Rice Powell, Michael Sen, Dr. Ernst Wastler Chairman of the Supervisory Board: Wolfgang Kirsch
Consolidated results for Q3/21 and Q1-3/21 as well as for Q3/20 and Q1-3/20 include special items. The special items shown within the reconciliation tables are reported in the Corporate segment. Fresenius Group Q3/21 and Q1-3/21
€ in millions Q3/2021 Q3/2020 Growth rate
Growth rate in constant
currency Q1-3/2021 Q1-3/2020 Growth rate
Growth rate in constant
currency
Sales reported 9,324 8,918 5% 5% 27,554 26,973 2% 5% EBIT reported (after special items) 1,008 1,113 -9% -9% 3,035 3,361 -10% -6% Expenses associated with the Fresenius cost and efficiency program 33 - 45 - EBIT (before special items) 1,041 1,113 -6% -6% 3,080 3,361 -8% -5% Net interest reported (after special items) -126 -154 18% 18% -384 -503 24% 22% Revaluations of biosimilars contingent purchase price liabilities - - - 8 Net interest (before special items) -126 -154 18% 18% -384 -495 22% 20% Income taxes reported (after special items) -201 -211 5% 4% -591 -648 9% 6% Revaluations of biosimilars contingent purchase price liabilities - - - -3 Expenses associated with the Fresenius cost and efficiency program -9 - -13 - Income taxes (before special items) -210 -211 0% 0% -604 -651 7% 4% Noncontrolling interest reported (after special items) -268 -321 17% 17% -741 -913 19% 15% Expenses associated with the Fresenius cost and efficiency program -2 - -6 - Noncontrolling interest (before special items) -270 -321 16% 16% -747 -913 18% 14% Net income reported (after special items)1 413 427 -3% -3% 1,319 1,297 2% 5% Revaluations of biosimilars contingent purchase price liabilities - - - 5 Expenses associated with the Fresenius cost and efficiency program 22 - 26 - Net income (before special items)1 435 427 2% 2% 1,345 1,302 3% 6%
1 Net income attributable to shareholders of Fresenius SE & Co. KGaA
1 Before costs related to FME25 program 2 Before expenses associated with the Fresenius cost and efficiency program 3 Before revaluations of biosimilars contingent purchase price liabilities 4 After expenses associated with the Fresenius cost and efficiency program 5 After revaluations of biosimilars contingent purchase price liabilities
1 2020: December 31 2 Before costs related to FME25 program 3 Before expenses associated with the Fresenius cost and efficiency program 4 Before revaluations of biosimilars contingent purchase price liabilities 5 After expenses associated with the Fresenius cost and efficiency program 6 After revaluations of biosimilars contingent purchase price liabilities 7 The underlying pro forma EBIT does not include revaluations of biosimilars contingent purchase price liabilities, impairment of Goodwill at FMC Latin America and expenses associated with the Fresenius cost and efficiency program. 8 The underlying pro forma EBIT does not include revaluations of biosimilars contingent purchase price liabilities and impairment of Goodwill at FMC Latin America.
1 Related to the respective external sales of the business segments. Consolidation effects and corporate entities are not taken into account. Therefore, aggregation to total Group sales is not possible.
Group sales by region
€ in millions Q3/2021 Q3/2020 Growth
Currency translation
effects
Growth at constant
rates Organic
sales growth Acquisitions /
divestitures % of total
sales
North America 3,674 3,613 2% 0% 2% 1% 1% 39% Europe 4,098 3,869 6% 0% 6% 4% 2% 44% Asia-Pacific 984 953 3% 2% 1% 1% 0% 11% Latin America 462 401 15% -7% 22% 19% 3% 5% Africa 106 82 29% 7% 22% 22% 0% 1% Total 9,324 8,918 5% 0% 5% 3% 2% 100%
€ in millions Q1-3/2021 Q1-3/2020 Growth
Currency translation
effects
Growth at constant
rates Organic
sales growth Acquisitions /
divestitures % of total
sales
North America 10,606 11,283 -6% -6% 0% -1% 1% 39% Europe 12,443 11,608 7% 0% 7% 5% 2% 45% Asia-Pacific 2,858 2,647 8% -1% 9% 9% 0% 10% Latin America 1,336 1,161 15% -13% 28% 24% 4% 5% Africa 311 274 14% 4% 10% 10% 0% 1% Total 27,554 26,973 2% -3% 5% 4% 1% 100%