25
DOWNER HALF YEAR RESULTS Investor presentation | 2 February 2017

DOWNER HALF YEAR RESULTS Investor presentation | 2 February 2017

OVERVIEW
Total revenue1 $3,603.0 million, up 1.7%
Work in hand2 $21.1 billion, up from $18.6 billion at 30 June 2016
1 Total revenue is a non-statutory disclosure and includes revenue from joint ventures and other alliances and other income.
2 Work-in-hand numbers are unaudited.
3 Adjusted for the mark-to-market of derivatives and deferred finance charges.
4 Gearing = Net debt / net debt + equity. Gearing including off-balance sheet debt based on present value of plant and equipment operating leases discounted at 10% pa: $122.5m (June 2016: $128.5m).
5 Lost Time Injury Frequency Rate - the number of lost time injuries (LTIs) per million hours worked.
6 Total Recordable Injury Frequency Rate – the number of LTIs and medically treated injuries per million hours worked.
Net Profit After Tax (NPAT) $78.2 million, up 8.5%
Earnings Before Interest and Tax (EBIT) $120.8 million, up 6.7%
Operating cash flow $243.6 million, EBITDA conversion 102.6%
Net debt3 $22.2 million, down from $87.4 million at 30 June 2016
Interim dividend declared: 12.0 cps, 100% franked no Dividend Reinvestment Plan
LTIFR5 of 0.55, down from 0.84 at 31 December 2015 TRIFR6 of 3.61, down from 3.67 at 31 December 2015
Return on Funds Employed (ROFE) 13.0%, up from 12.5%
Gearing4 1.0%, (6.4% including off-balance sheet debt)
2
Full year NPAT outlook increased from $163 million to around $175 million

TRANSPORT SERVICES
OPPORTUNITIES
1 Total revenue includes joint ventures and other income.
2 ROFE = EBIT divided by average funds employed (AFE). AFE = Average Opening and Closing Net Debt + Equity.
Total revenue1 $m EBIT margin EBIT $m ROFE2
41.4
31.6
0
10
20
30
40
50
HY17 HY16
4.5% 3.9%
0.0%
1.0%
2.0%
3.0%
4.0%
5.0%
6.0%
HY17 HY16
21.0%
16.1%
0%
5%
10%
15%
20%
25%
HY17 HY16
911.2 802.9
0
200
400
600
800
1,000
HY17 HY16
3
Revenue increase of 13% driven by new projects, road maintenance and RPQ acquisition Continuing strong performance for customers on existing contracts Contribution from new projects including Newcastle Light Rail, NSW Transport Access Program Acquisition of RPQ provides further geographical presence and capability mix Numerous contract wins in Australia and New Zealand Performance in the previous corresponding period affected by inclement weather

TECHNOLOGY AND COMMUNICATIONS SERVICES
1 Total revenue includes joint ventures and other income.
2 ROFE = EBIT divided by average funds employed (AFE). AFE = Average Opening and Closing Net Debt + Equity.
Total revenue1 $m EBIT margin EBIT $m ROFE2
245.9 249.9
0
50
100
150
200
250
300
HY17 HY16
21.7
14.1
0
5
10
15
20
25
30
HY17 HY16
8.8%
5.6%
0%
2%
4%
6%
8%
10%
HY17 HY16
157.3%
58.9%
0%
50%
100%
150%
200%
HY17 HY16
4
Improved earnings performance despite reduced revenue Strong contribution from nbnTM contracts with increased volumes A number of new contracts awarded including Telstra Wideband

UTILITIES SERVICES
1 Total revenue includes joint ventures and other income.
2 ROFE = EBIT divided by average funds employed (AFE). AFE = Average Opening and Closing Net Debt + Equity.
Total revenue1 $m EBIT margin EBIT $m ROFE2
442.3 376.5
0
100
200
300
400
500
HY17 HY16
20.8 22.8
0
5
10
15
20
25
HY17 HY16
4.7%
6.1%
0%1%2%3%4%5%6%7%
HY17 HY16
10.8%
13.2%
0%2%4%6%8%
10%12%14%
HY17 HY16
5
Revenue increase of 18% driven by new and existing contracts EBIT reduced by completion of major gas and power projects in the previous corresponding period Good performance across Power and Gas distribution, stronger performance by Water business Awarded Clare Solar Farm contract (December 2016); well positioned for the large pipeline of renewable projects Advisory role with Ausgrid Positioned well for services to privatised and Government owned power assets

RAIL
1 Total revenue includes joint ventures and other income.
2 ROFE = EBIT divided by average funds employed (AFE). AFE = Average Opening and Closing Net Debt + Equity.
Total revenue1 $m EBIT margin EBIT $m ROFE2
399.7 420.1
0
100
200
300
400
500
HY17 HY16
14.0
4.5
0.02.04.06.08.0
10.012.014.016.0
HY17 HY16
3.5%
1.1%
0%
1%
2%
3%
4%
HY17 HY16
5.4%
3.6%
0%
1%
2%
3%
4%
5%
6%
HY17 HY16
6
Continuing strong performance on maintenance contracts e.g. Waratah TLS and Millennium Improved performance by joint ventures Improved depot performance driven by restructuring in the previous corresponding period Awarded three major contracts: High Capacity Metro Trains in Victoria; Sydney Growth Trains in NSW;
Transport for Newcastle (Keolis Downer)

1 Total revenue includes joint ventures and other income.
2 ROFE = EBIT divided by average funds employed (AFE). AFE = Average Opening and Closing Net Debt + Equity.
Total revenue1 $m EBIT margin EBIT $m ROFE2
27.1
20.6
0
5
10
15
20
25
30
HY17 HY16
2.8% 2.2%
0%
1%
2%
3%
4%
5%
HY17 HY16
25.1% 21.2%
0%
5%
10%
15%
20%
25%
30%
HY17 HY16
973.4 927.8
0
200
400
600
800
1000
1200
HY17 HY16
ENGINEERING, CONSTRUCTION & MAINTENANCE
7
Continuing strong performance at Gorgon and Wheatstone EBIT result benefited from restructuring in FY16 Improved result from consultancies (QCC and MT) Expansion of Defence footprint through acquisition of AGIS
MINING
1 Total revenue includes joint ventures and other income.
2 ROFE = EBIT divided by average funds employed (AFE). AFE = Average Opening and Closing Net Debt + Equity.
Total revenue1 $m EBIT margin EBIT $m ROFE2
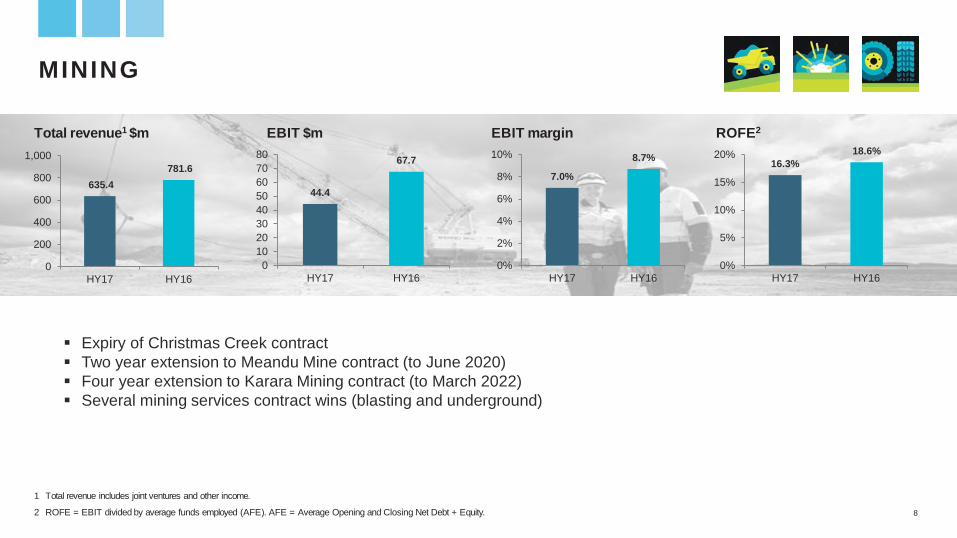
635.4 781.6
0
200
400
600
800
1,000
HY17 HY16
44.4
67.7
01020304050607080
HY17 HY16
7.0%
8.7%
0%
2%
4%
6%
8%
10%
HY17 HY16
16.3% 18.6%
0%
5%
10%
15%
20%
HY17 HY16
8
Expiry of Christmas Creek contract Two year extension to Meandu Mine contract (to June 2020) Four year extension to Karara Mining contract (to March 2022) Several mining services contract wins (blasting and underground)


FINANCIAL PERFORMANCE
1 Total revenue includes joint ventures and other income.
2 ROFE = EBIT divided by average funds employed (AFE); AFE = Average Opening and Closing Net Debt + Equity.
$m HY17 HY16 Change (%)
Total revenue1 3,603.0 3,543.4 1.7
EBITDA 225.8 241.2 (6.4)
EBIT 120.8 113.2 6.7
Net interest expense (13.7) (15.8) 13.3
Tax expense (28.9) (25.3) (14.2)
Net profit after tax 78.2 72.1 8.5
EBIT margin 3.4% 3.2% 0.2
Effective tax rate 27.0% 26.0% 1.0
ROFE2 13.0% 12.5% 0.5 Dividend declared (cents per share) 12.0 12.0 -
Ordinary Dividend payout ratio 69.0% 76.5% (7.5)
10

$m Total Transport Tech & Comm Utilities Rail EC&M Mining Corp
Statutory EBIT 120.8 41.4 21.7 20.8 14.0 27.1 44.4 (48.6)
New Intercity Fleet bid costs 10.0 10.0
Settlement of contractual claims 5.0 5.0
Contract closure (6.5) (6.5)
Adjusted EBIT (approx) 129.3 41.4 21.7 20.8 14.0 27.1 37.9 (33.6)
SUMMARY OF EARNINGS
11

UNALLOCATED COSTS (CORPORATE COSTS)
$m HY17 HY16
R&D incentives 4.2 5.0
New Intercity Fleet bid costs (10.0) -
Capital Metro bid costs - (13.0)
Settlement of contractual claims (5.0) -
Corporate costs (37.8) (40.1)
Total unallocated (48.6) (48.1)
12

OPERATING CASH FLOW
1 Interest and other costs of finance paid minus interest received.
$m HY17 HY16
EBIT 120.8 113.2
Add: depreciation & amortisation 105.0 128.0
EBITDA 225.8 241.2
Operating cash flow 243.6 178.1
Add: Net interest paid1 13.2 11.2
Tax received (25.1) (34.2)
Adjusted operating cash flow 231.7 155.1
EBITDA conversion 102.6% 64.3%
Add back project claims - 65.0
Underlying operating cash flow 231.7 220.1
Normalised EBITDA conversion 102.6% 91.3%
13

CASH FLOW
1 As at 31 December 2015, Downer had bought back 1.8 million shares, reducing the total number of shares outstanding to 430.9 million.
2 Refer to slide 24 for details.
$m HY17 HY16
Total operating 243.6 178.1
Net capital expenditure (54.4) (100.0)
AGIS and RPQ acquisitions (52.6) -
IT Transformation and Other (16.4) (23.5)
Total investing (123.4) (123.5)
On-market share buy-back1 - (6.4)
Net (repayment)/ proceeds of borrowings (32.8) 124.1
Dividends paid (55.3) (56.7)
Total financing (88.1) 61.0
Net increase in cash held 32.1 115.6
Cash at 31 December 602.1 489.5
Total liquidity2 1,087.1 1,017.5
14

DEBT MATURITY PROFILE
15 1. Undrawn $485m. June 2016 undrawn facility was $525m with $40m re-allocated to bonding facilities
0
100
200
300Ju
n-17
Dec
-17
Jun-
18
Dec
-18
Jun-
19
Dec
-19
Jun-
20
Dec
-20
Jun-
21
Dec
-21
Jun-
22
Dec
-22
Jun-
23
Dec
-23
Jun-
24
Dec
-24
Jun-
25
Dec
-25
A$m
Equ
ival
ent
Weighted average debt duration (Dec 2016) = 3.96 years (Jun 2016) = 4.25 years
By Limit (at 31 Dec 2016)
USPP
Finance leases
ECA finance
A$MTN
Syndicated bank facility
Bilateral bank facilities
1
1

BALANCE SHEET AND CAPITAL MANAGEMENT
1 Adjusted for the mark-to-market of derivatives and deferred finance charges. 2 Includes the present value of plant and equipment operating leases discounted at 10% pa: $122.5m (2016: $128.5m). 3 Adjusted Net Debt Includes Net Debt plus 6x operating lease expenses in the year. Adjusted EBITDAR equals underlying earnings before interest, tax, depreciation, amortisation and
operating lease expense (on a rolling 12 month basis).
$m Dec 16 Jun 16
Total assets 4,125.7 4,200.3
Total shareholders’ equity 2,118.4 2,088.5
Net debt1 22.2 87.4
Gearing: net debt to net debt plus equity 1.0% 4.0%
Gearing (including off balance sheet debt)2 6.4% 9.4%
Debtor days 20.8 23.6
WIP days 30.5 34.1
Creditor days 31.6 37.2
Interest cover 9.5 x 8.8 x
Net Debt / EBITDA 0.04 0.2 Adjusted Net Debt / adjusted EBITDAR3 1.5 x 1.6 x
16


11%
25%
12% 18%
27%
7%
Rail
Transport Services
Utilities Services
Mining
EC&M
Technology & Communications Services
18
DOWNER REVENUE BASE
42%
58%
Public
Private

WORK-IN-HAND: $21.1 BILLION
By Contract Type – December 2016 By Service Line – December 2016
19
25%
17%
7% 10%
34%
7%
Transport ServicesUtilities ServicesEC&MMiningRailTechnology & Communications Services
35%
20%
40%
2% 3%
Schedule of RatesRecurringLump Sum / Fixed PriceAlliance / Target CostCost Plus

WORK-IN-HAND: BOOSTED BY RECENT RAIL WINS
20
$m
0
5,000
10,000
15,000
20,000
25,000
FY14 FY15 FY16 Dec-16

WORK-IN-HAND BY SERVICE LINE
$m
21
0
1,000
2,000
3,000
4,000
5,000
6,000
7,000
8,000
Transport Utilities EC&M Mining Rail T&C
Jun-16 Dec-16

OUTLOOK
22
Downer is targeting NPAT of around $175 million for the 2017 financial year.


DEBT AND BONDING FACILITIES
1 1 Including A$ Medium Term Notes sold to Asian and European domiciled investors measured at financial close of the transaction.
Debt facilities $m Total facilities 1,109.3
Drawn (624.3)
Available facilities 485.0
Cash 602.1
Total liquidity 1,087.1
Bonding facilities $m Total facilities 1,629.1
Drawn (805.5)
Available facilities 823.6
Debt facilities by type % Syndicated bank facility 36
A$MTN 36
USPP 15
Bilateral bank facilities 8
ECA finance 3
Finance leases & other 2
100
Debt facilities by geography % Australia / NZ 50
North America 23
Asia1 22
Europe1 5
100
24

SEGMENT REPORTING
HY17
$m
Transport Services
Technology and Communications
Services
Utilities Services Rail EC&M Mining Unallocated Total
Segment revenue 885.5 245.9 442.3 202.0 951.6 612.2 (4.9) 3,334.6
Share of sales from JVs and Associates1 25.7 - - 197.7 21.8 23.2 - 268.4
Total revenue1 911.2 245.9 442.3 399.7 973.4 635.4 (4.9) 3,603.0
EBIT 41.4 21.7 20.8 14.0 27.1 44.4 (48.6) 120.8
EBIT margin 4.5% 8.8% 4.7% 3.5% 2.8% 7.0% - 3.4%
HY16
$m Transport
Services
Technology and Communications
Services
Utilities Services Rail EC&M Mining Unallocated Total
Segment revenue 771.8 249.9 376.5 211.5 912.1 758.2 (15.4) 3,264.6
Share of sales from JVs and Associates1 31.1 - - 208.6 15.7 23.4 - 278.8
Total revenue1 802.9 249.9 376.5 420.1 927.8 781.6 (15.4) 3,543.4
EBIT 31.6 14.1 22.8 4.5 20.6 67.7 (48.1) 113.2
EBIT margin 3.9% 5.6% 6.1% 1.1% 2.2% 8.7% - 3.2% 1 This is a non-statutory disclosure as it relates to/includes Downer’s share of revenue from equity accounted joint ventures and associates.
25


