31
1 Investor Presentation Daryl N. Bible Third Quarter 2019
1
Investor Presentation
Daryl N. Bible
Third Quarter 2019
2
Forward-Looking / Non-GAAP Statements
Cautionary Note Regarding Forward-Looking Statements
This communication contains “forward-looking statements” within the meaning of the Private Securities Litigation Reform Act of 1995 regarding the financial condition, results of operations, business plans and the future performance of BB&T and SunTrust. Words such as “anticipates,” “believes,” “estimates,” “expects,” “forecasts,” “intends,” “plans,” “projects,” “could,” “may,” “should,” “will” or other similar words and expressions are intended to identify these forward-looking statements. These forward-looking statements are based on BB&T’s and SunTrust’s current expectations and assumptions regarding BB&T’s and SunTrust’s businesses, the economy, and other future conditions. Because forward-looking statements relate to future results and occurrences, they are subject to inherent uncertainties, risks, and changes in circumstances that are difficult to predict. Many possible events or factors could affect BB&T’s or SunTrust’s future financial results and performance and could cause actual results or performance to differ materially from anticipated results or performance. Such risks and uncertainties include, among others: the occurrence of any event, change or other circumstances that could give rise to the right of one or both of the parties to terminate the definitive merger agreement between BB&T and SunTrust, the outcome of any legal proceedings that may be instituted against BB&T or SunTrust, delays in completing the transaction, the failure to obtain necessary regulatory approvals (and the risk that such approvals may result in the imposition of conditions that could adversely affect the combined company or the expected benefits of the transaction) or to satisfy any of the other conditions to the transaction on a timely basis or at all, the possibility that the anticipated benefits of the transaction are not realized when expected or at all, including as a result of the impact of, or problems arising from, the integration of the two companies or as a result of the strength of the economy and competitive factors in the areas where BB&T and SunTrust do business, the possibility that the transaction may be more expensive to complete than anticipated, including as a result of unexpected factors or events, diversion of management’s attention from ongoing business operations and opportunities, potential adverse reactions or changes to business or employee relationships, including those resulting from the announcement or completion of the transaction, the ability to complete the transaction and integration of BB&T and SunTrust successfully, and the dilution caused by BB&T’s issuance of additional shares of its capital stock in connection with the transaction. Except to the extent required by applicable law or regulation, each of BB&T and SunTrust disclaims any obligation to update such factors or to publicly announce the results of any revisions to any of the forward-looking statements included herein to reflect future events or developments. Further information regarding BB&T, SunTrust and factors which could affect the forward-looking statements contained herein can be found in BB&T’s Annual Report on Form 10-K for the fiscal year ended December 31, 2018, as updated by its Quarterly Reports on Form 10-Q, and its other filings with the Securities and Exchange Commission (“SEC”), and in SunTrust’s Annual Report on Form 10-K for the fiscal year ended December 31, 2018, as updated by its Quarterly Reports on Form 10-Q, and its other filings with the SEC.
Non-GAAP Financial Measures
This presentation contains certain non-GAAP financial measures that are not in accordance with U.S. generally accepted accounting principles (GAAP). BB&T and SunTrust use certain non-GAAP financial measures to provide meaningful, supplemental information regarding their operational results and to enhance investors’ overall understanding of BB&T’s and SunTrust’s financial performance. The limitations associated with non-GAAP financial measures include the risk that persons might disagree as to the appropriateness of items comprising these measures and that different companies might calculate these measures differently. These disclosures should not be considered an alternative to BB&T’s and SunTrust’s GAAP results.
2
3
Additional Statements
Additional Information about the Merger and Where to Find It
In connection with the proposed merger with SunTrust, BB&T has filed with the SEC a registration statement on Form S-4 to register the shares of BB&T’s capital stock to be issued in connection with the merger, as amended on May 7, 2019, June 14, 2019 and June 19, 2019. The registration statement was declared effective by the SEC on June 19, 2019. BB&T and SunTrust commenced mailing the definitive joint proxy statement/prospectus to shareholders on or about June 27, 2019, and the special meetings of the shareholders of BB&T and SunTrust were held on July 30, 2019.
INVESTORS AND SECURITY HOLDERS ARE URGED TO READ THE REGISTRATION STATEMENT ON FORM S-4, THE JOINT PROXY STATEMENT/PROSPECTUS INCLUDED WITHIN THE REGISTRATION STATEMENT ON FORM S-4 AND ANY OTHER RELEVANT DOCUMENTS FILED OR TO BE FILED WITH THE SEC IN CONNECTION WITH THE PROPOSED TRANSACTION BECAUSE THESE DOCUMENTS DO AND WILL CONTAIN IMPORTANT INFORMATION ABOUT BB&T, SUNTRUST, AND THE PROPOSED TRANSACTION.
Investors and security holders may obtain copies of these documents free of charge through the website maintained by the SEC at www.sec.gov or from BB&T at its website, www.bbt.com, or from SunTrust at its website, www.suntrust.com. Documents filed with the SEC by BB&T will be available free of charge by accessing BB&T’s website at http://bbt.com/ under the tab “About BB&T” and then under the heading “Investor Relations” or, alternatively, by directing a request by telephone or mail to BB&T Corporation, 200 West Second Street, Winston-Salem, North Carolina, 27101, (336) 733-3065, and documents filed with the SEC by SunTrust will be available free of charge by accessing SunTrust’s website at http://suntrust.com/ under the tab “Investor Relations,” and then under the heading “Financial Information” or, alternatively, by directing a request by telephone or mail to SunTrust Banks, Inc., 303 Peachtree Street, N.E., Atlanta, Georgia 30308, (877) 930-8971.
3
4
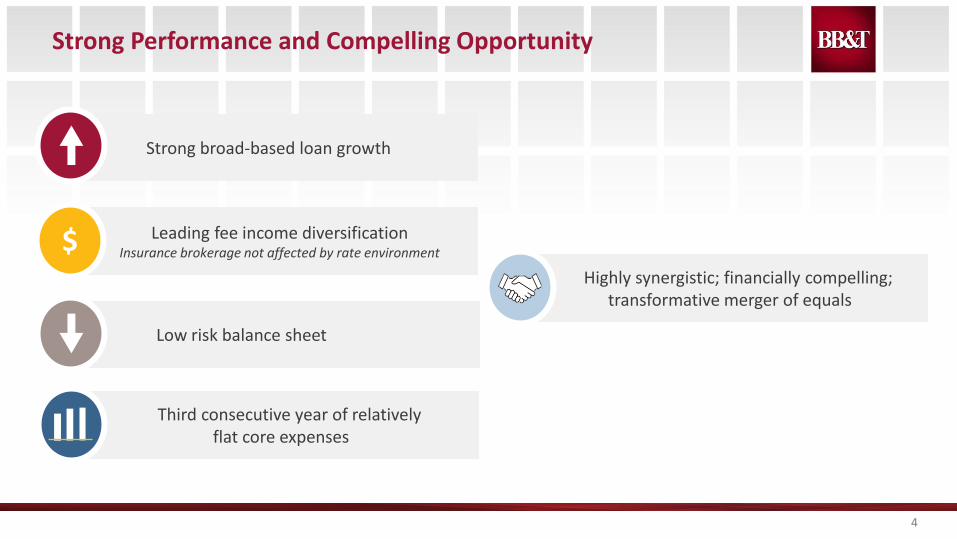
Strong Performance and Compelling Opportunity
Leading fee income diversificationInsurance brokerage not affected by rate environment$
Strong broad-based loan growth
Low risk balance sheet
Third consecutive year of relatively flat core expenses
Highly synergistic; financially compelling; transformative merger of equals
5
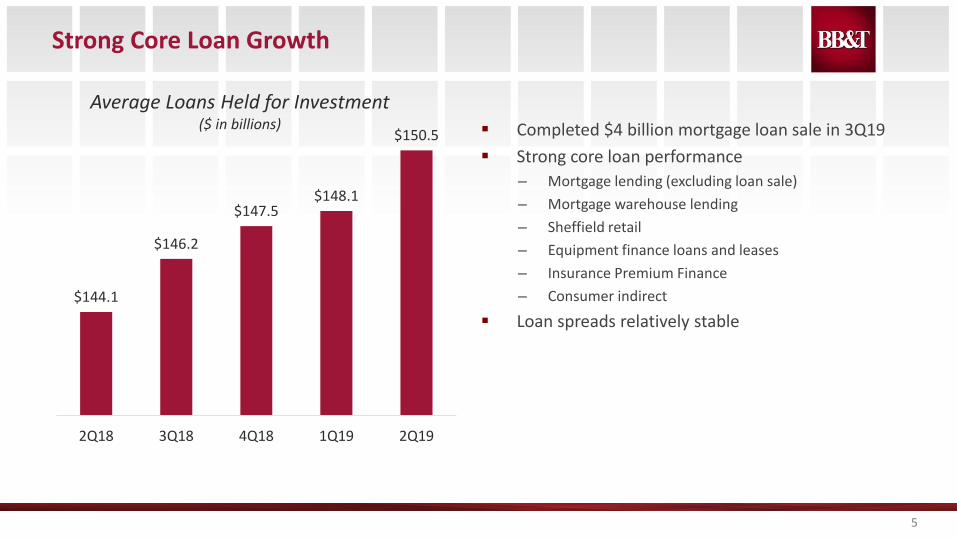
Strong Core Loan Growth
$144.1
$146.2
$147.5$148.1
$150.5
2Q18 3Q18 4Q18 1Q19 2Q19
Completed $4 billion mortgage loan sale in 3Q19
Strong core loan performance
– Mortgage lending (excluding loan sale)
– Mortgage warehouse lending
– Sheffield retail
– Equipment finance loans and leases
– Insurance Premium Finance
– Consumer indirect
Loan spreads relatively stable
Average Loans Held for Investment($ in billions)

6
Leading Fee Income Ratio Provides Diversification
Pee
r 1
BB
T
Pee
r 2
Pee
r 3
Pee
r 4
Pee
r 5
Pee
r 6
Pee
r 7
Pee
r 8
Pee
r 9
Pee
r 1
0
Pee
r 1
1
Pee
r 1
2
Net Interest Income
57%
Noninterest Income
43%
Data as of YTD 06/30/2019Source: S&P Global and company reportsPeers include BAC, CFG, COF, FITB, HBAN, KEY, MTB, PNC, RF, STI, USB and WFC
Fee Income Ratio Relative to PeersRevenue Mix
7
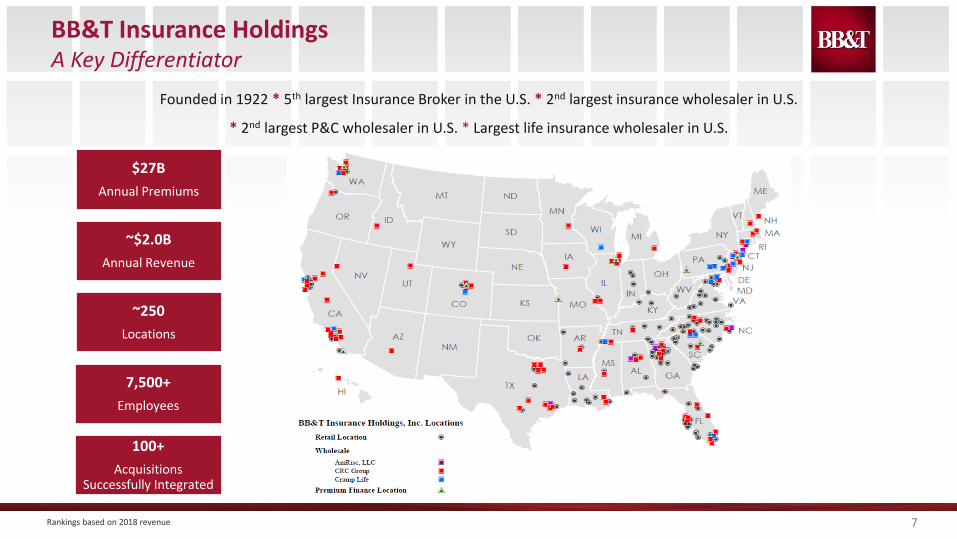
BB&T Insurance HoldingsA Key Differentiator
Founded in 1922 * 5th largest Insurance Broker in the U.S. * 2nd largest insurance wholesaler in U.S.
* 2nd largest P&C wholesaler in U.S. * Largest life insurance wholesaler in U.S.
$27B
Annual Premiums
~$2.0B
Annual Revenue
~250
Locations
7,500+
Employees
100+
Acquisitions Successfully Integrated
Rankings based on 2018 revenue

8
Stress Results Illustrate Risk / Return Advantage of Combination
Peers: BAC, CFG, COF, FITB, HBAN, KEY, MTB, PNC, RF, STI, USB and WFCSource: S&P Global, Dodd-Frank Act Stress Test 2018: Supervisory Stress Test Methodology and Results
0.75%
1.00%
1.25%
1.50%
1.75%
2.00%
2.25%
1.5% 2.0% 2.5% 3.0% 3.5%
% R
etu
rn20
18 A
ctu
al P
PN
R L
ess
2018
Act
ual
Lo
ss R
ate
% Risk(Difference between FRB Severely Adverse Stress Loss Rate and 2018 Actual Loss Rate)
BB&T Risk / Return Positioning vs Peers (2018 DFAST)
Average Return
Ave
rage
Ris
k
(Higher Return, Lower Risk)
(Lower Return, Lower Risk)
(Higher Return, Higher Risk)
(Lower Return, Higher Risk)
Simple average of BBT + STI + $1.6bn in cost saves

9
Relatively Flat Expenses Drive Strong Efficiency Ratio
Disciplined expense management
Effective execution of Disrupt to Thrive initiatives
– Optimized the branch network / branch closures
– FTE reductions
– Organizational simplification
– Optimized non-branch facilities
– Digital / automation initiatives
Source: S&P Global and company reportsPeers include BAC, CFG, COF, FITB, HBAN, KEY, MTB, PNC, RF, STI, USB and WFC
55.00%
57.00%
59.00%
61.00%
63.00%
65.00%
67.00%
$1,000
$2,000
$3,000
$4,000
$5,000
$6,000
$7,000
2016 2017 2018 YTD 2019
Adjusted Noninterest ExpenseBBT GAAPBBT adjustedAdjusted peer median
Adjusted Noninterest Expense & Efficiency Ratio
10
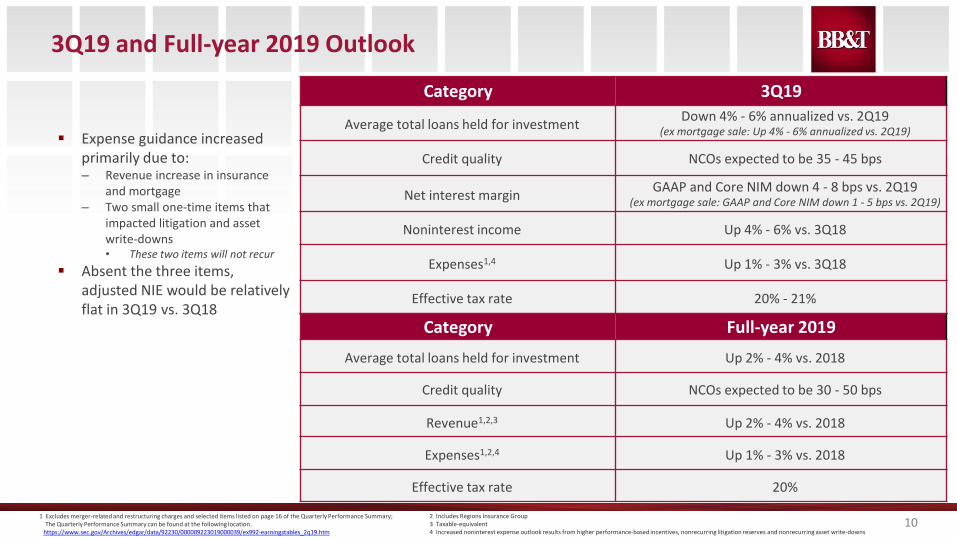
3Q19 and Full-year 2019 Outlook
Category 3Q19
Average total loans held for investmentDown 4% - 6% annualized vs. 2Q19
(ex mortgage sale: Up 4% - 6% annualized vs. 2Q19)
Credit quality NCOs expected to be 35 - 45 bps
Net interest marginGAAP and Core NIM down 4 - 8 bps vs. 2Q19
(ex mortgage sale: GAAP and Core NIM down 1 - 5 bps vs. 2Q19)
Noninterest income Up 4% - 6% vs. 3Q18
Expenses1,4 Up 1% - 3% vs. 3Q18
Effective tax rate 20% - 21%
Category Full-year 2019
Average total loans held for investment Up 2% - 4% vs. 2018
Credit quality NCOs expected to be 30 - 50 bps
Revenue1,2,3 Up 2% - 4% vs. 2018
Expenses1,2,4 Up 1% - 3% vs. 2018
Effective tax rate 20%
1 Excludes merger-related and restructuring charges and selected items listed on page 16 of the Quarterly Performance Summary; The Quarterly Performance Summary can be found at the following location.
https://www.sec.gov/Archives/edgar/data/92230/000009223019000039/ex992-earningstables_2q19.htm
2 Includes Regions Insurance Group3 Taxable-equivalent4 Increased noninterest expense outlook results from higher performance-based incentives, nonrecurring litigation reserves and nonrecurring asset write-downs
Expense guidance increased primarily due to:– Revenue increase in insurance
and mortgage– Two small one-time items that
impacted litigation and asset write-downs• These two items will not recur
Absent the three items, adjusted NIE would be relatively flat in 3Q19 vs. 3Q18

Change in Interest Rates Since the Merger Announcement
Treasury curve re-priced lower with current 2Y to 30Y rates (left chart, blue line) 95-117bps lower compared to February (red), as investors weigh slowing economy and central bank easing
Source: BloombergAs of 08/31/2019 11
Treasury Curve
0.00%
0.50%
1.00%
1.50%
2.00%
2.50%
3.00%
3.50%
Feb-19 Sep-19

The World Has
……Changed
12
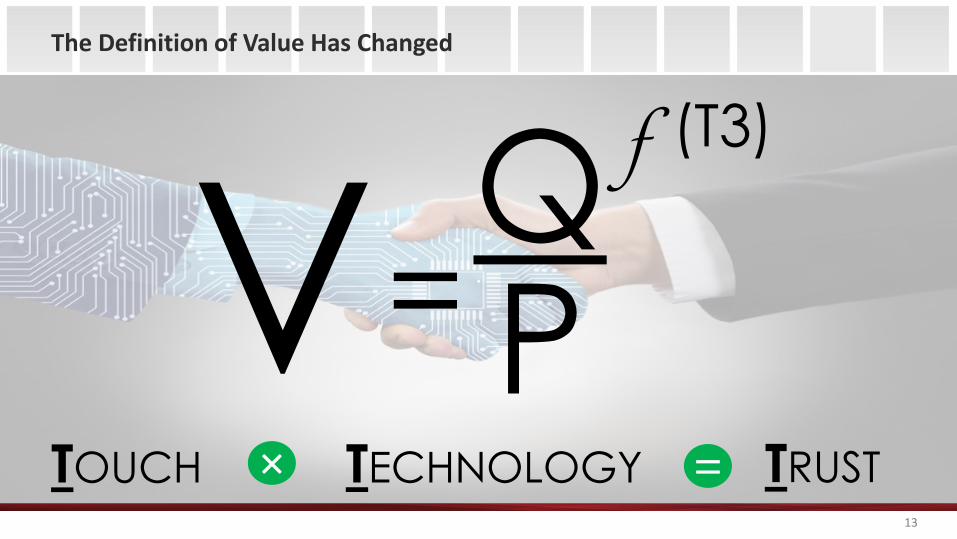
The Definition of Value Has Changed
13
.
13
QP
(T3)
V=TOUCH TECHNOLOGY TRUST=×
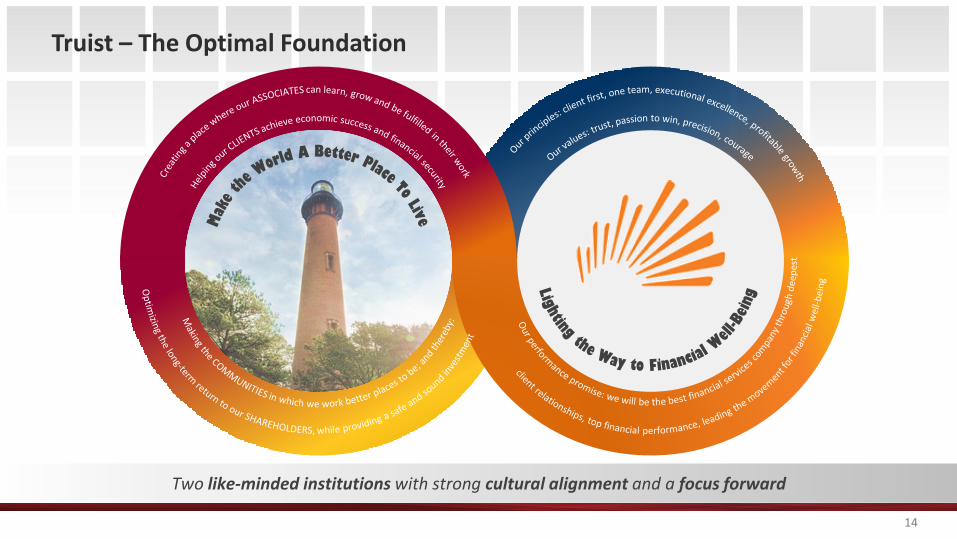
Truist – The Optimal Foundation
Two like-minded institutions with strong cultural alignment and a focus forward
14
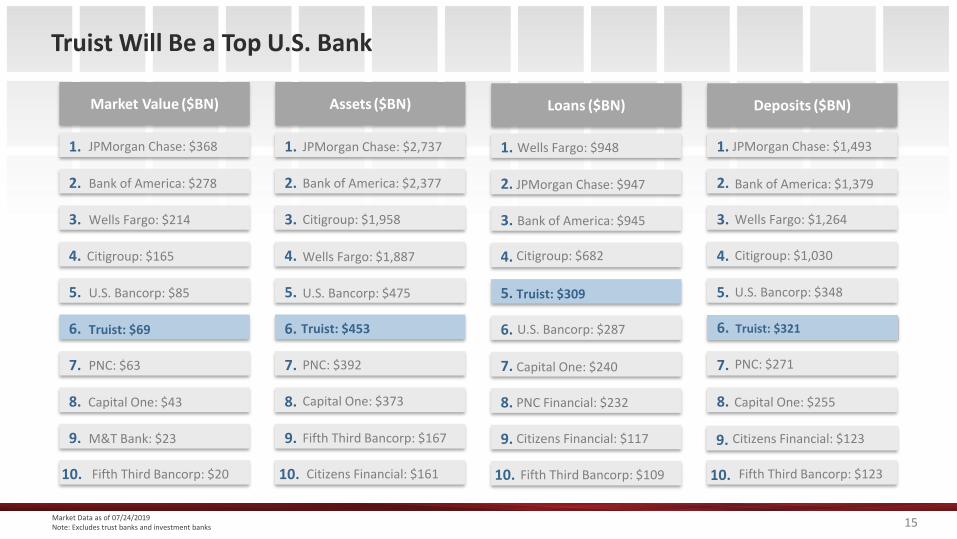
Truist Will Be a Top U.S. Bank
Market Value ($BN) Assets ($BN) Loans ($BN) Deposits ($BN)
1.
2.
3.
4.
5.
6.
7.
8.
9.
10.
1.
2.
3.
4.
5.
6.
7.
8.
9.
10.
1.
2.
3.
4.
5.
6.
7.
8.
9.
10.
1.
2.
3.
4.
5.
7.
8.
9.
10.
Market Data as of 07/24/2019Note: Excludes trust banks and investment banks
JPMorgan Chase: $368
Bank of America: $278
Wells Fargo: $214
Citigroup: $165
U.S. Bancorp: $85
Truist: $69
PNC: $63
Capital One: $43
M&T Bank: $23
Fifth Third Bancorp: $20
JPMorgan Chase: $2,737
Bank of America: $2,377
Citigroup: $1,958
Wells Fargo: $1,887
U.S. Bancorp: $475
Truist: $453
Capital One: $373
PNC: $392
Fifth Third Bancorp: $167
Citizens Financial: $161
Wells Fargo: $948
JPMorgan Chase: $947
Bank of America: $945
Citigroup: $682
Truist: $309
U.S. Bancorp: $287
Capital One: $240
PNC Financial: $232
Citizens Financial: $117
Fifth Third Bancorp: $109
JPMorgan Chase: $1,493
Bank of America: $1,379
Wells Fargo: $1,264
Citigroup: $1,030
U.S. Bancorp: $348
PNC: $271
Capital One: $255
Citizens Financial: $123
Fifth Third Bancorp: $123
15
6. Truist: $321

Truist has a #2 Weighted Average Deposit Rank in
its top 20 MSAs
Truist’s Attractive Southeast Footprint
16Note: Branch and deposit data as of 6/30/18 FDIC summary of deposits, pro forma for M&A through 1/31/19 Source: S&P Global

5.3% 5.3%4.9%
3.5% 3.5%
2.3% 2.2% 2.0% 1.9% 1.8% 1.6%
Truist WFC BAC USB RF KEY FITB HBAN CFG PNC MTB
Projected Population Growth (’19E – ’24E)2
67% 66%55%
45%37% 36% 33% 32%
25% 25% 24%
Truist WFC BAC HBAN RF USB FITB PNC KEY MTB CFG
% of Footprint with Top 3 Market Rank1
Strongest Presence in High Growth Markets
1 Per respective county footprint. 2 County-weighted footprint. 17

A Powerful Combination
18
Efficiency Ratio(2)
# of Households (MM)
Leading Market Position Across Diverse Set of Businesses
Market Value ($BN)
Assets ($BN)
Loans ($BN)
Deposits ($BN)
ROATCE
Combined Company
#2 weighted average deposit rank in Top 20 MSAs
#1 regional bank-owned investment bank
#2 regional bank mortgage originator and servicer
#5 global insurance broker
$311BNwealthand institutional client invested assets
5.3 5.1
BB&T SunTrust
~10 Fastest growing footprint among peers(4)
$37 $26 $76(1) 6th largest U.S. bank
$226 $216 $442 6th largest U.S. bank
57% 60% #1 of 11 (peer group)51%(3)
$149 $152 $301 largest U.S. bank5th
$161 $163 $324 largest U.S. bank6th
20% 17% 22%(3) of 11 (peer group)#1
(1): Includes value of net cost savings ($1.6BN net pre-tax, 24% tax rate) at 11.5x and $2.0BN pre-tax one-time restructuring charge, see Appendix for reconciliation. (2): Reflects adjusted tangible efficiency ratio (FTE), see non-GAAP reconciliations. (3): Illustrative combined ratios for 2018 assuming $1.6BN of net pre-tax cost savings, see Appendix for reconciliations. (4): Based on weighted average footprint population and GDP growth, see page 19 for detail. Note: Financial data at or for the 12 months ended 12/31/18. Market data as of 2/5/19. Illustrative combined does not include impact of purchase accounting or other merger adjustments. Peers include: BAC, CFG, FITB, HBAN, KEY, MTB, PNC, RF, USB, WFC.
(1): Includes value of net cost savings ($1.6BN net pre-tax, 24% tax rate) at 11.5x and $2.0BN pre-tax one-time restructuring charge, see Appendix for reconciliation. (2): Reflects adjusted tangible efficiency ratio (FTE), see non-GAAP reconciliations. (3): Illustrative combined ratios for 2018 assuming $1.6BN of net pre-tax cost savings and interest rate environment as of 2/5/19, see Appendix for reconciliations. (4): Based on weighted average footprint population and GDP growth. Note: Financial data at or for the 12 months ended 12/31/18. Market data as of 2/5/19. Illustrative combined does not include impact of purchase accounting or other merger adjustments. Peers include: BAC, CFG, FITB, HBAN, KEY, MTB, PNC, RF, USB, WFC.
18

Individually, Strong; Together, Best
19
51%54% 55%
57% 57% 58% 58% 59% 60% 60%
65%
Combined USB MTB HBAN FITB BAC CFG RF PNC KEY WFC
Tangible Efficiency Ratio (FTE)
22% 20% 19% 18% 18%16% 16% 16% 15% 14% 13%
Combined USB MTB HBAN FITB KEY RF BAC PNC WFC CFG
Cash Return on Average Tangible Common Equity
BB&T / SunTrust illustrative combined includes $1.6 billion net pre-tax cost savings. See Appendix for illustrative combined and non-GAAP reconciliations.Note: Data for the 12 months ended 12/31/18. Peer tangible efficiency ratio (FTE) and Cash ROATCE reflects adjustments as reported by the company. Does not include impact of purchase accounting and other merger adjustments.
Source: S&P Global, company disclosure
BB&T / SunTrust illustrative combined includes $1.6 billion net pre-tax cost savings. See Appendix for illustrative combined and non-GAAP reconciliations. Assumes rate environment as of 2/5/19.Note: Data for the 12 months ended 12/31/18. Peer tangible efficiency ratio (FTE) and Cash ROATCE reflects adjustments as reported by the company. Does not include impact of purchase accounting and other merger adjustments. Source: S&P Global, company disclosure
19
20
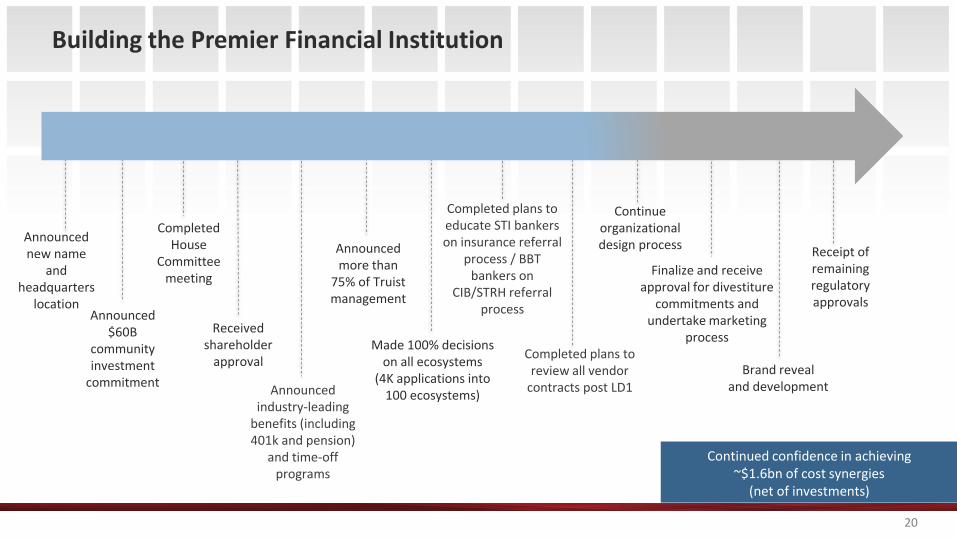
Building the Premier Financial Institution
Announced new name
and headquarters
location
Completed House
Committee meeting
Received shareholder
approval
Announced industry-leading
benefits (including 401k and pension)
and time-off programs
Announced more than
75% of Truist management
Announced $60B
community investment
commitment
Made 100% decisions on all ecosystems
(4K applications into 100 ecosystems)
Completed plans to educate STI bankers on insurance referral
process / BBT bankers on
CIB/STRH referral process
Continue organizational design process
Finalize and receive approval for divestiture
commitments and undertake marketing
process
Brand reveal and development
Receipt of remaining regulatory approvals
Continued confidence in achieving ~$1.6bn of cost synergies
(net of investments)
Completed plans to review all vendor
contracts post LD1

21
Account Number Integration Will Support a Positive Client Experience
~80K out of SunTrust’s ~8.2MM accounts match BB&T’s account number structures across 9 applications
Less than 150 active duplicate accounts between BB&T and SunTrust (across DDA, SAV, time deposits and IRAs)
Research indicates the majority of account numbers can be retained
Result
– Practically no reissuance of account numbers required resulting in minimal disruption from conversion

22
Laser focus on riskmanagement and
completingconversion tasks
A c h i e e
Begin achieving cost savings
Realize revenue synergies from
low-hanging fruit
R e a l i z e
Clear Objectives for the First 100 Days
F o c u s D e l i g h t
Relentlessly pursue a differentiated, client-centric experience
Inspire our teammates and
associates to live for purpose, mission and
values
I n s p r e
23
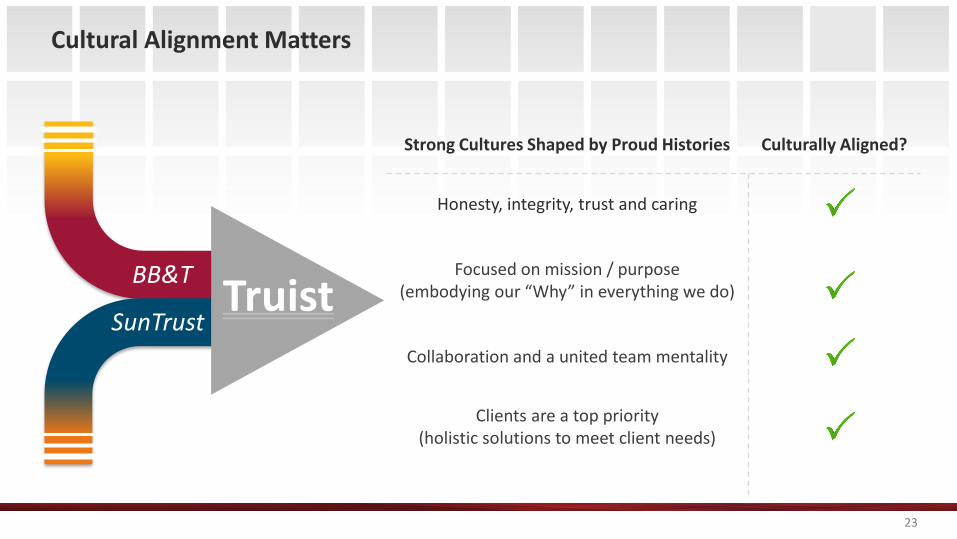
Cultural Alignment Matters
BB&T
SunTrustTruist
Strong Cultures Shaped by Proud Histories Culturally Aligned?
Honesty, integrity, trust and caring
Focused on mission / purpose (embodying our “Why” in everything we do)
Collaboration and a united team mentality
Clients are a top priority (holistic solutions to meet client needs)
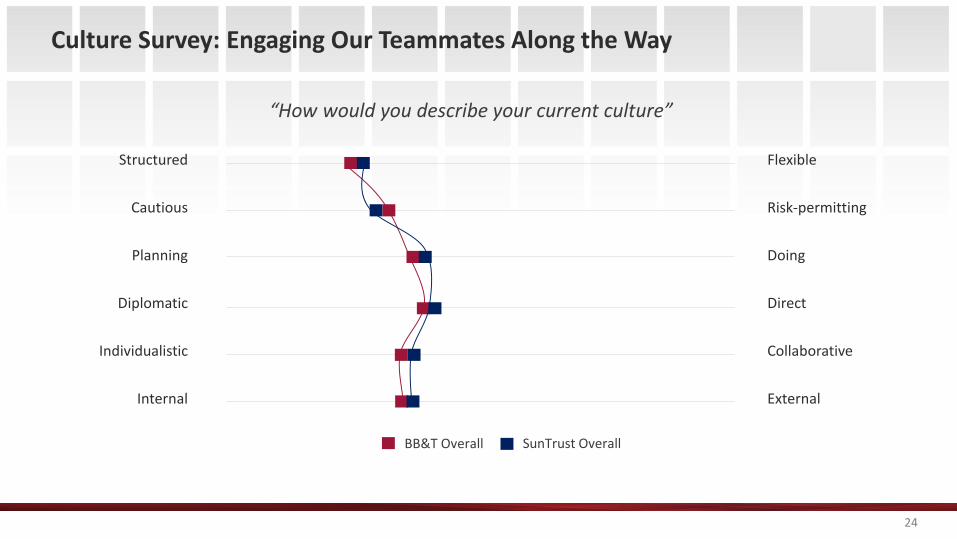
Culture Survey: Engaging Our Teammates Along the Way
Structured Flexible
Cautious Risk-permitting
Planning Doing
Diplomatic Direct
Individualistic Collaborative
Internal External
“How would you describe your current culture”
BB&T Overall SunTrust Overall
24
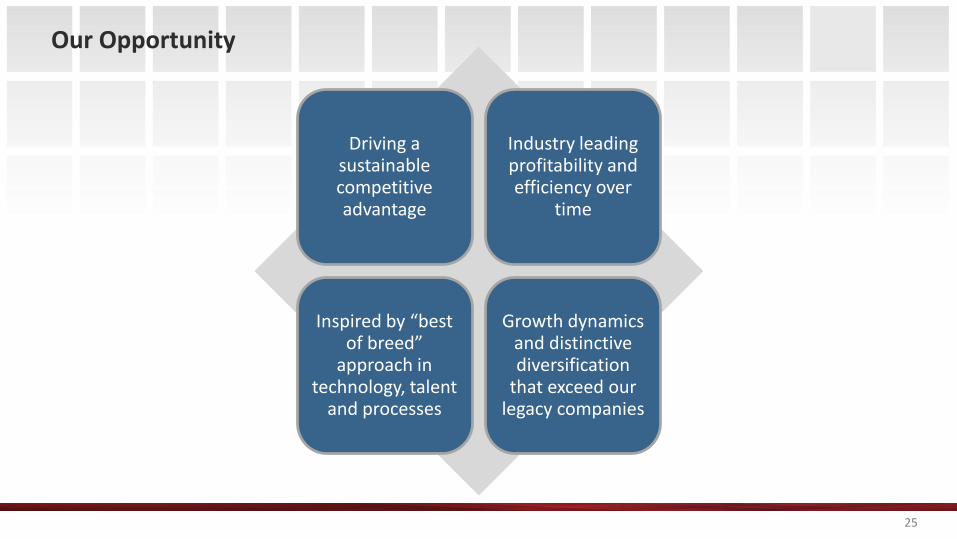
Our Opportunity
Driving a sustainable competitive advantage
Industry leading profitability and efficiency over
time
Inspired by “best of breed”
approach in technology, talent
and processes
Growth dynamics and distinctive diversification
that exceed our legacy companies
25

26
Appendix

27
BB&T Non-GAAP Reconciliations – Efficiency Ratio
($ in mi l l ions) 2016 2017 2018 1H19
Efficiency ratio numerator - noninterest expense – GAAP 6,721$ 7,444$ 6,932$ 3,519$
Amortization of intangibles (150) (142) (131) (64)
Merger-related and restructuring charges , net (171) (115) (146) (103)
Incremental operating expenses related to the merger (11)
Gain (loss ) on early extinguishment of debt 1 (392) - -
FHA-insured loan matters and related recovery 73 - - -
One-time bonus - (36) - -
Mortgage reserve adjustments 31 - - -
Chari table contribution (50) (100) - -
Efficiency ratio numerator – adjusted $6,455 $6,659 $6,655 $3,341
Efficiency ratio denominator - revenue1 – GAAP 10,793 11,317 11,558 5,940
Taxable equiva lent adjustment 160 159 96 48
Securi ties (ga ins ) losses , net (46) 1 (3) -
Loss on sa le of American Coastal - - - -
Efficiency ratio denominator – adjusted $10,907 $11,477 $11,651 $5,988
Efficiency ratio – GAAP 62.3% 65.8% 60.0% 59.3%
Efficiency ratio – adjusted2
59.2% 58.0% 57.1% 55.8%
Revenue is defined as net interest income plus noninterest incomeThe adjusted efficiency ratio is non-GAAP in that it excludes securities gains (losses), amortization of intangible assets, merger-related and restructuring charges and other selected items. BB&T's management uses this measure in their analysis of the Corporation's performance. BB&T's management believes this measure provides a greater understanding of ongoing operations and enhances comparability of results with prior periods, as well as demonstrates the effects of significant gains and charges
28
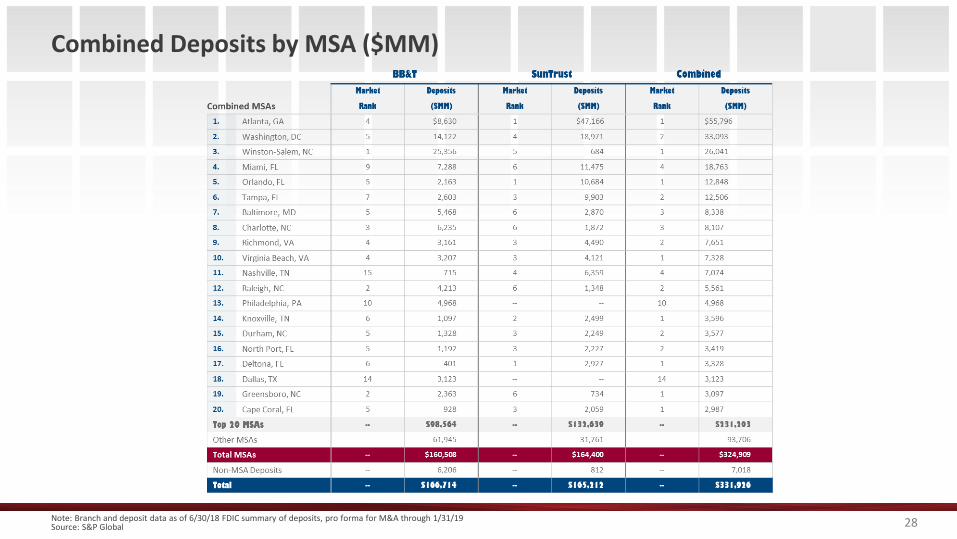
Combined Deposits by MSA ($MM)
Note: Branch and deposit data as of 6/30/18 FDIC summary of deposits, pro forma for M&A through 1/31/19 Source: S&P Global
29
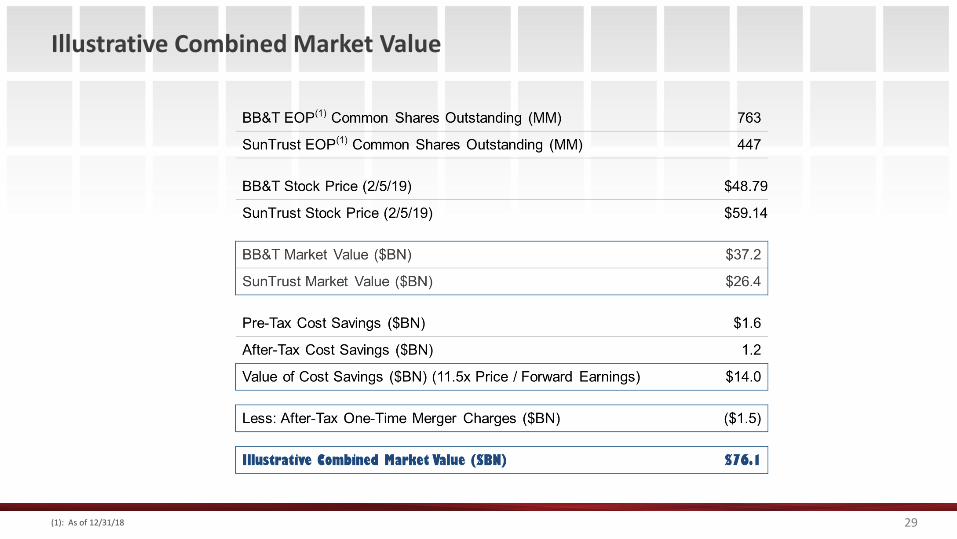
Illustrative Combined Market Value
(1): As of 12/31/18
30
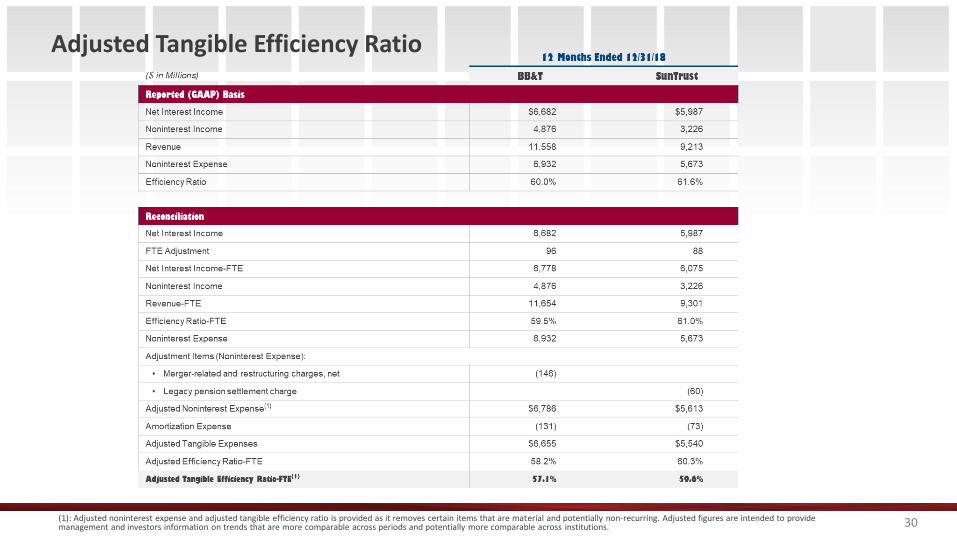
Adjusted Tangible Efficiency Ratio
(1): Adjusted noninterest expense and adjusted tangible efficiency ratio is provided as it removes certain items that are material and potentially non-recurring. Adjusted figures are intended to provide management and investors information on trends that are more comparable across periods and potentially more comparable across institutions.
31
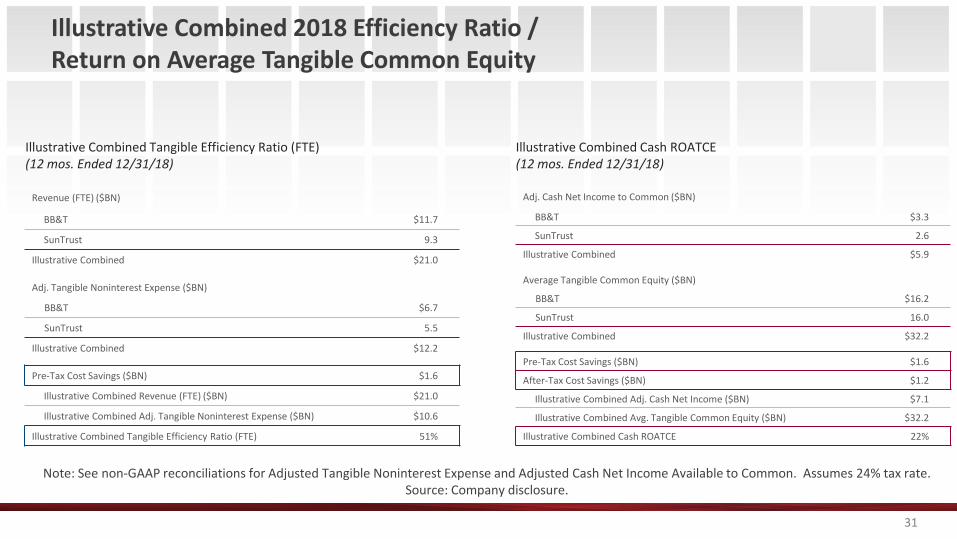
Illustrative Combined 2018 Efficiency Ratio / Return on Average Tangible Common Equity
Illustrative Combined Tangible Efficiency Ratio (FTE)(12 mos. Ended 12/31/18)
Illustrative Combined Cash ROATCE(12 mos. Ended 12/31/18)
Revenue (FTE) ($BN)
BB&T $11.7
SunTrust 9.3
Illustrative Combined $21.0
Adj. Tangible Noninterest Expense ($BN)
BB&T $6.7
SunTrust 5.5
Illustrative Combined $12.2
Pre-Tax Cost Savings ($BN) $1.6
Illustrative Combined Revenue (FTE) ($BN) $21.0
Illustrative Combined Adj. Tangible Noninterest Expense ($BN) $10.6
Illustrative Combined Tangible Efficiency Ratio (FTE) 51%
Adj. Cash Net Income to Common ($BN)
BB&T $3.3
SunTrust 2.6
Illustrative Combined $5.9
Average Tangible Common Equity ($BN)
BB&T $16.2
SunTrust 16.0
Illustrative Combined $32.2
Pre-Tax Cost Savings ($BN) $1.6
After-Tax Cost Savings ($BN) $1.2
Illustrative Combined Adj. Cash Net Income ($BN) $7.1
Illustrative Combined Avg. Tangible Common Equity ($BN) $32.2
Illustrative Combined Cash ROATCE 22%
Note: See non-GAAP reconciliations for Adjusted Tangible Noninterest Expense and Adjusted Cash Net Income Available to Common. Assumes 24% tax rate.Source: Company disclosure.


