31
Investor Presentation For the period ending 30 September 2020 1

Investor PresentationFor the period ending 30 September 2020 1

Disclaimer
By attending the meeting where this presentation is made, or by reading the presentation slides, you agree to be bound by the following limitations:
This presentation may contain statements about future events and expectations that are forward-looking statements. These statements typically contain wordssuch as “expects” and “anticipates” and words of similar import. Any statement in this presentation that is not a statement of historical fact is a forward-lookingstatement that involves known and unknown risks, uncertainties and other factors which may cause our actual results, performance or achievements to bematerially different from those expressed or implied by such forward-looking statements. None of the future projections, expectations, estimates or prospects inthis presentation should be taken as forecasts or promises nor should they be taken as implying any indication, assurance or guarantee that the assumptions onwhich such future projections, expectations, estimates or prospects have been prepared are correct or exhaustive or, in the case of the assumptions, fully stated inthe presentation. Neither Dubai Islamic Bank P.J.S.C. (“DIB”), nor any of its shareholders, directors, officers or employees assume any obligations to update theforward-looking statements contained herein to reflect actual results, changes in assumptions or changes in factors affecting these statements.
This presentation and its contents are confidential and are being provided to you solely for your information and may not be retransmitted, further distributed toany other person or published, in whole or in part, by any medium or in any form for any purpose. In particular, this presentation is not for distribution to retailclients. If handed out at a physical investor meeting or presentation, this presentation should be returned promptly at the end of such meeting or presentation. Ifthis presentation has been received in error it must be returned immediately to DIB. The opinions presented herein are based on general information gathered atthe time of writing and are subject to change without notice. DIB relies on information obtained from sources believed to be reliable but does not guarantee itsaccuracy or completeness.
No reliance may be placed for any purposes whatsoever on the information contained in this presentation, or any other material discussed verbally, or on itscompleteness, accuracy or fairness. The information in this presentation is subject to verification, completion and change. The contents of this presentation havenot been independently verified. Accordingly, no representation or warranty, express or implied, is made or given by or on behalf of DIB or any of its shareholders,directors, officers or employees or any other person as to, and no reliance should be placed on, the accuracy, completeness or fairness of the information oropinions contained in this presentation. Neither DIB nor any of their shareholders, directors, officers or employees nor their respective advisers and/or agentsundertake any obligation to provide the recipient with access to any additional information or to update this presentation or any additional information or tocorrect any inaccuracies in any such information which may become apparent.Any investment activity to which this communication may relate is only available to, and any invitation, offer, or agreement to engage in such investment activitywill be engaged in only with, relevant persons. Any person who is not a relevant person should not act or rely on this presentation or any of its contents.
The distribution of this presentation in other jurisdictions may also be restricted by law, and persons into whose possession this presentation comes should informthemselves about, and observe, any such restrictions.
This presentation contains data compilations, writings and information that are proprietary and protected under copyright and other intellectual property laws, andmay not be redistributed or otherwise transmitted by you to any other person for any purpose. Additionally, this presentation contains translations of currencyamounts solely for the convenience of the reader, and these translations should not be construed as representations that these amounts actually represent suchU.S. dollar amounts or could be converted into U.S. dollars at the rate indicated.
2

3
Contents
Financial Performance2.
Strategic Focus3.
Overview1.
Appendix4.

Fiscal strength remains robust supported by strong policy response
4
Capital Ratios in UAE Banking System (%)
UAE CB TESS Program
Large hydrocarbon reserves continue to support economic
strength.
Strong relations with the international economies supported by
stable government with domestic political stability.
Successful USD 2 bn bond and Sukuk issuances by Government
of Dubai reflects the continued high investor confidence in the
Dubai economy by the international investment community.
In July, Dubai announced a new AED 1.5 billion stimuluspackage to reinforce liquidity of companies and supportbusiness continuity.
Total stimulus from Dubai government now totaling AED 6.3billion (1.6% of GDP).
AED 100 bn TESS Program from UAE Central Bank have providedsupport to 300,000 customers, 10,000 SMEs and 1,500 privatesector companies.
Banks in UAE remain well capitalized, with average CET 1 Ratioat 14.7% and Tier 1 Capital Ratio at 16.4% as of H1 2020.
Robust infrastructure in place to support economic stability and recovery
Sources: UAE Central Bank, Dubai Statistics Center
Economic fundamentals remain healthy supported by proactive policies by the regulators
TESS Program
Zero Cost Funding facility
Payment deferral relief on outstanding loans
Reduction of reserve requirements
Capital buffer relief
Stable funding relief
IFRS 9 Guidance and prudential filters
Postponement of Basel III implementation
Loan to Value ratio increase for first time home buyers
Waiver of CBUAE processing fees in payment systems
Increase of the cap for contactless card transactions
14.7%
13.9%
14.7%
16.5%
15.8%
16.4%
Dec 2019 Mar 2020 Jun 2020
CET 1 Ratio Tier 1 Capital Ratio

Dubai Real Estate Market YTD – Number of TransactionsEmirates Airlines - Increasing number of Destinations (2020)
5
Zero tolerance approach to violations
Sources: DLD, Emirates Airlines
Failure to comply with home
quarantine rules
AED 50K
Violating mandatory hospitalisation
directive
AED 50K
Hosting gatherings and inviting people
over
AED 10K
Being out in public areas without a
mask
AED 3K
Attending a gathering as a
guest
AED 5K
Private sector activities return back following gradual opening of
economic sectors.
Authorities have reiterated to the public the importance ofadhering to safety guidelines, with zero tolerance approachtowards violators.
Travel on gradual return, with Emirates Airlines now flying to
100+ destinations compared to over 60 in July and nearly 0
during lockdown.
Real Estate: There has been increased demand from end-users
and first time buyers for purchasing villas and townhouses,
driven primarily by low interest rates, reduced loan-to-value and
the need to have larger living spaces during the pandemic times.
160
0 5
60
100
Jan Mar Apr Jul Oct
Significant focus on precautionary safety measures as key sectors gradually recover
0
1,500
3,000
4,500
Jan Feb Mar Apr May Jun Jul Aug Sep
Off Plan Sale Existing Properties Sale
+

6
Contents
Financial Performance2.
Strategic Focus3.
Appendix4.
Overview1.

-13% Decline in ATM transactions
7
39% Online transactions
(IB and MB)
16%New App downloads
31%App Transactions
Significant progress on digital strategy (YTD)
9M2020 Strategic Business Highlights
Gross New Financing of nearly AED 42 billion in Corporate and Consumer
Strategic Highlights
Integration of Noor Bank
Capturing strong recovery on Home Finance market
Large presence in Islamic capital markets spaceSupported more than USD 20 billion Sukuk and syndicated
transactions
Progress
Robust balance sheet growth
On target for year end completion
Extending customer support(TESS Program)
Relief measures of nearly AED 8 billion across corporate and consumer portfolios
New bookings of over AED 1 billion during 3Q2020 in Home Finance

Overall Financial Performance (for the period ended 30 Sept 2020)Preserving long term value for our customers and shareholders
AED million 9M2019 9M2020 Change
Total Income 10,250 9,892 (3%)
Net Operating Revenue 6,877 6,935 1%
Operating Expenses (1,771) (2,134) 20%
Profit before Impairment and Tax Charges
5,105 4,801 (6%)
Extraordinary Impairment, ECL and Overlay
(1,056) (2,650)2 151%
Gain on Bargain Purchase - 1,015 100%
Income Tax (34) (41) 20%
Group Net Profit 4,015 3,124 (22%)
Balance Sheet
Income Statement
AED million Dec 2019 Sept 2020 Change
Net Financing Assets & Sukuk Investments
184,157 234,507 27%
Total Assets 231,796 299,303 29%
Customers' Deposits 164,418 214,642 31%
Sukuk Financing Instruments 14,852 18,598 25%
Equity 34,732 40,033 15%
Total Liabilities and Equity 231,796 299,303 29%
Highlights
Financial Highlights
• Strong balance sheet growth with total assets approaching the
AED 300 billion mark, thus translating into a 29% growth rate.
• Net Operating Revenue largely stable at AED 6,935 million,
supported by an increase in fee income of 19% YoY.
• CASA on the rise, now constituting 39% of overall deposits,
compared to 33% at YE2019.
• Top line income at AED 9,892 million remains robust, despite
impacts due to pandemic.
Key Ratios Dec 2018 Dec 2019 Sept 2020
Net Financing to Deposit 93% 92% 92%
Total Capital Adequacy 17.5% 16.5% 17.3%
CET1 12.4% 12.0% 12.9%
Non-Performing Financing (“NPF”) 3.4% 3.9% 4.8%
ROE 18% 17% 14%
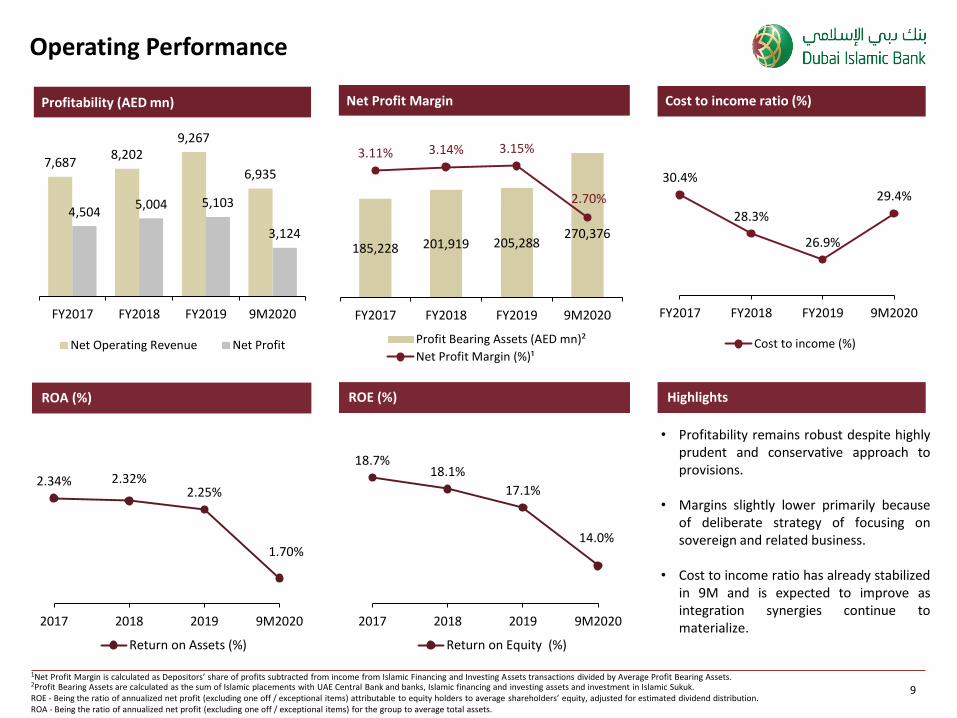
ROA 2.32% 2.25% 1.70%
Net Profit Margin (“NPM”) 3.14% 3.15% 2.70%
Cost to Income 1 28.3% 26.9% 29.40%
Dividend Per Share (% of par value) 35% 35% --
81 Cost to income ratio - Being the ratio of total operating expenses (excluding integration costs) to net income (normalized with synergies).2 Impairment provision of AED 2.65 bn includes one offs.
9
Net Profit Margin
185,228 201,919 205,288270,376
3.11% 3.14% 3.15%
2.70%
2.00%
2.20%
2.40%
2.60%
2.80%
3.00%
3.20%
3.40%
0
50,000
100,000
150,000
200,000
250,000
300,000
FY2017 FY2018 FY2019 9M2020
Profit Bearing Assets (AED mn)²
Net Profit Margin (%)¹
1Net Profit Margin is calculated as Depositors’ share of profits subtracted from income from Islamic Financing and Investing Assets transactions divided by Average Profit Bearing Assets. 2Profit Bearing Assets are calculated as the sum of Islamic placements with UAE Central Bank and banks, Islamic financing and investing assets and investment in Islamic Sukuk. ROE - Being the ratio of annualized net profit (excluding one off / exceptional items) attributable to equity holders to average shareholders’ equity, adjusted for estimated dividend distribution.ROA - Being the ratio of annualized net profit (excluding one off / exceptional items) for the group to average total assets.
7,687 8,202
9,267
6,935
4,504 5,004 5,103
3,124
FY2017 FY2018 FY2019 9M2020
Net Operating Revenue Net Profit
2.34% 2.32%2.25%
1.70%
2017 2018 2019 9M2020
Return on Assets (%)
Highlights
Profitability (AED mn)
30.4%
28.3%
26.9%
29.4%
FY2017 FY2018 FY2019 9M2020
Cost to income (%)
ROE (%)ROA (%)
18.7%18.1%
17.1%
14.0%
2017 2018 2019 9M2020
Return on Equity (%)
Cost to income ratio (%)
• Profitability remains robust despite highlyprudent and conservative approach toprovisions.
• Margins slightly lower primarily becauseof deliberate strategy of focusing onsovereign and related business.
• Cost to income ratio has already stabilizedin 9M and is expected to improve asintegration synergies continue tomaterialize.
Operating Performance

145 151197
31 33
3721 16
30
10 10
11
10 11
13
7 10
11
Dec 2018 Dec 2019 Sept 2020
Net Financing Assets Sukuk Investments
Interbank placement & CDs Investment in equities & properties
Operating Cash Others
Corporate, 53%
Consumer, 26%
Real Estate, 21%
Corporate, Others, 0
Consumer,0
Dec 2019
Breakdown of Financing Portfolio by Sector (%) *
Sept 2020 Highlights
• Earning assets continue to show strong
growth with a focus on low risk sectors
• Segmental financing:
o Corporate financing book reached AED
143 bn
o Gross new consumer financing amounted
to AED 9.5 bn
o Real estate concentration maintained
within the guidance
Deployed Funds Composition (AED bn) Deployment by Segment (AED bn)
101
39
10
3121
10
105
41
11
33
16 10
143
52
10
3730
11
Corporate Consumer Real Estate Sukukinvestment
Interbankplacements &
CDs
Investment inEquities &Properties
Dec 2018 Dec 2019 Sept 2020
224 232
299
10
Corporate, 55%
Consumer, 25%
Real Estate, 20%
Overview of Deployment of Funds/Financing
* Corporate covers all sectors except Real Estate

39 41
52
6973
91
0
20
40
60
80
100
2018 2019 Sept 2020
Gross Financing Deposits
• Consumer financing now stands at AED52 billion, supported by gross newfinancing of AED 9.5 billion.
• Auto, personal and home financecontinued to be the key contributors tothe consumer portfolio.
• Net operating revenue increased 15% YoYto AED 2,982 million.
• Significant jump in CASA by nearly 43%YTD.
20 21
30
13 14
20
0
5
10
15
20
25
30
35
2018 2019 Sept 2020
Current Account Savings Account
Segment Gross Financing / Deposits (AED bn) CASA (AED bn)
2,092 2,279
509 703
7.11%6.34%
2.00%
3.00%
4.00%
5.00%
6.00%
7.00%
8.00%
9.00%
10.00%
- 200 400 600 800
1,000 1,200 1,400 1,600 1,800 2,000 2,200 2,400 2,600 2,800 3,000 3,200
9M2019 9M2020
Fees & Commission, OthersNet Funded IncomeYield on Financing
2,601
2,982
Personal Finance,
38%
Cards, 4%Auto
Finance, 17%
Home Finance,
41%AED
52 bn
11
Segmental Overview – Consumer
Breakdown by Portfolio – Sept 2020Management Commentary Revenue Trends (AED mn)

Automobile, 4%
Aviation, 13%
Contracting, 4%
Financial Institutions, 7%
Government, 16%
Manufacturing, 4%
Real Estate, 26%
Services, 18%
Trade, 6%
Utilities, 2%
• Gross corporate financing amounted to
AED 153 billion, a growth of 34% YTD.
• Portfolio remains well-diversified with a
strategic focus on sovereign and lower
risk sectors during the pandemic
• Focus on operating accounts led to CASA
growth of 60% YTD.
109 114
153
87 92
116
0
20
40
60
80
100
120
140
160
180
2018 2019 Sept 2020
Gross Financing Deposits
2,114 1,896
490449
5.2%
3.7%
0.02
0.04
0.06
0200400600800
1,0001,2001,4001,6001,8002,0002,2002,4002,6002,8003,0003,200
9M2019 9M2020
Fees & Commission, OthersNet Funded IncomeYield on Financing
AED 153 bn
Segment Gross Financing / Deposits (AED bn) CASA (AED bn)
2,6042,345
1312
15
78
17
0
2
4
6
8
10
12
14
16
18
20
2018 2019 Sept 2020
Current Account Savings Account
Corporate banking charts reflect corporate and real estate, excluding treasury12
Segmental Overview – Corporate
Breakdown by Portfolio – Sept 2020Management Commentary Revenue Trends (AED mn)

• Gross Financing and Sukuk Investments
crossed AED 40 billion.
• Significant improvement in net operating
revenue (+64% YoY) to AED 1.2 billion.
• Treasury yields remained healthy at
nearly 4%.
Government, 63%
Financial Institutions / Banking, 15%
Real Estate, 9%
Aviation, 3%
Manufacturing & Services, 9%
3335
40
0
20
40
2018 2019 Sept 2020
Gross Financing & Sukuk
409 603
321
597 4.3%
3.9%
2.0%2.2%2.4%2.6%2.8%3.0%3.2%3.4%3.6%3.8%4.0%4.2%4.4%4.6%4.8%5.0%5.2%5.4%5.6%5.8%6.0%
-
200
400
600
800
1,000
1,200
1,400
1,600
9M2019 9M2020
Fees & Commission, OthersNet Funded IncomeYield on Financing & Sukuk
AED 40 bn
7301,200
47 48
255
66
238
529
0102030405060708090100110120130140150160170180190200210220230240250260270280290300310320330340350360370380390400410420430440450460470480490500510520530540550560570580590600610620630640650
2018 2019 Sept 2020
Current Account Savings Account
* Based on shadow accounting for fees and commissions 13
Segment Gross Financing & Sukuk (AED bn) CASA (AED mn)
Segmental Overview – Treasury
Breakdown by Portfolio – Sept 2020Management Commentary Revenue Trends (AED mn)*

5,857 6,333
7,355
5,2516,310
10,049
0.51%
0.87%0.99%
0.00%0.05%0.10%0.15%0.20%0.25%0.30%0.35%0.40%0.45%0.50%0.55%0.60%0.65%0.70%0.75%0.80%0.85%0.90%0.95%1.00%1.05%1.10%1.15%1.20%
Dec 2018 Dec 2019 Sept 2020
Provisions NPF Cost of Risk
150%135%
114%112%101%
81%
Dec 2018 Dec 2019 Sept 2020
Overall Coverage Ratio² Provision Coverage Ratio
Cumulative Provisioning (AED million)
• Non-Performing Financing and impaired financing ratios
continued to be robust during the current times, at 4.8% and
4.6% respectively.
• Normalized cost of risk for the period was 99 bps (excluding
one-off charges).
• Overall coverage including collateral has remained well
above 100%.
Highlights
1NPF ratio includes Bilateral Sukuk and is calculated as the sum of individually impaired and 90-day overdue Financing Assets; 2Overall Coverage Ratio is calculated as the sum of provisions held including regulatory credit risk reserve (if any) and collateral held relating to facilities individually determined to be impaired divided by non-performing financing.*Includes Purchased or Originated Credit Impaired (POCI) through Noor Bank acquisitionCost of Risk – Being ratio of net impairment charge on financing assets (normalized) divided by the gross financing and investment in Sukuk.
3.4%
3.9%
4.8%
3.3%3.9%
4.6%
Dec 2018 Dec 2019 Sept 2020
NPF Ratio Impaired Financing Ratio
14
*
Non-Performing Financing (“NPF ”)1 Financing Provisions and Coverage Ratios
Asset Quality
Expected Credit Loss (AED million)
15
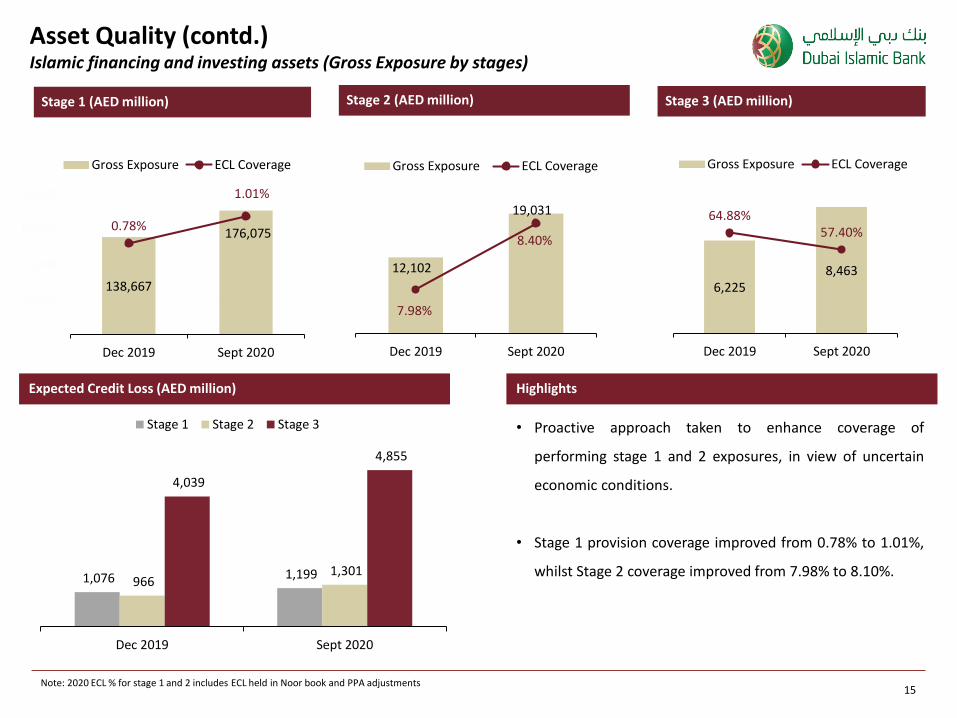
1,076 1,199 966
1,301
4,039
4,855
- 20 40 60 80 100 120 140 160 180 200 220 240 260 280 300 320 340 360 380 400 420 440 460 480 500 520 540 560 580 600 620 640 660 680 700 720 740 760 780 800 820 840 860 880 900 920 940 960 980 1,000 1,020 1,040 1,060 1,080 1,100 1,120 1,140 1,160 1,180 1,200 1,220 1,240 1,260 1,280 1,300 1,320 1,340 1,360 1,380 1,400 1,420 1,440 1,460 1,480 1,500 1,520 1,540 1,560 1,580 1,600 1,620 1,640 1,660 1,680 1,700 1,720 1,740 1,760 1,780 1,800 1,820 1,840 1,860 1,880 1,900 1,920 1,940 1,960 1,980 2,000 2,020 2,040 2,060 2,080 2,100 2,120 2,140 2,160 2,180 2,200 2,220 2,240 2,260 2,280 2,300 2,320 2,340 2,360 2,380 2,400 2,420 2,440 2,460 2,480 2,500 2,520 2,540 2,560 2,580 2,600 2,620 2,640 2,660 2,680 2,700 2,720 2,740 2,760 2,780 2,800 2,820 2,840 2,860 2,880 2,900 2,920 2,940 2,960 2,980 3,000 3,020 3,040 3,060 3,080 3,100 3,120 3,140 3,160 3,180 3,200 3,220 3,240 3,260 3,280 3,300 3,320 3,340 3,360 3,380 3,400 3,420 3,440 3,460 3,480 3,500 3,520 3,540 3,560 3,580 3,600 3,620 3,640 3,660 3,680 3,700 3,720 3,740 3,760 3,780 3,800 3,820 3,840 3,860 3,880 3,900 3,920 3,940 3,960 3,980 4,000 4,020 4,040 4,060 4,080 4,100 4,120 4,140 4,160 4,180 4,200 4,220 4,240 4,260 4,280 4,300 4,320 4,340 4,360 4,380 4,400 4,420 4,440 4,460 4,480 4,500 4,520 4,540 4,560 4,580 4,600 4,620 4,640 4,660 4,680 4,700 4,720 4,740 4,760 4,780 4,800 4,820 4,840 4,860 4,880 4,900 4,920 4,940 4,960 4,980 5,000 5,020 5,040 5,060 5,080 5,100
Dec 2019 Sept 2020
Stage 1 Stage 2 Stage 3
Highlights
138,667
176,0750.78%
1.01%
0.00%
0.20%
0.40%
0.60%
0.80%
1.00%
1.20%
0
50,000
100,000
150,000
200,000
Dec 2019 Sept 2020
Gross Exposure ECL Coverage
12,102
19,031
7.98%
8.40%
7.70%
7.80%
7.90%
8.00%
8.10%
8.20%
8.30%
8.40%
8.50%
0
5,000
10,000
15,000
20,000
Dec 2019 Sept 2020
Gross Exposure ECL Coverage
6,2258,463
64.88%57.40%
20.00%
30.00%
40.00%
50.00%
60.00%
70.00%
80.00%
01,0002,0003,0004,0005,0006,0007,0008,0009,000
Dec 2019 Sept 2020
Gross Exposure ECL Coverage
Note: 2020 ECL % for stage 1 and 2 includes ECL held in Noor book and PPA adjustments
Asset Quality (contd.)Islamic financing and investing assets (Gross Exposure by stages)
Stage 2 (AED million)Stage 1 (AED million) Stage 3 (AED million)
• Proactive approach taken to enhance coverage of
performing stage 1 and 2 exposures, in view of uncertain
economic conditions.
• Stage 1 provision coverage improved from 0.78% to 1.01%,
whilst Stage 2 coverage improved from 7.98% to 8.10%.

Wholesale, 58%
Consumer, 42%
156 164 215
12 15
19
34 35
40
9 9
9
13 9
17
Dec 2018 Dec 2019 Sept 2020
Due to banks & FIs Other payablesEquity SukukCustomers' Deposits
• The bank’s liquidity position remained robust at 92%, despitemarket-leading growth.
• Strong growth in deposits, with an increase of 31% YTD indicatesstrength of the franchise to mobilize liquidity despite the currentoperating environment.
• CASA jumps 52% YTD, now constituting 39% of deposits.
• DIB credit continues to be attractive in the capital markets space,and in June 2020, the bank successfully raised USD 1.3 billionSukuk (including tap), which was subscribed nearly 4.5 times.
Highlights
By Type
Customer Deposits (AED 215 bn as at 30 September 2020)
By Business
121%
142%
101%
Sept 2019 Dec 2019 Sept 2020
Liquidity Coverage Ratio (%)
*Net Financing to Deposit Ratio excludes Bilateral Sukuk.
224
156 164
215
93% 92% 92%
Dec 2018 Dec 2019 Sept 2020
Customer Deposits
Net Financing to Deposit Ratio*
232
299
Investment Deposits, 61%
Current Account,
21%
Savings Account,
17%
16
Funding Sources and Liquidity
Customers’ Deposits (AED bn)Funding Sources (AED bn) Liquidity Coverage Ratio (LCR)

Capital Ratios*Regulatory Capital1 (AED billion)
Dividend History2
Refers to Regulatory Capital under Basel III; 2 Dividend is calculated as dividend per share divided by par value of a share ; *This graph reflects ratios under Basel III regime
15%
25%
40%45% 45% 45%
35% 35%
2012 2013 2014 2015 2016 2017 2018 2019
Cash Dividend as a % of Par Value
• Equity position strengthened to AED 40 billion, up by 15%compared to YE2019.
• Capital adequacy and CET 1 ratios improved to 17.3% (+80bps YTD) and 12.9% (+90 bps YTD), respectively.
• Despite strong growth during the year, capital levels areintact and remain above the minimum regulatoryrequirement.
Highlights
18.3%17.2% 17.5% 16.5% 17.3%
12.0% 11.5% 12.4% 12.0% 12.9%
Dec 2016 Dec 2017 Dec 2018 Dec 2019 Sept 2020
CAR CET1 Ratio
17
21.8 22.729.2
7.0 6.4
7.42.0 2.2
2.6
Dec 2018 Dec 2019 Sept 2020
CET 1 AT1 Tier 2
30.8 31.3
39.2
Capitalization Overview

18
Acquisition of Noor Bank – key milestonesFrom a pioneering Islamic bank to becoming a powerhouse in Islamic finance
The integration program is on track with all key milestones met. The Bank continues to adhere to the established operational governance and
oversight structure for the integration.
The Bank has made significant progress in terms of its technology platforms’ integration. It has successfully completed Data Migration Rehearsals,
System Integrated Testing, Value Chain Testing cycles and Performance Testing.
The Bank has initiated the Customer Communications process on account of the integration, in line with the Central Bank requirements. The Bank also
initiated dispatch of Welcome letters with new DIB Cards to Noor Bank Debit and Credit Card customers.
Onboarding of Noor Bank new to Bank customers stopped from 15th September 2020 and is now being shifted to DIB.
Continued execution of Non-technology Projects, including collateral and property migration.
Targeted for completion in 4Q.
Q2 Q3 Q4 Q1 Q2
APRILBOD approval to
consider acquisition of
Noor Bank
JUNEBOD resolved to recommend the
acquisition
SEPTEMBERCentral Bank of UAE approval on acquisition of Noor Bank
NOVEMBERSCA approval to
hold General Assembly
DECEMBERGeneral
Assembly approved the
acquisition
JANUARYShare transfer completed; Board of Directors of Noor
Bank reconstituted; Integration Steering
Committee established
MARCHIntegration
Management Office constituted to drive
integration
APRILIntegration program
underway, with COVID-19 risks addressed (work-
from-home, virtual conferencing, etc.)
Key Highlights
MAY & JUNEEntered execution phase of the Integration and completed key
deliverables on policies and operating model. Data migration in progress.
Q3
JULY - SEPTEMBERContinued execution phase
of the Integration and completed key deliverables
in technology platforms’ integration. On track for
completion in 4Q
2019 2020

19
Contents
Financial Performance2.
Strategic Focus3.
Appendix4.
Overview1.

Digitally Intelligent Bank (DIB)
New digital offerings to ‘WOW’ customer
experience
Maintain cost discipline
R EC A
CUSTOMER EXPERIENCE RETENTION ENGAGEMENTACQUISITION
CARE IDEOLOGY
Create key Digital customer journeys
Enhance platform upgrades
Reduction in branch transactions traffic
20
2020 – Target Metrics
Growth8% to 10%
27%NPF
4.0%4.8%
Real Estate Concentration
~ 20%20%
Return on Assets
2.10% to 2.20%1.70%
Net Profit Margin
3.00% to 3.15%2.70%
Cash Coverage100%81%
Cost Income Ratio
26% to 27%29.4%
Return on Equity
17% to 18%14.0%
Strategic Focus 2020

21
Contents
Financial Performance2.
Strategic Focus3.
Appendix4.
Overview1.

AED million 9M2020 9M2019 FY 2019 FY 2018
Net Income Reviewed Reviewed Audited Audited
Income from Islamic financing and investing transactions 7,973 8,100 10,723 9,481
Commission 1,318 1,106 1,483 1,476
Income / (loss) from other investments measured at fair value 45 66 65 45
Income from properties held for development and sale 42 92 126 124
Income from investment properties 50 278 295 156
Share of profit from associates and joint ventures 13 66 58 137
Other Income 450 543 934 311
Total Income 9,892 10,250 13,684 11,730
Depositors’ and Sukuk holders’ share of profit (2,957) (3,373) (4,418)(3,528)
Net Income 6,935 6,877 9,266 8,202
Operating Expenses
Personnel expenses (1,311) (1,202) (1,587) (1,580)
General and administrative expenses (679) (476) (632) (608)
Depreciation of investment properties (40) (28) (37) (35)
Depreciation of property, plant and equipment (104) (65) (102) (99)
Total Operating Expenses (2,134) (1,771) (2,358) (2,322)
Profit before net impairment charges and income tax expense 4,801 5,106 6,908 5,880
Impairment charge for the period, net (2,650) (1,056) (1,763) (834)
Gain on Bargain Purchase 1,015
Profit for the period before income tax expense 3,166 4,050 5,145 5,046
Income tax expense (41) (34) (42) (43)
Net Profit for the period 3,124 4,016 5,103 5,004
Attributable to
Owners of the Bank 3,125 3,967 5,015 4,916
Non-Controlling Interests (1) 48 88 88
22
Consolidated Income Statement

AED million 30 Sept 2020 31 Dec 2019 31 Dec 2018Assets Reviewed Audited Audited
Cash and balances with central banks 37,917 21,268 22,546
Due from banks and financial institutions 4,897 6,248 8,297
Islamic financing and investing assets, net 197,436 150,913 144,739
Investments in Islamic Sukuk measured at amortized cost 37,071 33,244 31,179
Other investments at fair value 1,254 1,266 1,687
Investments in associates and joint ventures 1,918 1,977 1,928
Properties held for sale 1,388 1,337 1,449
Investment properties 6,588 5,209 4,495
Receivables and other assets 9,385 8,743 6,048
Property, plant and equipment 1,449 1,590 1,314
Total Assets 299,303 231,796 223,682
Liabilities and Equity
Liabilities
Customers' deposits 214,642 164,418 155,657
Due to banks and financial institutions 17,323 9,147 13,203
Sukuk financing instruments 18,598 14,852 12,371
Payables and other liabilities 8,707 8,646 8,323
Total Liabilities 259,270 197,063 189,555
Equity
Share Capital 7,241 6,590 6,590
Tier 1 Sukuk 8,264 6,428 7,346
Other Reserves and Treasury Shares 13,785 11,113 10,861
Investments Fair Value Reserve (883) (1,175) (850)
Exchange Translation Reserve (1,218) (1,095) (1,052)
Retained Earnings 10,119 10,131 8,569
Equity Attributable to owners of the banks 37,308 31,993 31,464
Non-Controlling Interest 2,725 2,739 2,663
Total Equity 40,033 34,732 34,127
Total Liabilities and Equity 299,303 231,796 223,682
23
Consolidated Balance Sheet

Credit Ratings
Dubai Islamic Bank (“DIB” or the “Bank”) was established in 1975 as the world’sfirst full service Islamic bank by an Emiri Decree.
DIB is the largest Islamic bank in the UAE by total assets, providing a range ofretail and wholesale banking, treasury and investment banking, and capitalmarkets products and services to individual, corporate and institutionalcustomers.
Robust credit ratings reflecting strong domestic franchise, healthy profitability,sound funding & liquidity and adequate capital ratios.
In January 2020, DIB successfully completed the acquisition of Noor Bank, withthe integration of the latter’s operations currently underway, and on track forcompletion soon.
Investment Corporation of
Dubai (ICD), 25.82%
Public, 67.64%
Saeed A. Lootah, 6.54%
Around 68 branches and more than 614 ATMs and CDMs across UAE
Turkey
Bosnia (36)
Sudan (123)
UAE (68)
Pakistan (235)
Indonesia (12) + (24) on shared basis
Kenya (5)
Moody’s
A3Negative
Fitch
AStable
Islamic International Rating Agency
(IIRA)
A/A1Positive
60.0%
100.0%
38.3%
29.5%
44.9%
27.3%
100.0%
Credit Ratings International Geographic Presence
Existing Presence & Branch Numbers92.0%
Pakistan
UAE Branch Network3 million +
customers globally
FOL increase to 40% approved by shareholders
More than 9,000 employees across the
Group
Designated (“D-SIB”)* in 2018
*Domestic – Systemically Important
Bank
Ownership (as at 30
September 2020)
Dubai Islamic Bank at a Glance Preserving long term value for our customers and shareholders
Significant Subsidiaries and Associates
24
100%
25
Preserving Quality of Assets
Focusing on Low Risk Assets / Sectors
Protecting the Franchise
Maximizing Integration Synergies
Strategy Realignment in COVID times

26
Response to Date on COVID-19 - In It Together with Our People, Clients & Communities
Effective 15 March 2020 and based on eligibility customer may get deferment of finance with no additional charges for existing customers
Introduced Low profit rates, reduction in processing fees and simplified documentation process
Facilitating clients to manage operations through digital channels
The Bank announced largest Contribution of AED120 million in UAE to the Community Solidarity Fund Against Covid-19. The gesture represents bank’s commitment to supporting all national humanitarian initiatives
Crisis Management Team setup to monitor the situation
Circulate inspiring and uplifting messages across various social media channels
Effective 15 March 2020 and based on eligibility, specialfinance postponement schemes as well as waivers andbenefits on various consumer products have been putin place to help customers during this difficult time
Encouraging customers to use contactless paymentsaccessible by activating Apple Pay or Samsung Pay
Bank From Home with wide range of banking servicesavailable via DIB Online Banking and Mobile App
Regular Updates via DIB Digital channels such as SMS,Emailers, Social Media & Phone Banking
Our People
Gradual progression to Work from Office with social distancing guidelines implemented
Encourage flexible working hours , relocations and installing acrylic sheets on work stations where social distancing is a challenge
Protecting Touchpoints via thorough sanitization of DIB Offices, Branches & ATM spots, deployment of hand sanitizers in all locations and temperature scanning at all DIB sites
Educating our staff on precautionary actions via regular emails and on-site posters
Retail Customers
SME & Corporate Customers Supporting Community

Core Business Profiles
Serving more than 2 million customers in the UAE
Offers its retail and business banking services through a network of 68 branches and more than 614 ATMs and CDMs across UAE
Broad range of retail products and services that include: Auto Finance; Sharia-compliant Cards; Personal Finance; Mortgages and SME Solutions.
DIB’s Investment Banking business is primarilyresponsible for management of DIB’sproprietary investment portfolios, strategicstakes and international operations andexpansion.
The business group provides advisory andrelated services to DIB’s corporate clients bothwithin UAE and across borders.
Treasury offers a comprehensive range ofproducts backed by DIB’s expert understandingof local and international markets.
Its principal customers are corporate clients,financial institutions, high net worthindividuals, SME companies and similarbusinesses.
It is responsible for managing DIB’s liquidityrequirements, fixed income portfolio andcapital markets funding.
Consumer Banking Corporate Banking
TreasuryInvestment Banking
Corporate Banking has sector-specific focusunits which target clients across both privateand public sectors.
Corporate Banking manages relationships(including sovereigns/ GREs, middle market,contracting finance and real estate financecompanies) and is instrumental in leveraging itsclient relationships to cross-sell other productsoffered by DIB, including investment bankingand treasury services.
27
DIB’s Key Business Lines

28
PAPERLESS BRANCHES INTRODUCED
Simplified branch visit with handheld devices to fill forms and complete transactions
JOURNEY TOWARDS DIGITALLY INTELLIGENT BANK
Introduction of DIB Chatbot
Revamp of DIB Website, Online Banking, DIB Mobile App
Tablet-based banking
Instant Credit Card printing in branches
Single page account opening form
CUSTOMER INNOVATION DEPARTMENT ESTABLISHED
Department setup to promote design, research, develop, analyze and suggest new marketing concepts as well as strategies
Successful launch of DIB’s Digital Lab
Digital customer journeys launched
“Banking-in-Minutes” concept launched with public introduction of New to Bank CASA account opening and Credit Card Journeys
Personal Finance for Salary Transfer Relationship customer (New /Existing) was launched on Internet Banking and Tablet
Set Foundation for Digital Academy & Advanced Analytics
Initiating the development of End to End customer journey through digital channels
Express Transfer / Instant Remittances
2014 202020192018201720162015
DIB’s Digital Journey
SUCCESSFULLY LAUNCHED DIGITAL DEPARTMENT CREATED
ADVANCED THE YEAR WITH DIGITAL STRATEGY FORMULATION
PF & Credit Cards on Mobile App –Salary transfer (existing customers)
Remote signing of contracts – non digital customers
Implementation of E-cheque-Digitally authenticated by the customer replacing physical cheque

29
Dubai Islamic Bank (Tap)
USD 300,000,000
2.950% Long 5yr Sukuk
JLM & Bookrunner
Jun 2020
Dubai Department of
Finance
USD 1,000,000,000
2.763% 10yr Sukuk
JLM & Bookrunner
Sep 2020
Emirates Islamic Bank
USD 500,000,000
1.827% 5yr Sukuk
JLM & Bookrunner
Sep 2020
Republic of Indonesia
USD 2,500,000,000
USD 750mn 2.300% 5yr
USD 1,000mn 2.800% 10yr
USD 750mn 3.800% 30yr
JLM & Bookrunner
Jun 2020
DP World
USD 1,500,000,000
6.000% Perpetual Sukuk
JLM & Bookrunner
Jun 2020
Sharjah Islamic Bank
USD 500,000,000
2.850% 5yr Sukuk
JLM & Bookrunner
Jun 2020
Dubai Islamic Bank
USD 1,000,000,000
2.950% Long 5yr Sukuk
Sole ArrangerJLM & Bookrunner
Jun 2020
Government of Sharjah
USD 1,000,000,000
2.942% 7yr Sukuk
JLM & Bookrunner
Jun 2020
DAR Al-Arkan
USD 400,000,000
6.875% 7yr Sukuk
JLM & Bookrunner
Feb 2020
Islamic Development
Bank
USD 2,000,000,000
1.809% 5yr Sukuk
JLM & Bookrunner
Feb 2020
First Abu Dhabi Bank
USD 500,000,000
2.500% 5yr Sukuk
JLM & Bookrunner
Jan 2020
Select DIB Debt Capital Market Transactions
Network International
USD 525,000,000
Mar 2020
Ports & Free Zone World
USD 9,000,000,000
Apr 2020
PFZW
Topaz Energy & Marine Ltd.
USD 392,000,000
Feb 2020
Govt. of Egypt
USD 2,000,000,000
Mandated Lead Arranger
Aug 2020
Mandated Lead Arranger Mandated Lead ArrangerMandated Lead Arranger & Bookrunner
Select Syndicated / Club Transactions

30
9M20202018 2019
• Islamic Bank of the Year• Best Islamic Retail Bank• Best Islamic Trade
Finance Sukuk• Best Islamic REIT• Best Supranational Sukuk• Bank of the Year 2018
• CEO Award – Excellence in Global Islamic Finance and Banking awarded to Dr. Adnan Chilwan
• Best Islamic Bank• Best Islamic Retail bank • Best Islamic Corporate Bank • Best Sukuk Arranger
Best Islamic Bank 2018
Dr. Adnan Chilwan Forbes 2018 TopIndian Leaders
in the Arab World
Dr. Adnan Chilwan ranked #1 in the “Top
Indian Executives making impact in the Middle East
Award 2019
• Best Islamic Bank in the UAE• UAE Deal of the Year• Overall Best Islamic Bank• Sovereign Deal of the year• Indonesia Deal of the Year• Most Innovative Deal of the year• Hybrid Deal of the Year• Best Islamic Retail Bank• Best Islamic Bank in Kenya• Best Investor Relations
Best Islamic Bank (Financial Performance)
• Best Sukuk House in UAE• Best Private Bank in UAE
Most Innovative Islamic Bank – UAE
Islamic Bank of the Year
Best Sukuk Dealerby The Collaborative Market Data (CMD) Portal Awards
DIB ranked 16th amongst Top 100 Companies in the Middle East
• Overall Best Islamic Bank (6th year in row)
• Social Impact Deal of the Year• Sovereign Deal of the Year• UAE Deal of the Year • Best Islamic Bank in Kenya
Best Financial Institution Sukukby EMEA Finance Achievement Awards 2019
Select Awards & Accolades
Our latest financial information,events and announcements cannow be accessed by downloadingDIB Investor Relations App:
You may also contact us as follows:
P. O. Box: 1080, Dubai, UAE
+971 4 2075 454
www.dib.ae/about-us/investor-relations
THANK YOU!
31


