24
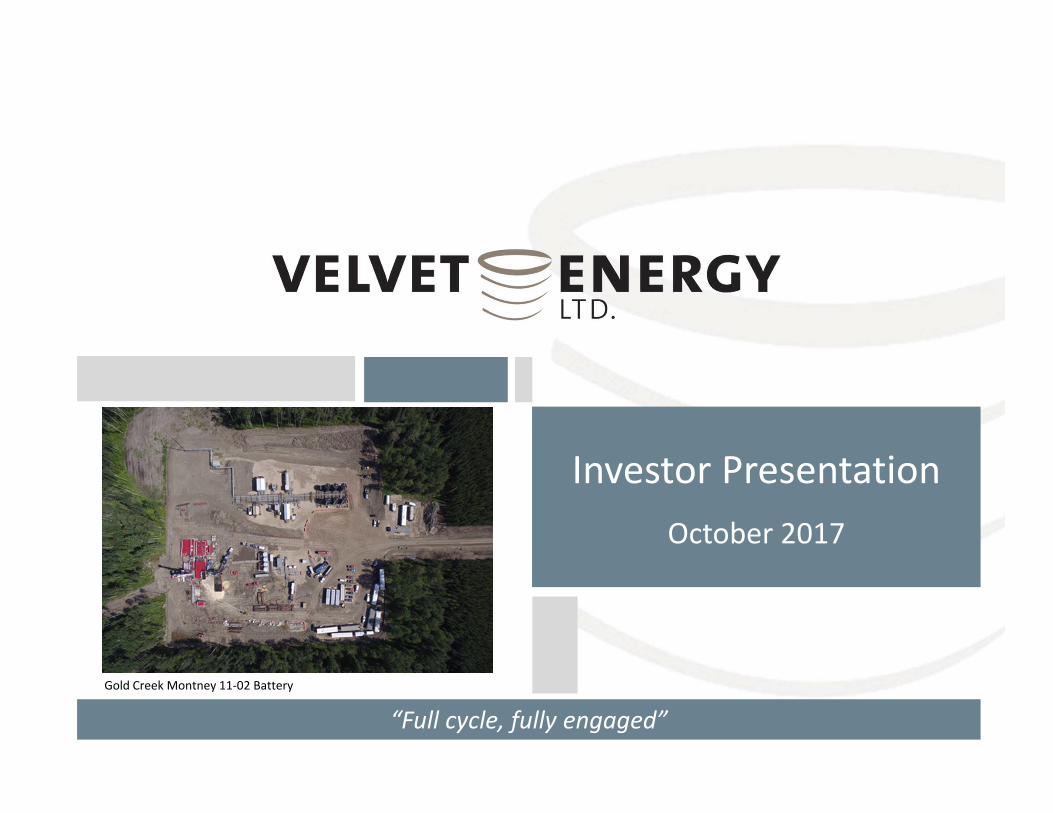
Investor Presentation October 2017 “Full cycle, fully engaged” Gold Creek Montney 11‐02 Battery
Investor PresentationOctober 2017
“Full cycle, fully engaged” Gold Creek Montney 11‐02 Battery

ADVISORY REGARDING FORWARD‐LOOKING STATEMENTS
2
This presentation contains certain forward‐looking information and statements with respect to Velvet Energy Ltd. (“Velvet” or the “Company”), includingexpectations, beliefs, plans, goals, objectives, assumptions, information and statements about future events, conditions, results of operations,performance, Velvet’s planned capital expenditure program and the nature of the expenditures, drilling plans, expected drilling and completion costs,expected average production, the expected splits among crude oil, NGLs and natural gas, forecasted commodity prices and factors affecting natural gasprices, forecasted general and administrative expenses, interest expenses, revenue, operating income, operating netbacks, funds from operations andyear‐end bank debt, management’s assessment of future potential, including years of drilling inventory and expectations with respect to natural gasdemand and supply in North America.. These forward‐looking statements are based on assumptions and are subject to numerous risks and uncertainties,certain of which are beyond the Company’s control, including the impact of general economic conditions; industry conditions; volatility of commodityprices; currency exchange rates; imprecision of reserve estimates; environmental risks; competition from other explorers; stock market volatility; oil andnatural gas development and transportation; actions by governmental authorities, including changes in government regulation, royalties and taxation;dependence upon compressors, gathering lines, pipelines and other facilities, certain of which the Company does not control; shortage or lack ofavailable of pipeline capacity or other transportation facilities; weather conditions, natural disasters and fires; and ability to access sufficient capital. Wecaution that the foregoing list of risks and uncertainties is not exhaustive. The use of any of the words “anticipate”, “continue”, “estimate”, “expect”,“may”, “will”, “should”, “believe”, “plans”, and similar expressions are intended to identify forward‐looking information or statements
Statements relating to “reserves” or “resources” are deemed to be forward‐looking statements as they involve the implied assessment, based on currentestimates and assumptions that the reserves and resources can be profitably produced in the future. Readers are cautioned that disclosure of any welltest results is not necessarily indicative of long‐term performance.
Velvet’s actual results, performance or achievement could differ materially from those expressed or implied by these forward‐looking statements. Noassurance can be given that any events anticipated herein will transpire or occur and such forward‐looking statements included in this presentationshould not be unduly relied upon.
In addition, the reader is cautioned that historical results are not necessarily indicative of future performance. The forward‐looking statementscontained herein are made as of the date of this presentation and the Company does not intend, and does not assume any obligation, to update orrevise any forward‐looking statements, whether as a result of new information, future events or otherwise, unless expressly required by applicablesecurities laws.
Certain information set out herein may be considered as “financial outlook” within the meaning of applicable securities laws. The purpose of thisfinancial outlook is to provide readers with disclosure regarding Velvet’s reasonable expectations as to the anticipated results of its proposed businessactivities for the periods indicated. Readers are cautioned that the financial outlook may not be appropriate for other purposes.

VELVET ENERGY LTD. – A GEOSCIENCE DRIVEN, ORGANIC GROWTH COMPANY
3
“Velvet is an organic growth company. We apply best‐in‐class geoscience and commercial skill to build large and
contiguous tracts of land in, and adjacent to, oil‐window source rocks. State‐of‐the‐art prospecting, drilling, completions, and
production methods allow us to generate top decile economic returns”
Velvet EdsonCore
550 net sections
Gold CreekMontney
245 net sections
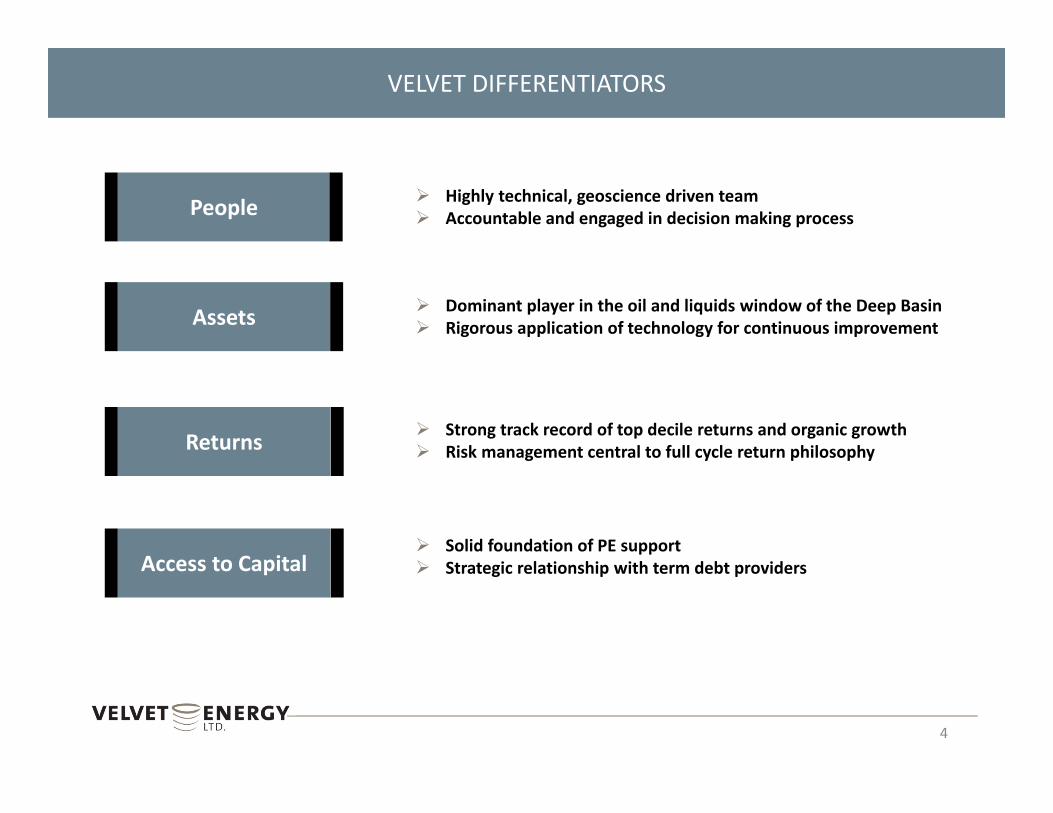
VELVET DIFFERENTIATORS
4
Highly technical, geoscience driven team Accountable and engaged in decision making processPeople
Assets
Returns
Access to Capital
Dominant player in the oil and liquids window of the Deep Basin Rigorous application of technology for continuous improvement
Strong track record of top decile returns and organic growth Risk management central to full cycle return philosophy
Solid foundation of PE support Strategic relationship with term debt providers

TRACK RECORD OF ORGANIC GROWTH
5
Over 90% of current production has been added via the drill bit
Disciplined acquisition strategy that targets hurdle rate of return on Multiple on Invested Capital (MOIC)
Vero 2011 Lightstream 2014 McLeod 2017
Continue to improve Edson full cycle E&D capex efficiency with objective to reduce to below $14k/boe/d
Daily Production
2011 2012 2013 2014 2015 2016
Capex ($mm) $39.5 $242.8 $110.7 $245.4 $108.3 $150.2
EBITDA ($mm) $24.4 $37.3 $87.3 $85.4 $84.6
Edson Wells drilled (G / N) 5 / 4.7 11 / 7.1 26 / 20.1 33 / 26.3 19 / 12.5 25/17.9
Success rate* (%) 79 80 92 82 92 94
2P FD&A cost ($/boe)** $33.51 $15.73 $13.22 $14.52 $14.33 $9.85
Note on acquisitions: 2012 capex included $195mm net acquisitions; $85mm in 2014* Success rate is post completion ** FD&A includes change in FDC
0
5,000
10,000
15,000
20,000
25,000
Corporate Prod
uctio
n (BOED
)
Vero Acq 2012 2013 LTS Acq 2014 2015 2016 2017 Dev Montney

MANAGEMENT & DIRECTORS
6
Ken Woolner, P.Eng, President & CEO
Geoff MacDonald, P. Geol, Vice President, Exploration
Jeremy Kwasnecha, P.Eng, Vice President, Operations
George Gervais, P. Eng., MBA, Executive Vice President
Chris Theal, CFA, CIM, Chief Financial Officer
Peter Henry, CA, Vice President, Finance
Ken Woolner, P.Eng, President & CEO
John Brussa, Partner, Burnet, Duckworth & Palmer LLP
Vincent Chahley, Independent Businessman
Robert E. Hougie, 1901 Partners LP
Jacob Strauss, Warburg Pincus
Harvey Doerr, Independent Businessman
Roger Smith, Independent Businessman
Christopher R. Manning, Trilantic Capital Partners
David B. Krieger, Warburg Pincus
MANAGEMENT
BOARD OF DIRECTORS
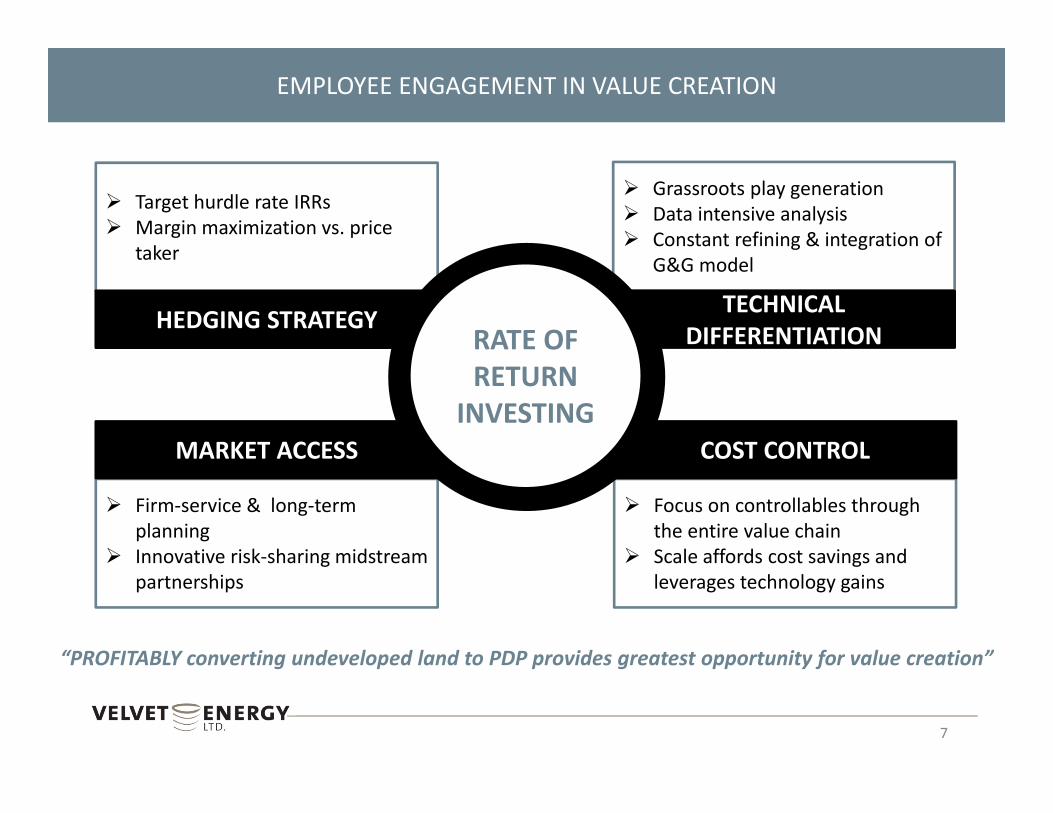
Firm‐service & long‐term planning
Innovative risk‐sharing midstream partnerships
Focus on controllables through the entire value chain
Scale affords cost savings and leverages technology gains
Grassroots play generation Data intensive analysis Constant refining & integration of
G&G model
Target hurdle rate IRRs Margin maximization vs. price
taker
EMPLOYEE ENGAGEMENT IN VALUE CREATION
7
“PROFITABLY converting undeveloped land to PDP provides greatest opportunity for value creation”
TECHNICAL DIFFERENTIATION
MARKET ACCESS COST CONTROL
HEDGING STRATEGYRATE OF RETURN
INVESTING
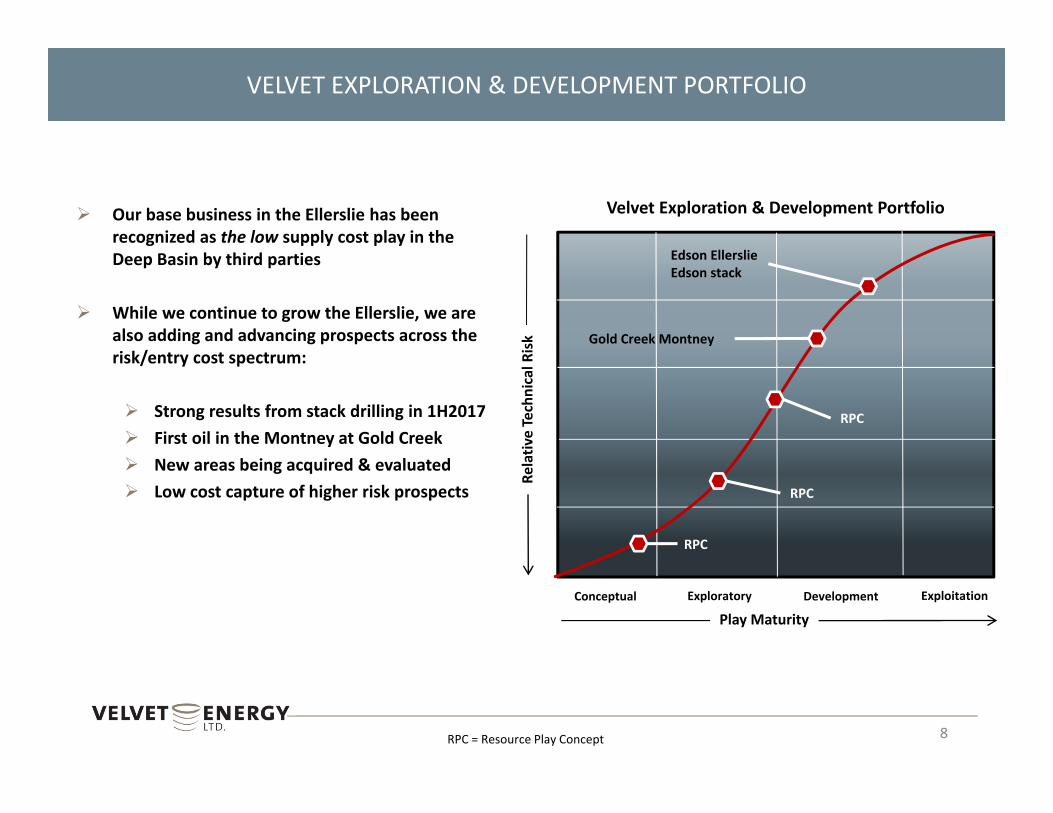
VELVET EXPLORATION & DEVELOPMENT PORTFOLIO
Our base business in the Ellerslie has been recognized as the low supply cost play in the Deep Basin by third parties
While we continue to grow the Ellerslie, we are also adding and advancing prospects across the risk/entry cost spectrum:
Strong results from stack drilling in 1H2017 First oil in the Montney at Gold Creek New areas being acquired & evaluated Low cost capture of higher risk prospects
8
Velvet Exploration & Development Portfolio
Conceptual Exploratory Development Exploitation
Play Maturity
Edson EllerslieEdson stack
Relativ
e Technical R
isk Gold Creek Montney
RPC
RPC
RPC
RPC = Resource Play Concept

Edson Ellerslie Hybrid Resource Play – High Return Base Business
9
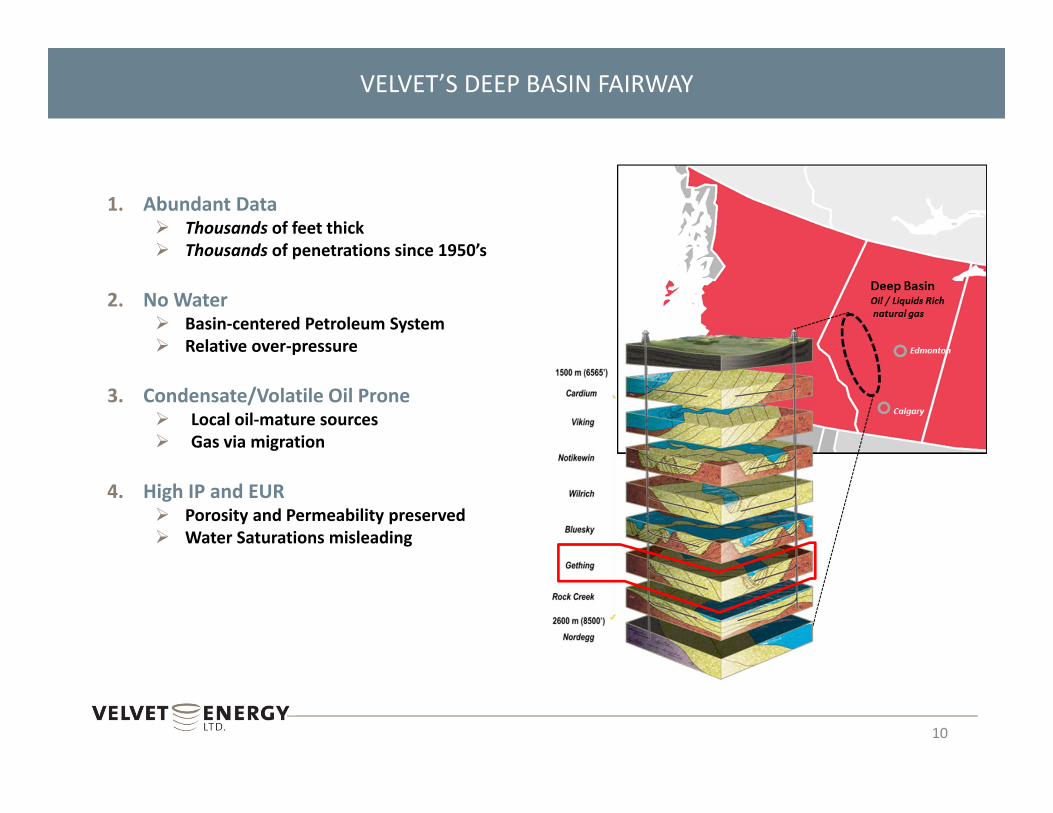
VELVET’S DEEP BASIN FAIRWAY
10
1. Abundant Data Thousands of feet thick Thousands of penetrations since 1950’s
2. No Water Basin‐centered Petroleum System Relative over‐pressure
3. Condensate/Volatile Oil Prone Local oil‐mature sources Gas via migration
4. High IP and EUR Porosity and Permeability preserved Water Saturations misleading
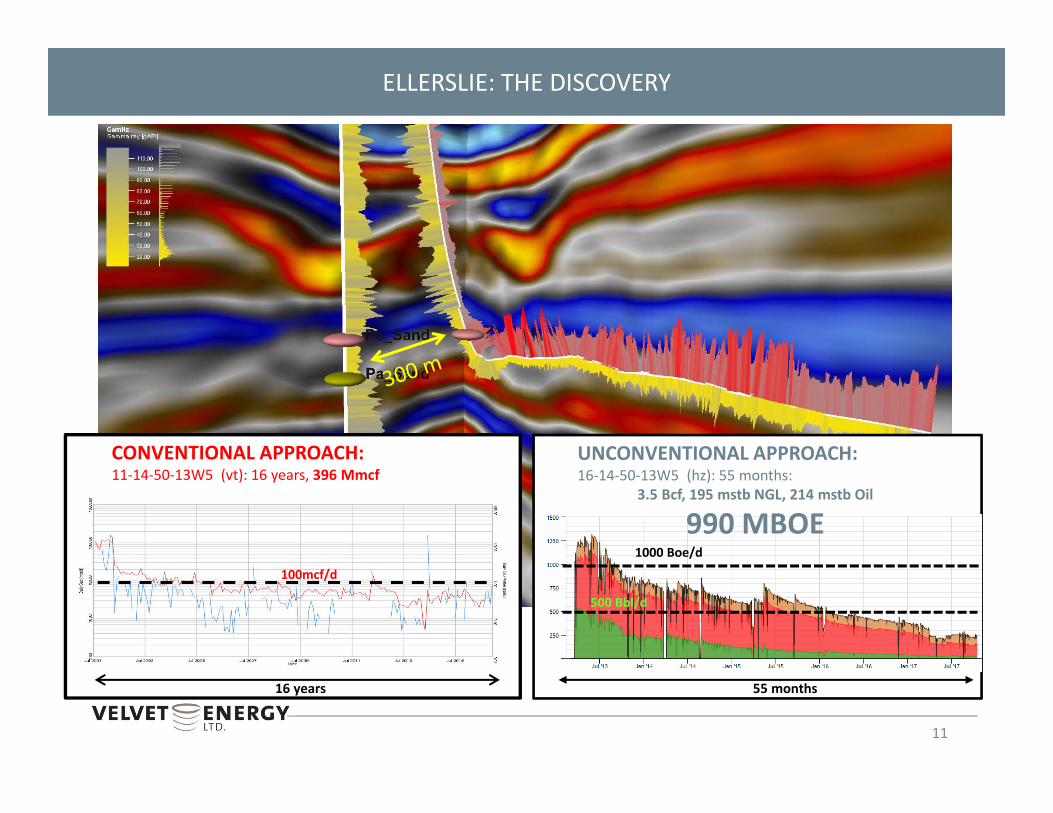
ELLERSLIE: THE DISCOVERY
11
1000 Boe/d
500 Bbl/d
UNCONVENTIONAL APPROACH: 16‐14‐50‐13W5 (hz): 55 months:
3.5 Bcf, 195 mstb NGL, 214 mstb Oil
990 MBOE
55 months
CONVENTIONAL APPROACH:11‐14‐50‐13W5 (vt): 16 years, 396 Mmcf
100mcf/d
16 years

A’
4‐33‐55‐17W5
2‐3‐53‐14W5
11‐14‐50‐13W5
A
12
Core from hundreds of wells were analyzed Consistent preservation of porosity and
permeability along the fairway = repeatable results
Production on hundreds of vertical wells was analyzed Horizontal wells demonstrate a significant multiple
of vertical well performance
500 um
4‐33‐55‐17W5Porosity: 9%; Perm: 2.5 mD
Offset Vt in 7 yrs: 0.137 bcf, 11 mstbOffset Hz in 36months:371 MBOE (1.6 BCF, 69 MStb)
500 um
2‐3‐53‐14W5Porosity: 7.8%; Perm: 0.4 mD
Offset Vt in 16 yrs:0.98 bcf, 30 mstb oilOffset Hz in 41 months:655 MBOE (2.7Bcf, 131MStb)
500 um
11‐14‐50‐13W5Porosity: 14.2%; Perm: 1.0 mD
Offset Vt in 16 yrs:0.39 bcfOffset Hz in 44 months:990 MBOE (3.5 Bcf, 214 MStb)
VEL Lower Mannville
VEL 3D Seismic
Images on rightShallow marine sand fairway
AN EXTENSIVE FAIRWAY

13
EDSON ELLERSLIE & STACK DRILLING INVENTORY
Edson Land and Ellerslie Resource Mapping Velvet maximizes value on every one of its 353,026net acres
Depth of inventory from a depth of understanding multi‐zone potential in deep basin‐centered
petroleum system synergies drive attractive half‐cycle economics
157 mmboe of potential EUR in the Ellerslie
*Land as at September 30, 2017. Inventory numbers as of June 30, 2017
Play IRR (%)
NPV10 ($mm)
Current Inventory(G / N)
Ellerslie 106 2.87 543/380
Notikewin / Falher 1‐mile 44 1.32 118/79
Wilrich Bayfill 1‐mile 47 1.64 102/77
Wilrich Shoreface TBD TBD 142/94
Bluesky 64 2.37 67 / 45
Rock Creek TBD TBD 51 / 31
Total Deep Basin 1,022/ 707
2017 Ellerslie Locations2018 Ellerslie Locations2019 Ellerslie Locations
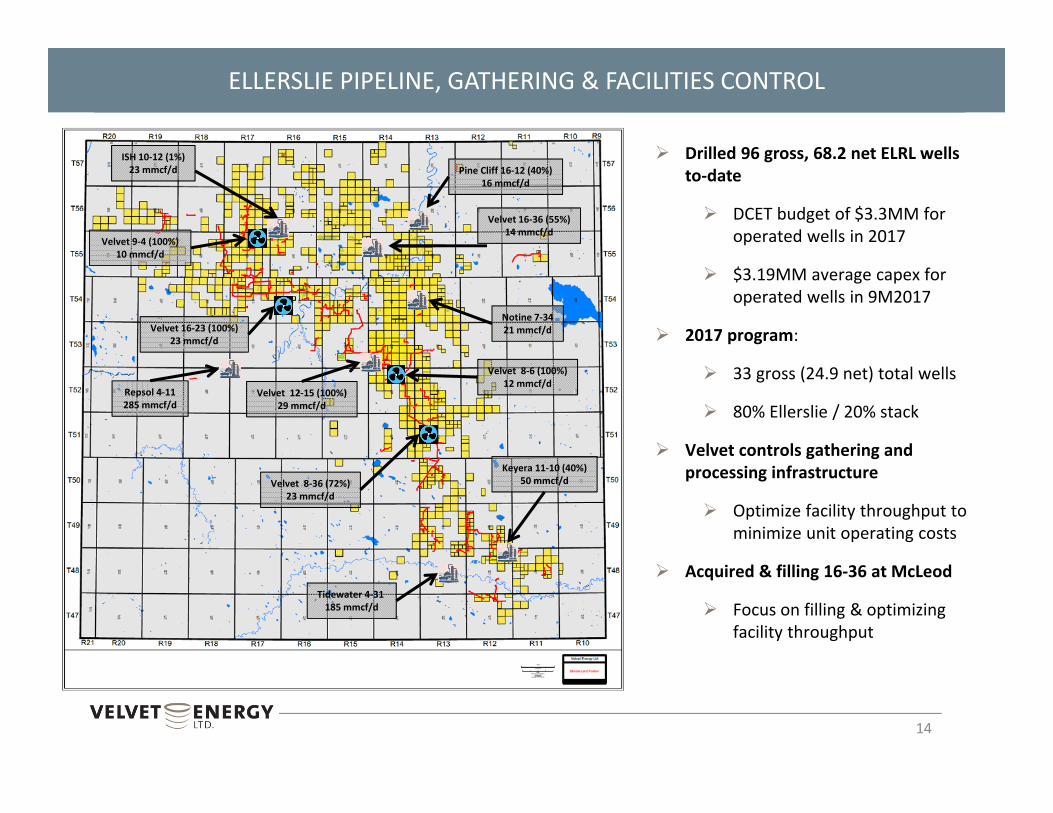
Drilled 96 gross, 68.2 net ELRL wells to‐date
DCET budget of $3.3MM for operated wells in 2017
$3.19MM average capex for operated wells in 9M2017
2017 program:
33 gross (24.9 net) total wells
80% Ellerslie / 20% stack
Velvet controls gathering and processing infrastructure
Optimize facility throughput to minimize unit operating costs
Acquired & filling 16‐36 at McLeod
Focus on filling & optimizing facility throughput
14
ELLERSLIE PIPELINE, GATHERING & FACILITIES CONTROL
Ellerslie Locations Only
Repsol 4‐11285 mmcf/d
Velvet 16‐23 (100%)23 mmcf/d
ISH 10‐12 (1%)23 mmcf/d
Notine 7‐3421 mmcf/d
Velvet 12‐15 (100%)29 mmcf/d
Keyera 11‐10 (40%)50 mmcf/dVelvet 8‐36 (72%)
23 mmcf/d
Velvet 8‐6 (100%)12 mmcf/d
Pine Cliff 16‐12 (40%)16 mmcf/d
Velvet 9‐4 (100%)10 mmcf/d
Tidewater 4‐31 185 mmcf/d
Velvet 16‐36 (55%)14 mmcf/d
Continuous Improvement Yields Higher Returns
15
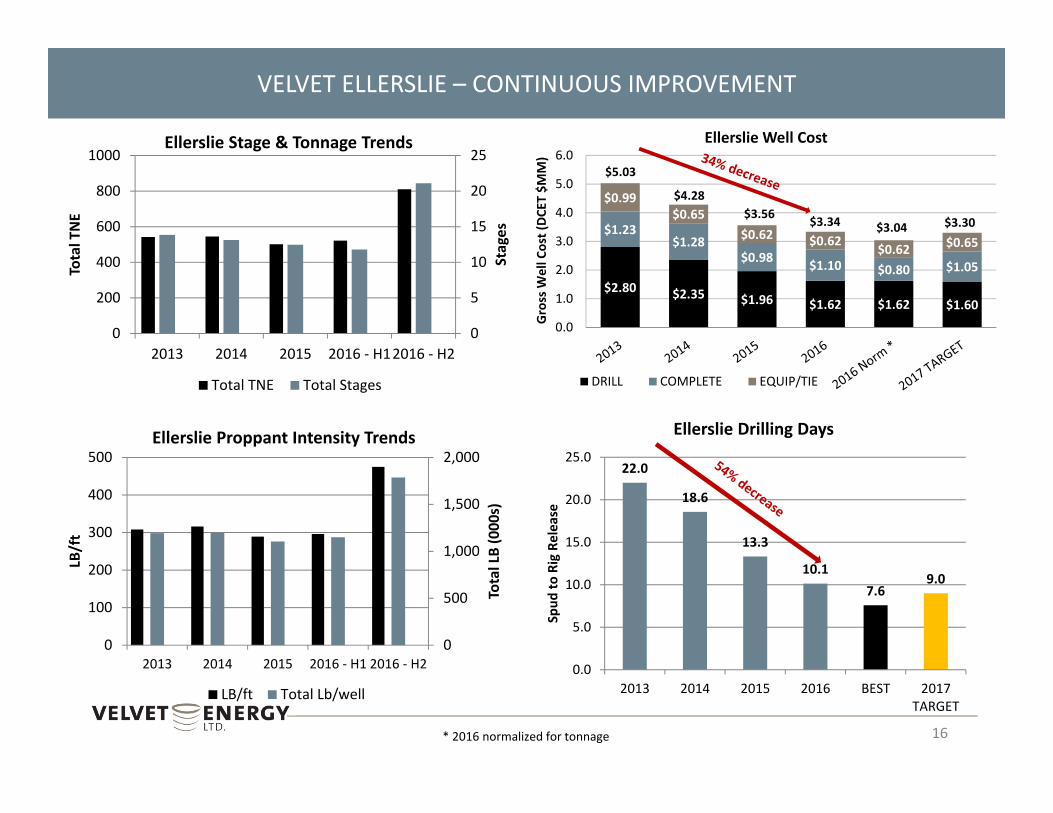
VELVET ELLERSLIE – CONTINUOUS IMPROVEMENT
16
0
5
10
15
20
25
0
200
400
600
800
1000
2013 2014 2015 2016 ‐ H12016 ‐ H2
Stages
Total TNE
Ellerslie Stage & Tonnage Trends
Total TNE Total Stages
0
500
1,000
1,500
2,000
0
100
200
300
400
500
2013 2014 2015 2016 ‐ H1 2016 ‐ H2
Total LB (000s)
LB/ft
Ellerslie Proppant Intensity Trends
LB/ft Total Lb/well
$2.80 $2.35 $1.96 $1.62 $1.62 $1.60
$1.23$1.28
$0.98 $1.10 $0.80 $1.05
$0.99$0.65
$0.62 $0.62 $0.62 $0.65
0.0
1.0
2.0
3.0
4.0
5.0
6.0
Gross W
ell Cost (DCE
T $M
M)
Ellerslie Well Cost
DRILL COMPLETE EQUIP/TIE
$5.03
$4.28$3.56 $3.34 $3.30$3.04
* 2016 normalized for tonnage
22.0
18.6
13.3
10.17.6
9.0
0.0
5.0
10.0
15.0
20.0
25.0
2013 2014 2015 2016 BEST 2017TARGET
Spud
to Rig Release
Ellerslie Drilling Days

0%
10%
20%
30%
40%
50%
60%
70%
80%
90%
100%
$0.00
$5.00
$10.00
$15.00
$20.00
$25.00
PEY
AAV
PMT
TOU
BIR
BNP CR
VEL w/o M
TG ARX
VEL w M
TG CKE
PNE
BXE
VII
CQE
ERF
SRX
BTE
TVE
VET
GTE
WCP
POU
KEL
RRX
PGF
TOG
BNE
NVA DEE JOY
SGY
CPG
GXE
OBE
MQX
SPE
PXX CJ
% Liquids
$/bo
e
2018 Opex + Transport 2018 % Liquids
PEER GROUP OPEX + TRANSPORTATION COST – 2018E
As Montney grows, Velvet maintains a top quartile Opex + Tport cost structure Similarly weighted liquids‐rich Montney peers Opex + Tport average $12.28/boe (KEL, POU, NVA, DEE, VII)
VEL at $9.15/boe in 2018
17
2018 Opex + Transportation Cost vs. Liquids Weight
Source: Peters & Co researchPeters restricted on VII; VII 1H17 was $10.21/boe
Comparable liquids weights
VEL
0
100
200
300
400
500
600
700
800
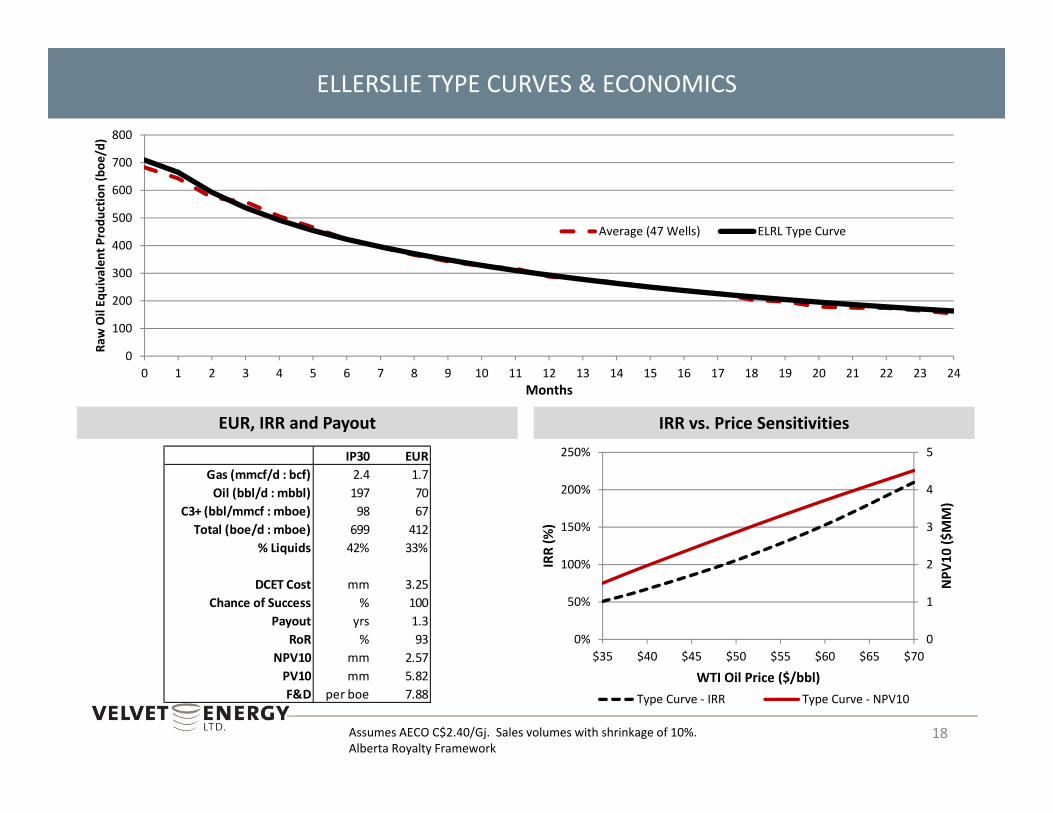
0 1 2 3 4 5 6 7 8 9 10 11 12 13 14 15 16 17 18 19 20 21 22 23 24
Raw Oil Eq
uivalent Produ
ction (boe
/d)
Months
Average (47 Wells) ELRL Type Curve
ELLERSLIE TYPE CURVES & ECONOMICS
18Assumes AECO C$2.40/Gj. Sales volumes with shrinkage of 10%. Alberta Royalty Framework
IRR vs. Price SensitivitiesEUR, IRR and Payout
IP30 EURGas (mmcf/d : bcf) 2.4 1.7Oil (bbl/d : mbbl) 197 70
C3+ (bbl/mmcf : mboe) 98 67Total (boe/d : mboe) 699 412
% Liquids 42% 33%
DCET Cost mm 3.25Chance of Success % 100
Payout yrs 1.3RoR % 93
NPV10 mm 2.57PV10 mm 5.82F&D per boe 7.88
0
1
2
3
4
5
0%
50%
100%
150%
200%
250%
$35 $40 $45 $50 $55 $60 $65 $70
NPV
10 ($
MM)
IRR (%
)
WTI Oil Price ($/bbl)Type Curve ‐ IRR Type Curve ‐ NPV10

VELVET ELLERSLIE IS THE LOWEST DEEP BASIN SUPPLY COST
19Source: RS Energy Group, November 2016
Third party research: “Velvet’s Ellerslie, a liquids‐rich zone, has the lowest operator zone breakeven at $1.97/mcfe HH”

20
Independent research ranks Velvet Ellerslie (Pembina) as a top five BT IRR play in North America
VELVET ELLERSLIE RELATIVE RATE OF RETURN
Gold Creek Montney –Unlocking the Oil Window
21
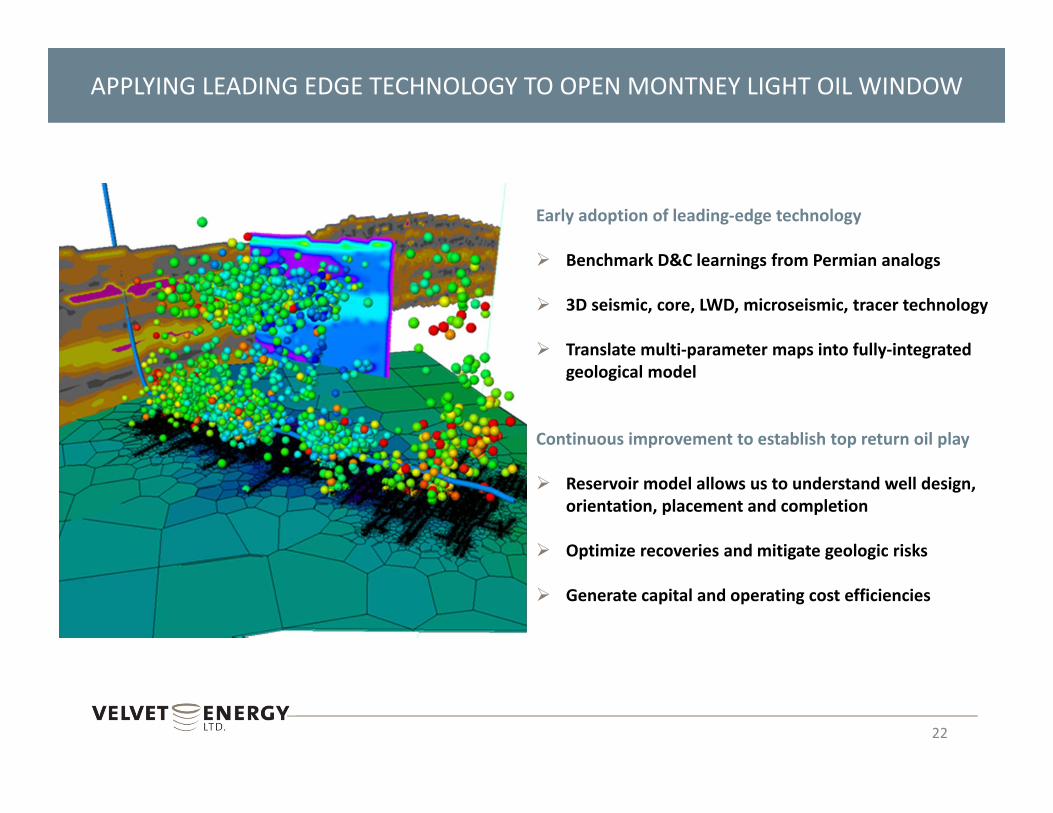
APPLYING LEADING EDGE TECHNOLOGY TO OPEN MONTNEY LIGHT OIL WINDOW
22
Early adoption of leading‐edge technology
Benchmark D&C learnings from Permian analogs
3D seismic, core, LWD, microseismic, tracer technology
Translate multi‐parameter maps into fully‐integrated geological model
Continuous improvement to establish top return oil play
Reservoir model allows us to understand well design, orientation, placement and completion
Optimize recoveries and mitigate geologic risks
Generate capital and operating cost efficiencies

GOLD CREEK MONTNEY
23
TCPL/NOVA
MERITAGEPATTERSON CREEK
VELVET 11‐2 PAD:• BATTERY: 16,000 BBLS/d, 25,000 mmcf/d• ON‐SITE DISPOSAL WELL• 12‐10 ON PRODUCTION• 4 WELLS COMING ONSTREAM Q4/17• SPUD 5 WELL PAD Q4/17
VEL 4‐1 PAD:• 1‐10 ON PRODUCTION
VEL 11‐5 PAD:• 15‐7 ON PRODUCTION
CNRL GOLD CREEK
CNRL WAPITI
VELVET ADVANTAGELand: 245 net sectionsGeoscience:• > 500m core • 5 wells microseismic• 58 mi2 proprietary 3D
VELVET
3D SEISMIC
PIPELINEVELVET WELLSMONTNEY WELLS

CORPORATE INFORMATION
24
AuditorsPricewaterhouseCoopers, LLPReservoir EngineersGLJ Petroleum ConsultantsBankersCanadian Imperial Bank of CommerceRoyal Bank of CanadaBank of MontrealThe Toronto‐Dominion BankSolicitorsBurnet, Duckworth & Palmer LLP
Velvet Energy Ltd.1500, 308 4th Avenue SWCalgary, AB T2P 0H7
P: 403.781.9125
Investor contacts:
www.velvetenergy.ca


