63
1 Tube Investment of India Limited Investor Presentation May 2016 Stock Codes: BSE: 504973 NSE: TUBEINVEST Bloomberg: TI IN / TI IB Reuters: TUBE.NS / TUBE.BO CIN: L35921TN1949PLC002905

1 Tube Investment of India Limited
Investor Presentation May 2016
Stock Codes: BSE: 504973 NSE: TUBEINVEST Bloomberg: TI IN / TI IB Reuters: TUBE.NS / TUBE.BO CIN: L35921TN1949PLC002905

2
1.About Murugappa Group
2.Tube Investments of India Limited
3.Business Divisional Performance
4.Company Financials
This presentation contains forward-looking statements which may be identified by their use of words like “plans,” “expects,” “will,” “anticipates,”
“believes,” “intends,” “projects,” “estimates” or other words of similar meaning. All statements that address expectations or projections about the future,
including, but not limited to, statements about the strategy for growth, product development, market position, expenditures, and financial results, are
forward-looking statements.
Forward-looking statements are based on certain assumptions and expectations of future events. The companies referred to in this presentation cannot
guarantee that these assumptions and expectations are accurate or will be realized. The actual results, performance or achievements, could thus differ
materially from those projected in any such forward-looking statements. These companies assume no responsibility to publicly amend, modify or revise
any forward looking statements, on the basis of any subsequent developments, information or events, or otherwise.
-------------------------------------------------------------------------------Disclaimer-------------------------------------------------------------------------------
Contents

3
INR 269 Billion* Conglomerate
One of the largest family promoted, professionally managed, diversified business groups…
Murugappa Group
* FY 2014-15

4
Philosophy – “The fundamental principle of economic activity is that no man you transact with will lose; then you shall not.”
- Arthashastra
Murugappa Group-Spirit and Philosophy

5
5/23/2016 Copyright TI | All Rights Reserved
www.tiindia.com
Murugappa Group Today

6
Gross Sales Share
EBITDA Share
TII (Consolidated) represent 37% of Gross Sales and 42% of EBITDA of Murugappa Group for FY 2014-15
Murugappa Group
Note: Market data as on 31st Mar 2016. Source: BSE Sensex and Conversion Rate of 1USD = Rs.66.3329 as on 31st Mar 2016 Source: RBI
FY 2014-15
FY 2014-15

7
Tube Investments of India Limited

8
TII- A Conglomerate
• TI Cycles setup with BSA and Hercules Brands 1949
• Entered Precision tubes with incorporation of Tube Products of India 1955
• Entered Chains business with incorporation of TIDC 1960
• TI Metal Forming setup 1965
• Promoted Cholamandalam Investment and Finance Company Ltd 1978

9
TII- A Conglomerate
• Indigenously manufactured 100 CC bike chain 1985
• Promoted Cholamandalam MS General Insurance 2001
• Acquired SEDIS, France 2010
• Acquired Shanthi Gears Ltd 2012
• Entered into Large Dia Tube manufacturing
• Promoted TI Tsubamex Pvt Ltd 2014
• TI sold 14% stake in Cholamandalam MS General Insurance Company to partner, Mitsui Sumitomo Insurance Company
2016

10
Manufacturing
• Manufacturers of
• Tubes, Strips, & Tubular Components
• Bicycles & Fitness Products,
• Chains for Automobile sector & Industrial applications,
• Doorframe & Channels
• Industrial Gears
• Designing & Manufacturing of Dies
• 23 Manufacturing Locations
• Suppliers to all major automotive OEM’s in India
• Focus on Quality & Operational excellence
Financial Services
Financing
• 534 branches across 25 states /Union Territories
• 90% presence across Tier II, Tier III & Tier IV towns
General Insurance
• 105 branches and over 9000 agents across the country.
Key Financials (TII Consolidated)
₹ Cr. 2015-16* 2014-15 Growth
Revenue 7,991 9,722 -18%
EBITDA 928 1,259 -26%
PBIT (Including Other Income)
785 1,112 -29%
PBT (Before Exceptional Items)
648 969 -33%
Exceptional Items 727 34
PBT (After Exceptional Items)
1,374 1,003 37%
Net Profit 1,039 424 145%
Corporate Overview
*Revenue, EBITDA and PBIT of FY 15-16 includes CIFCL financials up to Aug ’15 only as CIFCL ceased to be a subsidiary w.e.f. 2nd September, 2015. However, Net Profit includes entire full year Net Profit of CIFCL.

11
Leadership Position- TII Standalone
Preferred supplier for metal formed door frames
Largest Supplier of Steel Precision Tubes (CDW)
Second largest bicycle producer in India
Leader in Chains and Fine blanked components

12
Mr. M. M. Murugappan
Chairman Mr. L. Ramkumar Managing Director
Mr. N. Srinivasan Mr. S. Sandilya Mr. Pradeep V. Bhide
Mr. C.K. Sharma Mr. Hemant Nerurkar
Directors
Ms. Madhu Dubhashi
Directors and Management

13
List of Subsidiary Companies
Company Relationship Country of
Incorporation
Proportion of Ownership
As on 31 Mar'16
As on 31 Mar 15
Cholamandalam MS General Insurance Company Limited (CMSGICL)
Subsidiary India 60.00% 74.00%
TI Financial Holdings Limited (TIFHL) Subsidiary India 100.00% 100.00%
Financiere C10 SAS (FC 10) Subsidiary France 100.00% 100.00%
Cholamandalam Investment and Finance Company Limited (CIFCL)
Subsidiary up to 1 Sep 2015 and Associate
w.e.f. 2 Sep 2015 India 46.26% 50.28%
Shanthi Gears Limited (SGL) Subsidiary India 70.12% 70.12%
Cholamandalam MS Risk Services Limited (CMSRSL)
Jointly Controlled Entity
India 49.50% 49.50%
TI Tsubamex Private Limited (TTPL) Subsidiary India 75.00% 75.00%

14
• Credit Rating
CRISIL AA for long term
CRISIL A1+ for short term
• Standalone Balance Sheet
Sold 14% Stake in CMSGICL for `883 Cr. and invested `719 Cr. (After taxes) in Fixed Deposit on 31st March 2016
Special Dividend of `3.50 per share Proposed - `79 Cr. (including DDT)
Plans to repay Long Term NCDs to the tune of `640 Cr. in FY 2016-17 out of `1108 Cr.
• Financial Services
• Capital adequacy ratio – 19.68% (Stipulated limit – 15%)
• General Insurance
• Solvency ratio – 1.61
Financial Strength
0.73 0.75
1.10 1.10 1.08
0.71
0.00
0.20
0.40
0.60
0.80
1.00
1.20
2010-11 2011-12 2012-13 2013-14 2014-15 2015-16
Total Debt/Equity
• Total Debt / Equity – 0.71
(Proforma considering Debt Reduction is 0.38)
• Long term Debt / Equity – 0.57
(Proforma considering Debt Reduction is 0.24)

15
050
100150200250300350400450500
31-M
ar-1
0
30
-Ju
n-1
0
30-S
ep-1
0
31-D
ec-1
0
31-M
ar-1
1
30
-Ju
n-1
1
30-S
ep-1
1
31-D
ec-1
1
31-M
ar-1
2
30
-Ju
n-1
2
30-S
ep-1
2
31-D
ec-1
2
31-M
ar-1
3
30
-Ju
n-1
3
30-S
ep-1
3
31-D
ec-1
3
31-M
ar-1
4
30
-Ju
n-1
4
30-S
ep-1
4
31-D
ec-1
4
31-M
ar-1
5
30
-Ju
n-1
5
30-S
ep-1
5
31-D
ec-1
5
31-M
ar-1
6
Share Price Movement
Uninterrupted dividend history for 62 years Dividend payout policy ~25-30% of profits
TII – Share Price and Shareholding Pattern
31st Mar’16: ₹ 387.05
48.9% 48.8% 48.8% 48.8% 48.8%
13.2% 13.3% 13.6% 14.0% 14.7%
12.2% 12.0% 12.1% 11.7% 11.1%
25.7% 25.8% 25.5% 25.5% 25.4%
0%
10%
20%
30%
40%
50%
60%
70%
80%
90%
100%
Mar-15 Jun-15 Sep-15 Dec-15 Mar-16
Shareholding Pattern
Promoter FII DII Others
16
Pioneers in Selling Cycling… not just cycles
Cycles / Components

17
Industry- FY15-16
Institutional Sales driving large volumes in the industry
Growth in Fancy & Premium segments while Standards are in decline in Trade
Business Drivers
Large dealer network across India – over 10,000 touch points across India
Expansive Retail Formats in Urban (BSA Stores), Rural (RHB), Lifestyle (Track& Trail): around 660 stores
Multi Locational Servicing Centers
Continuous New product development
Extensive BTL & ATL activities
Focus on Exports
State of the Art manufacturing facilities for Alloy and Carbon
Based on volumes of 4 Major players (Source: AICMA Data)
₹ 20 Cr. 2014-15
Capital Expenditure
Industry and Business Drivers
38%
32%
16%
14%
Market Share - FY 15-16
HERO TICI AVON ATLAS
₹ 51 Cr. 2015-16
42% 48%
58% 52%
0%
20%
40%
60%
80%
100%
TII Industry
Trade Sales
Standards Specials

18
• Our flagship brands “BSA” and “HERCULES” were recognised for excellence at the World brand Congress in Singapore. Brand equity
• During the year, Super premium had registered an overall growth of 78 %.
Super Premium Lifestyle Cycles
• BSA Go, BSA Hercules Store, Track & Trial Lounge Pioneer in Retail Formats
• Organised close to 2000 events all over the country participation of more than 10 Lakhs individuals
Selling Cycling not Just Cycles
• Large dealer and service network with more than 10,000 touch points through out the country
Multi Location Servicing
• 60 new Products developed during the year Pioneer in New Product Development
Key Success Factors

19
45.6 Lac Cycles sold in FY 15-16 which is 14% growth in volume
78% Growth in Super Premium
32% Growth in Roadeo
60 New Products and 30 Product refreshes delivered in the year
Track & Trail repositioned as one stop shop for all things cycling
New Urban adult segment “City Bike” a hit
Long Term Partnership with Ridley for 33 Years
BSA Lady Bird wins the Brand Revitalization Award at the Global Marketing Excellence Awards by CMO Asia
BSA Lady Bird Vogue won the CII Design Excellence Award
Hercules Trooper won the India Design Mark awarded by the India Design Council
Business Highlights FY 15-16

20
Business Highlights FY 15-16

21
figures in ₹ Crores
1114 1285 1255
1179 1307
1477
0
200
400
600
800
1000
1200
1400
1600
2010-11 2011-12 2012-13 2013-14 2014-15 2015-16
Sales
Key Financial Trends
ROCE is calculated based on end figures
105%
84%
57% 62%
34% 30%
0%
20%
40%
60%
80%
100%
120%
2010-11 2011-12 2012-13 2013-14 2014-15 2015-16
ROCE %

22
Key Financials – 2015-16
figures in ₹ Crores
Particulars 2015-16 2014-15 % Growth
Volumes
Cycles (Lac nos) 46 40 14%
Net Sales (incl. Inter Unit) 1477 1307 13%
EBITDA 87 65 35%
6% 5%
PBIT (Before Exceptional Item) 79 58 37%
5% 4%
APPLICATION OF FUNDS
Net Fixed Assets (Incl. CWIP) 110 59
Net Working Capital 155 111
Total Capital Employed 265 170
Sales/NWC 9.5 11.7
ROCE% 30% 34%

23
Leader in CDW tubes for the Automotive industry
Engineering

24
Industry
Tubes: Significant Player in safety critical applications
2 wheelers: Leader in Front Forks in India 4 wheelers: Leader in many critical
applications such as side impact beam, steering columns etc.
CRSS: Niche player in specialized products Tubular Components: Value added
products
Business Drivers
Manage High Variety demand in Tubes and strips effectively
High Focus on Value Addition Products
New Facility for Non-Auto Segment
Focus on internal efficiencies
₹ 87 Cr. 2014-15
Business Mix
Auto 77%
Non-Auto 23%
Capital Expenditure
₹ 44 Cr. 2015-16
Business Overview

25
Key Success Factors
• Market leader in High Quality & Safety critical CDW Tubes for 2W and 4W applications CDW Tube
• Plants at 4 different locations, well placed in all the regions Multi Location
• Large-dia plant gave a significant foray into Non Auto segment
Gearing for Non-Auto
• Continued focus on special grades CRSS
• Tubular components including Steering column, side impact beam etc.
Value Added Products

26
Business Highlights FY 15-16
Received the “Global Strategic Co-operation Award”
from Showa Corporation towards helping Showa with
their sourcing of Front Fork tubes for ASEAN
Received Award from WIPRO for consistent
improvement in Quality
Large Diameter Tubes plant commissioned at Tiruttani,
Chennai
New Green Field Warehouse in Hosur inaugurated
Continued cost reduction momentum
OSHSAS 18001 Certification for TPI Mohali
IMS: EMS + OHSAS certification received from M/s BVC
for Avadi Complex

27
Large Diameter Tube Plant Commissioned

28
figures in ₹ Crores
Key Financial Trends
ROCE is calculated based on end figures
1190
1449 1467 1510 1606 1534
0
500
1000
1500
2000
2010-11 2011-12 2012-13 2013-14 2014-15 2015-16
Sales
29% 29%
22% 22%
17% 16%
0%
5%
10%
15%
20%
25%
30%
35%
2010-11 2011-12 2012-13 2013-14 2014-15 2015-16
ROCE %

29
figures in ₹ Crores
Key Financials 2015-16
Particulars 2015-16 2014-15 % Growth
Strips: (Volumes Tonnes) (Incl. group) 77535 80269 -3%
Tubes: (Volumes Tonnes) 154208 154029 0%
Domestic 143605 142967 0%
Exports 10603 11062 -4%
Large Dia Tubes: (Volumes Tonnes) 14059 1086
Net Sales (incl. Inter Unit) 1534 1606 -5%
EBITDA 155 150 4%
10% 9%
PBIT (Before Exceptional Item) 95 103 -8%
6% 6%
APPLICATION OF FUNDS
Net Fixed Assets (Incl. CWIP) 438 465
Net Working Capital 153 154
Total Capital Employed 591 620
Sales/NWC 10.0 10.4
ROCE% 16% 17%

30
Metal Formed Products
Precision Value added Components

31
Business Overview
Industry
Growth in 2W Scooters by 12%, but decline in motor cycles by 2% in the year
Passenger vehicle industry grew by 6% compared to last year and Commercial vehicle industry grown by 4%
Slow to moderate growth in Europe & US
Railways: ICF increased the production of Stainless steel coaches
Business Drivers
Factories located closer to customer locations
Strong “DIAMOND” brand
High quality products - Customer end rejections well below the customer targets
Leveraging Acquisitions – SEDIS Synergies
Increasing Portfolio for Fine Blanking
Expand applications for Industrial Segment
Business Mix
Capital Expenditure
₹ 26 Cr. 2015-16
7%
20%
73%
Railways
Non-Auto
Auto
₹ 26 Cr. 2014-15

32
Key Success Factors
• Market leader in Drive chain and Cam chain in OEM segment Segment Leader
• Strategically located plants near leading OEMs Multi Location
• Strong brand equity - “Diamond and Rombo” brands Brand Equity
• PPM less than customer target Quality
• Catering to major 2W OEMs and Tier 1 Auto customers; IC OEMs in Domestic & Exports; Large dealership network in Auto and IC
Customers
• Fine blanking, motor casings Critical
application Representative list not exhaustive

33
Business Highlights FY 15-16
TIDC received Certification of appreciation - Quality award from Maruti Suzuki India Ltd
Award received from Lear for “ Excellence in Part Development” for seat recliner localization development
Market Leadership in Chains and Doorframes
Highest NPD sales in Industrial Chains segment
New Products viz 2-Wheeler Casings, Solenoid for M+Acer added in Casings
Growth in Coach Side wall and Roof volumes for Railways

34
Key Financial Trends
figures in ₹ Crores
ROCE is calculated based on end figures
769
860
795 799
875
909
650
700
750
800
850
900
950
2010-11 2011-12 2012-13 2013-14 2014-15 2015-16
Sales
24% 23%
16% 14%
17%
21%
0%
5%
10%
15%
20%
25%
30%
2010-11 2011-12 2012-13 2013-14 2014-15 2015-16
ROCE %

35
figures in ₹ Crores
Key Financials 2015-16
Particulars 2015-16 2014-15 % Growth
Doorframes (Lakh Sets) 6 7 -5%
Sections for railway wagons (Sets) 1156 1542 -25%
Coach-side/End wall (Sets) 112 43 161%
Chains:
Domestic (Lac ESS feet) 843 791 7%
Exports (Lac ESS feet) 72 72 -1%
Net Sales (incl. Inter Unit) 909 875 4%
EBITDA 123 116 6%
14% 13%
PBIT (Before Exceptional Item) 86 81 6%
9% 9%
APPLICATION OF FUNDS
Net Fixed Assets (Incl. CWIP) 258 315
Investments 61 61
Net Working Capital 95 100
Total Capital Employed 414 477
Sales/NWC 9.6 8.7
ROCE% 21% 17%

36
Metal Formed Products (Contd.)
Leading French Manufacturer of Industrial Chains

37
• F C 10 – Holding company of Sedis
Two plants in France
Five global patents
Leader in special and engineering class chains
Range of industries catered to
Waste Treatment / Car / escalator / textiles / food processing / packaging / cement / sugar / paper / water treatment / lumber / dams / amusement park / Oil Platforms
Leader in France
Present in around 100 countries
Around 200 distributors
Around 400 sale points
Leaf & Roller Chains Conveyor Chains
Agricultural Chains Sprockets & Wheels
France & Italy, 68%
Rest of World,
32%
Sales Mix Y ‘15
Key Products
Business Overview

38
Key Financial Trends
figures in K Euro
ROCE is calculated based on end figures
27882
33256 33265
31800 32668 32804
24000
26000
28000
30000
32000
34000
2010 2011 2012 2013 2014 2015
Sales
9%
15%
4% 4%
0% 1% 0%
5%
10%
15%
20%
2010 2011 2012 2013 2014 2015
ROCE %

39
figures in K Euro
Key Financials
Particulars 2015 2014
Net Sales 32804 32668
EBITDA 1192 1193
4% 4%
PBT -342 -380
-1% -1%
PAT 23 -26
0% 0%
APPLICATION OF FUNDS
Net Fixed Assets (Incl. CWIP) 6470 6459
Net Working Capital 12572 11201
Goodwill on Consolidation 577 721
Total Capital Employed 19619 18381
Sales/NWC 2.6 2.9
ROCE% 1% 0%

40
Gears & Gear Products
Shanthi Gears (SGL) - Strong Brand in Industrial Gears

41
• Began operations in 1969 at Coimbatore
• Leader in custom-made gears & loose gears
• ~70% of revenues come from customized
products
• Fully integrated operations with in-house
• R&D team
• Design and engineering capabilities
• Foundry, Fabrication and forging unit
• Comprehensive Heat treatment facilities
• Tool room for manufacturing hobs,
cutters
•Gears & Pinions
•Gear boxes
•Geared motors
TII holds 70.12% stake in the company
Key Products
Shareholding Pattern
•Gear assemblies
•Worm Spares
•Service & Repair
Business Overview
70.1% 70.1% 70.1% 70.1% 70.1%
0.1% 0.1% 0.0% 0.0% 0.0% 6.9% 7.0% 7.2% 7.4% 5.7%
22.9% 22.8% 22.7% 22.5% 24.2%
0%
10%
20%
30%
40%
50%
60%
70%
80%
90%
100%
Mar-15 Jun-15 Sep-15 Dec-15 Mar-16
Others
DII
FII
Promoter

42
• Increased enquiry activities from repeat
customers and railways
• Business revived with many prestigious
Government PSUs
• Revenue from Service of Gears achieved
higher than plan
• Focus continues on high contribution orders
• Focus on Capacity Enhancement and Cost
Business Highlights

43
figures in ₹ Crores
Key Financial Trends
ROCE is calculated based on end figures
162 173
144 151 152 162
0
50
100
150
200
2010-11 2011-12 2012-13 2013-14 2014-15 2015-16
Sales
18% 16%
8% 10%
5%
8%
0%
5%
10%
15%
20%
2010-11 2011-12 2012-13 2013-14 2014-15 2015-16
ROCE %

44
figures in ₹ Crores
Key Financials 2015-16
Particulars 2015-16 2014-15 % Growth
Net Sales 162 152 7%
EBITDA 32 18 73%
19% 12%
PBIT 23 13 79%
14% 9%
PBT 23 13 79%
14% 9%
PAT 18 9 96%
11% 6%
APPLICATION OF FUNDS
Net Fixed Assets (Incl. CWIP) 74 85
Investments 49 16
Net Working Capital 154 171
Total Capital Employed 276 272
Sales/NWC 1.1 0.9
ROCE% 8% 5%

45
Financial Services
Cholamandalam Investment and Finance Company Ltd. (CIFCL)
Financing your Assets…since 1978
36

46
• Established in 1978, one of India’s
leading NBFC’s, focused in the rural and
semi-urban sector with a market
capitalization of INR 100 bn
• Presence across vehicle finance,
business finance, home equity loans,
stock broking and distribution of
financial products
• Operates from 534 branches across 25
states and 90% presence across Tier II,
Tier III and IV towns
• One of the leading NBFCs in rural / semi
urban areas
Shareholding Pattern
Business Overview
76%
21%
3%
Disbursements - FY 15-16
Vehicle Finance Home Equity Others

47
Business Strengths
•Founded in 1978, India’s leading NBFC, Focused in Rural and semi urban sector with Market cap of INR 100 bn Positioning
•Part of the INR 269 bn Murugappa Group – founded in 1900, one of India’s leading business conglomerate Exceptional Lineage
•Presence across vehicle finance, business finance, home equity, loans, stock broking and distribution of financial products
Robust Sector Growth
•Operates across 534 branches in 25 states and 90% presence in Tier II, Tier III and IV towns Diversified Footprint
•Total AUM of INR 322 Bn. with Net NPA of 2.1% and a healthy ROA of 2.3%
•Operating income CAGR of 24% over FY12 to FY16 Robust Operating
Profile
•Highly experienced management team with unrivalled industry experience Management

48
CIFCL – Standalone Performance
₹ 4,941 Cr ₹ 192 Cr
₹ 16,380 Cr ₹ 569 Cr
₹ 3,509 Cr ₹ 136 Cr
₹ 12,808 Cr ₹ 435 Cr

49
Key Financial Trends figures in ₹ Crores
5731
8888
12118 13114 12808
16380
0
2000
4000
6000
8000
10000
12000
14000
16000
18000
2010-11 2011-12 2012-13 2013-14 2014-15 2015-16
Disbursements
1206 1779
2556
3263 3691
4194
0
1000
2000
3000
4000
5000
2010-11 2011-12 2012-13 2013-14 2014-15 2015-16
Total Income
1.4%
2.7% 3.0%
2.8% 3.0%
3.6%
0.0%
0.5%
1.0%
1.5%
2.0%
2.5%
3.0%
3.5%
4.0%
2010-11 2011-12 2012-13 2013-14 2014-15 2015-16
ROTA (PBT)

50
figures in ₹ Crores
Key Financials
Particulars 2015-16 2014-15 %Growth
Disbursements 16380 12808 28%
Total Income from Operations
4194 3691 14%
26% 29%
PBT 871 657 33%
5% 5%
PAT 569 435 31%
3% 3%
ROTA% (PBT) 3.6% 3.0%
Capital Adequacy Ratio (%) 19.68% 21.24%

51
Insurance

52
• Among the fastest growing general insurance
companies in India
• 7th largest private general insurance company in
India
• Product basket comprises accident, engineering,
health, liability, marine, motor, property, travel
and rural insurance for individuals, SMEs and
corporates
• Leading insurer for Japanese / Korean business
interests in India
60%
40%
TII Mitsui Sumitomo
₹ Crore FY 15-16 FY14-15
GWP (inc RI Accept)
2466 1896
PAT 148 137
Share Holding
Business Overview

53
Business Strengths
Strong Distribution Partners
Robust Underwriting Capability and
operating efficiencies Tailor Made Products
Strong Chola Synergies High Rural Penetration State of the Art
Technology

54
• GWP - growth of 30% over FY 14-15
• Motor and Fire Products show significant growth over PY
• Significant growth in Partnership and Proprietary channels
• The performance of Partnership and Government segments achieve targets
above plan
Business Highlights

55
figures in ₹ Crores
Key Financials
Particulars FY
2015-16 2014-15 % Growth
Gross Written Premium (Incl. RI Accept)
2466 1896 30%
Net Written Premium 2058 1571 31%
PBT 213 201 6%
PAT 148 137 8%
Total Investment 3861 3165 22%
Combined Ratio (CoR%) 105% 104%
Investment Yield % 9.58% 10.06%

56
Company Financials

57
335
536 674
789
1003
1374
0
200
400
600
800
1000
1200
1400
1600
2010-11 2011-12 2012-13 2013-14 2014-15 2015-16
PBT (After Exceptional Items)
Consolidated Performance Trends figures in ₹ Crores
5049
6442
7752 8834
9722
7991
0
2000
4000
6000
8000
10000
12000
2010-11 2011-12 2012-13 2013-14 2014-15 2015-16
Revenue
10.58 14.46 15.47 16.67
22.69
55.49
0.00
10.00
20.00
30.00
40.00
50.00
60.00
2010-11 2011-12 2012-13 2013-14 2014-15 2015-16
Earnings Per Share (Basic)- In ₹
3.00 3.00
2.00 2.00 2.00
5.00
0
1
2
3
4
5
6
2010-11 2011-12 2012-13 2013-14 2014-15 2015-16
Dividend Per Share - In `

58
Standalone Performance Trends figures in ₹ Crores
PBIT & PBIT % (Before Exceptional Items)
2963
3464 3390 3352 3646 3790
0
500
1000
1500
2000
2500
3000
3500
4000
2010-11 2011-12 2012-13 2013-14 2014-15 2015-16
Sales 307
322
255 264 259 274 10%
9%
8% 8% 7% 7%
0%
2%
4%
6%
8%
10%
12%
0
50
100
150
200
250
300
350
2010-11 2011-12 2012-13 2013-14 2014-15 2015-16
345 367
298 301 319
350
0
50
100
150
200
250
300
350
400
2010-11 2011-12 2012-13 2013-14 2014-15 2015-16
EBITDA
170 180 104 94 121
730
0
100
200
300
400
500
600
700
800
2010-11 2011-12 2012-13 2013-14 2014-15 2015-16
PAT

59
Standalone Performance Trends
87
165
217
169
136 124
0
50
100
150
200
250
2010-11 2011-12 2012-13 2013-14 2014-15 2015-16
Capex in ` Cr. 16% 16%
10% 10% 9% 8%
0%
2%
4%
6%
8%
10%
12%
14%
16%
18%
2010-11 2011-12 2012-13 2013-14 2014-15 2015-16
ROCE%
ROCE is calculated based on end figures
9.16 9.69 5.58 5.04 6.46
38.98
0
5
10
15
20
25
30
35
40
45
2010-11 2011-12 2012-13 2013-14 2014-15 2015-16
Earnings Per Share (Basic)- In ₹
53.40 59.84 63.28 66.29 70.57
103.51
0
20
40
60
80
100
120
2010-11 2011-12 2012-13 2013-14 2014-15 2015-16
Book Value Per Share - In `
60
figures in ₹ Crores
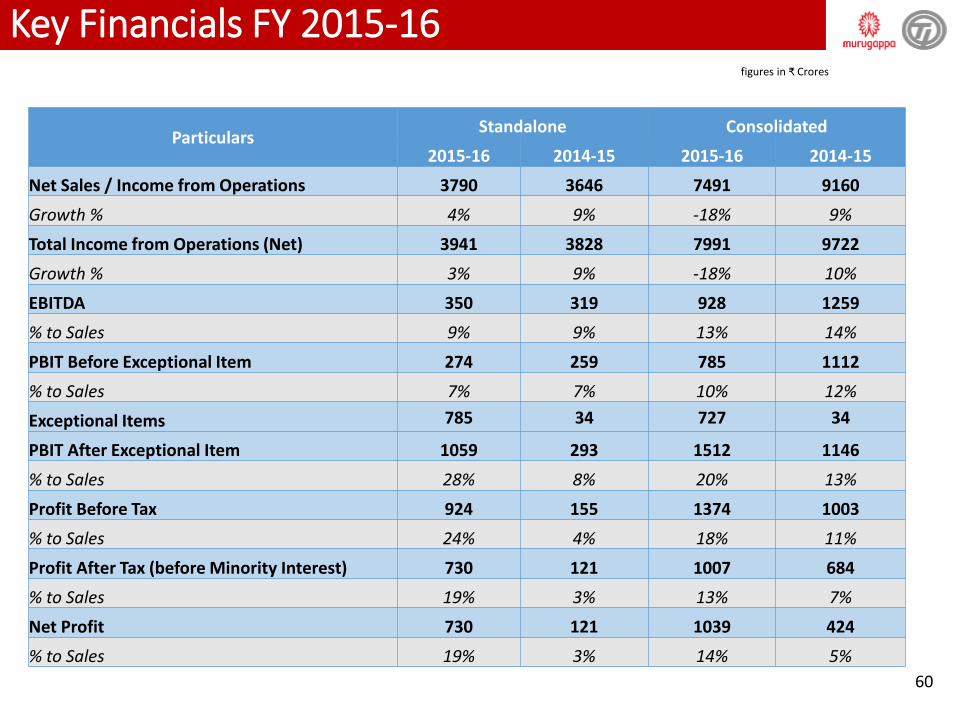
Key Financials FY 2015-16
Particulars Standalone Consolidated
2015-16 2014-15 2015-16 2014-15
Net Sales / Income from Operations 3790 3646 7491 9160
Growth % 4% 9% -18% 9%
Total Income from Operations (Net) 3941 3828 7991 9722
Growth % 3% 9% -18% 10%
EBITDA 350 319 928 1259
% to Sales 9% 9% 13% 14%
PBIT Before Exceptional Item 274 259 785 1112
% to Sales 7% 7% 10% 12%
Exceptional Items 785 34 727 34
PBIT After Exceptional Item 1059 293 1512 1146
% to Sales 28% 8% 20% 13%
Profit Before Tax 924 155 1374 1003
% to Sales 24% 4% 18% 11%
Profit After Tax (before Minority Interest) 730 121 1007 684
% to Sales 19% 3% 13% 7%
Net Profit 730 121 1039 424
% to Sales 19% 3% 14% 5%

61
figures in ₹ Crores
Key Financials 2015-16 contd.
Particulars Standalone Consolidated
2015-16 2014-15 2015-16 2014-15
EQUITY AND LIABILITIES
Shareholders' Funds
(a) Share Capital 37 37 37 37
(b) Reserves and Surplus 1,902 1,283 3287 2,290
Minority Interest - - 431 1,604 Preference Shares issued by Subsidiary outside the group - - - 500
Non-Current Liabilities
(a) Long Term Borrowings 375 781 405 13,219
(b) Deferred Tax Liabilities (Net) 42 57 42 61
(c) Other Long Term Liabilities - - 1,245 1,089
(d) Long Term Provisions - - 6 325
417 838 1,698 14,693
Current Liabilities
(a) Short Term Borrowings 266 340 313 3,063
(b) Trade Payables 612 625 697 875
(c) Other Current Liabilities 826 396 3,108 7,227
(d) Short Term Provisions 118 44 137 109
1,822 1,405 4,254 11,274
TOTAL 4,178 3,563 9,707 30,398

62
figures in ₹ Crores
Key Financials 2015-16 contd.
Particulars Standalone Consolidated
2015-16 2014-15 2015-16 2014-15
ASSETS
Non-Current Assets
(a) Fixed Assets 888 941 1082 1,206
(b) Goodwill on Consolidation - - 310 354
(c) Non-Current Investments 1,461 1,523 4773 2,314
(d) Deferred Tax Assets (Net) - - 54 206
(e) Long Term Loans and Advances 52 61 208 247
(f) Receivable under Financing Activity - - - 15,468
(g) Other Non-Current Assets - - 6 610
2,401 2,525 6,433 20,406
Current Assets
(a) Current Investments - - 368 351
(b) Inventories 458 468 603 614
(c) Trade Receivables 491 478 685 670
(d) Cash and Cash Equivalents 735 26 1,318 1,060
(e) Short Term Loans and Advances 94 66 168 135
(f) Receivable under Financing Activity - - - 6,716
(g) Other Current Assets - - 131 447
1,777 1,038 3,273 9,992
TOTAL 4,178 3,563 9,707 30,398

63
Corporate Office:
Tube Investments of India Ltd. "Dare House", 234 N S C Bose Road, Chennai- 600 001, India.
+91 44 4217 7770
+91 44 4211 0404


