39
Investor Presentation Third Quarter 2021 August 24, 2021

Investor Presentation Third Quarter 2021 August 24, 2021
2
Caution Regarding Forward-Looking Statements
From time to time, our public communications often include oral or written forward-looking statements. Statements of this type are included in this document and may be included in other filings with Canadian securities regulators or the U.S. Securities and Exchange Commission, or in other communications. In addition, representatives of the Bank may include forward-looking statements orally to analysts, investors, the media and others. All such statements are made pursuant to the “safe harbor” provisions of the U.S. Private Securities Litigation Reform Act of 1995 and any applicable Canadian securities legislation. Forward-looking statements may include, but are not limited to, statements made in this document, the Management’s Discussion and Analysis in the Bank’s 2020 Annual Report under the headings “Outlook” and in other statements regarding the Bank’s objectives, strategies to achieve those objectives, the regulatory environment in which the Bank operates, anticipated financial results, and the outlook for the Bank’s businesses and for the Canadian, U.S. and global economies. Such statements are typically identified by words or phrases such as “believe,” “expect,” “foresee,” “forecast,” “anticipate,” “intend,” “estimate,” “plan,” “goal,” “project,” and similar expressions of future or conditional verbs, such as “will,” “may,” “should,” “would” and “could.”
By their very nature, forward-looking statements require us to make assumptions and are subject to inherent risks and uncertainties, which give rise to the possibility that our predictions, forecasts, projections, expectations or conclusions will not prove to be accurate, that our assumptions may not be correct and that our financial performance objectives, vision and strategic goals will not be achieved.
We caution readers not to place undue reliance on these statements as a number of risk factors, many of which are beyond our control and effects of which can be difficult to predict, could cause our actual results to differ materially from the expectations, targets, estimates or intentions expressed in such forward-looking statements.
The future outcomes that relate to forward-looking statements may be influenced by many factors, including but not limited to: general economic and market conditions in the countries in which we operate; changes in currency and interest rates; increased funding costs and market volatility due to market illiquidity and competition for funding; the failure of third parties to comply with their obligations to the Bank and its affiliates; changes in monetary, fiscal, or economic policy and tax legislation and interpretation; changes in laws and regulations or in supervisory expectations or requirements, including capital, interest rate and liquidity requirements and guidance, and the effect of such changes on funding costs; changes to our credit ratings; operational and infrastructure risks; reputational risks; the accuracy and completeness of information the Bank receives on customers and counterparties; the timely development and introduction of new products and services; our ability to execute our strategic plans, including the successful completion of acquisitions and dispositions, including obtaining regulatory approvals; critical accounting estimates and the effect of
changes to accounting standards, rules and interpretations on these estimates; global capital markets activity; the Bank’s ability to attract, develop and retain key executives; the evolution of various types of fraud or other criminal behaviour to which the Bank is exposed; disruptions in or attacks (including cyber-attacks) on the Bank’s information technology, internet, network access, or other voice or data communications systems or services; increased competition in the geographic and in business areas in which we operate, including through internet and mobile banking and non-traditional competitors; exposure related to significant litigation and regulatory matters; the occurrence of natural and unnatural catastrophic events and claims resulting from such events; the emergence of widespread health emergencies or pandemics, including the magnitude and duration of the COVID-19 pandemic and its impact on the global economy and financial market conditions and the Bank’s business, results of operations, financial condition and prospects; and the Bank’s anticipation of and success in managing the risks implied by the foregoing. A substantial amount of the Bank’s business involves making loans or otherwise committing resources to specific companies, industries or countries. Unforeseen events affecting such borrowers, industries or countries could have a material adverse effect on the Bank’s financial results, businesses, financial condition or liquidity. These and other factors may cause the Bank’s actual performance to differ materially from that contemplated by forward-looking statements. The Bank cautions that the preceding list is not exhaustive of all possible risk factors and other factors could also adversely affect the Bank’s results, for more information, please see the “Risk Management” section of the Bank’s 2020 Annual Report, as may be updated by quarterly reports.
Material economic assumptions underlying the forward-looking statements contained in this document are set out in the 2020 Annual Report under the headings “Outlook”, as updated by quarterly reports. The “Outlook” sections are based on the Bank’s views and the actual outcome is uncertain. Readers should consider the above-noted factors when reviewing these sections. When relying on forward-looking statements to make decisions with respect to the Bank and its securities, investors and others should carefully consider the preceding factors, other uncertainties and potential events. Any forward-looking statements contained in this document represent the views of management only as of the date hereof and are presented for the purpose of assisting the Bank’s shareholders and analysts in understanding the Bank’s financial position, objectives and priorities, and anticipated financial performance as at and for the periods ended on the dates presented and may not be appropriate for other purposes. Except as required by law, the Bank does not undertake to update any forward-looking statements, whether written or oral, that may be made from time to time by or on its behalf.
Additional information relating to the Bank, including the Bank’s Annual Information Form, can be located on the SEDAR website at www.sedar.com and on the EDGAR section of the SEC’s website at www.sec.gov.
3
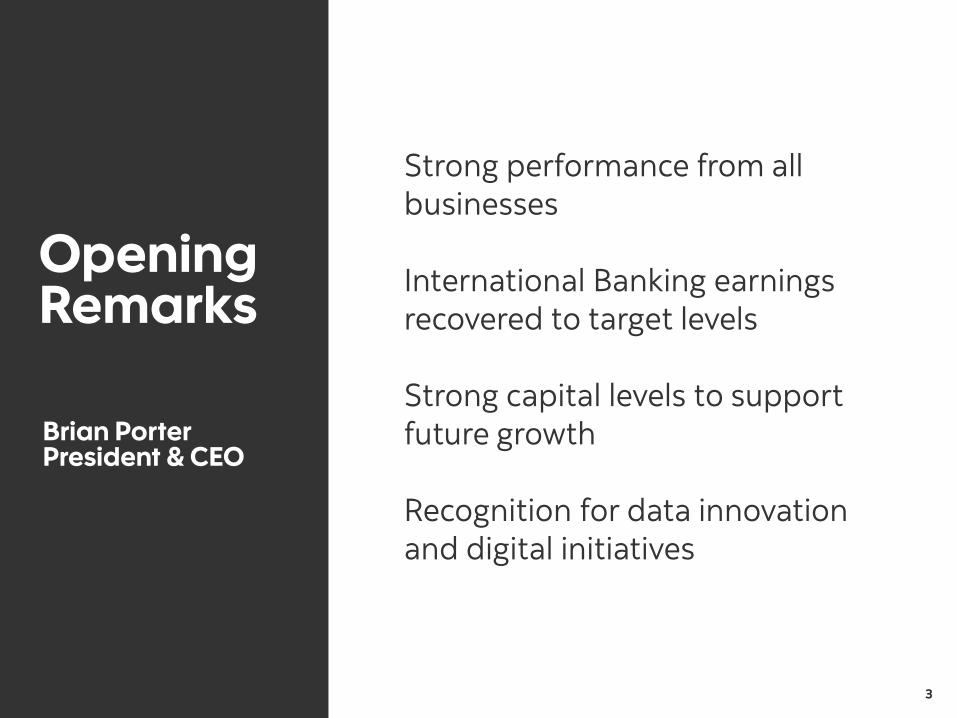
Opening Remarks
Brian Porter President & CEO
Strong performance from all businesses
International Banking earnings recovered to target levels
Strong capital levels to support future growth
Recognition for data innovation and digital initiatives

4
Q3/21 Financial Results Raj Viswanathan Group Head & CFO
5
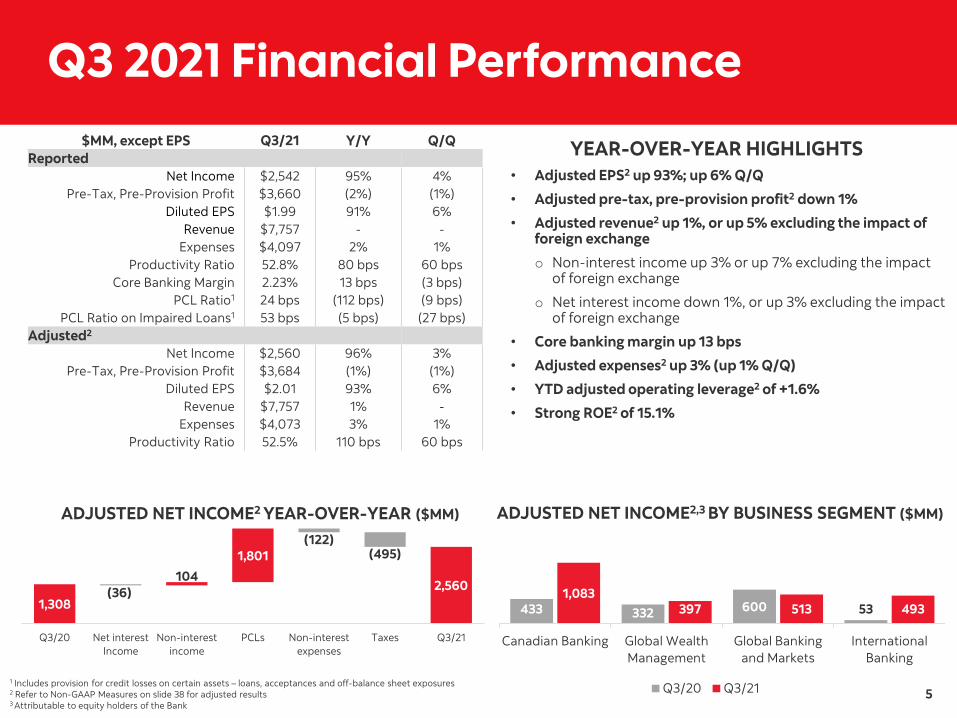
Q3 2021 Financial Performance $MM, except EPS Q3/21 Y/Y Q/Q
Reported Net Income $2,542 95% 4%
Pre-Tax, Pre-Provision Profit $3,660 (2%) (1%) Diluted EPS $1.99 91% 6%
Revenue $7,757 - -Expenses $4,097 2% 1%
Productivity Ratio 52.8% 80 bps 60 bps Core Banking Margin 2.23% 13 bps (3 bps)
PCL Ratio1 24 bps (112 bps) (9 bps) PCL Ratio on Impaired Loans1 53 bps (5 bps) (27 bps)
Adjusted2
Net Income $2,560 96% 3% Pre-Tax, Pre-Provision Profit $3,684 (1%) (1%)
Diluted EPS $2.01 93% 6% Revenue $7,757 1% -
Expenses $4,073 3% 1% Productivity Ratio 52.5% 110 bps 60 bps
1 Includes provision for credit losses on certain assets – loans, acceptances and off-balance sheet exposures
ADJUSTED NET INCOME2 YEAR-OVER-YEAR ($MM)
2 Refer to Non-GAAP Measures on slide 38 for adjusted results
Q3/20
1,308
Net interest Income
(36)
Non-interest income
104
PCLs
1,801
Non-interest expenses
(122)
Taxes
(495)
Q3/21
2,560
YEAR-OVER-YEAR HIGHLIGHTS • Adjusted EPS2 up 93%; up 6% Q/Q
• Adjusted pre-tax, pre-provision profit2 down 1%
• Adjusted revenue2 up 1%, or up 5% excluding the impact of foreign exchange
o Non-interest income up 3% or up 7% excluding the impact of foreign exchange
o Net interest income down 1%, or up 3% excluding the impact of foreign exchange
• Core banking margin up 13 bps
• Adjusted expenses2 up 3% (up 1% Q/Q)
• YTD adjusted operating leverage2 of +1.6%
• Strong ROE2 of 15.1%
ADJUSTED NET INCOME2,3 BY BUSINESS SEGMENT ($MM)
3 Attributable to equity holders of the Bank
Q3/20 Q3/21
Canadian Banking
433 1,083
Global Wealth Management
332 397
Global Banking and Markets
600 513
International Banking
53 493
6
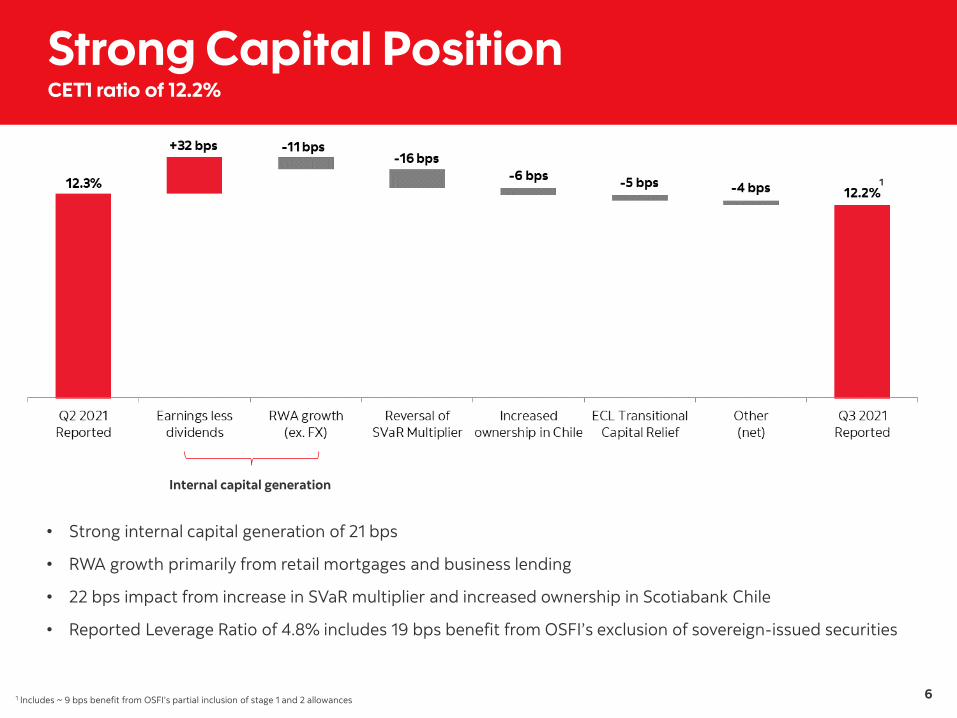
Strong Capital Position CET1 ratio of 12.2%
Q2 2021 Reported
Internal capital generation
Reversa l of SVaR Mu lt iplier
Increased ownersh ip in Chil e
ECL Transit iona l Capita l Re lief
Other (net)
Q3 2021 Reported
Earnings less d iv idends
RWAgrowth (ex. FX)
12.3%
+32 bps -11 bps -16 bps
-6bps -5 bps -4bps 12.2% 1
1 Includes ~ 9 bps benefit from OSFI’s partial inclusion of stage 1 and 2 allowances
• Strong internal capital generation of 21 bps
• RWA growth primarily from retail mortgages and business lending
• 22 bps impact from increase in SVaR multiplier and increased ownership in Scotiabank Chile
• Reported Leverage Ratio of 4.8% includes 19 bps benefit from OSFI’s exclusion of sovereign-issued securities
-
Internal capital generation
1
7
o
o
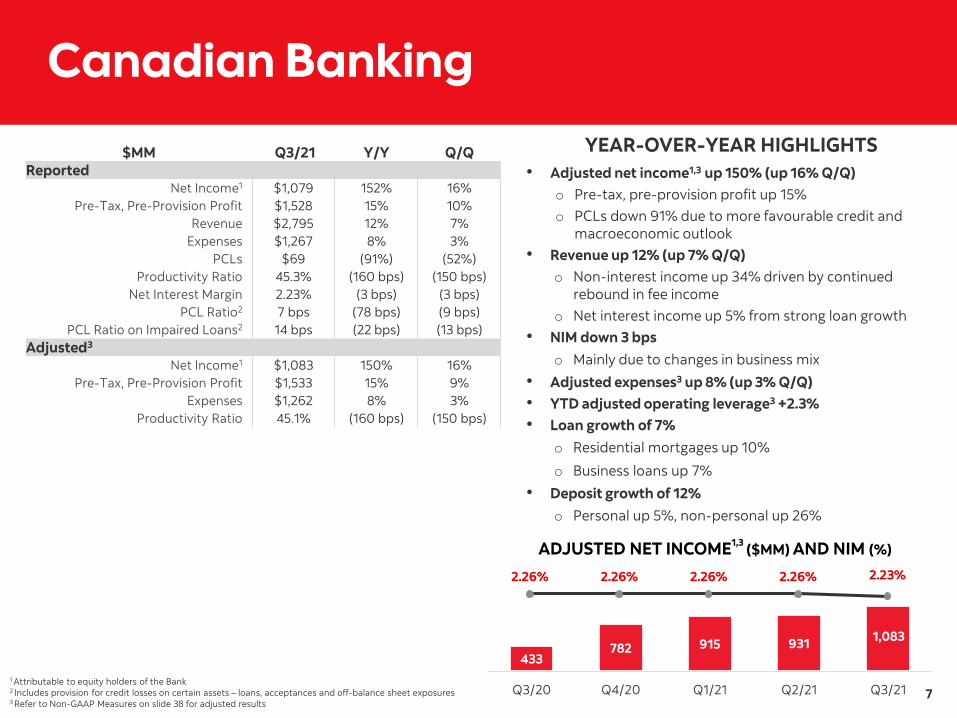
Canadian Banking
$MM Q3/21 Y/Y Q/Q Reported
Net Income1 $1,079 152% 16% Pre-Tax, Pre-Provision Profit $1,528 15% 10%
Revenue $2,795 12% 7% Expenses $1,267 8% 3%
PCLs $69 (91%) (52%) Productivity Ratio 45.3% (160 bps) (150 bps)
Net Interest Margin 2.23% (3 bps) (3 bps) PCL Ratio2 7 bps (78 bps) (9 bps)
PCL Ratio on Impaired Loans2 14 bps (22 bps) (13 bps) Adjusted3
Net Income1 $1,083 150% 16% Pre-Tax, Pre-Provision Profit $1,533 15% 9%
Expenses $1,262 8% 3% Productivity Ratio 45.1% (160 bps) (150 bps)
1 Attributable to equity holders of the Bank 2 Includes provision for credit losses on certain assets – loans, acceptances and off-balance sheet exposures
YEAR-OVER-YEAR HIGHLIGHTS • Adjusted net income1,3 up 150% (up 16% Q/Q)
o Pre-tax, pre-provision profit up 15% o PCLs down 91% due to more favourable credit and
macroeconomic outlook • Revenue up 12% (up 7% Q/Q)
o Non-interest income up 34% driven by continued rebound in fee income
o Net interest income up 5% from strong loan growth • NIM down 3 bps
Mainly due to changes in business mix
• Adjusted expenses3 up 8% (up 3% Q/Q) • YTD adjusted operating leverage3 +2.3% • Loan growth of 7%
o Residential mortgages up 10%
o Business loans up 7%
• Deposit growth of 12% Personal up 5%, non-personal up 26%
3 Refer to Non-GAAP Measures on slide 38 for adjusted results
ADJUSTED NET INCOME1,3 ($MM) AND NIM (%)
2.26% 2.26% 2.26% 2.26% 2.23%
1,083782 915 931
433
Q3/20 Q4/20 Q1/21 Q2/21 Q3/21
8
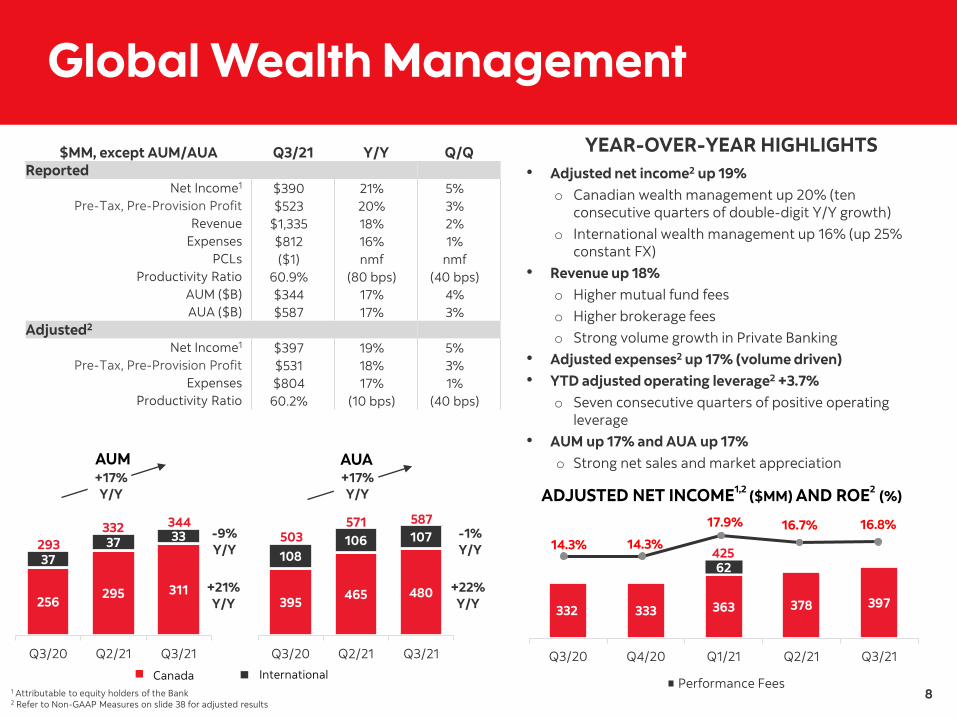
Global Wealth Management
$MM, except AUM/AUA Q3/21 Y/Y Q/Q Reported
Net Income1 $390 21% 5% Pre-Tax, Pre-Provision Profit $523 20% 3%
Revenue $1,335 18% 2% Expenses $812 16% 1%
PCLs ($1) nmf nmf Productivity Ratio 60.9% (80 bps) (40 bps)
AUM ($B) $344 17% 4% AUA ($B) $587 17% 3%
Adjusted2
Net Income1 $397 19% 5% Pre-Tax, Pre-Provision Profit $531 18% 3%
Expenses $804 17% 1% Productivity Ratio 60.2% (10 bps) (40 bps)
1 Attributable to equity holders of the Bank 2 Refer to Non-GAAP Measures on slide 38 for adjusted results
YEAR-OVER-YEAR HIGHLIGHTS • Adjusted net income2 up 19%
o Canadian wealth management up 20% (ten consecutive quarters of double-digit Y/Y growth)
o International wealth management up 16% (up 25% constant FX)
• Revenue up 18% o Higher mutual fund fees o Higher brokerage fees o Strong volume growth in Private Banking
• Adjusted expenses2 up 17% (volume driven) • YTD adjusted operating leverage2 +3.7%
Seven consecutive quarters of positive operating leverage
• AUM up 17% and AUA up 17% Strong net sales and market appreciation
ADJUSTED NET INCOME1,2 ($MM) AND ROE2 (%)+17%Y/Y
395 465 480
108106 107
Q3/20 Q2/21 Q3/21
587571503
256295 311
3737 33
Q3/20 Q2/21 Q3/21
344332293
+17%Y/Y
-9%Y/Y
+21%Y/Y
Canada International
-1%Y/Y
+22%Y/Y
AUM AUA
o
o
17.9% 16.7% 16.8%14.3% 14.3%
42562
378332 333 363 397
Q3/20 Q4/20 Q1/21 Q2/21 Q3/21
Performance Fees
9
o
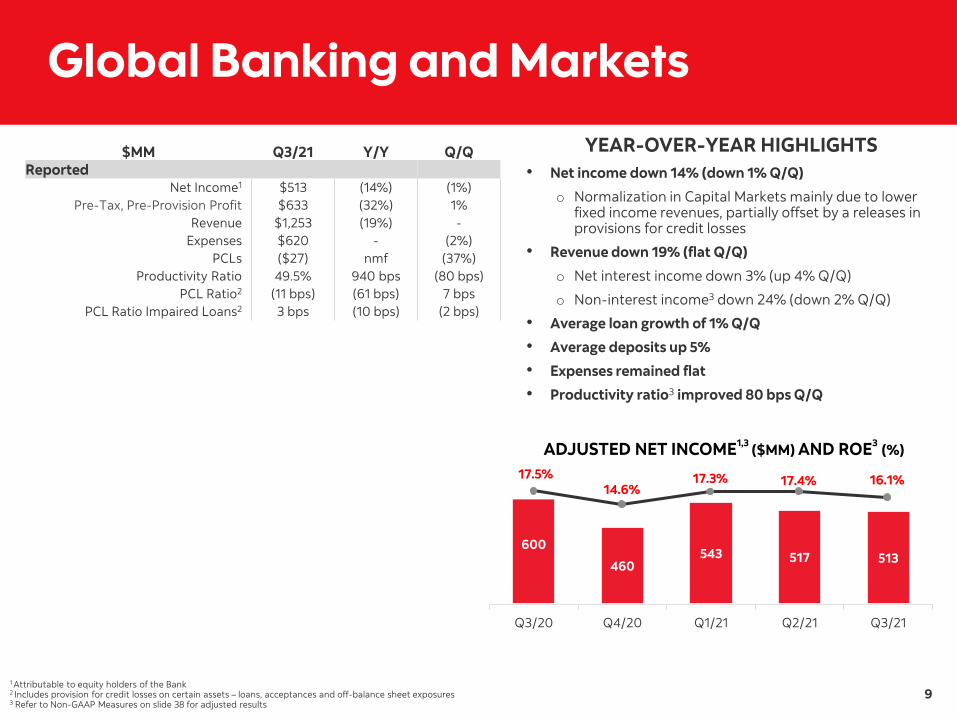
Global Banking and Markets
$MM Q3/21 Y/Y Q/Q Reported
Net Income1 $513 (14%) (1%) Pre-Tax, Pre-Provision Profit $633 (32%) 1%
Revenue $1,253 (19%) -Expenses $620 - (2%)
PCLs ($27) nmf (37%) Productivity Ratio 49.5% 940 bps (80 bps)
PCL Ratio2 (11 bps) (61 bps) 7 bps PCL Ratio Impaired Loans2 3 bps (10 bps) (2 bps)
1 Attributable to equity holders of the Bank 2 Includes provision for credit losses on certain assets – loans, acceptances and off-balance sheet exposures
YEAR-OVER-YEAR HIGHLIGHTS • Net income down 14% (down 1% Q/Q)
Normalization in Capital Markets mainly due to lower fixed income revenues, partially offset by a releases in provisions for credit losses
• Revenue down 19% (flat Q/Q)
o Net interest income down 3% (up 4% Q/Q)
o Non-interest income3 down 24% (down 2% Q/Q)
• Average loan growth of 1% Q/Q
• Average deposits up 5%
• Expenses remained flat
• Productivity ratio3 improved 80 bps Q/Q
ADJUSTED NET INCOME1,3 ($MM) AND ROE3 (%)
3 Refer to Non-GAAP Measures on slide 38 for adjusted results
17.5% 17.3% 17.4% 16.1%14.6%
600543 517 513460
Q3/20 Q4/20 Q1/21 Q2/21 Q3/21
10
o
o
o
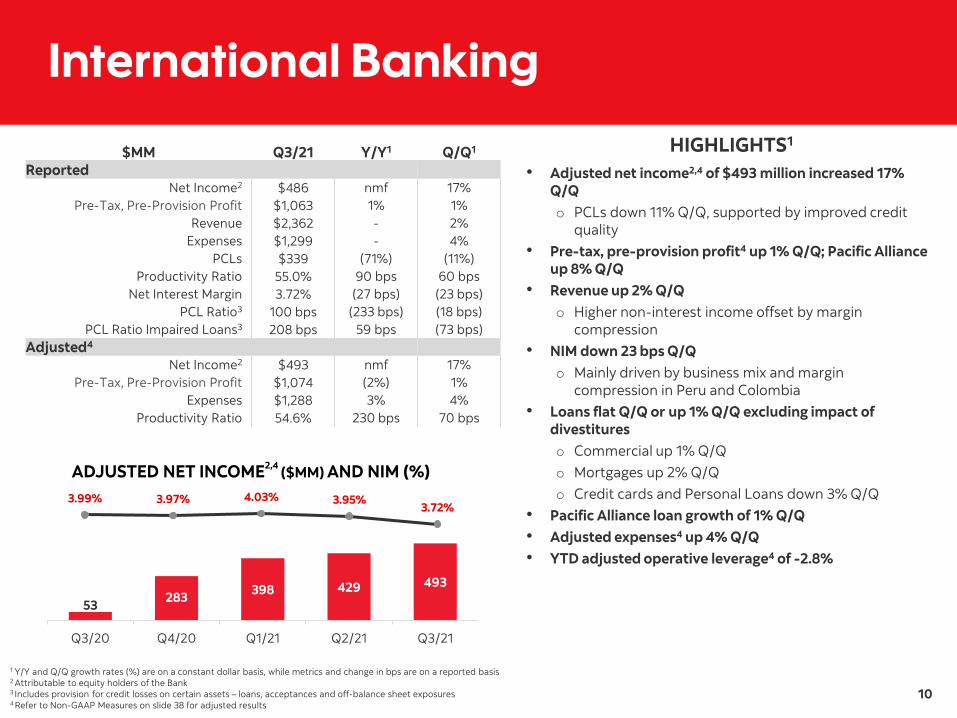
International Banking
$MM Q3/21 Y/Y1 Q/Q1
Reported Net Income2 $486 nmf 17%
Pre-Tax, Pre-Provision Profit $1,063 1% 1% Revenue $2,362 - 2%
Expenses $1,299 - 4% PCLs $339 (71%) (11%)
Productivity Ratio 55.0% 90 bps 60 bps Net Interest Margin 3.72% (27 bps) (23 bps)
PCL Ratio3 100 bps (233 bps) (18 bps) PCL Ratio Impaired Loans3 208 bps 59 bps (73 bps)
Adjusted4
Net Income2 $493 nmf 17% Pre-Tax, Pre-Provision Profit $1,074 (2%) 1%
Expenses $1,288 3% 4% Productivity Ratio 54.6% 230 bps 70 bps
1 Y/Y and Q/Q growth rates (%) are on a constant dollar basis, while metrics and change in bps are on a reported basis 2 Attributable to equity holders of the Bank 3 Includes provision for credit losses on certain assets – loans, acceptances and off-balance sheet exposures 4 Refer to Non-GAAP Measures on slide 38 for adjusted results
ADJUSTED NET INCOME2,4 ($MM) AND NIM (%)
HIGHLIGHTS1
• Adjusted net income2,4 of $493 million increased 17% Q/Q
PCLs down 11% Q/Q, supported by improved credit quality
• Pre-tax, pre-provision profit4 up 1% Q/Q; Pacific Alliance up 8% Q/Q
• Revenue up 2% Q/Q Higher non-interest income offset by margin compression
• NIM down 23 bps Q/Q Mainly driven by business mix and margin compression in Peru and Colombia
• Loans flat Q/Q or up 1% Q/Q excluding impact of divestitures o Commercial up 1% Q/Q o Mortgages up 2% Q/Q o Credit cards and Personal Loans down 3% Q/Q
• Pacific Alliance loan growth of 1% Q/Q • Adjusted expenses4 up 4% Q/Q • YTD adjusted operative leverage4 of -2.8%
3.99% 3.97% 4.03% 3.95%3.72%
398493398 429
28353
Q3/20 Q4/20 Q1/21 Q2/21 Q3/21
11
•o
•
Other
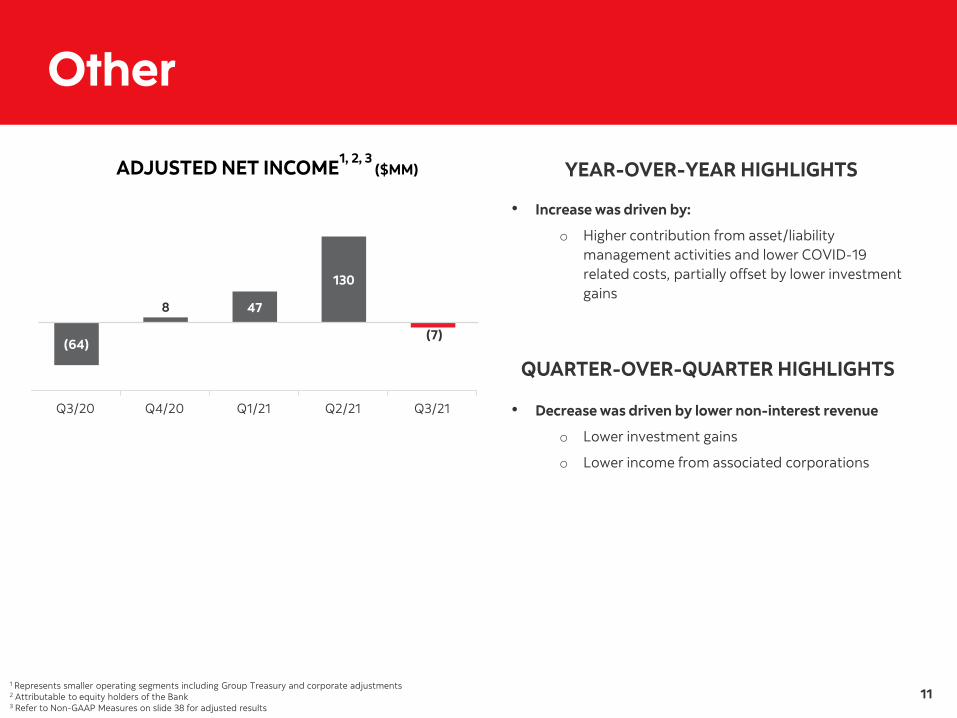
ADJUSTED NET INCOME1, 2, 3 ($MM)
1 Represents smaller operating segments including Group Treasury and corporate adjustments 2 Attributable to equity holders of the Bank 3 Refer to Non-GAAP Measures on slide 38 for adjusted results
Q3/20
(64)
Q4/20
8
Q1/21
47
Q2/21
130
Q3/21
(7)
YEAR-OVER-YEAR HIGHLIGHTS
Increase was driven by:
Higher contribution from asset/liability management activities and lower COVID-19 related costs, partially offset by lower investment gains
QUARTER-OVER-QUARTER HIGHLIGHTS
Decrease was driven by lower non-interest revenue
o Lower investment gains
o Lower income from associated corporations

12
Risk Review Daniel Moore Group Head & CRO

13
Credit Quality
GILs ($MM) AND GIL RATIO1
1 As a percentage of period end loans and acceptances
NET WRITE-OFFS ($MM)2 AND NET WRITE-OFFS RATIO3
2 Net write-offs are net of recoveries 3 As a percentage of average net loans and acceptances
HIGHLIGHTS • GIL ratio improved 8 bps driven by low formations
across all business lines
• GIL ratio is now below pre-pandemic levels
HIGHLIGHTS • Lower write-offs Q/Q
• Significant reduction in International Banking
• Write-offs in Canadian Banking and Global Banking and Markets are well below historical averages
47 bps 41 bps 43 bps
76 bps62 bps
450 379 448
910 801266
227 201
219173
3326 25
138
1
1
Q3/20 Q4/20 Q1/21 Q2/21 Q3/21
750 674 674632
9831,141
(1)
3,704 3,676 3,949 3,757 3,551
1,209 1,049 1,067 1,040 921209 302 224 286 23526 26 39 33 28
Q3/20 Q4/20 Q1/21 Q2/21 Q3/21
5,053 5,279 5,1165,148 4,735
International Banking Canadian Banking Global Banking and Markets Global Wealth Management
81 bps 81 bps 84 bps 81 bps73 bps
14
Credit Performance
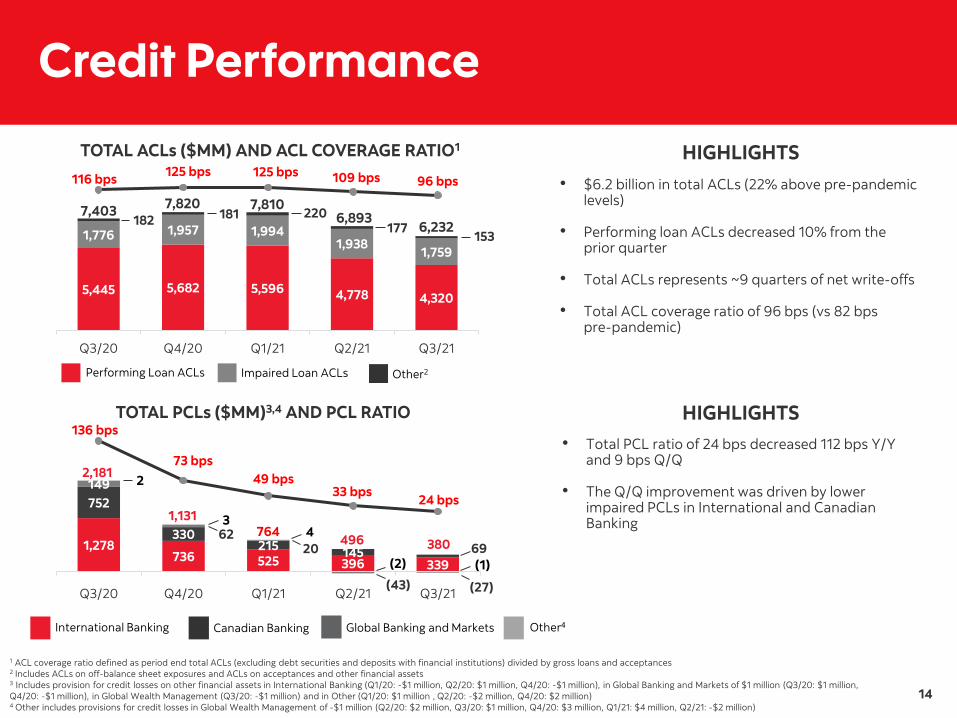
TOTAL ACLs ($MM) AND ACL COVERAGE RATIO1
1 ACL coverage ratio defined as period end total ACLs (excluding debt securities and deposits with financial institutions) divided by gross loans and acceptances
HIGHLIGHTS • $6.2 billion in total ACLs (22% above pre-pandemic
levels)
• Performing loan ACLs decreased 10% from the prior quarter
• Total ACLs represents ~9 quarters of net write-offs
• Total ACL coverage ratio of 96 bps (vs 82 bps pre-pandemic)
TOTAL PCLs ($MM)3,4 AND PCL RATIO
3 Includes provision for credit losses on other financial assets in International Banking (Q1/20: -$1 million, Q2/20: $1 million, Q4/20: -$1 million), in Global Banking and Markets of $1 million (Q3/20: $1 million, Q4/20: -$1 million), in Global Wealth Management (Q3/20: -$1 million) and in Other (Q1/20: $1 million , Q2/20: -$2 million, Q4/20: $2 million) 4 Other includes provisions for credit losses in Global Wealth Management of -$1 million (Q2/20: $2 million, Q3/20: $1 million, Q4/20: $3 million, Q1/21: $4 million, Q2/21: -$2 million)
HIGHLIGHTS • Total PCL ratio of 24 bps decreased 112 bps Y/Y
and 9 bps Q/Q
• The Q/Q improvement was driven by lower impaired PCLs in International and Canadian Banking
5,445 5,682 5,596 4,778 4,320
1,776 1,957 1,9941,938 1,759
182 181 220177
153
Q3/20 Q4/20 Q1/21 Q2/21 Q3/21
6,232
1,278736 525 396 339
752
330215 145 69
149
6220
(43) (27)Q3/20 Q4/20 Q1/21 Q2/21 Q3/21
496764
3
380
2
4
(2) (1)
6,8937,8107,820
116 bps 125 bps 125 bps 109 bps 96 bps
7,403
Performing Loan ACLs Impaired Loan ACLs
2 Includes ACLs on off-balance sheet exposures and ACLs on acceptances and other financial assets
2,181
International Banking Canadian Banking Global Banking and Markets Other4
Other2
1,131
136 bps
73 bps49 bps
33 bps24 bps

15
•
PCLs - Impaired and Performing
PCLs ($MM) Q3/20 Q4/20 Q1/21 Q2/21 Q3/21 All-Bank Impaired 928 835 762 1,192 841
Performing 1,2531 2961 2 (696) (461) Total 2,1811 1,1311 764 496 380
Canadian Banking
Impaired 317 238 214 242 135 Performing 435 92 1 (97) (66)
Total 752 330 215 145 69
International Banking
Impaired 573 561 528 941 703 Performing 705 1751 (3) (545) (364)
Total 1,278 7361 525 396 339
Global Wealth Management
Impaired - 1 5 (3) (3)
Performing 11 2 (1) 1 2
Total 11 3 4 (2) (1)
Global Banking and Markets
Impaired 38 34 15 12 6 Performing 1111 281 5 (55) (33)1
Total 1491 621 20 (43) (27)
Other 1 -1 - - -
1 Includes provision for credit losses on other financial assets in International Banking (Q1/20: -$1 million, Q2/20: $1 million, Q4/20: -$1 million), in Global Banking and Markets of $1 million (Q3/20: $1 million, Q4/20: -$1 million), in Global Wealth Management (Q3/20: -$1 million) and in Other (Q1/20: $1 million , Q2/20: -$2 million, Q4/20: $2 million)
HIGHLIGHTS YEAR-OVER-YEAR
Lower PCLs driven mainly by lower performing PCLs. Total PCLs of $380 million was down 83% and 23% Q/Q
o Performing PCLs net reversal of $461 million
o Release driven by a more favourable credit quality and macroeconomic outlook and migration
o Impaired PCLs of $841 million was driven largely by International Retail Banking due to credit migration in Colombia and Peru
QUARTER-OVER-QUARTER
• Impaired PCLs decreased $351 million, driven largely by International Retail Banking
• Performing PCLs declined to ($461) million due to the lower migration to stage 3

16
Closing Remarks Brian Porter President & CEO
Year-to-date earnings are substantially higher than the same period in FY19
Economic activity in major markets continues to strengthen
Positioned well for long term growth

17
1
2
3
4
5
Appendix
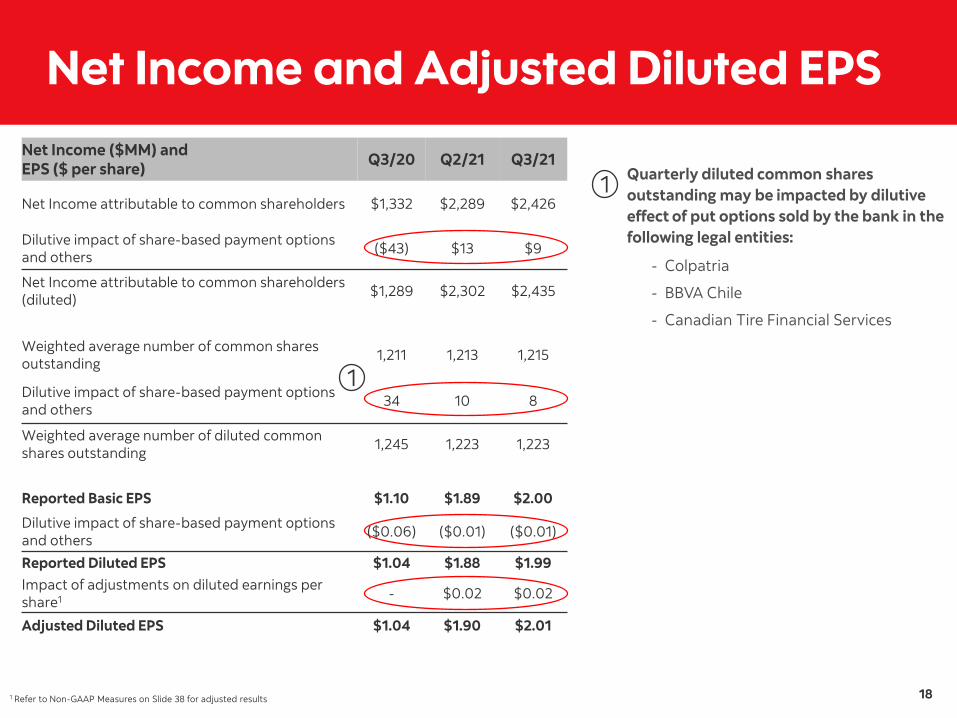
Net Income and Adjusted Diluted EPS Net Income ($MM) and EPS ($ per share) Q3/20 Q2/21 Q3/21
Net Income attributable to common shareholders $1,332 $2,289 $2,426
Dilutive impact of share-based payment options and others ($43) $13 $9
Net Income attributable to common shareholders (diluted) $1,289 $2,302 $2,435
Weighted average number of common shares outstanding 1,211 1,213 1,215
Dilutive impact of share-based payment options and others 34 10 8
Weighted average number of diluted common shares outstanding 1,245 1,223 1,223
Reported Basic EPS $1.10 $1.89 $2.00
Dilutive impact of share-based payment options and others ($0.06) ($0.01) ($0.01)
Reported Diluted EPS $1.04 $1.88 $1.99 Impact of adjustments on diluted earnings per share1 - $0.02 $0.02
Adjusted Diluted EPS $1.04 $1.90 $2.01
1 Refer to Non-GAAP Measures on Slide 38 for adjusted results
Quarterly diluted common shares outstanding may be impacted by dilutive effect of put options sold by the bank in the following legal entities:
- Colpatria
- BBVA Chile
- Canadian Tire Financial Services
1
1
18

19
Adjusting Items
Adjusting Items (Pre-Tax) ($MM) Q3/20 Q2/21 Q3/21 Acquisition-Related Costs
Integration Costs 40 - -International Banking 34 - -Global Wealth Management 6 - -
Amortization of Intangibles 1
26 26 24 Canadian Banking 5 5 5 International Banking 12 11 11 Global Wealth Management 9 10 8
Net Loss/(Gain) on Divestitures (44) - -Other (44) - -
Total (Pre-Tax) 22 26 24
1 Excludes amortization of intangibles related to software (pre-tax)
Adjusting Items (After-Tax and NCI) ($MM) Q3/20 Q2/21
Q3/21
Tax NCI After-Tax and NCI
Acquisition-Related Costs Integration Costs 24 - - - -
International Banking 19 - - - -Global Wealth Management 5 - - - -
Amortization of Intangibles 2
18 19 6 - 18 Canadian Banking 4 4 1 - 4 International Banking 8 9 4 - 7 Global Wealth Management 6 6 1 - 7
Net Loss/(Gain) on Divestitures (43) 19 - - -Other (43) 4 - - -
Total (After-Tax and NCI) (1) 19 6 - 18
2 Excludes amortization of intangibles related to software (after-tax)

20
Other Items Impacting Financial Results
(Pre-Tax) ($MM) 1
Q3/20 Q4/20 Q1/21 Q2/21 Q3/21 International Banking
Impact of closed divestitures 1 3 4 - -Total 1 3 4 - -
Global Wealth Management Performance fees - - 84 - -Total - - 84 - -
Other SCENE loyalty program - - (66) - -Total - - (66) - -
Total (Pre-Tax) 1 3 18 - -
1 Items on this page have not been formally adjusted for determining the Bank’s Adjusted Net Income and Adjusted Diluted EPS
(After-Tax and NCI) ($MM) 1
Q3/20 Q4/20 Q1/21 Q2/21 Q3/21 International Banking
Impact of closed divestitures - 2 3 (1) -Total - 2 3 (1) -
Global Wealth Management Performance fees - - 62 - -Total - - 62 - -
Other SCENE loyalty program - - (49) - -Total - - (49) - -
Total (After-Tax and NCI) - 2 12 (1) -Impact on diluted earnings per share - - $0.01 - -

21
Digital Progress: All-Bank
• Canada: Continued growth in mobile users driven by continuous improvement of the Scotiabank mobile application • Pacific Alliance: Strong growth in Self-Serve Transactions, particularly in Peru and Mexico
Digital Adoption (%)1
1 CB Digital Adoption definition was updated in Q1/21 to reflect new addressable customer base, excluding indirect-channel acquisitions
2018
36%
2019
43%
2020
50%
Q3/20
49%
Q3/21
54%
Digital Sales (%)
2018
22%
2019
28%
2020
36%
Q3/20
37%
Q3/21
43%
Active Digital Users (#’000)
2018
5,276
2019
6,316
2020
7,524
Q3/20
7,310
Q3/21
7,830
Active Mobile Users (#’000)2
2 2018 and 2019 use historical estimation based on available mobile user data for Colombia and Chile
2018
3,559
2019
4,513
2020
5,903
Q3/20
5,591
Q3/21
6,470
Self-Serve Transactions
(%)
2018
76%
2019
80%
2020
89%
Q3/20
89%
Q3/21
90%
+1,800 bps
+500 bps
+2,100 bps
+600 bps
+1,400 bps
+100 bps
+82%
+16%
+48%
+7%

22
Digital Progress: Canada
Digital Adoption (%)1
1 CB Digital Adoption definition was updated in Q1/21 to reflect addressable customer base, excluding indirect-channel acquisitions
2018
46%
2019
50%
2020
55%
Q3/20
55%
Q3/21
58%
Digital Sales (%)
2018
26%
2019
26%
2020
16%
Q3/20
20%
Q3/21
25%
Active Digital Users (#’000)
2018
3,329
2019
3,599
2020
3,847
Q3/20
3,826
Q3/21
3,985
Active Mobile Users (#’000)
2018
2,396
2019
2,666
2020
3,073
Q3/20
2,991
Q3/21
3,304
Self-Serve Transactions
(%)
2018
84%
2019
87%
2020
92%
Q3/20
93%
Q3/21
93%
Definitions Digital Sales (% of retail unit sales using Digital platforms, excluding auto, broker originated mortgages and mutual funds) Digital Adoption (% of customers with Digital login (90 days) / Total addressable Customer Base) Digital Users: # of customers who logged into website and/or mobile in the last 90 days Mobile Users: # of customers who logged into mobile in the last 90 days Self-serve Transactions: % of Financial transactions through Digital, ABM, IVR
+1,200 bps
+300 bps
-100 bps
+500 bps
+900 bps
+5 bps
+38%
+10%
+20%
+4%
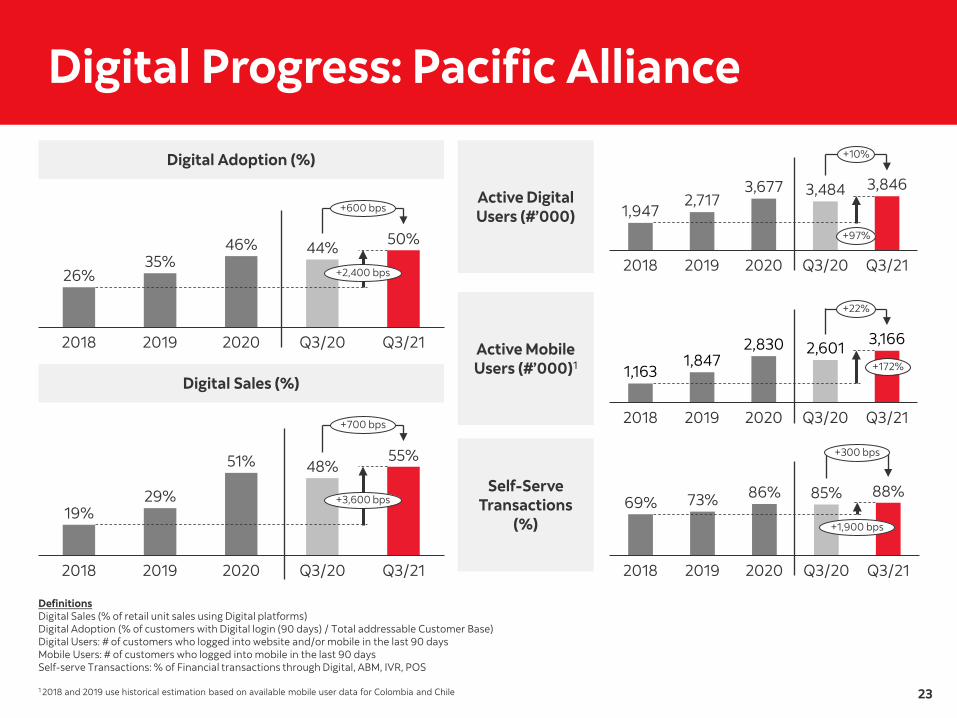
Digital Progress: Pacific Alliance
Digital Adoption (%)
2018
26%
2019
35%
2020
46%
Q3/20
44%
Q3/21
50%
Digital Sales (%)
2018
19%
2019
29%
2020
51%
Q3/20
48%
Q3/21
55%
Active Digital Users (#’000)
2018
1,947
2019
2,717
2020
3,677
Q3/20
3,484
Q3/21
3,846
Active Mobile Users (#’000)1
1 2018 and 2019 use historical estimation based on available mobile user data for Colombia and Chile
2018
1,163
2019
1,847
2020
2,830
Q3/20
2,601
Q3/21
3,166
Self-Serve Transactions
(%)
2018
69%
2019
73%
2020
86%
Q3/20
85%
Q3/21
88%
Definitions Digital Sales (% of retail unit sales using Digital platforms) Digital Adoption (% of customers with Digital login (90 days) / Total addressable Customer Base) Digital Users: # of customers who logged into website and/or mobile in the last 90 days Mobile Users: # of customers who logged into mobile in the last 90 days Self-serve Transactions: % of Financial transactions through Digital, ABM, IVR, POS
23
+2,400 bps
+600 bps
+3,600 bps
+700 bps
+1,900 bps
+300 bps
+172%
+22%
+97%
+10%
24
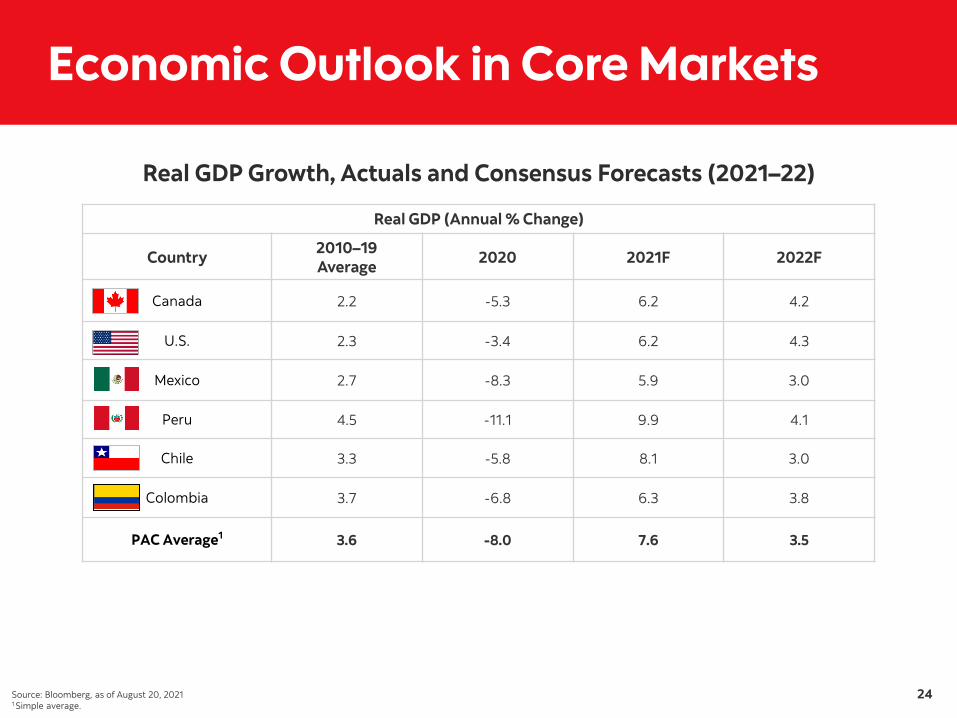
Economic Outlook in Core Markets
Real GDP Growth, Actuals and Consensus Forecasts (2021–22)
Real GDP (Annual % Change)
Country 2010–19 Average 2020 2021F 2022F
Canada 2.2 -5.3 6.2 4.2
U.S. 2.3 -3.4 6.2 4.3
Mexico 2.7 -8.3 5.9 3.0
Peru 4.5 -11.1 9.9 4.1
Chile 3.3 -5.8 8.1 3.0
Colombia 3.7 -6.8 6.3 3.8
PAC Average1 3.6 -8.0 7.6 3.5
1 Simple average. Source: Bloomberg, as of August 20, 2021

25
Macroeconomic Scenarios Select Macroeconomic Variables used to estimate Expected Credit Losses
Next 12 months
Base Case Scenario Alternative Scenario -Optimistic
Alternative Scenario -Pessimistic
Alternative Scenario – Pessimistic Front Loaded
As at July 31, 2021
As at April 30, 2021
As at July 31, 2021
As at April 30, 2021
As at July 31, 2021
As at April 30, 2021
As at July 31, 2021
As at April 30, 2021
Canada
Real GDP growth, Y/Y % change 5.3 7.8 7.1 9.9 1.2 2.8 -5.7 -3.5
Unemployment rate, average % 6.5 6.7 5.8 6.1 9.0 9.3 11.9 12.2
US
Real GDP growth, Y/Y % change 6.7 8.2 8.5 10.3 3.6 4.8 -0.5 0.9
Unemployment rate, average % 4.7 5.0 4.3 4.5 6.5 6.7 7.8 8.0
Global
WTI oil price, average USD/bbl 65 62 71 70 58 54 52 50
Quarterly breakdown of the projections for the above macroeconomic variables:
Next 12 months
Base Case Scenario Calendar Quarters Average
July 31 2021
Calendar Quarters Average April 30
2021 Q3
2021 Q4
2021 Q1
2022 Q2
2022 Q2
2021 Q3
2021 Q4
2021 Q1
2022
Canada
Real GDP growth, Y/Y % change 6.4 5.2 4.7 5.1 5.3 14.1 6.6 5.3 5.2 7.8
Unemployment rate, average % 7.3 6.7 6.2 5.9 6.5 7.7 7.0 6.4 5.9 6.7
US
Real GDP growth, Y/Y % change 7.1 7.7 6.8 5.1 6.7 11.8 6.6 7.3 7.0 8.2
Unemployment rate, average % 5.4 4.9 4.5 4.1 4.7 5.8 5.3 4.8 4.2 5.0
Global
WTI oil price, average USD/bbl 65 65 66 66 65 60 61 65 61 62
Source: Scotiabank Economics, forecasts as of June 11, 2021

26
Revenue Growth
Canadian Banking1
1 May not add due to rounding
International Banking1, 2, 3
2 Y/Y growth rates are on a constant dollar basis 3 On a constant dollar basis, and excluding the impact of divestitures and the one month reporting lag in Q1/20, revenue growth in International Banking was -5% Y/Y (Latin America -4%, C&CA -13%, Asia +40%)
(Growth rates are constant FX)
Global Wealth Management1,5
5 On a constant dollar basis, and excluding the impact of divestitures and the one month reporting lag in Q1/20, Global Wealth Management revenue growth was 19% Y/Y and International Wealth Management revenue growth was 2% Y/Y
Global Banking and Markets1,4
4 GBM LatAm revenue contribution and assets are reported in International Banking’s results
2,219 1,856
699 463
68 43
Q1/20(Pre-Pandemic)
Q3/21
660 649
204 264
405 340
Q1/20(Pre-Pandemic)
Q3/21
979 1,187
178
148
Q1/20(Pre-Pandemic)
Q3/21
1,335
Latin America C&CA Asia
2,986
-12%
-27%
-6%
-32%2,362
Retail Banking Business Banking
+3%
+11%
-1%
1,157
+15%
-17%
+21%
Canada International Business Banking Global Equities
1,269 1,253
+29%
-16%
-2%
-1%
FICC
1,848 1,838
859 957
Q1/20(Pre-Pandemic)
Q3/21
2,707 2,795
27
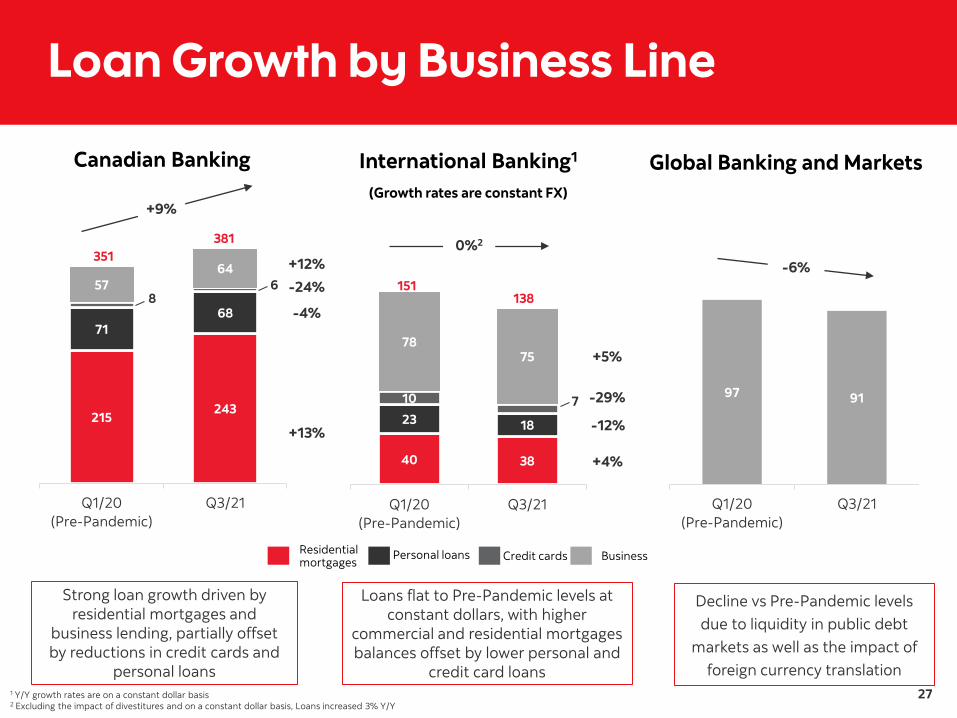
Loan Growth by Business Line
Canadian Banking
Strong loan growth driven by residential mortgages and
business lending, partially offset by reductions in credit cards and
personal loans
International Banking1
1 Y/Y growth rates are on a constant dollar basis
(Growth rates are constant FX)
Loans flat to Pre-Pandemic levels at constant dollars, with higher
commercial and residential mortgages balances offset by lower personal and
credit card loans
Global Banking and Markets
Decline vs Pre-Pandemic levels due to liquidity in public debt
markets as well as the impact of foreign currency translation
40 38
23 18
10 7
7875
Q1/20(Pre-Pandemic)
Q3/21
138151
2 Excluding the impact of divestitures and on a constant dollar basis, Loans increased 3% Y/Y
Residential mortgages
Personal loans Credit cards Business
+1%
Y/Y
97 91
Q1/20(Pre-Pandemic)
Q3/21
-6%
+5%
+4%
-29%215
243
7168
8657
64
Q1/20(Pre-Pandemic)
Q3/21
381
+9%
351 +12%
-4%
+13%
-24%
0%2
-12%
28
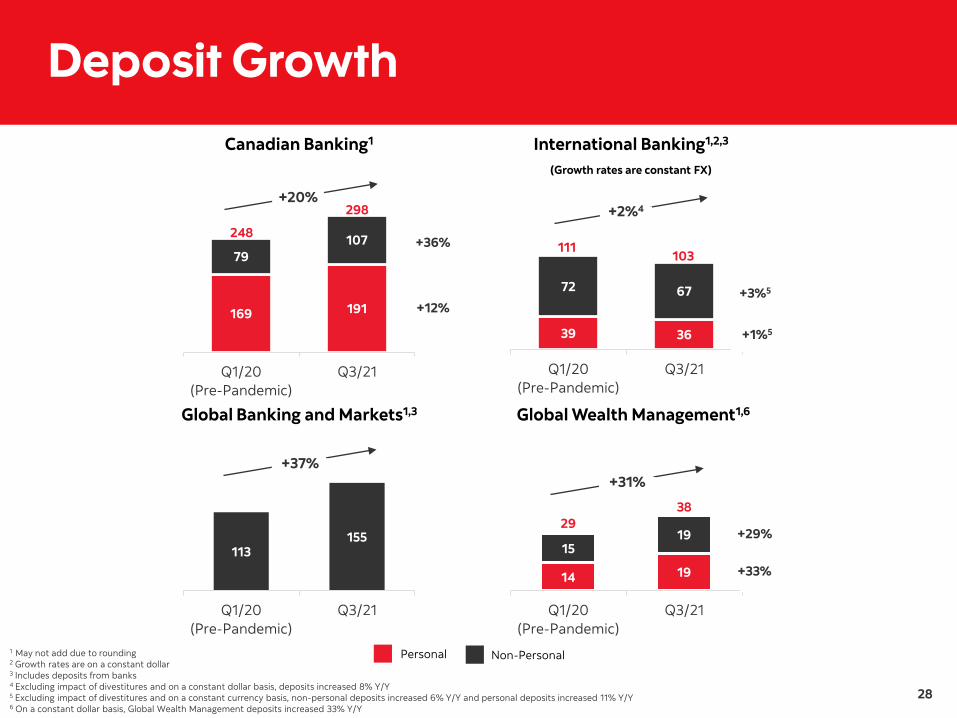
Deposit Growth Canadian Banking1
1 May not add due to rounding
International Banking1,2,3
2 Growth rates are on a constant dollar 3 Includes deposits from banks
(Growth rates are constant FX)
Global Banking and Markets1,3 Global Wealth Management1,6
6 On a constant dollar basis, Global Wealth Management deposits increased 33% Y/Y
14 19
1519
2938
Q1/20(Pre-Pandemic)
Q3/21
39 36
72 67
Q1/20(Pre-Pandemic)
Q3/21
111103
113155
Q1/20(Pre-Pandemic)
Q3/21
4 Excluding impact of divestitures and on a constant dollar basis, deposits increased 8% Y/Y5 Excluding impact of divestitures and on a constant currency basis, non-personal deposits increased 6% Y/Y and personal deposits increased 11% Y/Y
Personal Non-Personal
+2%4
+1%5
+3%5
+20%
+36%
+12%
+37%
169 191
79107
Q1/20(Pre-Pandemic)
Q3/21
248
298
+31%
+29%
+33%
29
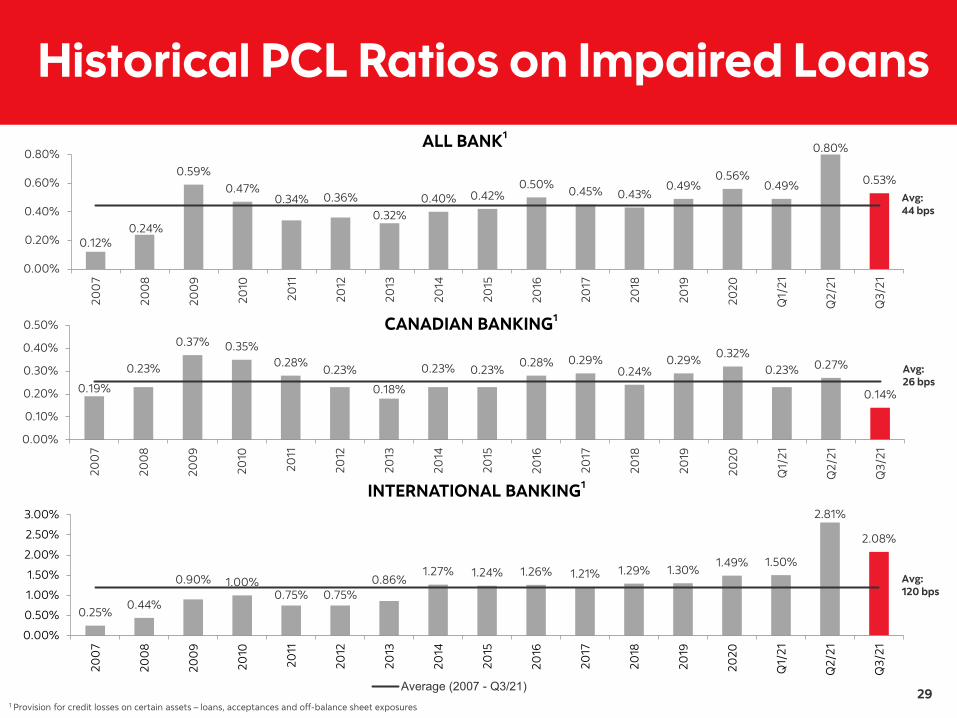
Historical PCL Ratios on Impaired Loans ALL BANK1
1 Provision for credit losses on certain assets – loans, acceptances and off-balance sheet exposures
200
7
0.12%
200
8
0.24%
200
9
0.59%
2010
0.47%
2011
0.34%
2012
0.36%
2013
0.32%
2014
0.40%
2015
0.42%
2016
0.50%
2017
0.45%
2018
0.43%
2019
0.49%
2020
0.56%
Q1/
21
0.49%
Q2/
21
0.80%
Q3/
21
0.53% Avg: 44 bps
CANADIAN BANKING1
200
7
0.19%
200
8
0.23%
200
9
0.37%
2010
0.35%
2011
0.28%
2012
0.23%
2013
0.18%
2014
0.23%
2015
0.23%
2016
0.28%
2017
0.29%
2018
0.24%
2019
0.29%
2020
0.32%
Q1/
21
0.23%
Q2/
21
0.27%
Q3/
21
0.14%
Avg: 26 bps
INTERNATIONAL BANKING1
200
7
0.25%
200
8
0.44%
200
9
0.90%
2010
1.00%
2011
0.75%
2012
0.75%
2013
0.86%
2014
1.27%
2015
1.24%
2016
1.26% 20
17
1.21%
2018
1.29%
2019
1.30%
2020
1.49%
Q1/
21
1.50%
Q2/
21
2.81%
Q3/
21
2.08%
Avg: 120 bps
0.00%
0.20%
0.40%
0.60%
0.80%
0.00%
0.10%
0.20%
0.30%
0.40%
0.50%
0.00%
0.50%
1.00%
1.50%
2.00%
2.50%
3.00%
Average (2007 - Q3/21)

30
Canadian Retail: Loans and Provisions1
1 Includes Wealth Management. PCL excludes impact of additional pessimistic scenario
MORTGAGES AUTO LOANS
LINES OF CREDIT2
2 Includes Home Equity Lines of Credit and Unsecured Lines of Credit
CREDIT CARDS
Loan Balances Q3/21 Mortgages Auto Loans Lines of Credit2 Credit Cards Total
Spot ($B) $270 $40 $32 $6 $3493
% Secured 100% 100% 64% 2% 94%4
3 Includes Tangerine balances of $8 billion and other smaller portfolios 4 82% secured by real estate; 12% secured by automotive
84 94 99 105
81
91 993985
96
216 224
106
89 78 35
Q4/19 Q1/20 Q2/20 Q3/20 Q4/20 Q1/21 Q2/21 Q3/21
1 0 1 2 2 1 1 01 04 4
1 1 1 0
Q4/19 Q1/20 Q2/20 Q3/20 Q4/20 Q1/21 Q2/21 Q3/21
72 80 87
74 65
62 7033
70 73
164 169
79
60 57 32
Q4/19 Q1/20 Q2/20 Q3/20 Q4/20 Q1/21 Q2/21 Q3/21
379 377
445
401 312
322410
288381 385
8961,002
400
321 310 204
Q4/19 Q1/20 Q2/20 Q3/20 Q4/20 Q1/21 Q2/21 Q3/21
PCL as a % of avg. net loans (bps) PCLs on Impaired Loans as a % of avg. net loans (bps)
31
163251 250 267
280
243
428329
246 228
550 591
253
248
205 179
Q4/19 Q1/20 Q2/20Q3/20Q4/20 Q1/21 Q2/21 Q3/211
471
406579 542 143
245
1,3381,588
420
439
939
1,552
738
361
385287
Q4/19 Q1/20 Q2/20 Q3/20 Q4/20 Q1/21 Q2/21 Q3/211
154
191
190238
181
54 67 58
160
175
279 321
8781 70 62
Q4/19 Q1/20 Q2/20Q3/20Q4/20 Q1/21 Q2/21 Q3/211
165 170 231 221 195
261326 300
187 178
457556
221
204 216170
Q4/19 Q1/20 Q2/20Q3/20Q4/20 Q1/21 Q2/21 Q3/211
473 471
395 361764
1,152
2,436
1,194
424470
9701,290 1,322
1,065726 636
Q4/19 Q1/20 Q2/20Q3/20Q4/20 Q1/21 Q2/21 Q3/211
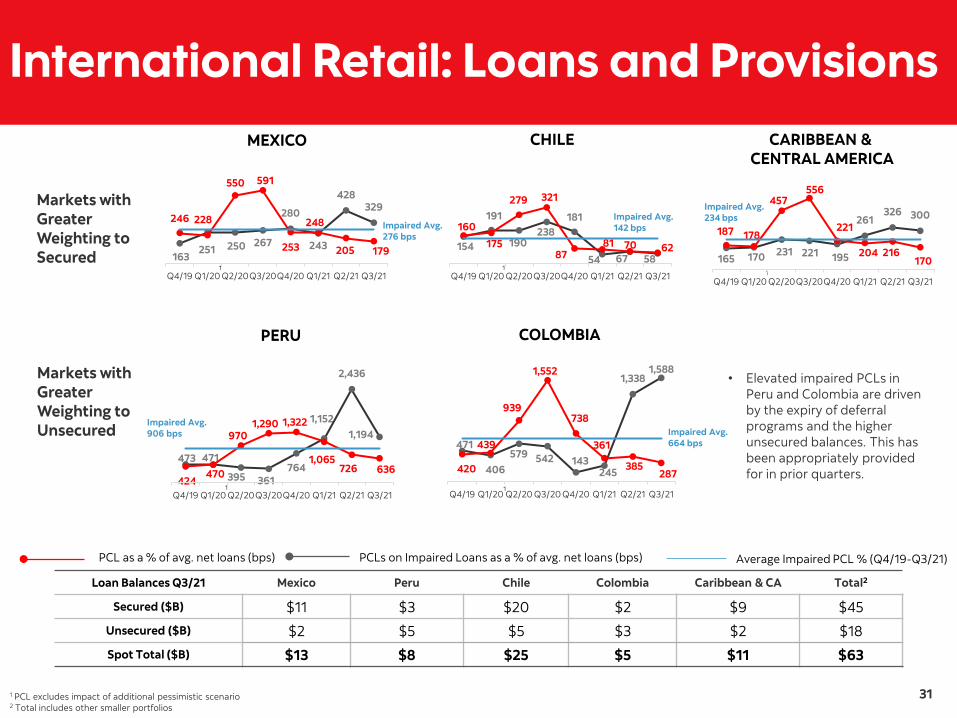
1 PCL excludes impact of additional pessimistic scenario
PCL as a % of avg. net loans (bps) PCLs on Impaired Loans as a % of avg. net loans (bps)
•
Impaired Avg. 906 bps Impaired Avg.
664 bps
Impaired Avg. 276 bps
Impaired Avg. 142 bps
Impaired Avg. 234 bps
Average Impaired PCL % (Q4/19-Q3/21)
International Retail: Loans and Provisions
Markets with Greater Weighting to Secured
MEXICO CHILE CARIBBEAN & CENTRAL AMERICA
Markets with Greater Weighting to Unsecured
PERU COLOMBIA
Elevated impaired PCLs in Peru and Colombia are driven by the expiry of deferral programs and the higher unsecured balances. This has been appropriately provided for in prior quarters.
Loan Balances Q3/21 Mexico Peru Chile Colombia Caribbean & CA Total2
Secured ($B) $11 $3 $20 $2 $9 $45 Unsecured ($B) $2 $5 $5 $3 $2 $18 Spot Total ($B) $13 $8 $25 $5 $11 $63
2 Total includes other smaller portfolios

32
Retail 90+ Days Past Due Loans
CANADA1
1 Includes Wealth Management
Q1/20 Q2/202 Q3/202 Q4/202 Q1/212 Q2/212 Q3/212
Mortgages 0.21% 0.21% 0.19% 0.15% 0.17% 0.16% 0.13%
Personal Loans 0.63% 0.72% 0.63% 0.51% 0.54% 0.51% 0.41%
Credit Cards 1.02% 1.12% 0.81% 0.70% 0.98% 0.75% 0.57%
Secured and Unsecured Lines of Credit 0.25% 0.26% 0.23% 0.19% 0.22% 0.18% 0.15%
Total 0.29% 0.30% 0.26% 0.21% 0.23% 0.21% 0.18%
2 Does not reflect impact of payment deferral programs
INTERNATIONAL Q1/20 Q2/202 Q3/202 Q4/202 Q1/212 Q2/212 Q3/212
Mortgages 2.65% 3.05% 2.94% 2.70% 2.76% 2.67% 2.60%
Personal Loans 3.89% 4.04% 4.02% 4.19% 5.79% 5.29% 4.42%
Credit Cards 3.26% 3.35% 2.72% 2.61% 7.08% 5.83% 3.14%
Total 3.22% 3.36% 3.18% 3.05% 4.05% 3.69% 3.09%

33
International Banking: Pacific Alliance
FINANCIAL PERFORMANCE AND METRICS ($MM)1,2,3
1 Attributable to equity holders of the Bank 2 Y/Y and Q/Q growth rates (%) are on a constant dollar basis, while metrics and change in bps are on a reported basis 3 Refer to Non-GAAP Measures on slide 38 for adjusted results
Q3/21 Q2/21 Q3/20 Q/Q Y/Y
Revenue ($MM) 1,728 1,709 1,833 5% 2%
Expenses ($MM) 797 807 846 3% 0%
PTPP ($MM) 931 902 987 8% 4%
Net Income1 ($MM) 442 358 63 28% 847%
NIM 3.80% 4.04% 4.04% (24 bps) (24 bps)
Productivity Ratio 46.1% 47.2% 46.1% (107 bps) -
GEOGRAPHIC DISTRIBUTION4,5
4 For the 3 months ended July 31, 2021 5 May not add due to rounding
REVENUE
$1.73B
Colombia 15%
Mexico 32%
Peru 22%
Chile 31%
NET INCOME1,3
$442MM
Colombia 3%
Mexico 39%
Peru 21%Chile
37%
AVG EARNING ASSETS
$131B
Colombia 9%
Mexico 31%
Peru 19%
Chile 40%

34
Sectors Most Impacted by COVID-191
1 Sectors which have experienced the greatest disruption in normal business activities and impact to revenue due to the COVID-19 pandemic (including, but not limited to, government-mandated closures) relative to other sectors
Most Impacted Sectors as a % of Total Loans
Q3/20
4.1%
Q4/20
4.0%
Q1/21
4.0%
Q2/21
3.6%
Q3/21
3.5%
Total Loans
$650.9B
Energy – E&P and Oilfield Services: 1.1% Real Estate – Office and Retail: 1.4% Transportation – Air Travel: 0.3% Hospitality and Leisure: 0.7%
Total COVID-19 High Impact: 3.5%
Real Estate: Office and Retail
$9.2B (1.4% of total
loans)
U.S. 5%
Mexico 3%
C&CA 9%
Canada
59%
Latin America 12%Europe 1%
Other 12%
$B %IG Office REIT 1.2 72%
Office Real Estate 3.8 54%
Retail REIT 1.1 98%
Retail Real Estate 3.0 45%
Total2 9.2 59%
2 May not add due to rounding
Hospitality and Leisure
$4.5B (0.7% of total
loans)
U.S.
28%
Mexico
9%
C&CA17%
Canada
31%
Latin America
4%
Europe 1%Other
10% $B %IG
Hotels 3.5 17%
Cruise Lines 0.3 0%
Gaming 0.7 1%
Total2 4.5 13%
Transportation: Air Travel
$2.1B (0.3% of total
loans)
Mexico
6%
C&CA 8%
Canada 17%Latin
America 6%
Europe
48% Other
15%
$B %IG Aircraft Finance 0.7 96%
Airlines 0.3 3%
Airports 1.1 45%
Total2 2.1 57%
35
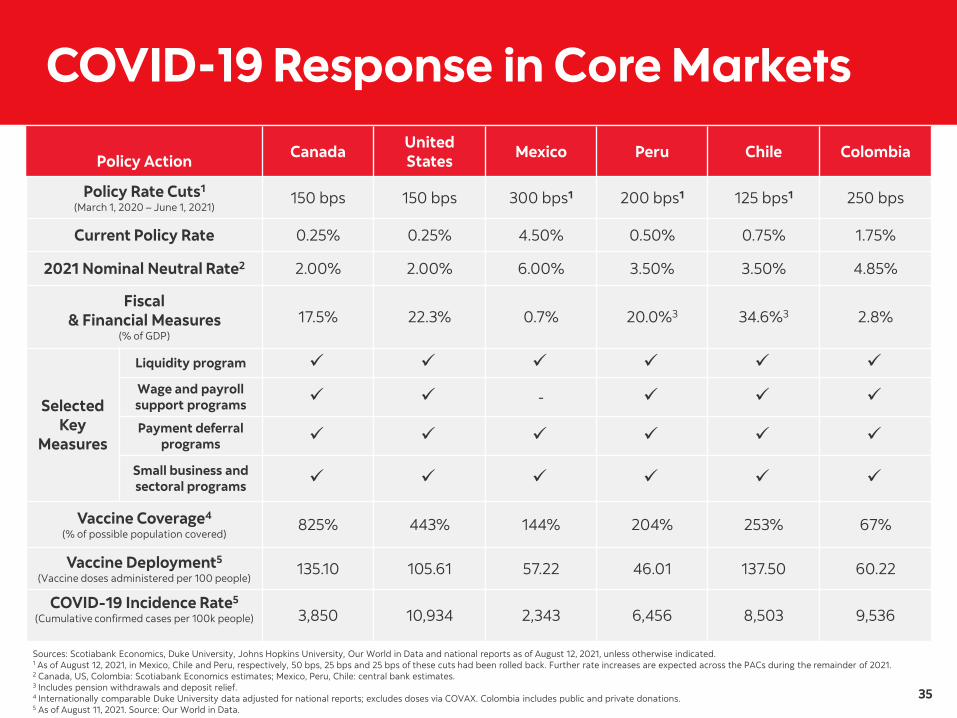
COVID-19 Response in Core Markets
Policy Action Canada United States Mexico Peru Chile Colombia
Policy Rate Cuts1
(March 1, 2020 – June 1, 2021) 150 bps 150 bps 300 bps1 200 bps1 125 bps1 250 bps
Current Policy Rate 0.25% 0.25% 4.50% 0.50% 0.75% 1.75%
2021 Nominal Neutral Rate2 2.00% 2.00% 6.00% 3.50% 3.50% 4.85%
Fiscal & Financial Measures
(% of GDP)
17.5% 22.3% 0.7% 20.0%3 34.6%3 2.8%
Selected Key
Measures
Liquidity program ✓ ✓ ✓ ✓ ✓ ✓ Wage and payroll support programs ✓ ✓ - ✓ ✓ ✓ Payment deferral
programs ✓ ✓ ✓ ✓ ✓ ✓
Small business and sectoral programs ✓ ✓ ✓ ✓ ✓ ✓
Vaccine Coverage4
(% of possible population covered) 825% 443% 144% 204% 253% 67%
Vaccine Deployment5
(Vaccine doses administered per 100 people) 135.10 105.61 57.22 46.01 137.50 60.22
COVID-19 Incidence Rate5
(Cumulative confirmed cases per 100k people) 3,850 10,934 2,343 6,456 8,503 9,536
1 As of August 12, 2021, in Mexico, Chile and Peru, respectively, 50 bps, 25 bps and 25 bps of these cuts had been rolled back. Further rate increases are expected across the PACs during the remainder of 2021. 2 Canada, US, Colombia: Scotiabank Economics estimates; Mexico, Peru, Chile: central bank estimates. 3 Includes pension withdrawals and deposit relief. 4 Internationally comparable Duke University data adjusted for national reports; excludes doses via COVAX. Colombia includes public and private donations. 5 As of August 11, 2021. Source: Our World in Data.
Sources: Scotiabank Economics, Duke University, Johns Hopkins University, Our World in Data and national reports as of August 12, 2021, unless otherwise indicated.
36
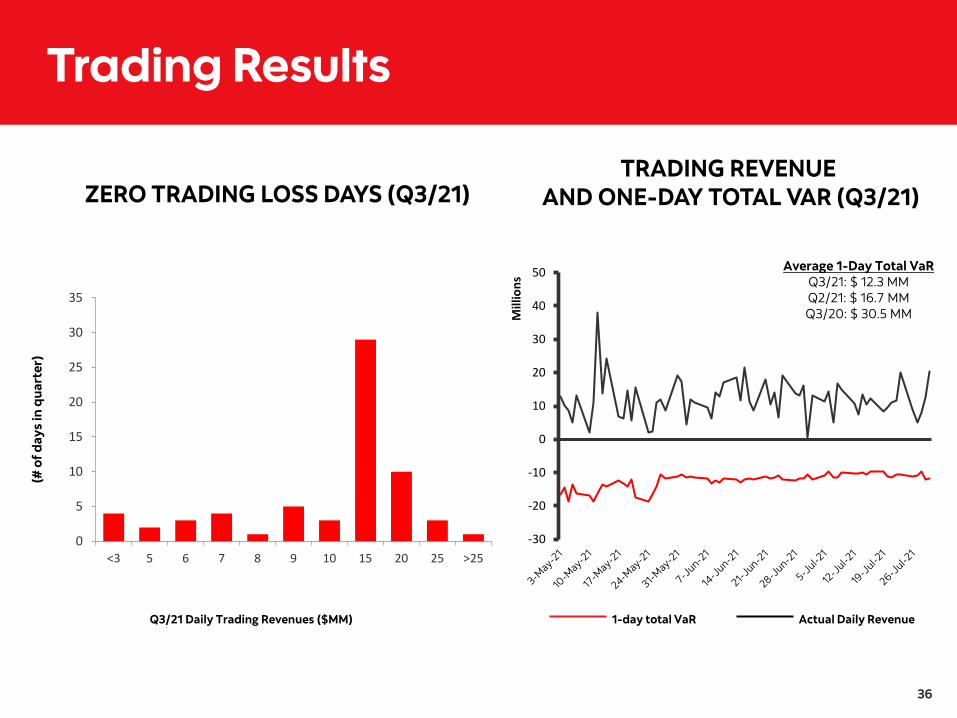
Trading Results
ZERO TRADING LOSS DAYS (Q3/21) TRADING REVENUE
AND ONE-DAY TOTAL VAR (Q3/21)
1-day total VaR Actual Daily Revenue
(# o
f day
s in
qua
rter
)
Q3/21 Daily Trading Revenues ($MM)
0
5
10
15
20
25
30
35
<3 5 6 7 8 9 10 15 20 25 >25-30
-20
-10
0
10
20
30
40
50
Mill
ions
Average 1-Day Total VaRQ3/21: $ 12.3 MMQ2/21: $ 16.7 MMQ3/20: $ 30.5 MM
37
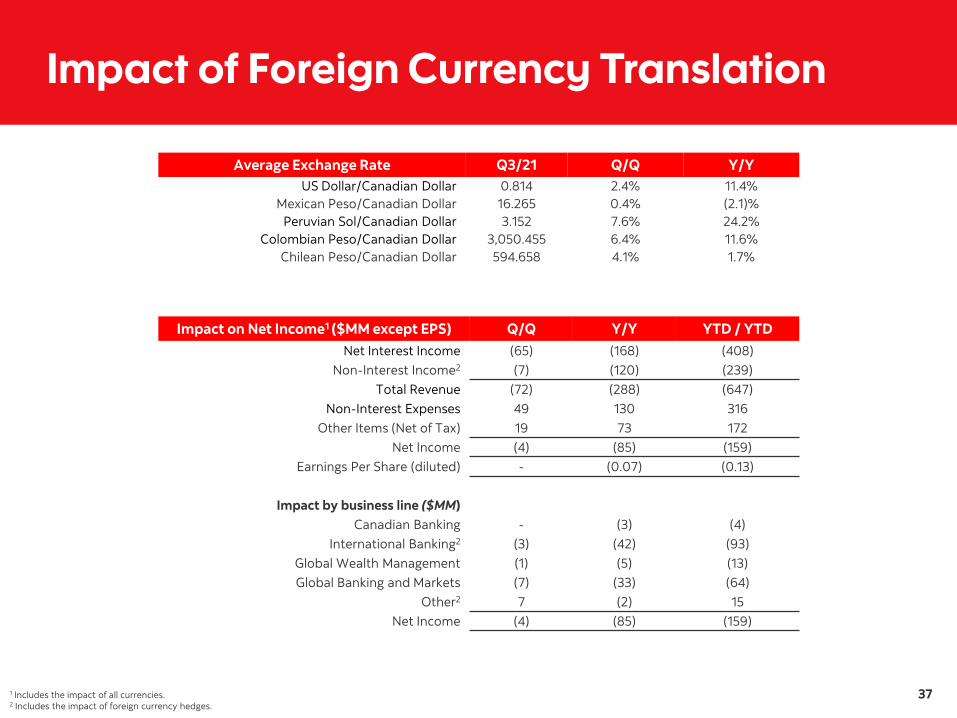
Impact of Foreign Currency Translation
Average Exchange Rate Q3/21 Q/Q Y/Y US Dollar/Canadian Dollar 0.814 2.4% 11.4%
Mexican Peso/Canadian Dollar 16.265 0.4% (2.1)% Peruvian Sol/Canadian Dollar 3.152 7.6% 24.2%
Colombian Peso/Canadian Dollar 3,050.455 6.4% 11.6% Chilean Peso/Canadian Dollar 594.658 4.1% 1.7%
Impact on Net Income1 ($MM except EPS)
1 Includes the impact of all currencies.
Q/Q Y/Y YTD / YTD Net Interest Income (65) (168) (408)
Non-Interest Income2 (7) (120) (239) Total Revenue (72) (288) (647)
Non-Interest Expenses 49 130 316 Other Items (Net of Tax) 19 73 172
Net Income (4) (85) (159) Earnings Per Share (diluted) - (0.07) (0.13)
Impact by business line ($MM) Canadian Banking - (3) (4)
International Banking2 (3) (42) (93) Global Wealth Management (1) (5) (13) Global Banking and Markets (7) (33) (64)
Other2 7 (2) 15 Net Income (4) (85) (159)
2 Includes the impact of foreign currency hedges.
38
•
Non-GAAP Measures The Bank uses a number of financial measures to assess its performance. Some of these measures are not calculated in accordance with Generally Accepted Accounting Principles (GAAP), which are based on International Financial Reporting Standards (IFRS) as issued by the International Accounting Standards Board (IASB), are not defined by GAAP and do not have standardized meanings that would ensure consistency and comparability among companies using these measures. The Bank believes that certain non-GAAP measures are useful in assessing ongoing business performance and provide readers with a better understanding of how management assesses performance. These non-GAAP measures are used throughout this report and defined below.
Adjusted results and diluted earnings per share The following table presents reconciliations of GAAP Reported financial results to non-GAAP Adjusted financial results.
The adjustments summarized below are consistent with those described in the Bank’s 2020 Annual Report. For a complete description of the adjustments, refer to the Non-GAAP Measures section in the Bank’s 2020 Annual Report:
Adjustments impacting current and prior periods:
Amortization of acquisition-related intangible assets, excluding software
Adjustments impacting prior periods only:
• Acquisition and divestiture-related costs – Include costs related to integrating acquired operations and net (gain)/loss on divestitures
• Valuation-related adjustments, recorded in Q1 2020 – Relate to the inclusion of an additional scenario in the measurement of allowance for credit losses, fair value methodology change relating to uncollateralized OTC derivatives, and a software-related impairment loss

39
Investor Relations Contact Information
John McCartney, Senior Vice-President 416-863-7579
Sophia Saeed, Vice-President 416-933-8869
Mark Michalski, Director 416-866-6905
Rene Lo, Director 416-866-6124


