49
IOT @ SOFTWARE AG THE NEW GROWTH DRIVER KEPLER CHEUVREUX ROADSHOW HELSINKI / STOCKHOLM MAY 3-4, 2018 © 2018 Software AG. All rights reserved.
IOT @ SOFTWARE AG
THE NEW GROWTH DRIVER
KEPLER CHEUVREUX ROADSHOW HELSINKI / STOCKHOLM
MAY 3-4, 2018
© 2018 Software AG. All rights reserved.
2 |
This presentation includes forward-looking statements based on the beliefs of Software AG management.Such statements reflect current views of Software AG with respect to future eventsand results and are subject to risks and uncertainties. Actual results may vary materially from thoseprojected here, due to factors including changes in general economic and business conditions, changes incurrency exchange, the introduction of competing products, lack of market acceptanceof new products, services or technologies and changes in business strategy. Software AG does not intendor assume any obligation to update these forward-looking statements.
This presentation constitutes neither an offer nor recommendation to subscribe or buy in any other waysecurities of Software AG or any of the companies that are members of the Group at present or in thefuture, nor does it form part of such an offer and it should not be understood as such. This presentationdoes not constitute an offer of sale of securities in the United States of America. Securities may not beoffered or sold in the United States of America without registration or exemption from registration inaccordance with the U.S. Securities‘ Act of 1933 in its currently valid form.
© 2018 Software AG. All rights reserved.
SAFE-HARBOR-STATEMENT
3 |
SOFTWARE AG AT A GLANCE
© 2018 Software AG. All rights reserved.
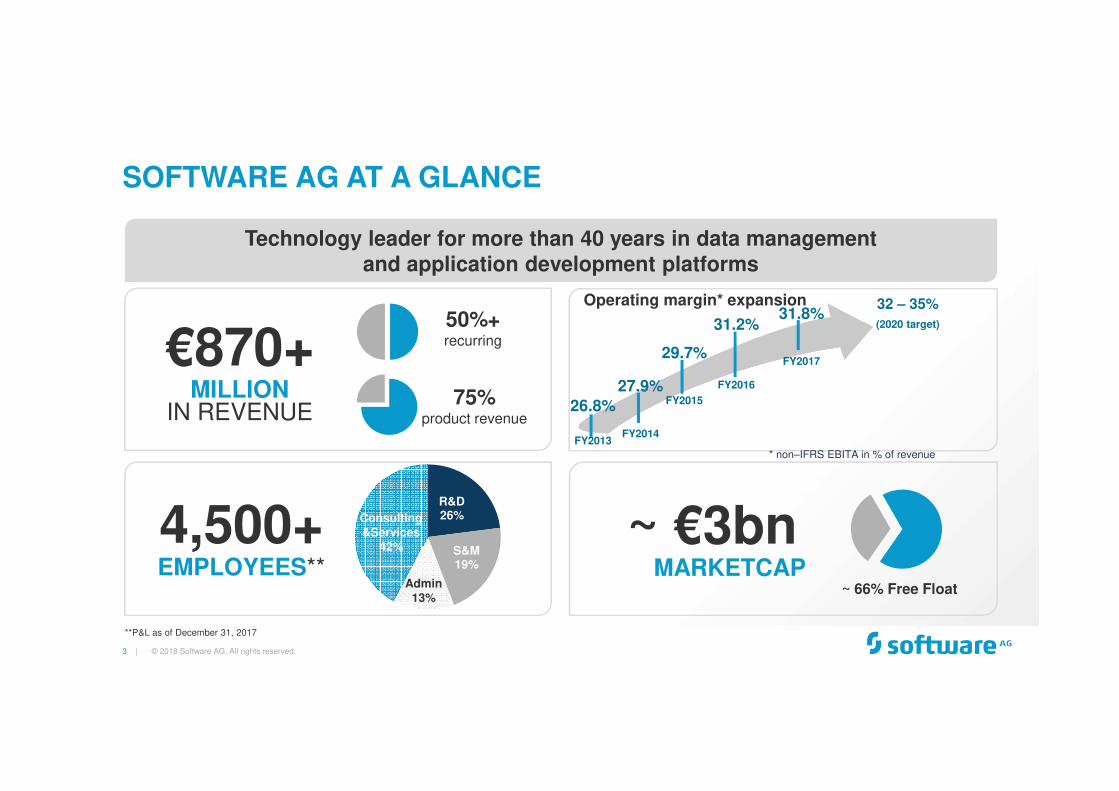
Technology leader for more than 40 years in data management and application development platforms
~ €3bnMARKETCAP
~ 66% Free Float
€870+MILLION
IN REVENUE
50%+recurring
75% product revenue
4,500+EMPLOYEES**
R&D26%
S&M19%
Consulting&Services
42%
Admin13%
**P&L as of December 31, 2017
31.2%
FY2016
29.7%
FY201526.8%
FY2013
27.9%
FY2014
Operating margin* expansion
* non–IFRS EBITA in % of revenue
32 – 35%
(2020 target)31.8%
FY2017
4 |
BUSINESS LINES
© 2018 Software AG. All rights reserved.
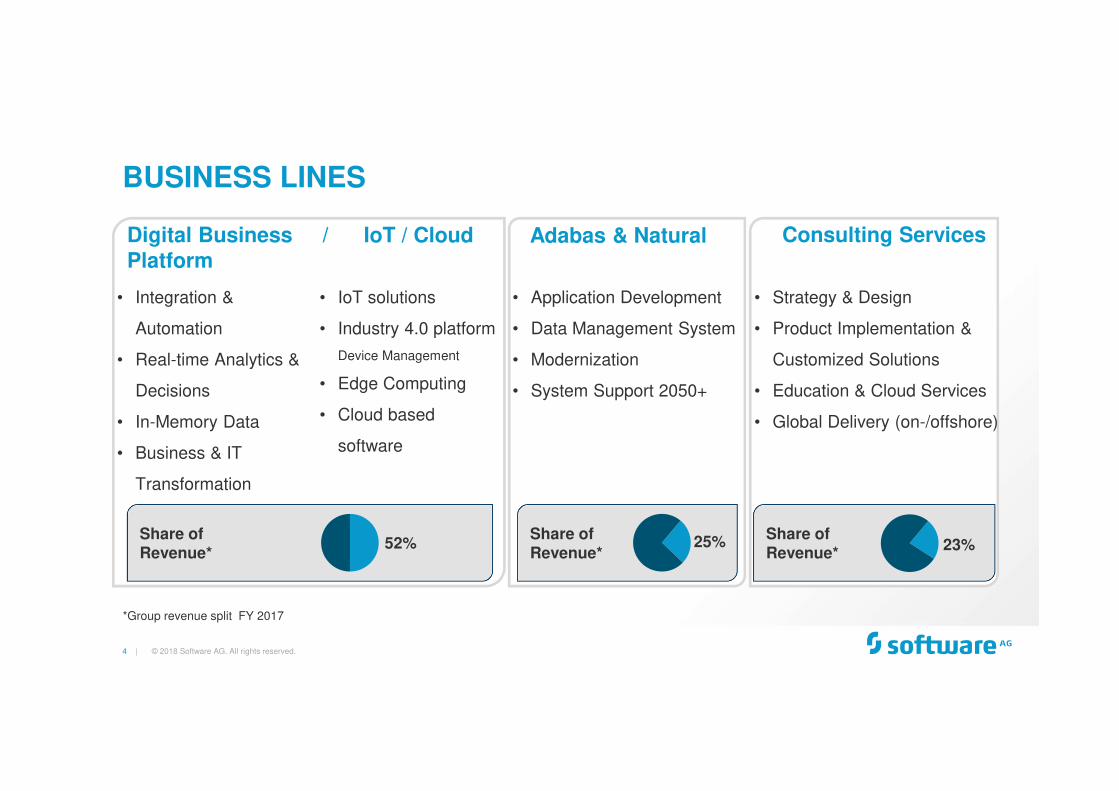
*Group revenue split FY 2017
Share of Revenue*
52%
• Integration &
Automation
• Real-time Analytics &
Decisions
• In-Memory Data
• Business & IT
Transformation
Share of Revenue*
• Application Development
• Data Management System
• Modernization
• System Support 2050+
Share of Revenue*
• Strategy & Design
• Product Implementation &
Customized Solutions
• Education & Cloud Services
• Global Delivery (on-/offshore)
25% 23%
• IoT solutions
• Industry 4.0 platform
Device Management
• Edge Computing
• Cloud based
software
Digital Business / Platform
IoT / Cloud Adabas & Natural Consulting Services
5 |
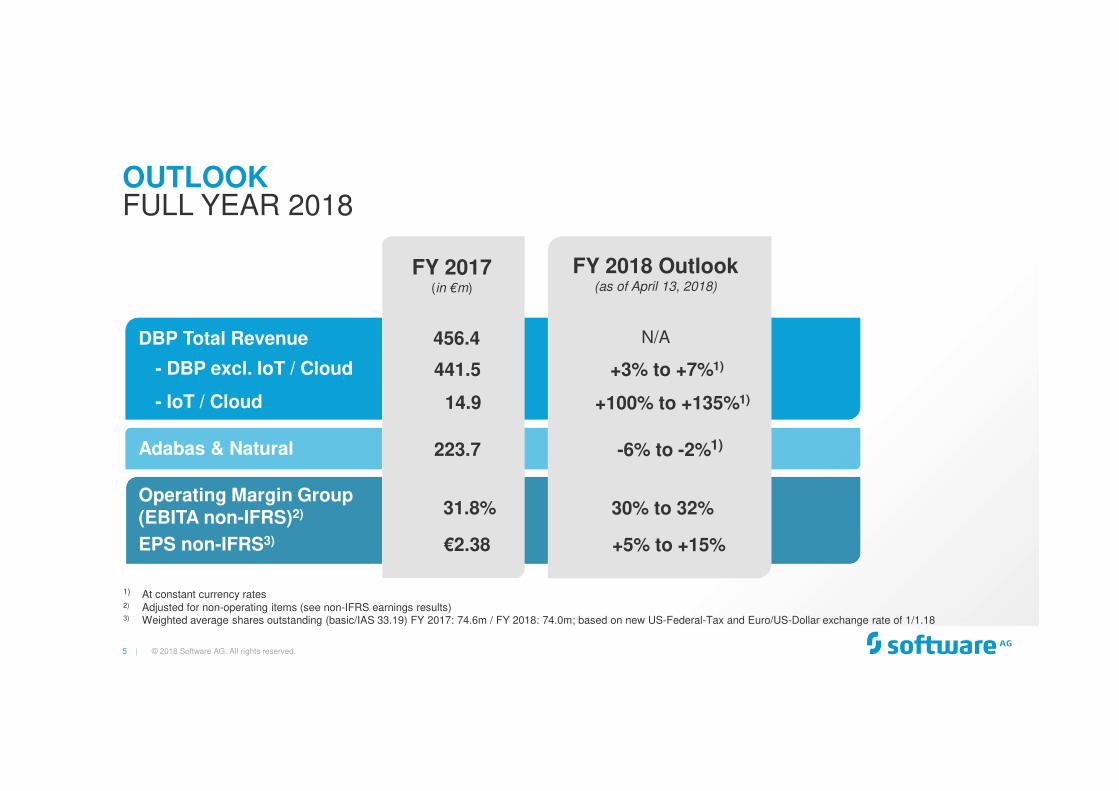
DBP Total Revenue
Adabas & Natural
Operating Margin Group(EBITA non-IFRS)2)
OUTLOOK
© 2018 Software AG. All rights reserved.
FULL YEAR 2018
1) At constant currency rates2) Adjusted for non-operating items (see non-IFRS earnings results)3) Weighted average shares outstanding (basic/IAS 33.19) FY 2017: 74.6m / FY 2018: 74.0m; based on new US-Federal-Tax and Euro/US-Dollar exchange rate of 1/1.18
- IoT / Cloud
- DBP excl. IoT / Cloud
EPS non-IFRS3)
FY 2018 Outlook (as of April 13, 2018)
30% to 32%
-6% to -2%1)
N/A
FY 2017(in €m)
223.7
456.4
31.8%
14.9 +100% to +135%1)
+3% to +7%1)441.5
+5% to +15%€2.38

6 |
DATA CENTERED ERA REQUIRES SOFTWARE CENTRICITY
© 2018 Software AG. All rights reserved.
Source: Morgan Stanley Research, The Data Era Becomes Investable, April 9, 2018
Entering the next computing cycle – which is centered on data…
Software AG is ready to reap proceeds from higher IT investments by providing a comprehensiveworkbench along the value IT chain.
Software AG has singled out a distinct area of growth in (industrial) IoT to leverage its capabilitesto the next level.
Source: industry interviews Bain & company, 2017
7 |
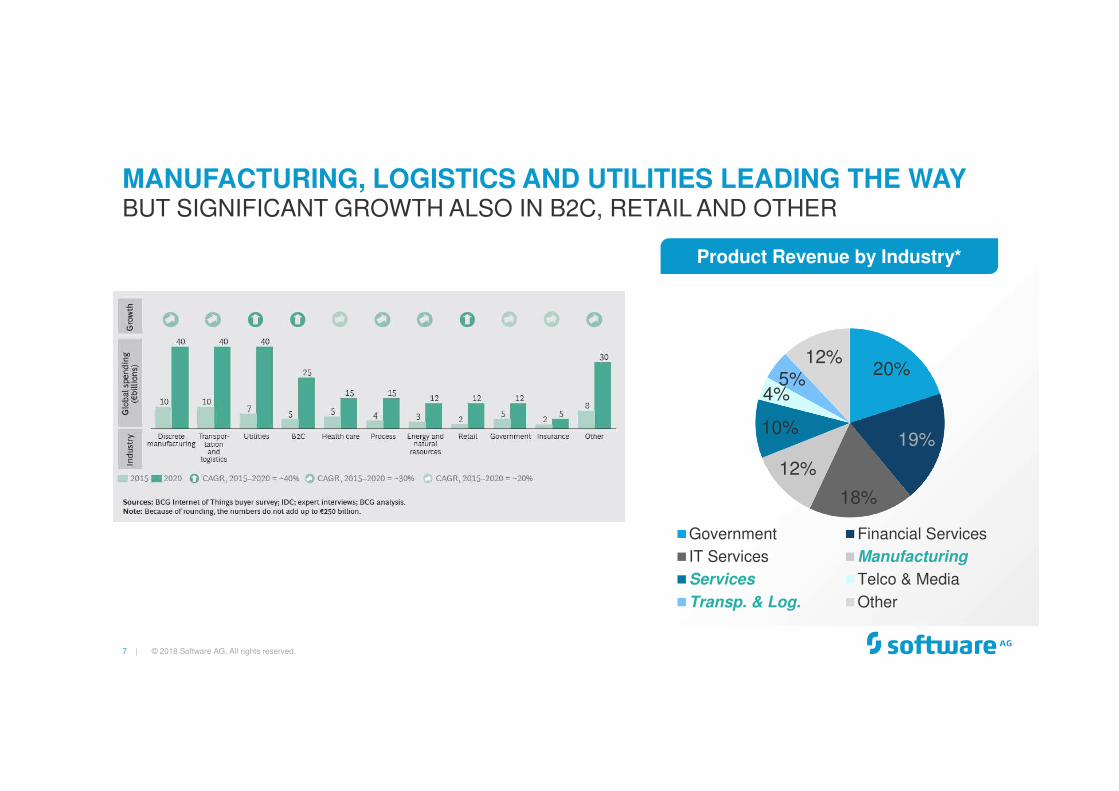
MANUFACTURING, LOGISTICS AND UTILITIES LEADING THE WAY
© 2018 Software AG. All rights reserved.
BUT SIGNIFICANT GROWTH ALSO IN B2C, RETAIL AND OTHER
20%
19%
18%
12%
10%
4%5%
12%
Government Financial Services
IT Services Manufacturing
Services Telco & Media
Transp. & Log. Other
Product Revenue by Industry*
8 |
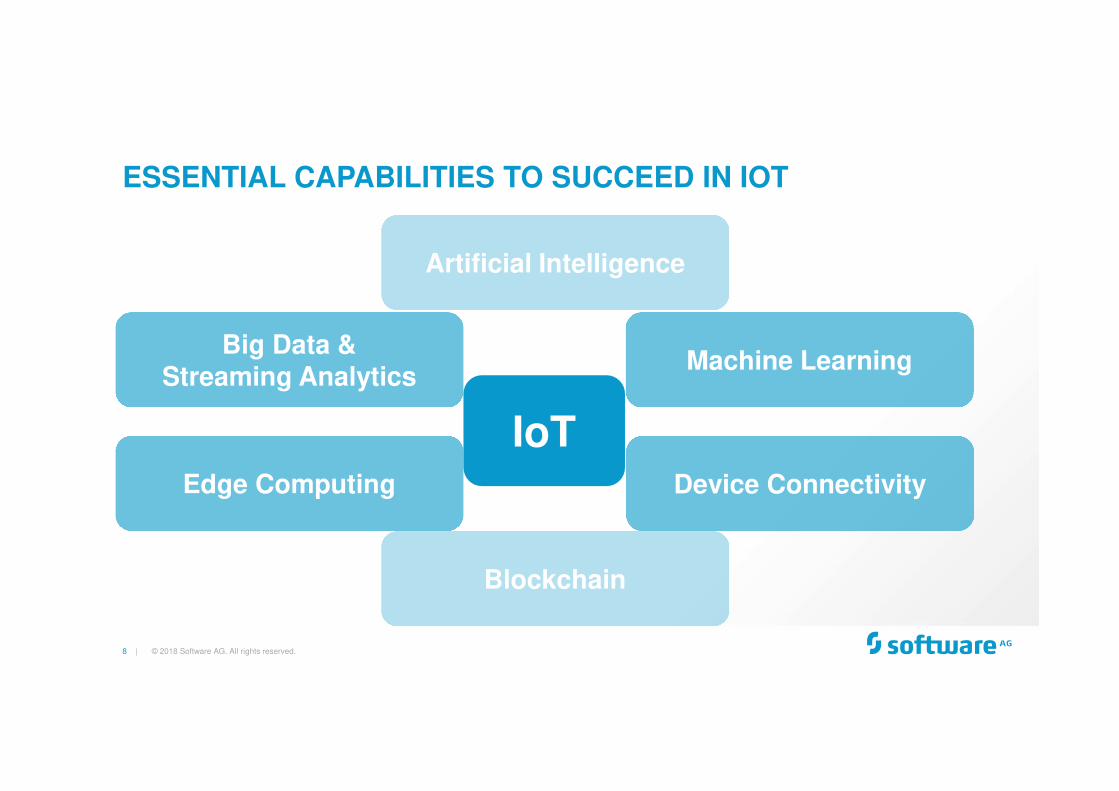
ESSENTIAL CAPABILITIES TO SUCCEED IN IOT
© 2018 Software AG. All rights reserved.
Big Data & Streaming Analytics
Edge Computing Device Connectivity
IoT
Artificial Intelligence
Machine Learning
Blockchain

9 |
SOFTWARE AG IOT PLATFORM CAPABILITESACQUISITIONS TO CATER THE IOT NEEDS
2011 2013 2016
© 2018 Software AG. All rights reserved.
2017
Big Data & Streaming Analytics
Artificial Intelligence
Machine Learning
Edge Computing
Device Connectivity
IoT Acquistions
Blockchain
2010
Strategic decisionfor IoT

10 | © 2018 Software AG. All rights reserved.
The Forrester Wave™: HYBRID INTEGRATION
(SAG WebMethods)
The Forrester Wave™: IN MEMORY DATA GRID
(SAG Terracotta)
IoT Solutions(SAG Cumulocity*)
The Forrester Wave™: STREAMING ANALYTICS
(SAG Apama)
*Cumulocity is the IoT solution portfolio of Software AG
encompassing Hybrid Integration, In-Memory Computing
and Streaming Analytics
MARKET AWARENESS OF LEADERSHIP IS BUILDING UPBEST IOT TECHNOLOGY PARTNER IN THE MARKET…

11 |
SOFTWARE AG DRIVES ECONOMIC VALUE THROUGH DBP
© 2018 Software AG. All rights reserved.
CLIENTS ENDORSE TO VALUE PROPOSITION*
*A Forrester Total Economic ImpactTM Study of the Software AG Digitial Business Platform, April 2018; purpose of the study is to provide readers with a framework to evaluate to potential finanical value of the DBP on their organizations
Forrester created a composite Organization to describe the Total Economic Impact of the DBP
• Incremental revenuecontribution (gross profit)
• Productivity improvements fordevelopers
• IoT connectivity solutionbenefits
• Better business insights withstreaming & predictiveanalytics
Benefits PV (3yrs) ~€6m
• Investment in SaaS DBP
� Labor to deploy & maintainplatform
� SaaS subscription fees forplatform
NPV(3yrs) ~€4.5m
ROI 320% Payback period< 6months
• Compelling business case proposition
• Raises confidence for payback period limited
• Risk-adjusted calculation scheme reflect realistic
expectations as they represent the expected value
considering risk

12 |
ESSENTIAL CAPABILITIES TO SUCCEED IN IOT
© 2018 Software AG. All rights reserved.
Big Data & Streaming Analytics
Edge Computing Device Connectivity
IIoTPredictive
Maintenance
Artificial Intelligence
Machine Learning
Blockchain

13 |
Strengthening Mindsphere platform across industries enabling powerful industry applications
© 2018 Software AG. All rights reserved.
SOFTWARE AG’S SUCCESS STORIES IN IOTIOT ECOSYSTEMS – INDUSTRY 4.0, TELCOS, AUTOMOTIVE, …
Forging joint venture of leading machinery manufactures for Industry 4.0
Leveraging Bosch IoT Cloud platform with Real-time predictive analytics technology
Enabling customers to use geo-sensing alerts, reduce theft and anticipate maintenance needs
KPN (NL), Telstra (AUS), Telia (SWE), Reliance Communications (India), Japan’s NTT (Japan), Deutsche Telekom (T-Systems), Nokia and Huawei.
Transforming auto insurance through behavioral, contextual and driving analytics
April 19, 2018
RESULTS 1st QUARTER 2018(IFRS, UNAUDITED)
© 2018 Software AG. All rights reserved.
15 |
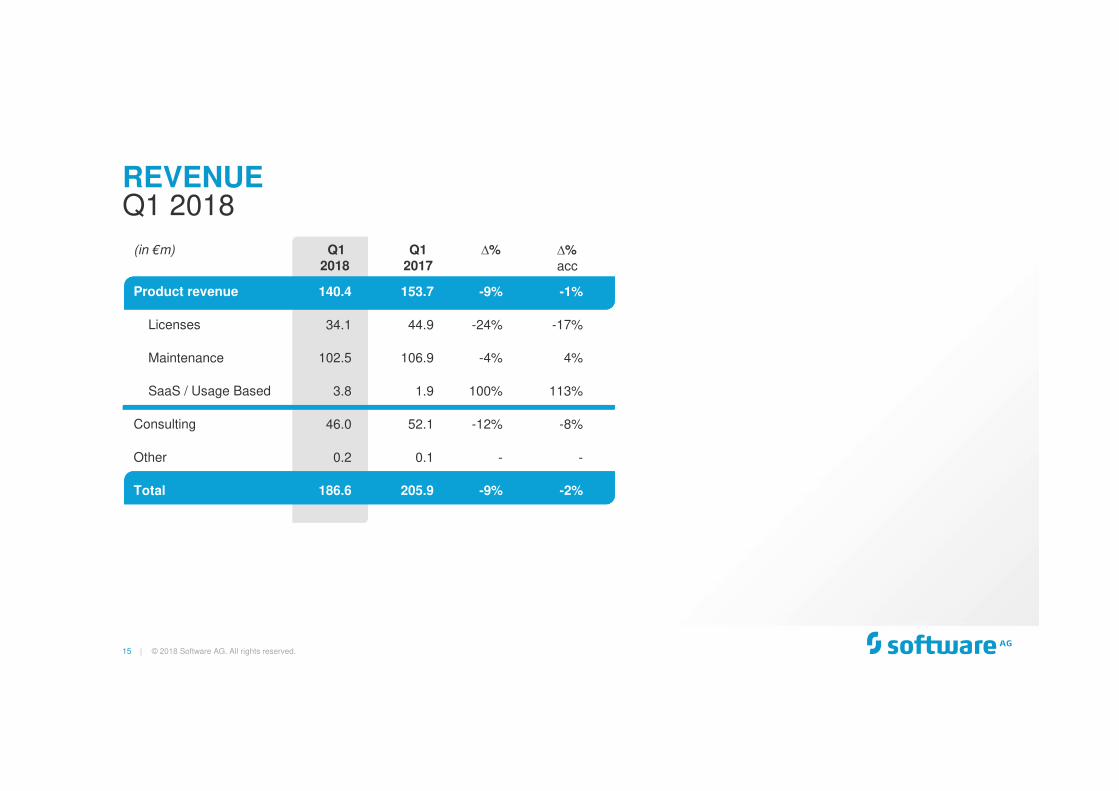
REVENUE
© 2018 Software AG. All rights reserved.
Q1 2018
(in €m) Q1 2018
Q1 2017
∆% ∆%acc
Product revenue 140.4 153.7 -9% -1%
Licenses 34.1 44.9 -24% -17%
Maintenance 102.5 106.9 -4% 4%
SaaS / Usage Based 3.8 1.9 100% 113%
Consulting 46.0 52.1 -12% -8%
Other 0.2 0.1 - -
Total 186.6 205.9 -9% -2%
Segment result
16 |
Euro36%
US Dollar28%
Other14%
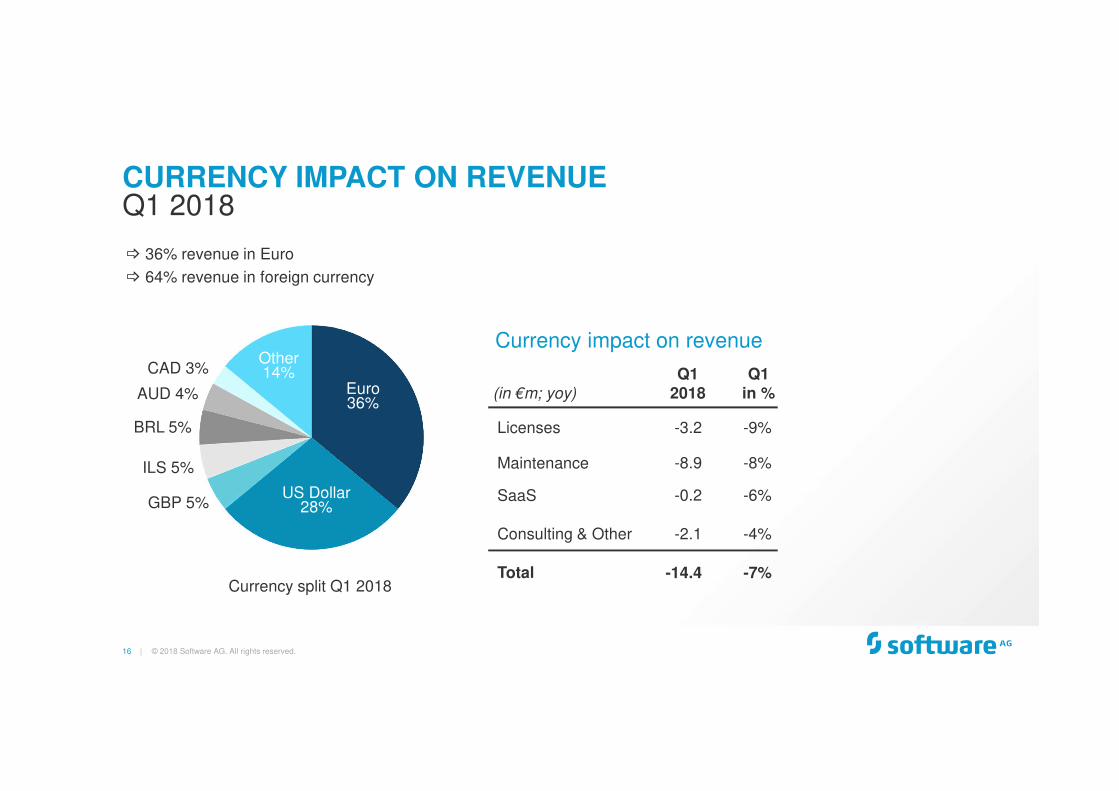
CURRENCY IMPACT ON REVENUE
© 2018 Software AG. All rights reserved.
Q1 2018
(in €m; yoy)
Q12018
Q1in %
Licenses -3.2 -9%
Maintenance -8.9 -8%
SaaS -0.2 -6%
Consulting & Other -2.1 -4%
Total -14.4 -7%
Currency impact on revenue
� 36% revenue in Euro
� 64% revenue in foreign currency
Currency split Q1 2018
BRL 5%
AUD 4%
CAD 3%
GBP 5%
ILS 5%

17 |
DBP PRODUCT REVENUE SEASONALITY
© 2018 Software AG. All rights reserved.
SHARE OF ANNUAL REVENUE IN THE QUARTERS
21.1%21.4%
23.2%
20.4%
0%
5%
10%
15%
20%
25%
30%
35%
Q1 Q2 Q3 Q4
2015 2016 2017 2018

18 |
DIGITAL BUSINESS PLATFORM (INCLUDING IoT/CLOUD)
SEGMENT REPORT Q1 2018
© 2018 Software AG. All rights reserved.
(in €m) Q1 2018
Q1 2017
∆% ∆%acc
Licenses 25.2 37.1 -32% -25%
Maintenance 66.8 66.9 0% 8%
SaaS / Usage Based 3.8 1.9 100% 113%
Total revenue 95.8 105.9 -10% -2%
Cost of sales -8.6 -7.4 16% 23%
Gross profit 87.2 98.5 -11% -4%
Sales & Marketing -37.8 -44.8 -16% -9%
Research & Development -22.7 -23.7 -4% 1%
Segment result 26.7 30.0 -11% 1%
Margin in % 27.9% 28.3%
ARR (Annual Recurring Revenue)
276.5 262.0 6% 14%* * Internal Plan Rate 2018 used
19 |
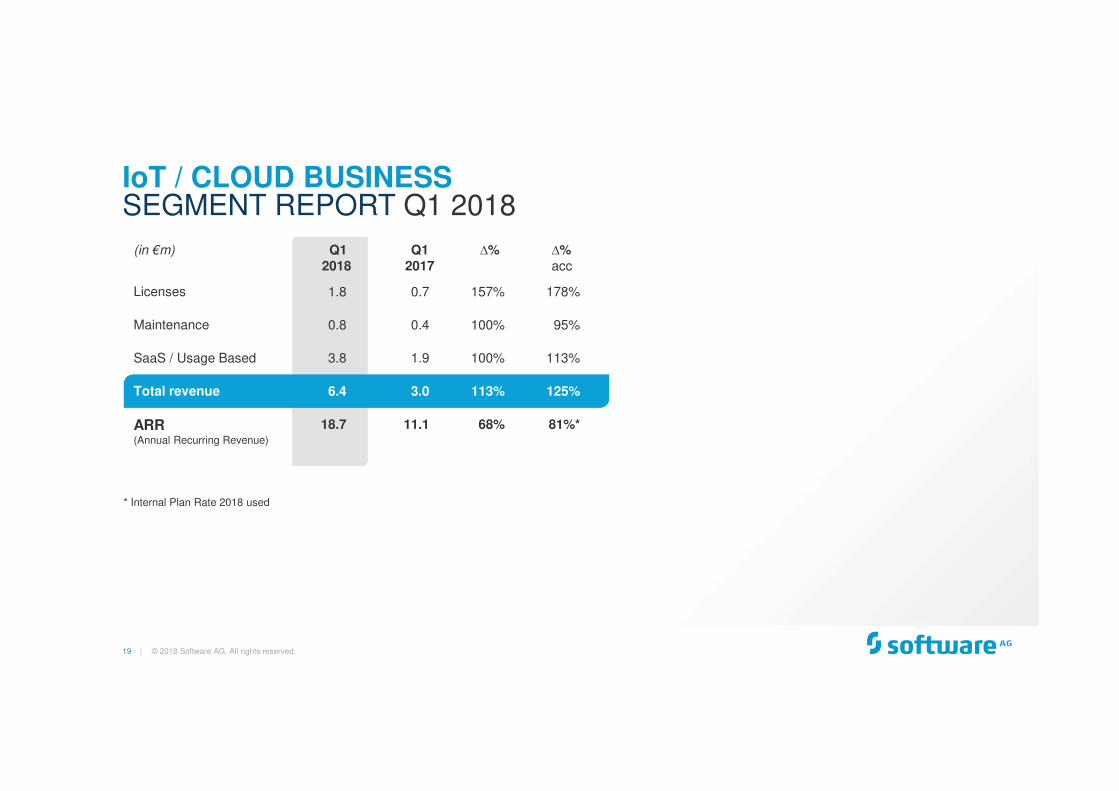
IoT / CLOUD BUSINESSSEGMENT REPORT Q1 2018
© 2018 Software AG. All rights reserved.
(in €m) Q1 2018
Q1 2017
∆% ∆%acc
Licenses 1.8 0.7 157% 178%
Maintenance 0.8 0.4 100% 95%
SaaS / Usage Based 3.8 1.9 100% 113%
Total revenue 6.4 3.0 113% 125%
ARR (Annual Recurring Revenue)
18.7 11.1 68% 81%*
* Internal Plan Rate 2018 used
20 |
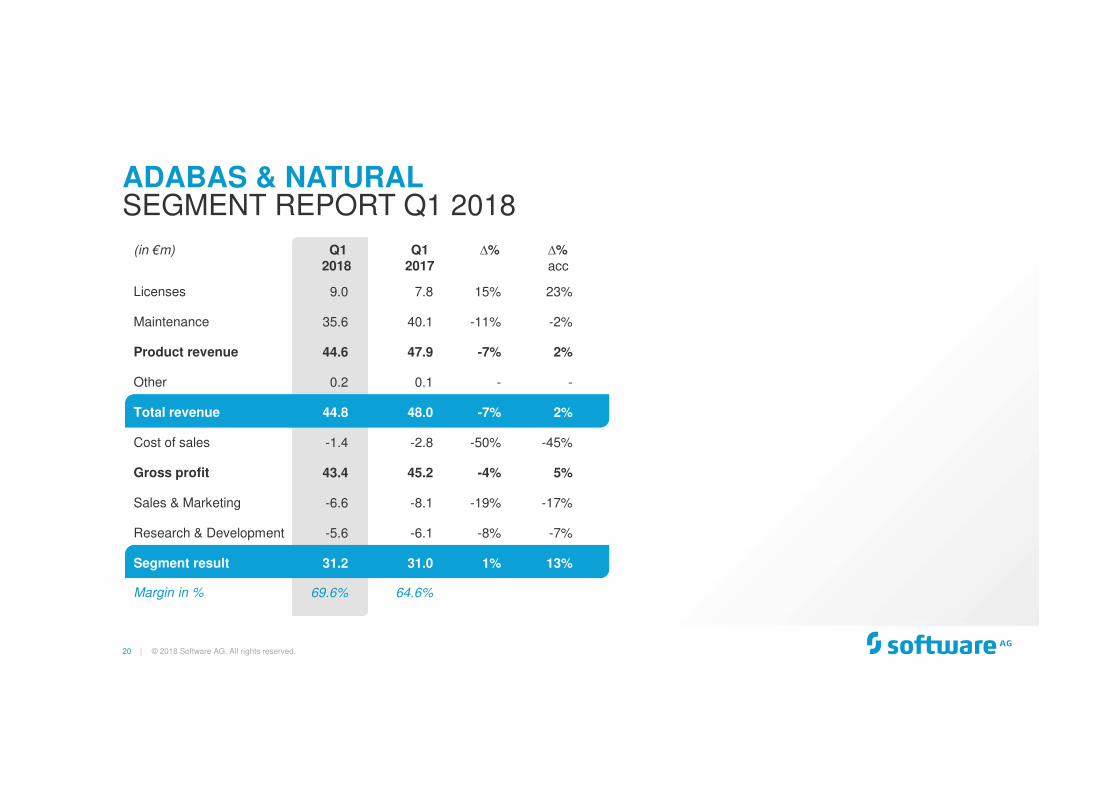
ADABAS & NATURAL
© 2018 Software AG. All rights reserved.
SEGMENT REPORT Q1 2018
(in €m) Q1 2018
Q1 2017
∆% ∆%acc
Licenses 9.0 7.8 15% 23%
Maintenance 35.6 40.1 -11% -2%
Product revenue 44.6 47.9 -7% 2%
Other 0.2 0.1 - -
Total revenue 44.8 48.0 -7% 2%
Cost of sales -1.4 -2.8 -50% -45%
Gross profit 43.4 45.2 -4% 5%
Sales & Marketing -6.6 -8.1 -19% -17%
Research & Development -5.6 -6.1 -8% -7%
Segment result 31.2 31.0 1% 13%
Margin in % 69.6% 64.6%

21 |
CONSULTING
© 2018 Software AG. All rights reserved.
SEGMENT REPORT Q1 2018
(in €m) Q1 2018
Q1 2017
∆% ∆%acc
Total revenue 46.1 52.1 -12% -8%
Cost of sales -37.5 -41.7 -10% -6%
Gross profit 8.6 10.4 -17% -14%
Sales & Marketing -4.4 -4.9 -10% -7%
Segment result 4.2 5.5 -24% -22%
Margin in % 9.1% 10.6%

22 |
RESULTS
© 2018 Software AG. All rights reserved.
Q1 2018
(in €m) Q1 2018
Q1 2017
∆% ∆%acc
Total revenue 186.6 205.9 -9% -2%
Cost of sales -49.5 -55.0 -10% -6%
Gross profit 137.1 150.9 -9% -1%
Margin in % 73.5% 73.3%
Research & Development -28.3 -29.8 -5% 0%
Sales & Marketing -52.0 -62.4 -17% -11%
Administration -17.1 -18.5 -8% -3%
Other income / expense 2.4 1.3 - -
EBIT 42.1 41.5 1% -
Margin in % 22.6% 20.2%

23 |
EARNINGS
© 2018 Software AG. All rights reserved.
Q1 2018
* Weighted average shares outstanding (basic) Q1 2018: 74.0m / Q1 2017: 75.9m
(in €m) Q12018
Q12017
∆%
EBIT (before all taxes) 42.1 41.5 1%
Financial result 1.3 -0.2 -
Profit before taxes 43.4 41.3 5%
Other taxes -1.8 -2.0 -10%
Income taxes -11.7 -12.0 -3%
Tax rate in % 31.1% 33.9%
Net income 29.9 27.3 10%
EPS in €* 0.40 0.36 11%
24 |
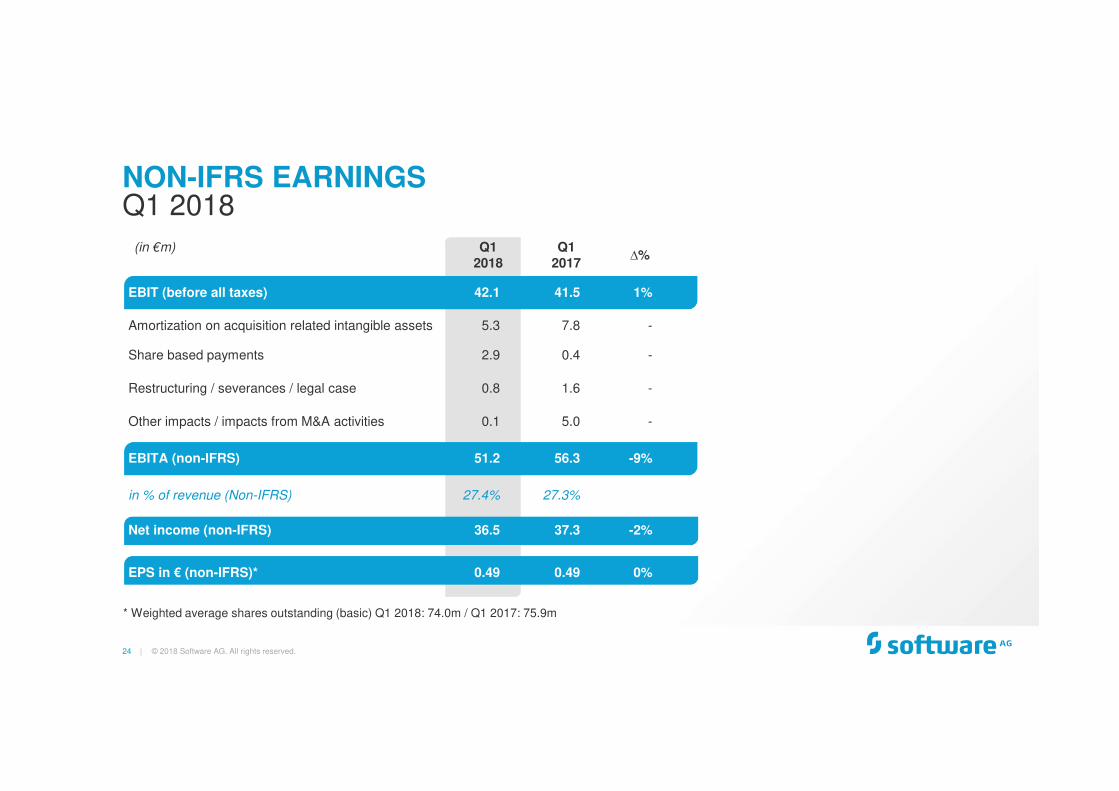
NON-IFRS EARNINGS
© 2018 Software AG. All rights reserved.
Q1 2018
* Weighted average shares outstanding (basic) Q1 2018: 74.0m / Q1 2017: 75.9m
(in €m) Q12018
Q12017
∆%
EBIT (before all taxes) 42.1 41.5 1%
Amortization on acquisition related intangible assets 5.3 7.8 -
Share based payments 2.9 0.4 -
Restructuring / severances / legal case 0.8 1.6 -
Other impacts / impacts from M&A activities 0.1 5.0 -
EBITA (non-IFRS) 51.2 56.3 -9%
in % of revenue (Non-IFRS) 27.4% 27.3%
Net income (non-IFRS) 36.5 37.3 -2%
EPS in € (non-IFRS)* 0.49 0.49 0%

25 |
CASH FLOW
© 2018 Software AG. All rights reserved.
Q1 2018
* Cash flow from investing activities except acquisitions and except investments in debt instruments** yoy change because of one time property investment at Darmstadt *** Based on weighted average shares outstanding (basic) Q1 2018: 74.0m / Q1 2017: 75.9m
(in €m) Q12018
Q12017
∆%
Operating cash flow 61.6 61.7 0%
./. CapEx* -1.5 -18.4
Free cash flow 60.1 43.3 39%
in % of revenue 32.2% 21.0%
Free cash flow per share*** 0.81 0.57 42%
**
26 |
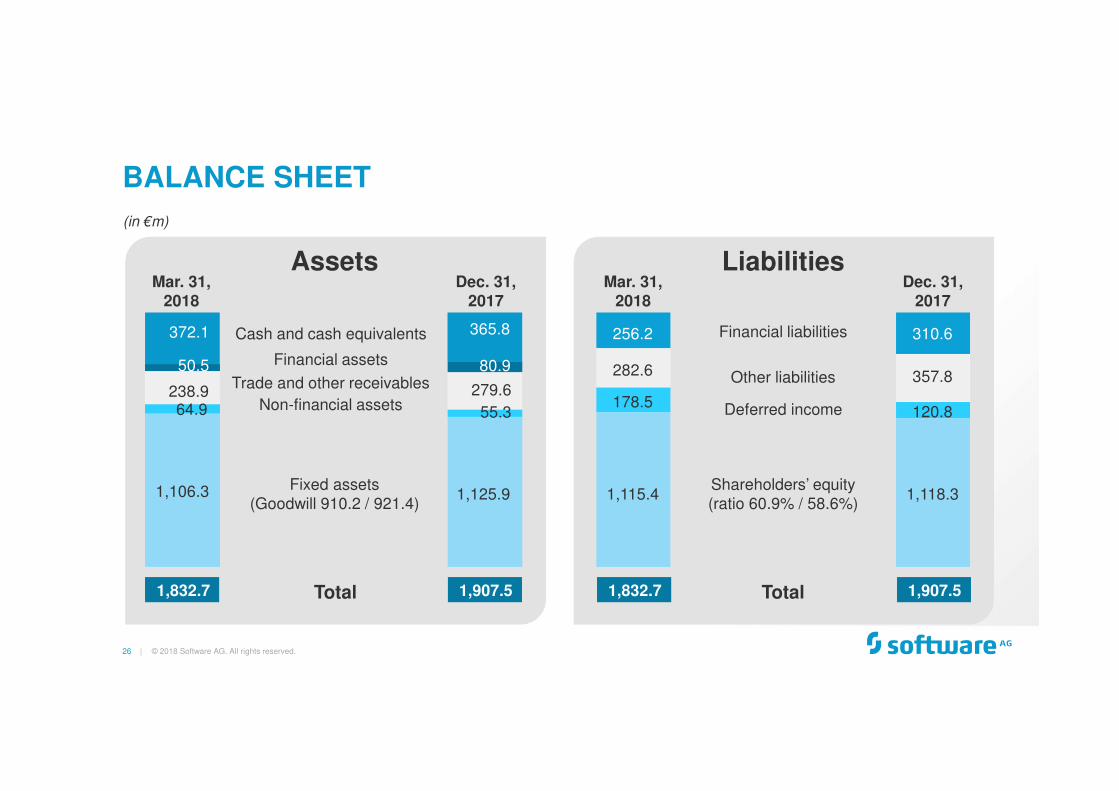
372.1
Mar. 31,2018
Mar. 31,2018
Assets Liabilities
BALANCE SHEET
© 2018 Software AG. All rights reserved.
(in €m)
Dec. 31,2017
Dec. 31,2017
365.8
279.6
55.3
1,125.9
1,907.5
Cash and cash equivalents
Financial assets
Trade and other receivables
Fixed assets(Goodwill 910.2 / 921.4)
Total
80.9
Non-financial assets
310.6
357.8
120.8
1,118.3
1,907.5
Financial liabilities
Other liabilities
Deferred income
Shareholders’ equity (ratio 60.9% / 58.6%)
Total
238.964.9
1,106.3
1,832.7
50.5
256.2
282.6
178.5
1,115.4
1,832.7

27 |
DBP Total Revenue
Adabas & Natural
Operating Margin Group(EBITA non-IFRS)2)
OUTLOOK
© 2018 Software AG. All rights reserved.
FULL YEAR 2018
1) At constant currency rates2) Adjusted for non-operating items (see non-IFRS earnings results)3) Weighted average shares outstanding (basic/IAS 33.19) FY 2017: 74.6m / FY 2018: 74.0m; based on new US-Federal-Tax and Euro/US-Dollar exchange rate of 1/1.18
- IoT / Cloud
- DBP excl. IoT / Cloud
EPS non-IFRS3)
FY 2018 Outlook (as of April 13, 2018)
30% to 32%
-6% to -2%1)
N/A
FY 2017(in €m)
223.7
456.4
31.8%
14.9 +100% to +135%1)
+3% to +7%1)441.5
+5% to +15%€2.38
January 25, 2018
Arnd Zinnhardt, CFO
RESULTS 4th QUARTER 2017(IFRS, UNAUDITED)
© 2018 Software AG. All rights reserved.
29 |
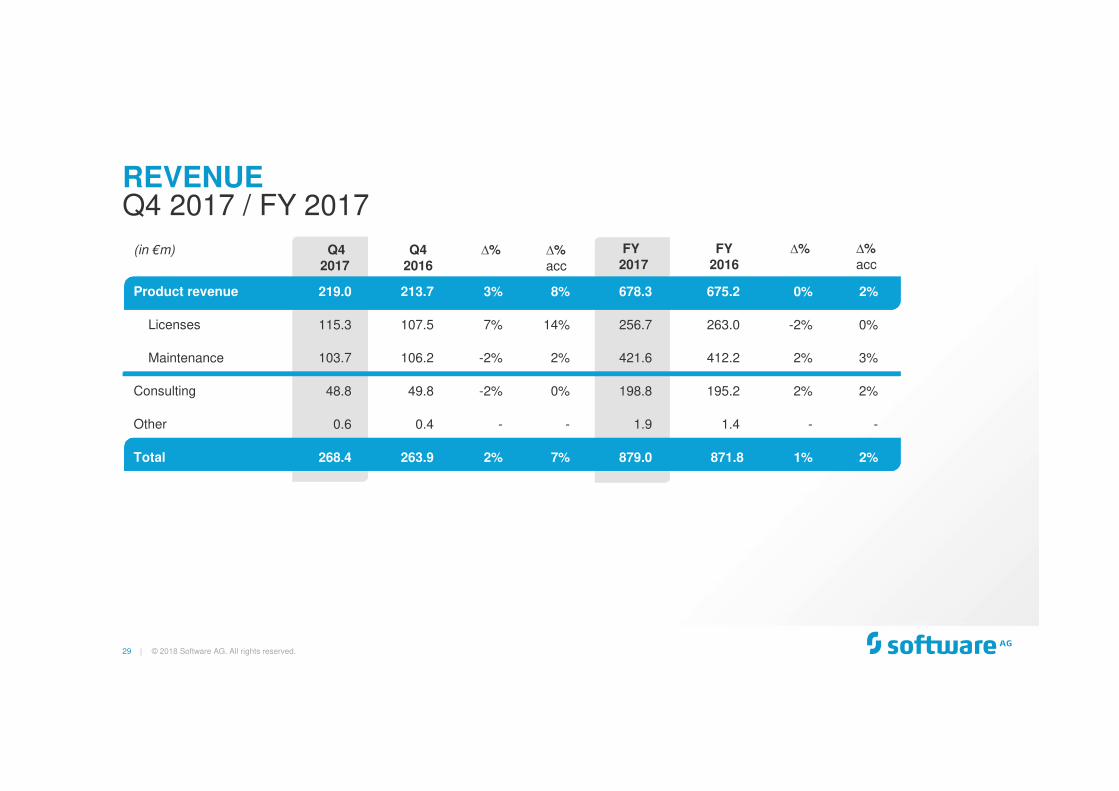
REVENUE
© 2018 Software AG. All rights reserved.
Q4 2017 / FY 2017
(in €m) Q4 2017
Q4 2016
∆% ∆%acc
FY2017
FY2016
∆% ∆%acc
Product revenue 219.0 213.7 3% 8% 678.3 675.2 0% 2%
Licenses 115.3 107.5 7% 14% 256.7 263.0 -2% 0%
Maintenance 103.7 106.2 -2% 2% 421.6 412.2 2% 3%
Consulting 48.8 49.8 -2% 0% 198.8 195.2 2% 2%
Other 0.6 0.4 - - 1.9 1.4 - -
Total 268.4 263.9 2% 7% 879.0 871.8 1% 2%
Segment result 6.2 7% 20.8

30 |
Euro34%
US Dollar31%
Other15%
CURRENCY IMPACT ON REVENUE
© 2018 Software AG. All rights reserved.
Q4 2017 / FY 2017
(in €m; yoy)
Q42017
Q4in %
FY2017
FYin %
Licenses -7.3 -6% -7.2 -3%
Maintenance -5.2 -5% -2.2 -1%
Consulting & Other -1.2 -2% -0.6 0%
Total -13.7 -5% -10.0 -1%
Currency impact on revenue
� 34% revenue in Euro
� 66% revenue in foreign currency
Currency split FY 2017
BRL 4%
ZAR 3%
AUD 3%
GBP 6%
ILS 4%

31 |
DIGITAL BUSINESS PLATFORMSEGMENT REPORT Q4 2017 / FY 2017
(in €m) Q4 2017
Q4 2016
∆% ∆%acc
FY 2017
FY2016
∆% ∆%acc
Licenses 77.8 78.1 0% 6% 186.9 186.3 0% 3%
Maintenance 66.9 66.3 1% 6% 268.5 255.1 5% 6%
Total revenue 144.7 144.4 0% 6% 455.4 441.4 3% 5%
Cost of sales -12.0 -9.2 30% 34% -33.3 -31.3 6% 8%
Gross profit 132.7 135.2 -2% 4% 422.1 410.1 3% 5%
Sales & Marketing -49.6 -52.1 -5% 0% -174.3 -172.4 1% 2%
Research & Development -25.7 -23.7 8% 9% -96.9 -89.9 8% 6%
Segment result 57.4 59.4 -3% 5% 150.9 147.8 2% 7%
Margin in % 39.7% 41.1% 33.1% 33.5%
© 2018 Software AG. All rights reserved.
32 |
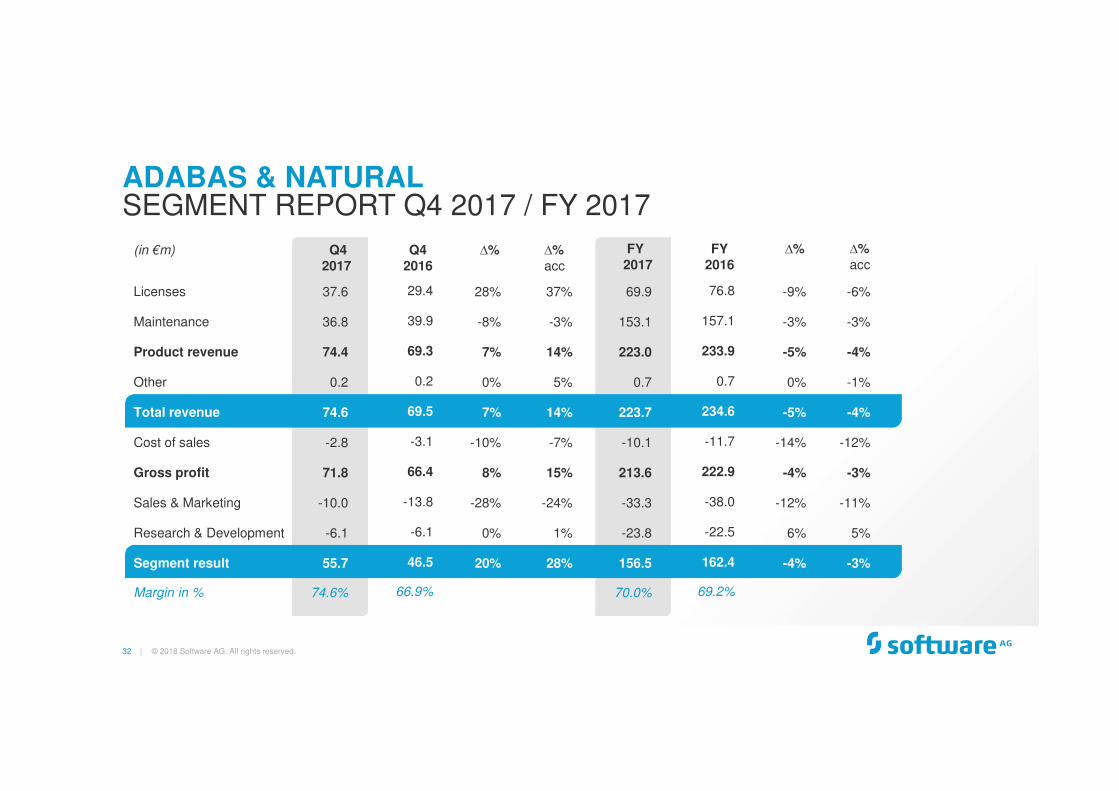
ADABAS & NATURAL
© 2018 Software AG. All rights reserved.
SEGMENT REPORT Q4 2017 / FY 2017
(in €m) Q4 2017
Q4 2016
∆% ∆%acc
FY2017
FY2016
∆% ∆%acc
Licenses 37.6 29.4 28% 37% 69.9 76.8 -9% -6%
Maintenance 36.8 39.9 -8% -3% 153.1 157.1 -3% -3%
Product revenue 74.4 69.3 7% 14% 223.0 233.9 -5% -4%
Other 0.2 0.2 0% 5% 0.7 0.7 0% -1%
Total revenue 74.6 69.5 7% 14% 223.7 234.6 -5% -4%
Cost of sales -2.8 -3.1 -10% -7% -10.1 -11.7 -14% -12%
Gross profit 71.8 66.4 8% 15% 213.6 222.9 -4% -3%
Sales & Marketing -10.0 -13.8 -28% -24% -33.3 -38.0 -12% -11%
Research & Development -6.1 -6.1 0% 1% -23.8 -22.5 6% 5%
Segment result 55.7 46.5 20% 28% 156.5 162.4 -4% -3%
Margin in % 74.6% 66.9% 70.0% 69.2%

33 |
CONSULTING
© 2018 Software AG. All rights reserved.
SEGMENT REPORT Q4 2017 / FY 2017
(in €m) Q4 2017
Q4 2016
∆% ∆%acc
FY2017
FY2016
∆% ∆%acc
Total revenue 49.2 50.0 -2% 1% 199.9 195.9 2% 2%
Cost of sales -40.2 -39.0 3% 5% -156.9 -157.5 0% 0%
Gross profit 9.0 11.0 -18% -15% 43.0 38.4 12% 14%
Sales & Marketing -4.9 -4.8 2% 6% -19.1 -17.6 9% 10%
Segment result 4.1 6.2 -34% -31% 23.9 20.8 15% 17%
Margin in % 8.3% 12.4% 11.9% 10.6%
34 |
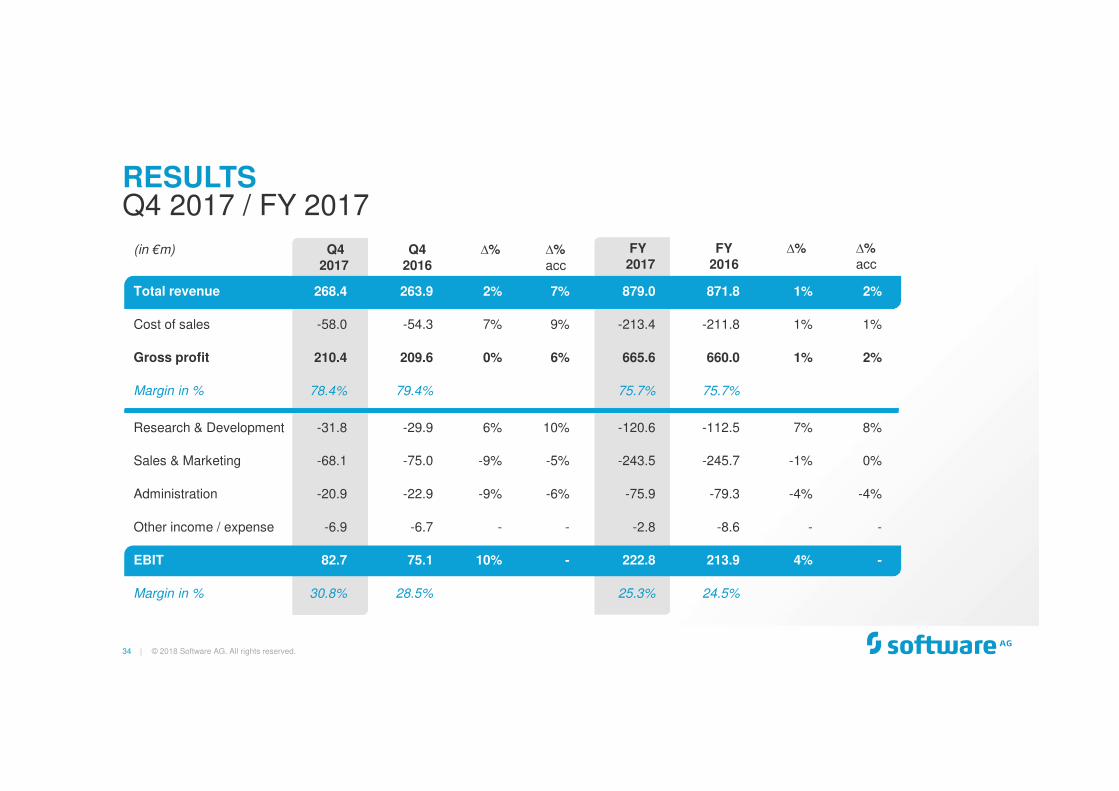
RESULTS
© 2018 Software AG. All rights reserved.
Q4 2017 / FY 2017
(in €m) Q4 2017
Q4 2016
∆% ∆%acc
FY 2017
FY2016
∆% ∆%acc
Total revenue 268.4 263.9 2% 7% 879.0 871.8 1% 2%
Cost of sales -58.0 -54.3 7% 9% -213.4 -211.8 1% 1%
Gross profit 210.4 209.6 0% 6% 665.6 660.0 1% 2%
Margin in % 78.4% 79.4% 75.7% 75.7%
Research & Development -31.8 -29.9 6% 10% -120.6 -112.5 7% 8%
Sales & Marketing -68.1 -75.0 -9% -5% -243.5 -245.7 -1% 0%
Administration -20.9 -22.9 -9% -6% -75.9 -79.3 -4% -4%
Other income / expense -6.9 -6.7 - - -2.8 -8.6 - -
EBIT 82.7 75.1 10% - 222.8 213.9 4% -
Margin in % 30.8% 28.5% 25.3% 24.5%
35 |
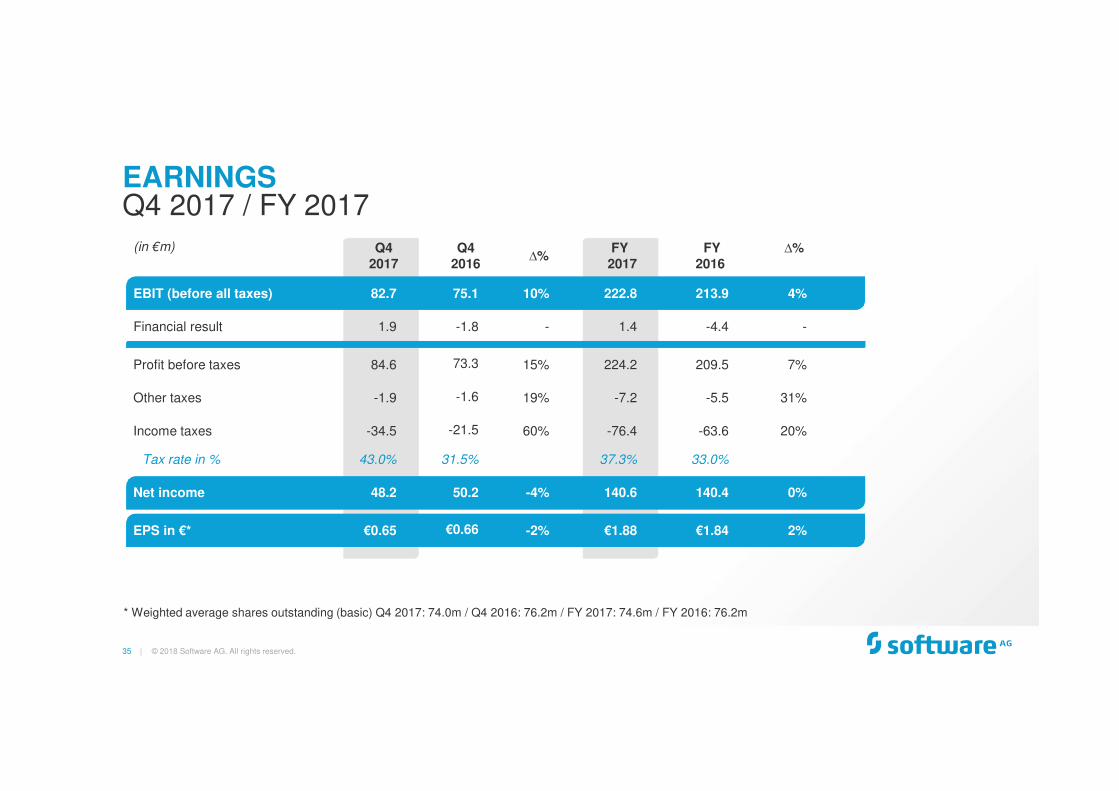
EARNINGS
© 2018 Software AG. All rights reserved.
Q4 2017 / FY 2017
* Weighted average shares outstanding (basic) Q4 2017: 74.0m / Q4 2016: 76.2m / FY 2017: 74.6m / FY 2016: 76.2m
(in €m) Q42017
Q42016
∆%FY2017
FY2016
∆%
EBIT (before all taxes) 82.7 75.1 10% 222.8 213.9 4%
Financial result 1.9 -1.8 - 1.4 -4.4 -
Profit before taxes 84.6 73.3 15% 224.2 209.5 7%
Other taxes -1.9 -1.6 19% -7.2 -5.5 31%
Income taxes -34.5 -21.5 60% -76.4 -63.6 20%
Tax rate in % 43.0% 31.5% 37.3% 33.0%
Net income 48.2 50.2 -4% 140.6 140.4 0%
EPS in €* €0.65 €0.66 -2% €1.88 €1.84 2%

36 |
NON-IFRS EARNINGS
© 2018 Software AG. All rights reserved.
Q4 2017 / FY 2017
* Weighted average shares outstanding (basic) Q4 2017: 74.0m / Q4 2016: 76.2m / FY 2017: 74.6m / FY 2016: 76.2m
(in €m) Q42017
Q42016
∆%FY2017
FY2016
∆%
EBIT (before all taxes) 82.7 75.1 10% 222.8 213.9 4%
Amortization on acquisition related intangible assets 6.6 7.3 -8% 29.6 29.1 2%
Share based payments 6.1 3.2 91% 20.7 14.2 46%
Restructuring / severances / legal case 2.0 2.9 -7% 4.7 11.8 -54%
Other impacts / impacts from M&A activities 1.0 1.7 -41% 1.7 3.0 -67%
EBITA (non-IFRS) 98.4 90.2 9% 279.5 272.0 3%
in % of revenue (Non-IFRS) 36.7% 34.2% 31.8% 31.2%
Net income (non-IFRS) 56.7 61.1 -7% 177.3 180.4 -2%
EPS in € (non-IFRS)* €0.77 €0.80 -4% €2.38 €2.37 0%
37 |
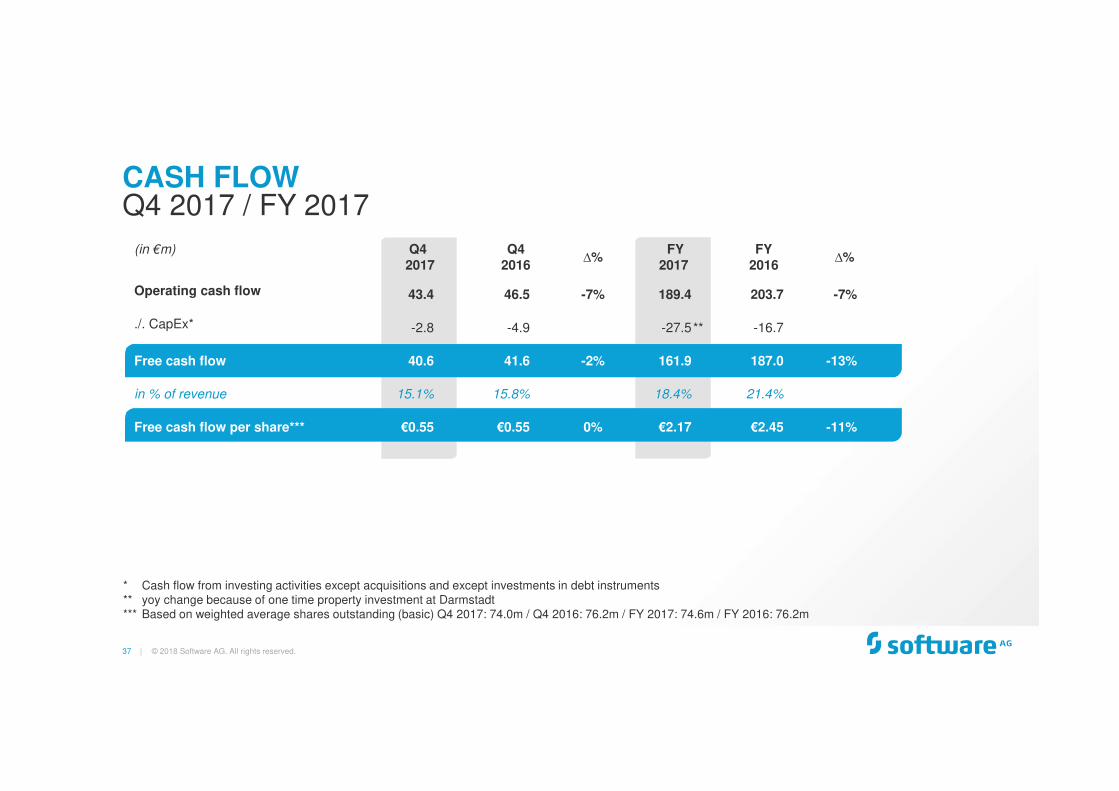
CASH FLOW
© 2018 Software AG. All rights reserved.
Q4 2017 / FY 2017
* Cash flow from investing activities except acquisitions and except investments in debt instruments** yoy change because of one time property investment at Darmstadt *** Based on weighted average shares outstanding (basic) Q4 2017: 74.0m / Q4 2016: 76.2m / FY 2017: 74.6m / FY 2016: 76.2m
**
(in €m) Q42017
Q42016
∆%FY
2017FY
2016∆%
Operating cash flow 43.4 46.5 -7% 189.4 203.7 -7%
./. CapEx* -2.8 -4.9 -27.5 -16.7
Free cash flow 40.6 41.6 -2% 161.9 187.0 -13%
in % of revenue 15.1% 15.8% 18.4% 21.4%
Free cash flow per share*** €0.55 €0.55 0% €2.17 €2.45 -11%
38 |
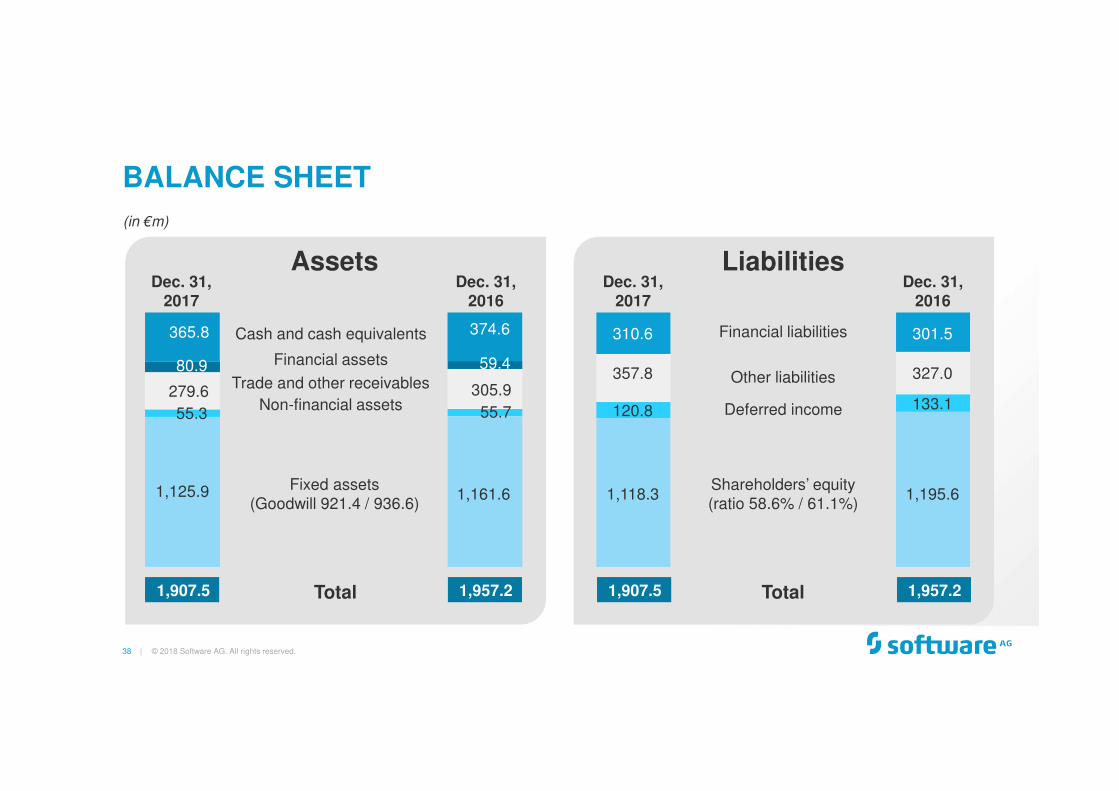
365.8
Dec. 31,2017
Dec. 31,2017
Assets Liabilities
BALANCE SHEET
© 2018 Software AG. All rights reserved.
(in €m)
Dec. 31,2016
Dec. 31,2016
374.6
305.9
55.7
1,161.6
1,957.2
Cash and cash equivalents
Financial assets
Trade and other receivables
Fixed assets(Goodwill 921.4 / 936.6)
Total
59.4
Non-financial assets
301.5
327.0
133.1
1,195.6
1,957.2
Financial liabilities
Other liabilities
Deferred income
Shareholders’ equity (ratio 58.6% / 61.1%)
Total
279.6
55.3
1,125.9
1,907.5
80.9
310.6
357.8
120.8
1,118.3
1,907.5

39 |
SHAREHOLDER STRUCTURE
© 2018 Software AG. All rights reserved.
33.3%61.7%
Software AGFoundation
Own Shares(0.03%)
InstitutionalInvestors
Private Investors
according to notification of voting rights above 3% threshold of shares outstandingNumber of total shares: 74,000,000
Thereof Free Float: ~ 66%
Number of shares outstanding: ~ 74m
Registered shares since Oct. 2, 2017
Share Data Major Institutional ShareholdersShare Info
SOW, SOW:GR, SOWGn.DE
ISIN: DE000A2GS401
ADR symbol: STWRY
Indices: TecDAX, DAX100, TechAllShare
Deutsche Asset Mgt. Investment 4.91% 20.10.2017
Axxion S.A. 3.30% 13.03.2018
OWNERSHIP REGIONAL SPLIT*
32.4%
21.4%
28.2%
17.5%
Germany
North America
Continental Europe(excl. Germany)
UK & Ireland
Rest of World
*institutional investors based on public files, May 2018

40 |
CASH USE:
© 2018 Software AG. All rights reserved.
SHARE BUY-BACK
Buy-back own shares 2013 - 2014
Cancellation of treasury shares
April 30, 2015
Buy-back own shares 2015
Sept. 8 -Dec. 4, 2015
Until cancellation/cap. reduction:
Share capital: 86,943,945.00 €
Number of shares: 86,943,945
€ 225m9.2%
€ 70m3.4%
- 9.1%
-3.29%
Until cancellation/cap. reduction:
Share capital: 79,000,000.00 €
Number of shares: 79,000,000
Cancellation of treasury sharesMarch 14, 2017
Since cancellation/cap. reduction:
Share capital: 76,400,000.00 €
Number of shares: 76,400,000
Own sharesSince March 27, 2018
Buy-back own shares 2017
March 13 -May 11, 2017
€ 89m3.266%
0.03%
Cancellation oftreasury sharesMarch 27, 2018
-3.14%
Since cancellation/cap. reduction:
Share capital: 74,000,000.00 €
Number of shares: 74,000,000

41 |
CASH RETURN TO SHAREHOLDERS
© 2018 Software AG. All rights reserved.
Ø ¾ FREE CASH FLOW TURNS INTO DIVIDENDS AND SBB
0
50
100
150
200
250
2012 2013 2013 2014 2014 2015 2015 2016 2016 2017 2017 2018*
Free Cash Flow
Share Buy-Back +Dividends
* Dividend recommendation, subject to the agreement at the Annual General Meeting in May 2018
€m
42 | © 2018 Software AG. All rights reserved.
APPENDIX

43 |
ARR – IOT / CLOUD DEVELOPMENT (NET OF CURRENCY*)
STATUS Q1 2018
13%6%
20%
27%
0
5
10
15
20
Q1 2017 Q2 2017 Q3 2017 Q4 2017 Q1 2018
Subscription License
Maintenance
SaaS
TOTAL ARR
∆ Prior Quarter
© 2018 Software AG. All rights reserved.
*Internal Plan Rate 2018 used

44 |
HEADCOUNT
© 2018 Software AG. All rights reserved.
BY FUNCTIONAL AREAS* AND GEOGRAPHY
* According to P+L structure
(in FTE) Mar. 31,2018
Dec. 31,2017
∆% Mar. 31,2017
∆% yoy
Total 4,610 4,596 0% 4,486 3%
Consulting & Services 1,938 1,935 0% 1,891 2%
Research & Development 1,197 1,176 2% 1,122 7%
Sales & Marketing 868 862 1% 863 1%
Administration 607 623 -3% 610 0%
Germany 1,210 1,201 1% 1,141 6%
USA 575 575 - 599 -4%
India 813 823 -1% 764 6%
Rest of world 2,012 1,997 1% 1,982 2%
45 |
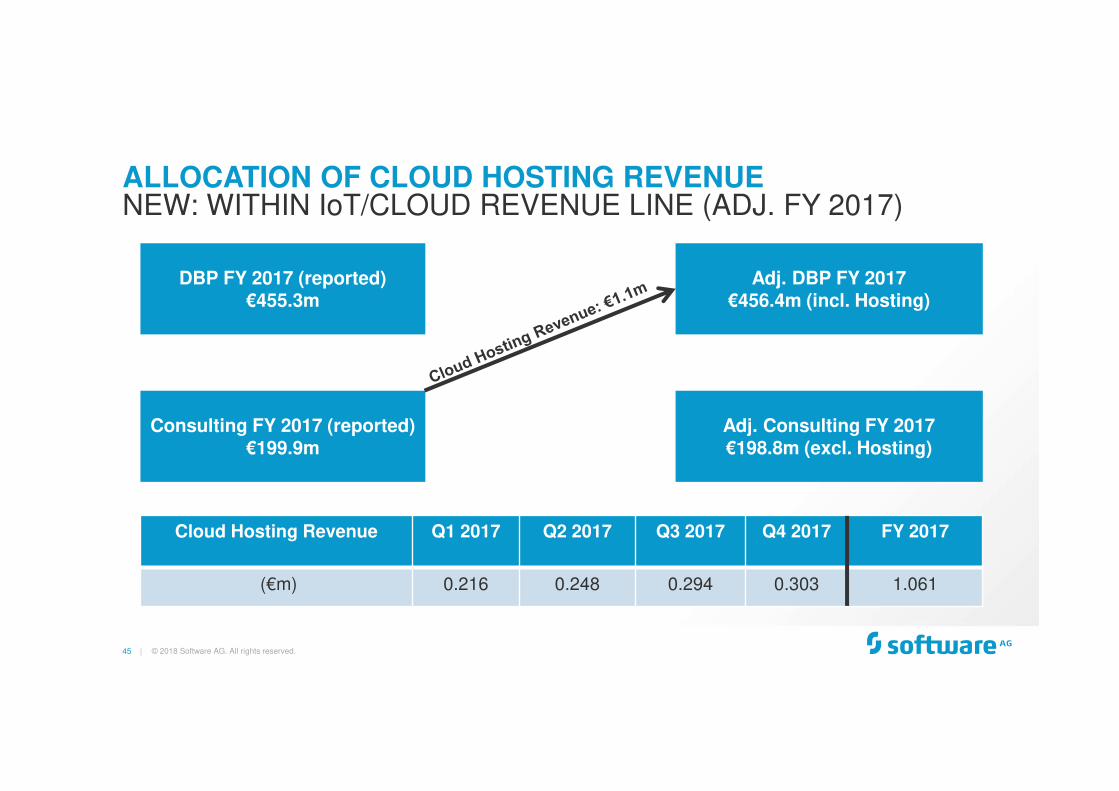
ALLOCATION OF CLOUD HOSTING REVENUE
© 2018 Software AG. All rights reserved.
NEW: WITHIN IoT/CLOUD REVENUE LINE (ADJ. FY 2017)
DBP FY 2017 (reported)€455.3m
Consulting FY 2017 (reported)€199.9m
Adj. DBP FY 2017 €456.4m (incl. Hosting)
Adj. Consulting FY 2017€198.8m (excl. Hosting)
Cloud Hosting Revenue Q1 2017 Q2 2017 Q3 2017 Q4 2017 FY 2017
(€m) 0.216 0.248 0.294 0.303 1.061
46 |
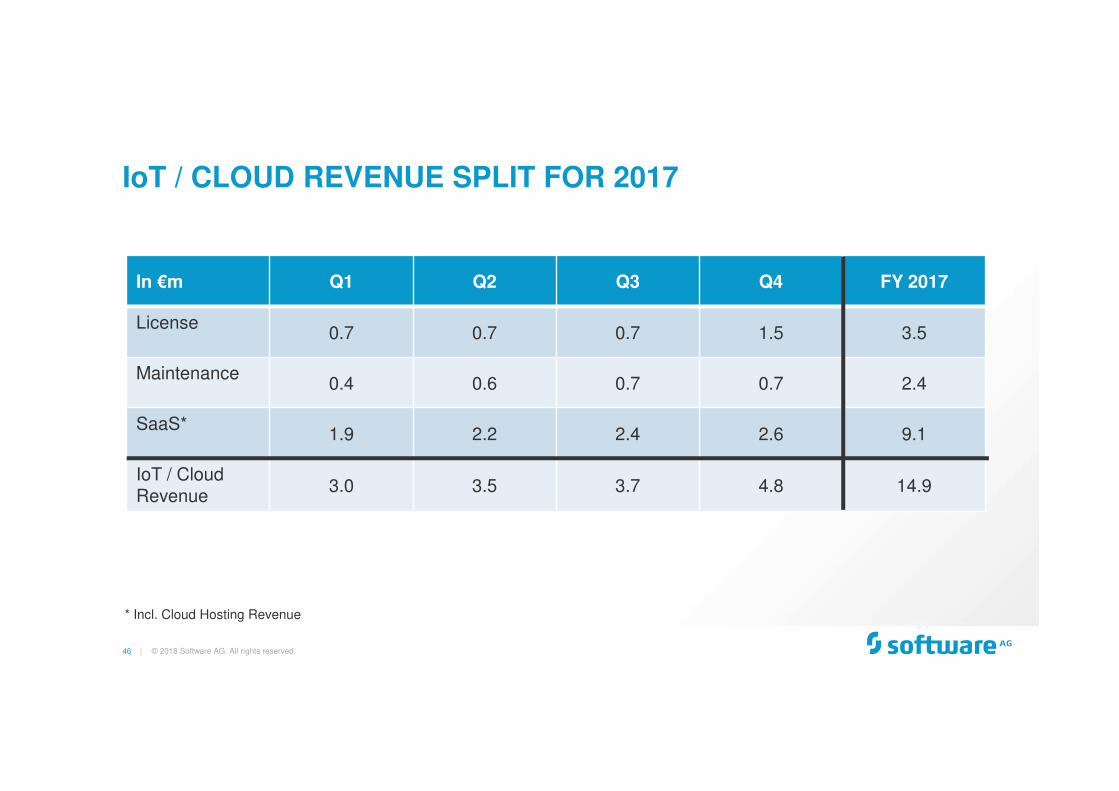
IoT / CLOUD REVENUE SPLIT FOR 2017
© 2018 Software AG. All rights reserved.
In €m Q1 Q2 Q3 Q4 FY 2017
License0.7 0.7 0.7 1.5 3.5
Maintenance0.4 0.6 0.7 0.7 2.4
SaaS*1.9 2.2 2.4 2.6 9.1
IoT / Cloud Revenue
3.0 3.5 3.7 4.8 14.9
* Incl. Cloud Hosting Revenue
47 |
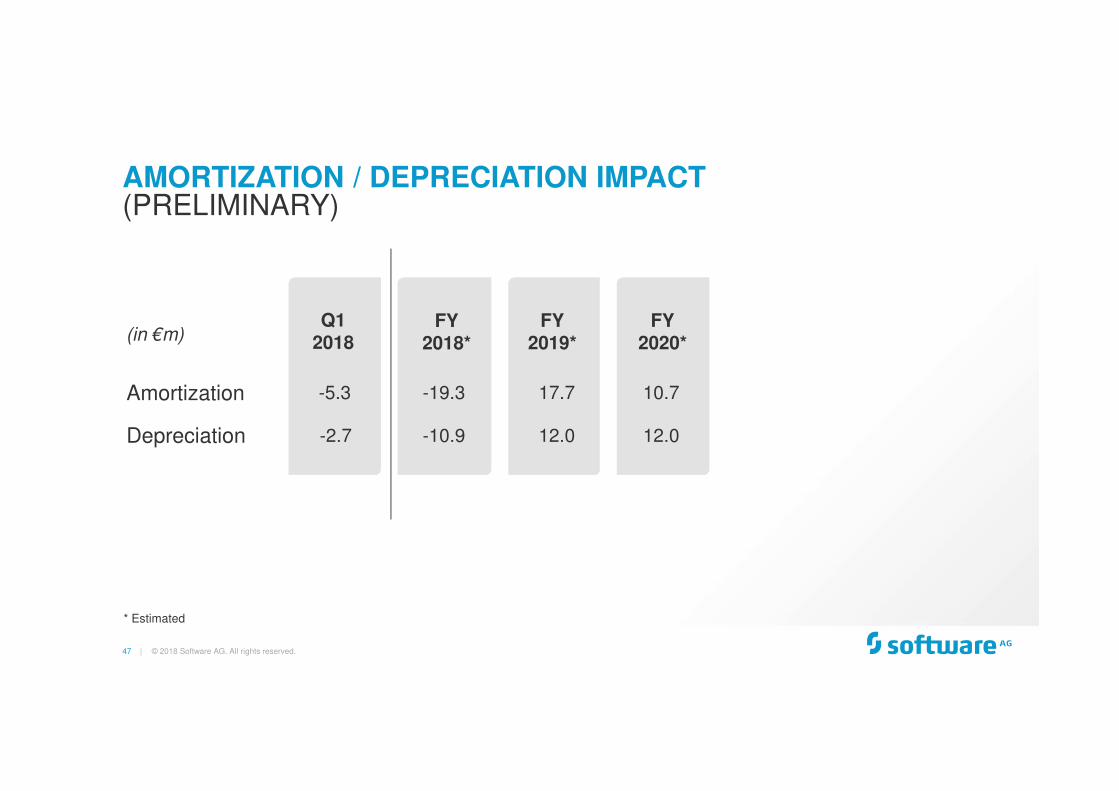
Amortization
(in €m)
Depreciation
* Estimated
AMORTIZATION / DEPRECIATION IMPACT
© 2018 Software AG. All rights reserved.
(PRELIMINARY)
FY2018*
FY2019*
FY2020*
Q12018
-5.3
-2.7
-19.3
-10.9
17.7
12.0
10.7
12.0

48 |
Investor RelationsUhlandstrasse 1264297 DarmstadtGermany
T: +49 (0) 6151 / 92 1900F: +49 (0) 6151 / 9234 1900 W: softwareag.comE: [email protected]
© 2018 Software AG. All rights reserved.
49 | © 2018 Software AG. All rights reserved.


