28
User Manual Data Logging Software JOFRA IPILOG
User ManualData Logging Software
JOFRA IPILOG
IPILOGData Logging User’s Manual
1. Introduction . . . . . . . . . . . . . . . . . . . . . . . . . . . . . . . . . . .1
2. Description . . . . . . . . . . . . . . . . . . . . . . . . . . . . . . . . . . . .1
3. Gauge Operation . . . . . . . . . . . . . . . . . . . . . . . . . . . . . . . .53.1 Data Logging Disabled . . . . . . . . . . . . . . . . . . . . . . . . . . . .53.2 Download Mode . . . . . . . . . . . . . . . . . . . . . . . . . . . . . . . . .53.3 Demand Mode . . . . . . . . . . . . . . . . . . . . . . . . . . . . . . . . . .7
4. IPILOG Microsoft Windows Application . . . . . . . . . . . . . .94.1 Installation . . . . . . . . . . . . . . . . . . . . . . . . . . . . . . . . . . . . .104.2 Menus . . . . . . . . . . . . . . . . . . . . . . . . . . . . . . . . . . . . . . . .104.3 Main Display . . . . . . . . . . . . . . . . . . . . . . . . . . . . . . . . . . .124.4 Log Upload Display . . . . . . . . . . . . . . . . . . . . . . . . . . . . . .164.5 Display Options . . . . . . . . . . . . . . . . . . . . . . . . . . . . . . . . .174.6 Export Options . . . . . . . . . . . . . . . . . . . . . . . . . . . . . . . . .18
5. Excel Templates . . . . . . . . . . . . . . . . . . . . . . . . . . . . . . .215.1 Single Run Graph . . . . . . . . . . . . . . . . . . . . . . . . . . . . . . .225.2 Single Run Pressure and Tempeature Graph . . . . . . . . . . .22
6. Warranty . . . . . . . . . . . . . . . . . . . . . . . . . . . . . . . . . . . . .23TRADEMARKS . . . . . . . . . . . . . . . . . . . . . . . . . . . . . . . . . . . . .24
2012-09-06 SPK-IPI-005 00
1. IntroductionThis Manual describes the data logging capability and operation of thepressure gauge, plus the operation of the related IPILOG MicrosoftWindows application. All IPI Mk.II gauges with firmware with revision4.01 or higher are capable of data logging when used with the IPILOGsoftware. This manual complements and extends the user manualreceived with the pressure gauge. Please refer to the gauge manual foradditional information on its operation.
The IPILOG application is used to configure logging parameters in thegauge, and to retrieve logged data from the gauge for storage andanalysis on a personal computer. Before you start check to make sureyour data logging kit came with the following items:
1) IPILOG CD
2) RS-232 Cable with stereo style jack (this end plugs into the gauge)
3) RS-232 to USB adapter (with mini-CD) for newer computers thatonly have USB ports. Refer to the instructions packaged with theUSB adapter to load the driver and operate the adapter.
4) Users manual
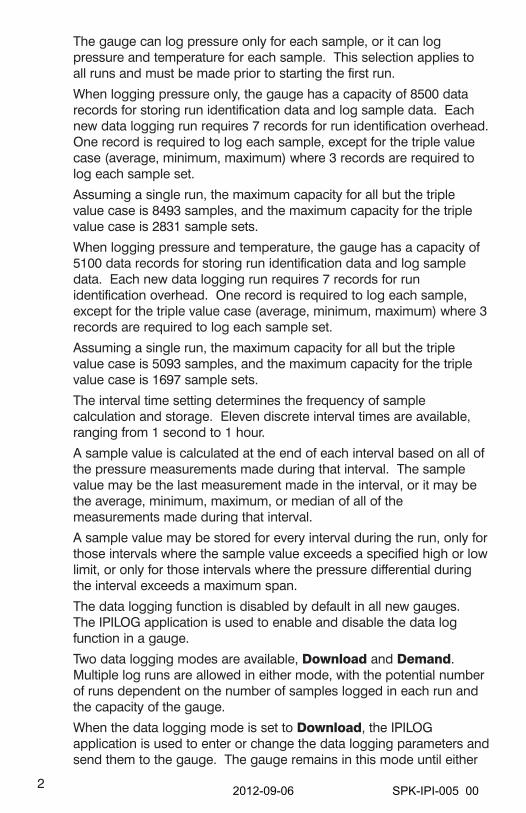
Refer to figure 1 to see how to connect the RS-232 cable to the Gauge.
Figure 1
2. DescriptionThe gauge can log multiple sets of data, each of which is identified bya sequential run number. Data logging runs are started and stoppedusing new items inserted into the gauge's CONFIG menu sequence.Logging parameters can be changed from one data logging run to thenext, and data logging runs may be as short as a single sample or aslong as desired subject to the maximum storage capacity of the gauge.
1SPK-IPI-005 00 2012-09-06
The gauge can log pressure only for each sample, or it can logpressure and temperature for each sample. This selection applies toall runs and must be made prior to starting the first run.
When logging pressure only, the gauge has a capacity of 8500 datarecords for storing run identification data and log sample data. Eachnew data logging run requires 7 records for run identification overhead.One record is required to log each sample, except for the triple valuecase (average, minimum, maximum) where 3 records are required tolog each sample set.
Assuming a single run, the maximum capacity for all but the triplevalue case is 8493 samples, and the maximum capacity for the triplevalue case is 2831 sample sets.
When logging pressure and temperature, the gauge has a capacity of5100 data records for storing run identification data and log sampledata. Each new data logging run requires 7 records for runidentification overhead. One record is required to log each sample,except for the triple value case (average, minimum, maximum) where 3records are required to log each sample set.
Assuming a single run, the maximum capacity for all but the triplevalue case is 5093 samples, and the maximum capacity for the triplevalue case is 1697 sample sets.
The interval time setting determines the frequency of samplecalculation and storage. Eleven discrete interval times are available,ranging from 1 second to 1 hour.
A sample value is calculated at the end of each interval based on all ofthe pressure measurements made during that interval. The samplevalue may be the last measurement made in the interval, or it may bethe average, minimum, maximum, or median of all of themeasurements made during that interval.
A sample value may be stored for every interval during the run, only forthose intervals where the sample value exceeds a specified high or lowlimit, or only for those intervals where the pressure differential duringthe interval exceeds a maximum span.
The data logging function is disabled by default in all new gauges.The IPILOG application is used to enable and disable the data logfunction in a gauge.
Two data logging modes are available, Download and Demand.Multiple log runs are allowed in either mode, with the potential numberof runs dependent on the number of samples logged in each run andthe capacity of the gauge.
When the data logging mode is set to Download, the IPILOGapplication is used to enter or change the data logging parameters andsend them to the gauge. The gauge remains in this mode until either
2 2012-09-06 SPK-IPI-005 00
the IPILOG application or the gauge 'CLEAr DATA' function is usedclear the logged data in the gauge, at which time the mode is set toDemand. In Download mode none of the parameters may be changedusing the gauge menus and the downloaded values are always usedfor each new log run. The IPILOG application may be used to changethe logging parameters between runs without affecting previouslylogged data stored in memory. The Download mode data loggingparameters are:
• Interval time selection:
- 1, 2, 5, 10, 30 seconds
- 1, 2, 5, 10, 30 minutes
- 1 hour
• Maximum number of samples to store per run. This may range from1 to the full capacity of the gauge.
• Log type selection:
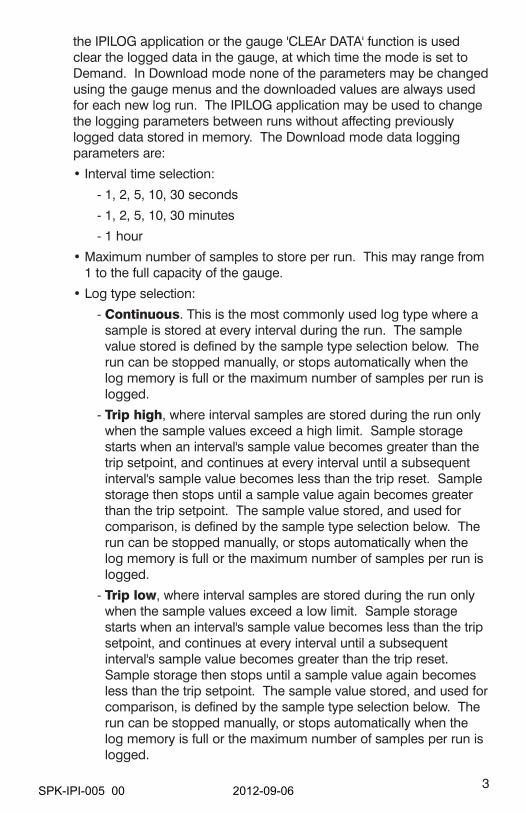
- Continuous. This is the most commonly used log type where asample is stored at every interval during the run. The samplevalue stored is defined by the sample type selection below. Therun can be stopped manually, or stops automatically when thelog memory is full or the maximum number of samples per run islogged.
- Trip high, where interval samples are stored during the run onlywhen the sample values exceed a high limit. Sample storagestarts when an interval's sample value becomes greater than thetrip setpoint, and continues at every interval until a subsequentinterval's sample value becomes less than the trip reset. Samplestorage then stops until a sample value again becomes greaterthan the trip setpoint. The sample value stored, and used forcomparison, is defined by the sample type selection below. Therun can be stopped manually, or stops automatically when thelog memory is full or the maximum number of samples per run islogged.
- Trip low, where interval samples are stored during the run onlywhen the sample values exceed a low limit. Sample storagestarts when an interval's sample value becomes less than the tripsetpoint, and continues at every interval until a subsequentinterval's sample value becomes greater than the trip reset.Sample storage then stops until a sample value again becomesless than the trip setpoint. The sample value stored, and used forcomparison, is defined by the sample type selection below. Therun can be stopped manually, or stops automatically when thelog memory is full or the maximum number of samples per run islogged.
3SPK-IPI-005 00 2012-09-06
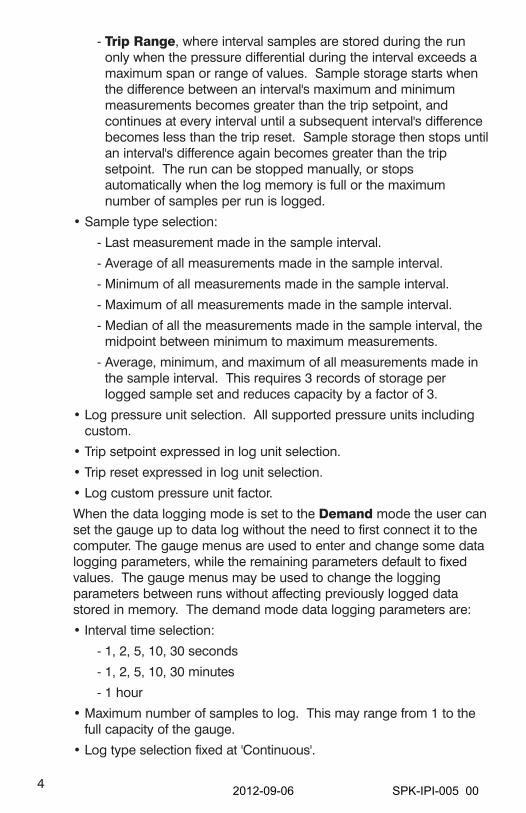
- Trip Range, where interval samples are stored during the runonly when the pressure differential during the interval exceeds amaximum span or range of values. Sample storage starts whenthe difference between an interval's maximum and minimummeasurements becomes greater than the trip setpoint, andcontinues at every interval until a subsequent interval's differencebecomes less than the trip reset. Sample storage then stops untilan interval's difference again becomes greater than the tripsetpoint. The run can be stopped manually, or stopsautomatically when the log memory is full or the maximumnumber of samples per run is logged.
• Sample type selection:
- Last measurement made in the sample interval.
- Average of all measurements made in the sample interval.
- Minimum of all measurements made in the sample interval.
- Maximum of all measurements made in the sample interval.
- Median of all the measurements made in the sample interval, themidpoint between minimum to maximum measurements.
- Average, minimum, and maximum of all measurements made inthe sample interval. This requires 3 records of storage perlogged sample set and reduces capacity by a factor of 3.
• Log pressure unit selection. All supported pressure units includingcustom.
• Trip setpoint expressed in log unit selection.
• Trip reset expressed in log unit selection.
• Log custom pressure unit factor.
When the data logging mode is set to the Demand mode the user canset the gauge up to data log without the need to first connect it to thecomputer. The gauge menus are used to enter and change some datalogging parameters, while the remaining parameters default to fixedvalues. The gauge menus may be used to change the loggingparameters between runs without affecting previously logged datastored in memory. The demand mode data logging parameters are:
• Interval time selection:
- 1, 2, 5, 10, 30 seconds
- 1, 2, 5, 10, 30 minutes
- 1 hour
• Maximum number of samples to log. This may range from 1 to thefull capacity of the gauge.
• Log type selection fixed at 'Continuous'.
4 2012-09-06 SPK-IPI-005 00
• Sample type selection fixed at 'Last measurement made in thesample interval'.
• Log pressure unit selection. The unit is selected with the existingconfiguration function before the log run is started.
• Trip setpoint not used.
• Trip reset not used.
• Log custom pressure unit factor. The factor is selected with theexisting configuration function before the log run is started
The gauge does not have real time clock capability, so the time stampon all samples in a run is elapsed days, hours, minutes and secondsfrom run start. The IPILOG application provides a feature for relatingeach uploaded run start point to a real time base date and time. Whenthis feature is used, all uploaded elapsed time stamps in the run arerecalculated accordingly to get true time stamps of the form year,month, day, hour, minute, second.
3. Gauge Operation
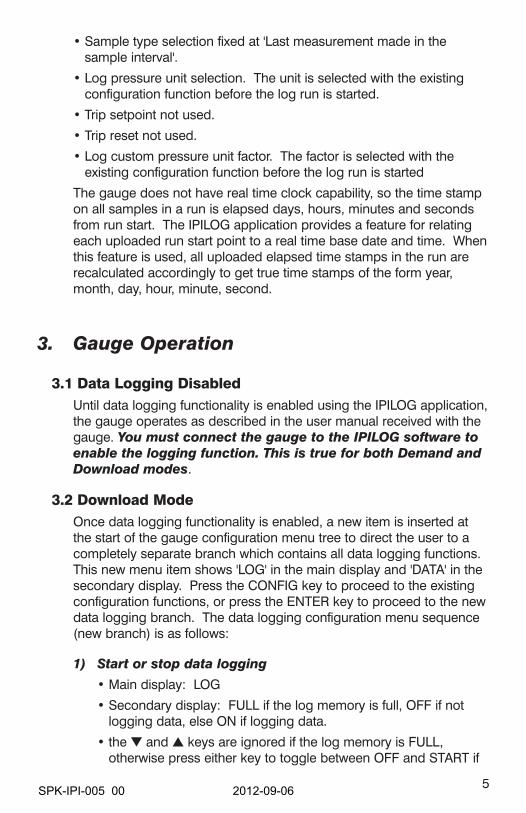
3.1 Data Logging DisabledUntil data logging functionality is enabled using the IPILOG application,the gauge operates as described in the user manual received with thegauge. You must connect the gauge to the IPILOG software toenable the logging function. This is true for both Demand andDownload modes.
3.2 Download ModeOnce data logging functionality is enabled, a new item is inserted atthe start of the gauge configuration menu tree to direct the user to acompletely separate branch which contains all data logging functions.This new menu item shows 'LOG' in the main display and 'DATA' in thesecondary display. Press the CONFIG key to proceed to the existingconfiguration functions, or press the ENTER key to proceed to the newdata logging branch. The data logging configuration menu sequence(new branch) is as follows:
1) Start or stop data logging
• Main display: LOG
• Secondary display: FULL if the log memory is full, OFF if notlogging data, else ON if logging data.
• the ▼ and ▲ keys are ignored if the log memory is FULL,otherwise press either key to toggle between OFF and START if
5SPK-IPI-005 00 2012-09-06
not logging data, or to toggle between ON and STOP if loggingdata.
• press the CONFIG key to step to the next menu item.
• press the ENTER key to exit configuration if the display is FULL,ON, or OFF, to stop logging and exit configuration if the displayis STOP, or to start logging and exit configuration if the display isSTART.
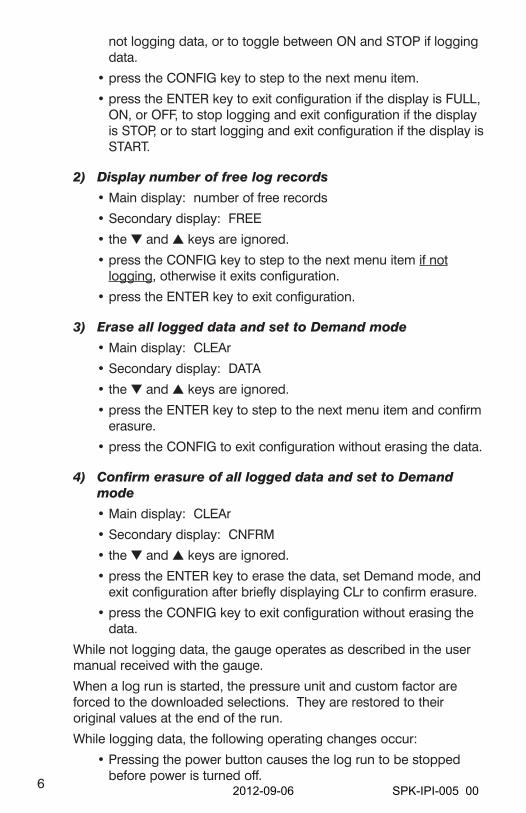
2) Display number of free log records
• Main display: number of free records
• Secondary display: FREE
• the ▼ and ▲ keys are ignored.
• press the CONFIG key to step to the next menu item if notlogging, otherwise it exits configuration.
• press the ENTER key to exit configuration.
3) Erase all logged data and set to Demand mode
• Main display: CLEAr
• Secondary display: DATA
• the ▼ and ▲ keys are ignored.
• press the ENTER key to step to the next menu item and confirmerasure.
• press the CONFIG to exit configuration without erasing the data.
4) Confirm erasure of all logged data and set to Demandmode
• Main display: CLEAr
• Secondary display: CNFRM
• the ▼ and ▲ keys are ignored.
• press the ENTER key to erase the data, set Demand mode, andexit configuration after briefly displaying CLr to confirm erasure.
• press the CONFIG key to exit configuration without erasing thedata.
While not logging data, the gauge operates as described in the usermanual received with the gauge.
When a log run is started, the pressure unit and custom factor areforced to the downloaded selections. They are restored to theiroriginal values at the end of the run.
While logging data, the following operating changes occur:
• Pressing the power button causes the log run to be stoppedbefore power is turned off.
6 2012-09-06 SPK-IPI-005 00
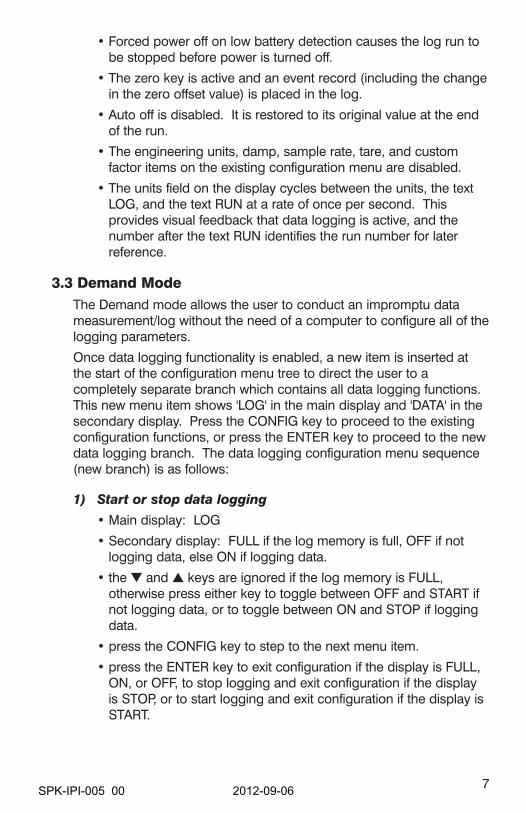
• Forced power off on low battery detection causes the log run tobe stopped before power is turned off.
• The zero key is active and an event record (including the changein the zero offset value) is placed in the log.
• Auto off is disabled. It is restored to its original value at the endof the run.
• The engineering units, damp, sample rate, tare, and customfactor items on the existing configuration menu are disabled.
• The units field on the display cycles between the units, the textLOG, and the text RUN at a rate of once per second. Thisprovides visual feedback that data logging is active, and thenumber after the text RUN identifies the run number for laterreference.
3.3 Demand ModeThe Demand mode allows the user to conduct an impromptu datameasurement/log without the need of a computer to configure all of thelogging parameters.
Once data logging functionality is enabled, a new item is inserted atthe start of the configuration menu tree to direct the user to acompletely separate branch which contains all data logging functions.This new menu item shows 'LOG' in the main display and 'DATA' in thesecondary display. Press the CONFIG key to proceed to the existingconfiguration functions, or press the ENTER key to proceed to the newdata logging branch. The data logging configuration menu sequence(new branch) is as follows:
1) Start or stop data logging
• Main display: LOG
• Secondary display: FULL if the log memory is full, OFF if notlogging data, else ON if logging data.
• the ▼ and ▲ keys are ignored if the log memory is FULL,otherwise press either key to toggle between OFF and START ifnot logging data, or to toggle between ON and STOP if loggingdata.
• press the CONFIG key to step to the next menu item.
• press the ENTER key to exit configuration if the display is FULL,ON, or OFF, to stop logging and exit configuration if the displayis STOP, or to start logging and exit configuration if the display isSTART.
7SPK-IPI-005 00 2012-09-06
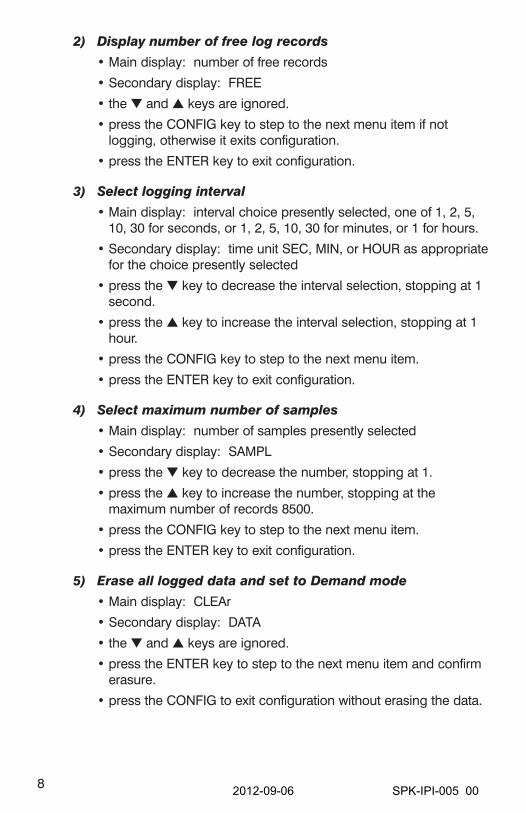
2) Display number of free log records
• Main display: number of free records
• Secondary display: FREE
• the ▼ and ▲ keys are ignored.
• press the CONFIG key to step to the next menu item if notlogging, otherwise it exits configuration.
• press the ENTER key to exit configuration.
3) Select logging interval
• Main display: interval choice presently selected, one of 1, 2, 5,10, 30 for seconds, or 1, 2, 5, 10, 30 for minutes, or 1 for hours.
• Secondary display: time unit SEC, MIN, or HOUR as appropriatefor the choice presently selected
• press the ▼ key to decrease the interval selection, stopping at 1second.
• press the ▲ key to increase the interval selection, stopping at 1hour.
• press the CONFIG key to step to the next menu item.
• press the ENTER key to exit configuration.
4) Select maximum number of samples
• Main display: number of samples presently selected
• Secondary display: SAMPL
• press the ▼ key to decrease the number, stopping at 1.
• press the ▲ key to increase the number, stopping at themaximum number of records 8500.
• press the CONFIG key to step to the next menu item.
• press the ENTER key to exit configuration.
5) Erase all logged data and set to Demand mode
• Main display: CLEAr
• Secondary display: DATA
• the ▼ and ▲ keys are ignored.
• press the ENTER key to step to the next menu item and confirmerasure.
• press the CONFIG to exit configuration without erasing the data.
8 2012-09-06 SPK-IPI-005 00
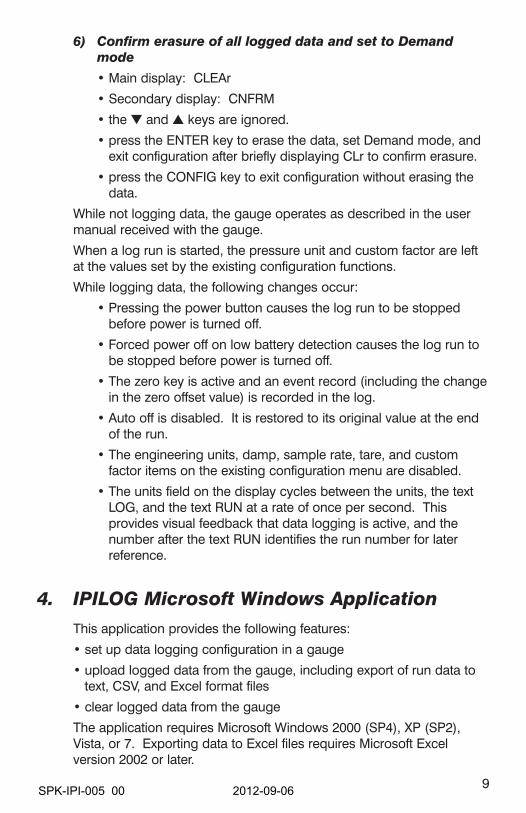
6) Confirm erasure of all logged data and set to Demandmode
• Main display: CLEAr
• Secondary display: CNFRM
• the ▼ and ▲ keys are ignored.
• press the ENTER key to erase the data, set Demand mode, andexit configuration after briefly displaying CLr to confirm erasure.
• press the CONFIG key to exit configuration without erasing thedata.
While not logging data, the gauge operates as described in the usermanual received with the gauge.
When a log run is started, the pressure unit and custom factor are leftat the values set by the existing configuration functions.
While logging data, the following changes occur:
• Pressing the power button causes the log run to be stoppedbefore power is turned off.
• Forced power off on low battery detection causes the log run tobe stopped before power is turned off.
• The zero key is active and an event record (including the changein the zero offset value) is recorded in the log.
• Auto off is disabled. It is restored to its original value at the endof the run.
• The engineering units, damp, sample rate, tare, and customfactor items on the existing configuration menu are disabled.
• The units field on the display cycles between the units, the textLOG, and the text RUN at a rate of once per second. Thisprovides visual feedback that data logging is active, and thenumber after the text RUN identifies the run number for laterreference.
4. IPILOG Microsoft Windows ApplicationThis application provides the following features:
• set up data logging configuration in a gauge
• upload logged data from the gauge, including export of run data totext, CSV, and Excel format files
• clear logged data from the gauge
The application requires Microsoft Windows 2000 (SP4), XP (SP2),Vista, or 7. Exporting data to Excel files requires Microsoft Excelversion 2002 or later.
9SPK-IPI-005 00 2012-09-06
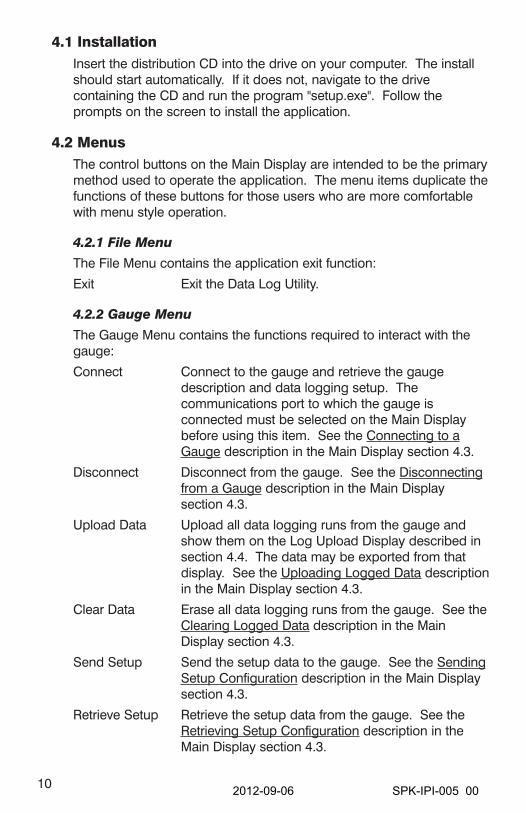
4.1 InstallationInsert the distribution CD into the drive on your computer. The installshould start automatically. If it does not, navigate to the drivecontaining the CD and run the program "setup.exe". Follow theprompts on the screen to install the application.
4.2 MenusThe control buttons on the Main Display are intended to be the primarymethod used to operate the application. The menu items duplicate thefunctions of these buttons for those users who are more comfortablewith menu style operation.
4.2.1 File Menu
The File Menu contains the application exit function:
Exit Exit the Data Log Utility.
4.2.2 Gauge Menu
The Gauge Menu contains the functions required to interact with thegauge:
Connect Connect to the gauge and retrieve the gaugedescription and data logging setup. Thecommunications port to which the gauge isconnected must be selected on the Main Displaybefore using this item. See the Connecting to aGauge description in the Main Display section 4.3.
Disconnect Disconnect from the gauge. See the Disconnectingfrom a Gauge description in the Main Displaysection 4.3.
Upload Data Upload all data logging runs from the gauge andshow them on the Log Upload Display described insection 4.4. The data may be exported from thatdisplay. See the Uploading Logged Data descriptionin the Main Display section 4.3.
Clear Data Erase all data logging runs from the gauge. See theClearing Logged Data description in the MainDisplay section 4.3.
Send Setup Send the setup data to the gauge. See the SendingSetup Configuration description in the Main Displaysection 4.3.
Retrieve Setup Retrieve the setup data from the gauge. See theRetrieving Setup Configuration description in theMain Display section 4.3.
10 2012-09-06 SPK-IPI-005 00
4.2.3 Options Menu
The Options Menu contains functions for specifying the default displayand export options. These functions are described in detail in sections4.5 and 4.6 below.
4.2.4 Help Menu
The Help Menu contains the functions required to obtain help andsupport information:
Help Display online help
Support Display customer support information.
About Display application description and versioninformation.
11SPK-IPI-005 00 2012-09-06
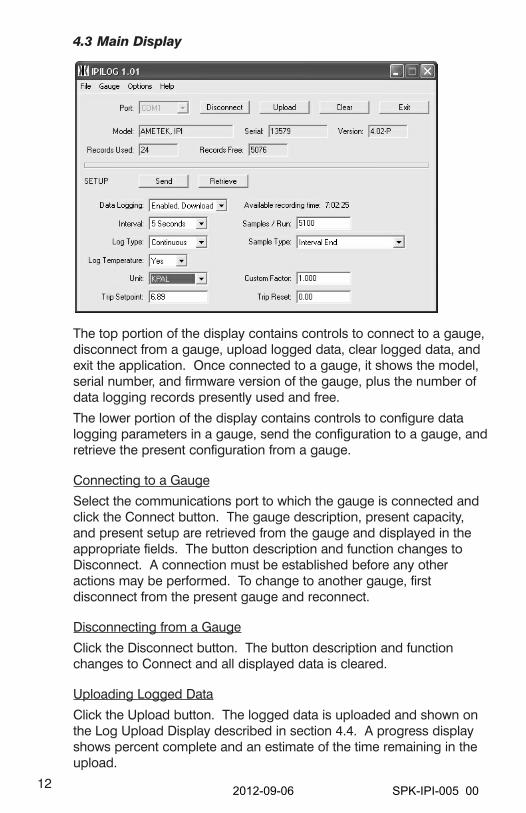
4.3 Main Display
The top portion of the display contains controls to connect to a gauge,disconnect from a gauge, upload logged data, clear logged data, andexit the application. Once connected to a gauge, it shows the model,serial number, and firmware version of the gauge, plus the number ofdata logging records presently used and free.
The lower portion of the display contains controls to configure datalogging parameters in a gauge, send the configuration to a gauge, andretrieve the present configuration from a gauge.
Connecting to a Gauge
Select the communications port to which the gauge is connected andclick the Connect button. The gauge description, present capacity,and present setup are retrieved from the gauge and displayed in theappropriate fields. The button description and function changes toDisconnect. A connection must be established before any otheractions may be performed. To change to another gauge, firstdisconnect from the present gauge and reconnect.
Disconnecting from a Gauge
Click the Disconnect button. The button description and functionchanges to Connect and all displayed data is cleared.
Uploading Logged Data
Click the Upload button. The logged data is uploaded and shown onthe Log Upload Display described in section 4.4. A progress displayshows percent complete and an estimate of the time remaining in theupload.
12 2012-09-06 SPK-IPI-005 00
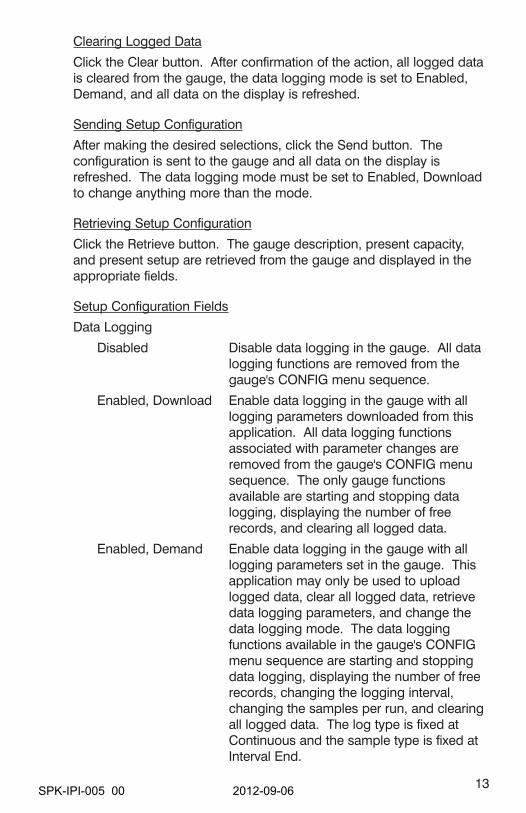
Clearing Logged Data
Click the Clear button. After confirmation of the action, all logged datais cleared from the gauge, the data logging mode is set to Enabled,Demand, and all data on the display is refreshed.
Sending Setup Configuration
After making the desired selections, click the Send button. Theconfiguration is sent to the gauge and all data on the display isrefreshed. The data logging mode must be set to Enabled, Downloadto change anything more than the mode.
Retrieving Setup Configuration
Click the Retrieve button. The gauge description, present capacity,and present setup are retrieved from the gauge and displayed in theappropriate fields.
Setup Configuration Fields
Data Logging
Disabled Disable data logging in the gauge. All datalogging functions are removed from thegauge's CONFIG menu sequence.
Enabled, Download Enable data logging in the gauge with alllogging parameters downloaded from thisapplication. All data logging functionsassociated with parameter changes areremoved from the gauge's CONFIG menusequence. The only gauge functionsavailable are starting and stopping datalogging, displaying the number of freerecords, and clearing all logged data.
Enabled, Demand Enable data logging in the gauge with alllogging parameters set in the gauge. Thisapplication may only be used to uploadlogged data, clear all logged data, retrievedata logging parameters, and change thedata logging mode. The data loggingfunctions available in the gauge's CONFIGmenu sequence are starting and stoppingdata logging, displaying the number of freerecords, changing the logging interval,changing the samples per run, and clearingall logged data. The log type is fixed atContinuous and the sample type is fixed atInterval End.
13SPK-IPI-005 00 2012-09-06
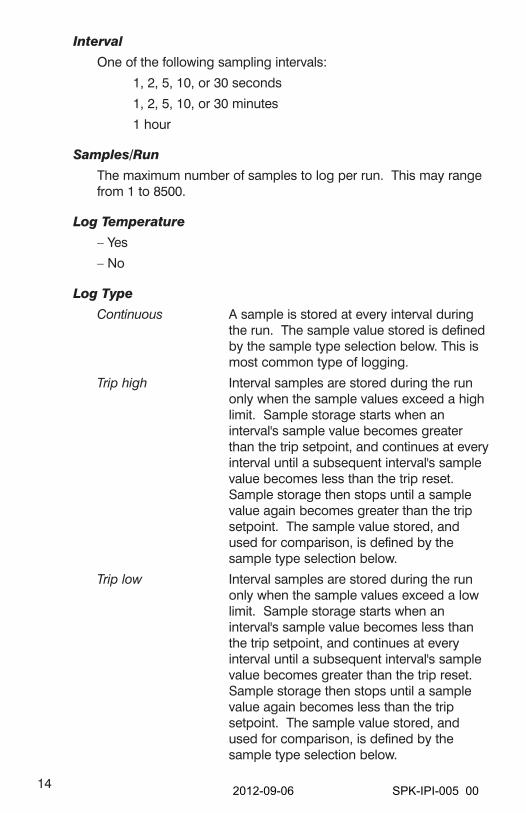
Interval
One of the following sampling intervals:
1, 2, 5, 10, or 30 seconds
1, 2, 5, 10, or 30 minutes
1 hour
Samples/Run
The maximum number of samples to log per run. This may rangefrom 1 to 8500.
Log Temperature
– Yes
– No
Log Type
Continuous A sample is stored at every interval duringthe run. The sample value stored is definedby the sample type selection below. This ismost common type of logging.
Trip high Interval samples are stored during the runonly when the sample values exceed a highlimit. Sample storage starts when aninterval's sample value becomes greaterthan the trip setpoint, and continues at everyinterval until a subsequent interval's samplevalue becomes less than the trip reset.Sample storage then stops until a samplevalue again becomes greater than the tripsetpoint. The sample value stored, andused for comparison, is defined by thesample type selection below.
Trip low Interval samples are stored during the runonly when the sample values exceed a lowlimit. Sample storage starts when aninterval's sample value becomes less thanthe trip setpoint, and continues at everyinterval until a subsequent interval's samplevalue becomes greater than the trip reset.Sample storage then stops until a samplevalue again becomes less than the tripsetpoint. The sample value stored, andused for comparison, is defined by thesample type selection below.
14 2012-09-06 SPK-IPI-005 00
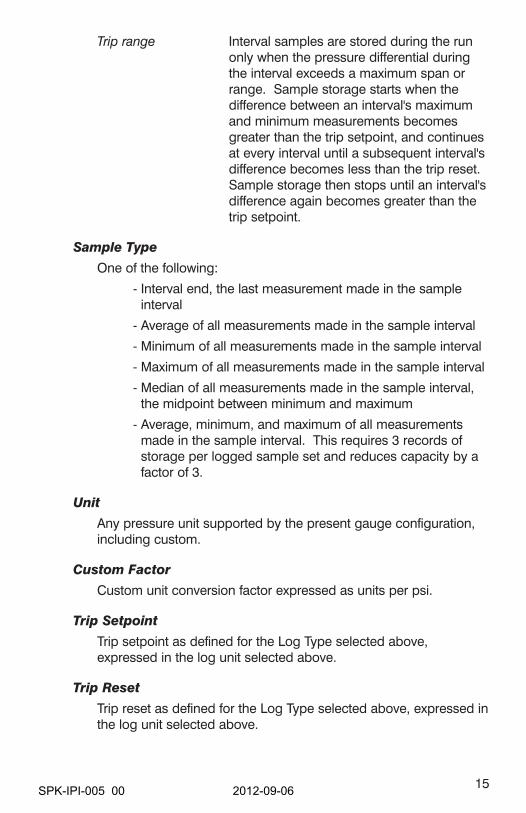
Trip range Interval samples are stored during the runonly when the pressure differential duringthe interval exceeds a maximum span orrange. Sample storage starts when thedifference between an interval's maximumand minimum measurements becomesgreater than the trip setpoint, and continuesat every interval until a subsequent interval'sdifference becomes less than the trip reset.Sample storage then stops until an interval'sdifference again becomes greater than thetrip setpoint.
Sample Type
One of the following:
- Interval end, the last measurement made in the sampleinterval
- Average of all measurements made in the sample interval
- Minimum of all measurements made in the sample interval
- Maximum of all measurements made in the sample interval
- Median of all measurements made in the sample interval,the midpoint between minimum and maximum
- Average, minimum, and maximum of all measurementsmade in the sample interval. This requires 3 records ofstorage per logged sample set and reduces capacity by afactor of 3.
Unit
Any pressure unit supported by the present gauge configuration,including custom.
Custom Factor
Custom unit conversion factor expressed as units per psi.
Trip Setpoint
Trip setpoint as defined for the Log Type selected above,expressed in the log unit selected above.
Trip Reset
Trip reset as defined for the Log Type selected above, expressed inthe log unit selected above.
15SPK-IPI-005 00 2012-09-06
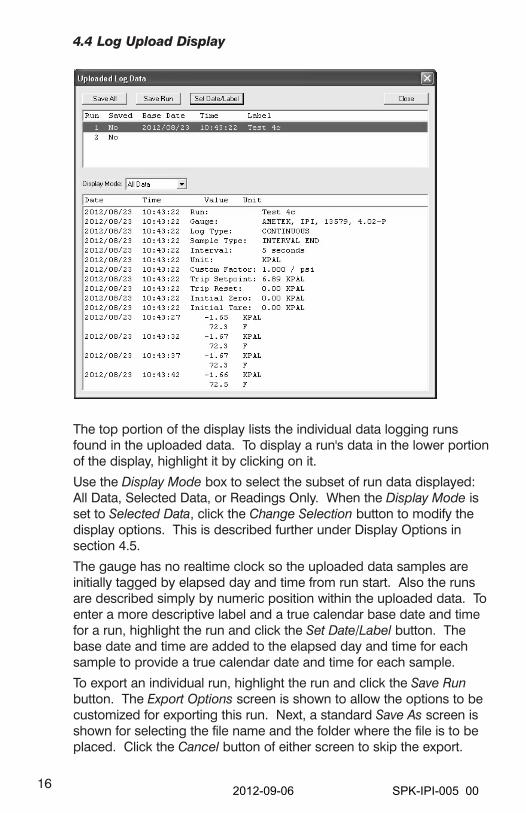
4.4 Log Upload Display
The top portion of the display lists the individual data logging runsfound in the uploaded data. To display a run's data in the lower portionof the display, highlight it by clicking on it.
Use the Display Mode box to select the subset of run data displayed:All Data, Selected Data, or Readings Only. When the Display Mode isset to Selected Data, click the Change Selection button to modify thedisplay options. This is described further under Display Options insection 4.5.
The gauge has no realtime clock so the uploaded data samples areinitially tagged by elapsed day and time from run start. Also the runsare described simply by numeric position within the uploaded data. Toenter a more descriptive label and a true calendar base date and timefor a run, highlight the run and click the Set Date/Label button. Thebase date and time are added to the elapsed day and time for eachsample to provide a true calendar date and time for each sample.
To export an individual run, highlight the run and click the Save Runbutton. The Export Options screen is shown to allow the options to becustomized for exporting this run. Next, a standard Save As screen isshown for selecting the file name and the folder where the file is to beplaced. Click the Cancel button of either screen to skip the export.
16 2012-09-06 SPK-IPI-005 00
The Export Options screen is described further under Export Options insection 4.6.
To export all runs, click the Save All button. The Export Options screenis shown to allow the options to be customized for exporting theseruns; the same options are used for all runs. For each run, a standardSave As screen is shown for selecting the file name and the folderwhere the file is to be placed. Click the Cancel button of the Save Asscreen for an individual run to skip the export of that run. Click theCancel button of the Export Options screen to skip the export of allruns. The Export Options screen is described further under ExportOptions in section 4.6.
Export to an Excel file requires Excel 2002 or later to be installed onyour computer.
The default location for files is the folder "Ametek/IPILOG Data" in "MyDocuments".
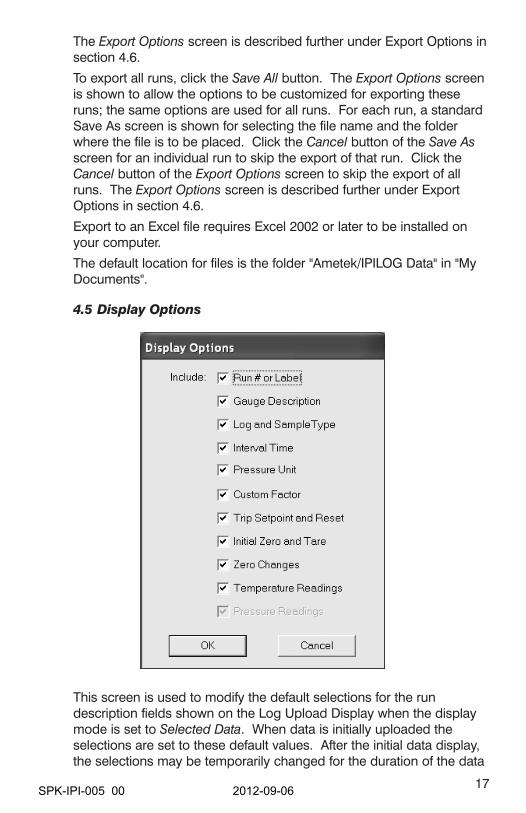
4.5 Display Options
This screen is used to modify the default selections for the rundescription fields shown on the Log Upload Display when the displaymode is set to Selected Data. When data is initially uploaded theselections are set to these default values. After the initial data display,the selections may be temporarily changed for the duration of the data
17SPK-IPI-005 00 2012-09-06
display. Place a checkmark next to each field that is to be shown onthe display when the display mode is set to Selected Data. Loggedpressure readings are always displayed.
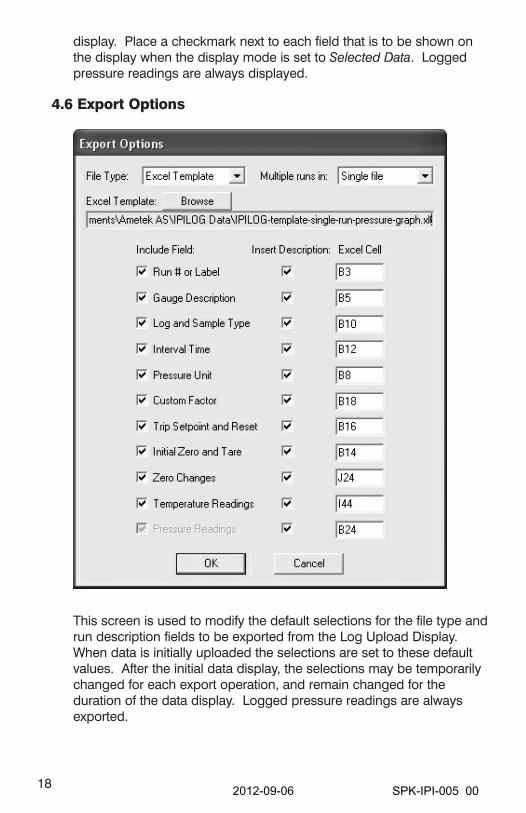
4.6 Export Options
This screen is used to modify the default selections for the file type andrun description fields to be exported from the Log Upload Display.When data is initially uploaded the selections are set to these defaultvalues. After the initial data display, the selections may be temporarilychanged for each export operation, and remain changed for theduration of the data display. Logged pressure readings are alwaysexported.
18 2012-09-06 SPK-IPI-005 00
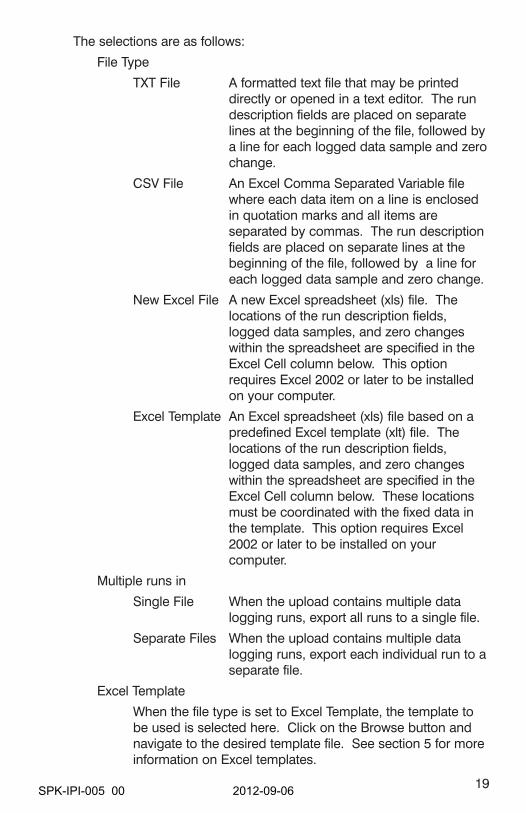
The selections are as follows:
File Type
TXT File A formatted text file that may be printeddirectly or opened in a text editor. The rundescription fields are placed on separatelines at the beginning of the file, followed bya line for each logged data sample and zerochange.
CSV File An Excel Comma Separated Variable filewhere each data item on a line is enclosedin quotation marks and all items areseparated by commas. The run descriptionfields are placed on separate lines at thebeginning of the file, followed by a line foreach logged data sample and zero change.
New Excel File A new Excel spreadsheet (xls) file. Thelocations of the run description fields,logged data samples, and zero changeswithin the spreadsheet are specified in theExcel Cell column below. This optionrequires Excel 2002 or later to be installedon your computer.
Excel Template An Excel spreadsheet (xls) file based on apredefined Excel template (xlt) file. Thelocations of the run description fields,logged data samples, and zero changeswithin the spreadsheet are specified in theExcel Cell column below. These locationsmust be coordinated with the fixed data inthe template. This option requires Excel2002 or later to be installed on yourcomputer.
Multiple runs in
Single File When the upload contains multiple datalogging runs, export all runs to a single file.
Separate Files When the upload contains multiple datalogging runs, export each individual run to aseparate file.
Excel Template
When the file type is set to Excel Template, the template tobe used is selected here. Click on the Browse button andnavigate to the desired template file. See section 5 for moreinformation on Excel templates.
19SPK-IPI-005 00 2012-09-06
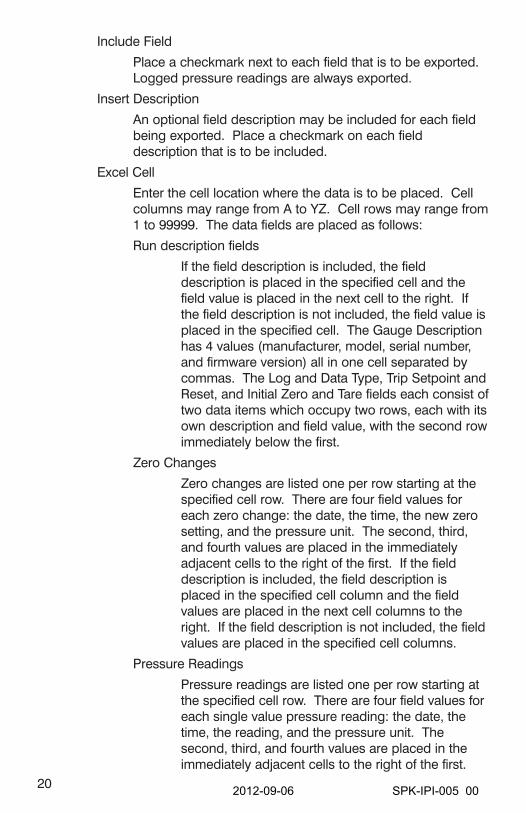
Include Field
Place a checkmark next to each field that is to be exported.Logged pressure readings are always exported.
Insert Description
An optional field description may be included for each fieldbeing exported. Place a checkmark on each fielddescription that is to be included.
Excel Cell
Enter the cell location where the data is to be placed. Cellcolumns may range from A to YZ. Cell rows may range from1 to 99999. The data fields are placed as follows:
Run description fields
If the field description is included, the fielddescription is placed in the specified cell and thefield value is placed in the next cell to the right. Ifthe field description is not included, the field value isplaced in the specified cell. The Gauge Descriptionhas 4 values (manufacturer, model, serial number,and firmware version) all in one cell separated bycommas. The Log and Data Type, Trip Setpoint andReset, and Initial Zero and Tare fields each consist oftwo data items which occupy two rows, each with itsown description and field value, with the second rowimmediately below the first.
Zero Changes
Zero changes are listed one per row starting at thespecified cell row. There are four field values foreach zero change: the date, the time, the new zerosetting, and the pressure unit. The second, third,and fourth values are placed in the immediatelyadjacent cells to the right of the first. If the fielddescription is included, the field description isplaced in the specified cell column and the fieldvalues are placed in the next cell columns to theright. If the field description is not included, the fieldvalues are placed in the specified cell columns.
Pressure Readings
Pressure readings are listed one per row starting atthe specified cell row. There are four field values foreach single value pressure reading: the date, thetime, the reading, and the pressure unit. Thesecond, third, and fourth values are placed in theimmediately adjacent cells to the right of the first.
20 2012-09-06 SPK-IPI-005 00
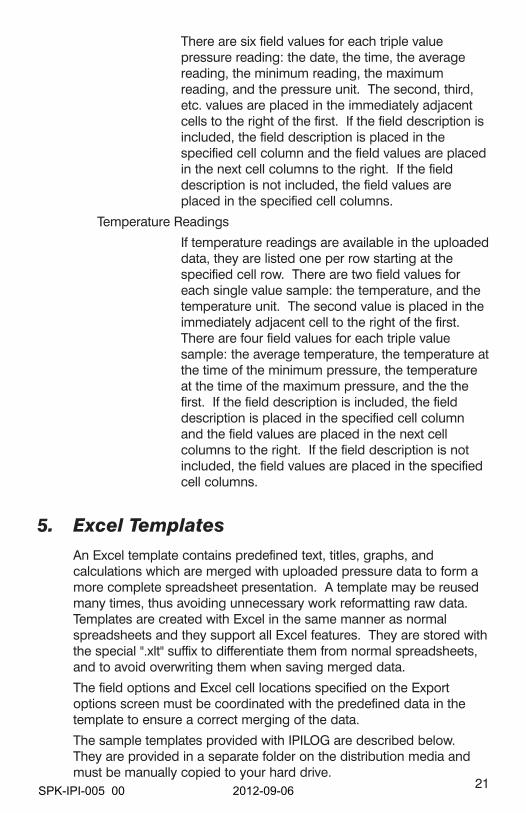
There are six field values for each triple valuepressure reading: the date, the time, the averagereading, the minimum reading, the maximumreading, and the pressure unit. The second, third,etc. values are placed in the immediately adjacentcells to the right of the first. If the field description isincluded, the field description is placed in thespecified cell column and the field values are placedin the next cell columns to the right. If the fielddescription is not included, the field values areplaced in the specified cell columns.
Temperature Readings
If temperature readings are available in the uploadeddata, they are listed one per row starting at thespecified cell row. There are two field values foreach single value sample: the temperature, and thetemperature unit. The second value is placed in theimmediately adjacent cell to the right of the first.There are four field values for each triple valuesample: the average temperature, the temperature atthe time of the minimum pressure, the temperatureat the time of the maximum pressure, and the thefirst. If the field description is included, the fielddescription is placed in the specified cell columnand the field values are placed in the next cellcolumns to the right. If the field description is notincluded, the field values are placed in the specifiedcell columns.
5. Excel TemplatesAn Excel template contains predefined text, titles, graphs, andcalculations which are merged with uploaded pressure data to form amore complete spreadsheet presentation. A template may be reusedmany times, thus avoiding unnecessary work reformatting raw data.Templates are created with Excel in the same manner as normalspreadsheets and they support all Excel features. They are stored withthe special ".xlt" suffix to differentiate them from normal spreadsheets,and to avoid overwriting them when saving merged data.
The field options and Excel cell locations specified on the Exportoptions screen must be coordinated with the predefined data in thetemplate to ensure a correct merging of the data.
The sample templates provided with IPILOG are described below.They are provided in a separate folder on the distribution media andmust be manually copied to your hard drive.
21SPK-IPI-005 00 2012-09-06
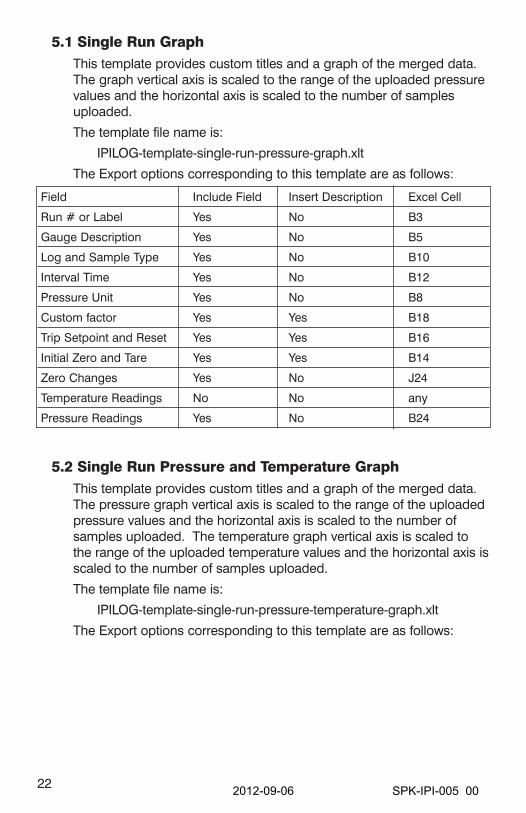
5.1 Single Run GraphThis template provides custom titles and a graph of the merged data.The graph vertical axis is scaled to the range of the uploaded pressurevalues and the horizontal axis is scaled to the number of samplesuploaded.
The template file name is:
IPILOG-template-single-run-pressure-graph.xlt
The Export options corresponding to this template are as follows:
Field Include Field Insert Description Excel Cell
Run # or Label Yes No B3
Gauge Description Yes No B5
Log and Sample Type Yes No B10
Interval Time Yes No B12
Pressure Unit Yes No B8
Custom factor Yes Yes B18
Trip Setpoint and Reset Yes Yes B16
Initial Zero and Tare Yes Yes B14
Zero Changes Yes No J24
Temperature Readings No No any
Pressure Readings Yes No B24
5.2 Single Run Pressure and Temperature GraphThis template provides custom titles and a graph of the merged data.The pressure graph vertical axis is scaled to the range of the uploadedpressure values and the horizontal axis is scaled to the number ofsamples uploaded. The temperature graph vertical axis is scaled tothe range of the uploaded temperature values and the horizontal axis isscaled to the number of samples uploaded.
The template file name is:
IPILOG-template-single-run-pressure-temperature-graph.xlt
The Export options corresponding to this template are as follows:
22 2012-09-06 SPK-IPI-005 00
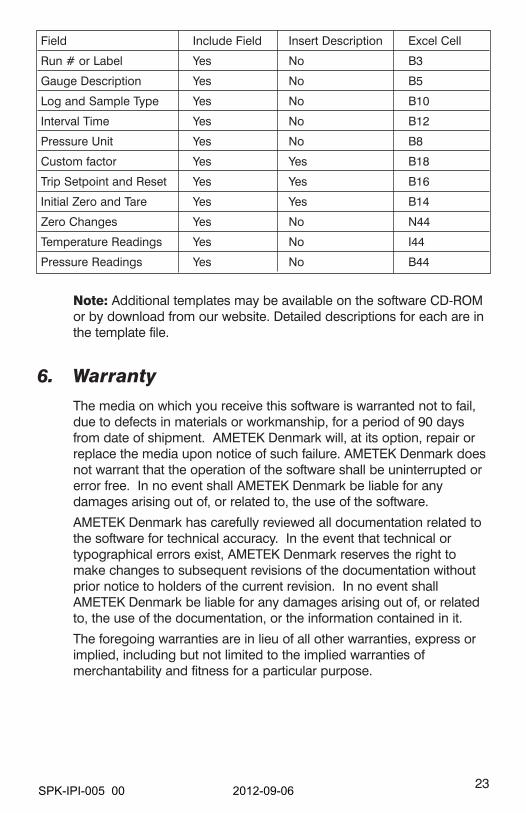
Field Include Field Insert Description Excel Cell
Run # or Label Yes No B3
Gauge Description Yes No B5
Log and Sample Type Yes No B10
Interval Time Yes No B12
Pressure Unit Yes No B8
Custom factor Yes Yes B18
Trip Setpoint and Reset Yes Yes B16
Initial Zero and Tare Yes Yes B14
Zero Changes Yes No N44
Temperature Readings Yes No I44
Pressure Readings Yes No B44
Note: Additional templates may be available on the software CD-ROMor by download from our website. Detailed descriptions for each are inthe template file.
6. WarrantyThe media on which you receive this software is warranted not to fail,due to defects in materials or workmanship, for a period of 90 daysfrom date of shipment. AMETEK Denmark will, at its option, repair orreplace the media upon notice of such failure. AMETEK Denmark doesnot warrant that the operation of the software shall be uninterrupted orerror free. In no event shall AMETEK Denmark be liable for anydamages arising out of, or related to, the use of the software.
AMETEK Denmark has carefully reviewed all documentation related tothe software for technical accuracy. In the event that technical ortypographical errors exist, AMETEK Denmark reserves the right tomake changes to subsequent revisions of the documentation withoutprior notice to holders of the current revision. In no event shallAMETEK Denmark be liable for any damages arising out of, or relatedto, the use of the documentation, or the information contained in it.
The foregoing warranties are in lieu of all other warranties, express orimplied, including but not limited to the implied warranties ofmerchantability and fitness for a particular purpose.
23SPK-IPI-005 00 2012-09-06
TRADEMARKSTrademarks or trade names are subject to state and federal lawsconcerning their unauthorized use or other infringements. The fact thatthe product marks or names in this software, and relateddocumentation, do not bear a trademark symbol does not mean thatthe product mark or name is not registered as a trademark or tradename. Any queries concerning ownership or existence of anytrademarks or trade names mentioned in this software, and relateddocumentation, should be independently confirmed with themanufacturer or distributor of the product.
24 2012-09-06 SPK-IPI-005 00

0200061 Rev A 9/12
SPK-IPI-005 00 2012-09-06

Information in this document is subject to change without notice. ©2012, by AMETEK, Inc., www.ametek.com. All rights reserved.
AMETEK Calibration Instrumentsis one of the world’s leading manufacturers
and developers of calibration instruments for temperature, pressure and process signals as well
as for temperature sensors both from a commercial and a technological point of view.
JOFRA Temperature InstrumentsPortable precision thermometers. Dry-block and
liquid bath calibrators: 5 series, with more than 25 models and temperature ranges from -90° to
1205°C / -130° to 2200°F. All featuring speed, portability, accuracy and advanced documenting
functions with JOFRACAL calibration software.
JOFRA Pressure InstrumentsConvenient electronic systems ranging from -25
mbar to 1000 bar (0.4 to 15,000 psi) - multiple choices of pressure ranges, pumps and accuracies,
fully temperature-compensated for problem-free and accurate field use.
JOFRA Signal InstrumentsProcess signal measurement and simulation for easy control loop calibration and measurement
tasks - from handheld field instruments to laboratory reference level bench top instruments.
JOFRA / JF Marine InstrumentsA complete range of calibration equipment for
temperature, pressure and signal, approved for marine use.
FP Temperature SensorsA complete range of temperature sensors for
industrial and marine use.
M&G Pressure TestersPneumatic floating-ball or hydraulic piston dead
weight testers with accuracies to 0.015% of reading.
M&G PumpsPressure generators from small pneumatic “bicycle”
style pumps to hydraulic pumps generating up to 1,000 bar (15,000 psi).
www.jofra.com
UKAMETEK Calibration InstrumentsTel +44 (0)1243 833 [email protected]
FranceAMETEK S.A.S.Tel +33 (0)1 30 68 89 [email protected]
GermanyAMETEK GmbHTel +49 (0)2159 9136 [email protected]
DenmarkAMETEK DenmarkTel +45 4816 [email protected]
USAAMETEK Mansfield & GreenTel +1 (800) 527 [email protected]
IndiaAMETEK Instruments India Pvt Ltd.Tel +91 22 2836 [email protected]
Singapore AMETEK Singapore Pte LtdTel +65 6484 [email protected]
ChinaAMETEK Inc. - ShanghaiTel +86 21 5868 5111
AMETEK Inc. - BeijingTel +86 10 8526 2111
AMETEK Inc. - GuangzhouTel +86 20 8363 [email protected]


