See important disclosures at the end of this report Powered by Enhanced Datasystems’ EFA TM Platform 1 IPO Note, 19 June 2013 Nok Airlines (NOK TB) Buy Consumer Cyclical - Airlines Target Price: THB37.6 Market Cap: USD527.3m Price: THB26.0 Here Comes The Bird Macro Risks Growth Value Newly Issued Share 125m shares (20%) Existing Share* 62.5m shares (10%) Total 187.5m shares (30%) Paid Up Capital THB625m (at THB1 per share) Use of Proceeds: Aircraft procurement and working capital purposes Source: Bloomberg Avg Turnover (THB/USD) - Cons. Upside (%) - Upside (%) 45 52-wk Price low/high (THB) - Free float (%) 30 Shareholders (%) Thai Airways International 39.2 Aviation Investment 10.0 CPB Equity 4.8 Shariah compliant Ahmad Maghfur Usman 603 9207 7654 [email protected]Forecasts and Valuations Dec-11 Dec-12 Dec-13F Dec-14F Dec-15F Total turnover (THBm) 6,039 8,218 11,719 15,272 19,498 Net income to ord equity (THBm) 200 505 1,413 1,801 2,536 Recurring net profit (THBm) 198 760 1,413 1,801 2,536 Recurring net profit growth (%) (67.3) 284.5 85.9 27.4 40.8 Core EPS (THB) 0.40 1.52 2.26 2.88 4.06 DPS (THB) 0.23 1.10 1.13 1.44 2.03 Dividend Yield (%) 0.9 4.2 4.3 5.5 7.8 Core P/E (x) 65.8 17.1 11.5 9.0 6.4 Return on average equity (%) 26.0 59.9 46.0 27.7 26.8 P/B (x) 16.30 14.64 3.09 2.09 1.45 P/CF (x) 40.56 15.41 10.23 8.47 5.93 EV/EBITDA (x) 49.83 18.59 6.45 4.05 2.12 Net debt to equity (%) net cash net cash net cash net cash net cash Ours vs consensus EPS (%) - - - Source: Company data, RHB Estimates We initiate coverage on Nok Air (to be listed on 20 June), with a BUY call and THB37.6 FV, premised on 7.5x adjusted FY14F EV/EBITDAR. Thailand’s rising per capita income and growing urbanization are conducive for air travel growth and provide scope for Nok Air to expand its fleet. We expect the airline to post a superior 86% core earnings growth for FY13 and a 3-year core earnings CAGR of 49%, fuelled by capacity expansion and the resulting economies of scale. Sweet spot. We like Thailand’s favorable demographics landscape given its rising per capita income and urbanization rate. This bodes well for air travel growth, and gives Nok Air the scope to expand its fleet. Furthermore, since AirAsia (BUY, FV: MYR3.94) shifted its Bangkok hub to Don Mueang Airport, Nok Air has benefited from spillover traffic of connecting flights to Thailand’s second and third tier provinces, for which it is the only dominant player. These routes are still deemed underserved, given the carrier’s high load factor. Superior earnings growth. Nok Air’s revenue is expected to grow by at least 43% / 30% / 28% respectively for FY13-FY15, in tandem with its capacity growth. The growth in capacity will be bolstered by aircraft deliveries, as well as optimized seat configurations, new routes and higher aircraft utilization rate. With lower projected variable unit costs on improved operating efficiencies, coupled with greater economies of scale, we expect Nok Air to record superior core earnings growth of 86% y-o-y in FY13. With new aircraft coming in progressively, earnings for FY14 and FY15 are expected to grow by 27% and 41% respectively, bringing its projected core earnings CAGR over the next three years to 49% y-o-y. Flying with the bird. We value Nok Air at THB37.6, premised on an adjusted FY14F EV/EBITDAR multiple of 7.5x. This pegs its FY14 P/E at 13.1x and EV/EBITDA at 7.1x, which is at a discount to its Asian low- cost carrier (LCC) peers’ FY14 EV/EBITDA of 7.4x. At the company’s CAGR of 49% for FY13-FY15 core earnings, this translates into a PEG of 0.3x, which is at a deep discount to its Asian peers’ average 0. 6x. Initiate coverage with a BUY.
Transcript
See important disclosures at the end of this report Powered by Enhanced Datasystems’ EFATM
Forecasts and Valuations Dec-11 Dec-12 Dec-13F Dec-14F Dec-15F
Total turnover (THBm) 6,039 8,218 11,719 15,272 19,498
Net income to ord equity (THBm) 200 505 1,413 1,801 2,536
Recurring net profit (THBm) 198 760 1,413 1,801 2,536
Recurring net profit growth (%) (67.3) 284.5 85.9 27.4 40.8
Core EPS (THB) 0.40 1.52 2.26 2.88 4.06
DPS (THB) 0.23 1.10 1.13 1.44 2.03
Dividend Yield (%) 0.9 4.2 4.3 5.5 7.8
Core P/E (x) 65.8 17.1 11.5 9.0 6.4
Return on average equity (%) 26.0 59.9 46.0 27.7 26.8
P/B (x) 16.30 14.64 3.09 2.09 1.45
P/CF (x) 40.56 15.41 10.23 8.47 5.93
EV/EBITDA (x) 49.83 18.59 6.45 4.05 2.12
Net debt to equity (%) net cash net cash net cash net cash net cash
Ours vs consensus EPS (%) - - -
Source: Company data, RHB Estimates
We initiate coverage on Nok Air (to be listed on 20 June), with a BUY call and THB37.6 FV, premised on 7.5x adjusted FY14F EV/EBITDAR. Thailand’s rising per capita income and growing urbanization are conducive for air travel growth and provide scope for Nok Air to expand its fleet. We expect the airline to post a superior 86% core earnings growth for FY13 and a 3-year core earnings CAGR of 49%, fuelled by capacity expansion and the resulting economies of scale.
Sweet spot. We like Thailand’s favorable demographics landscape
given its rising per capita income and urbanization rate. This bodes well for air travel growth, and gives Nok Air the scope to expand its fleet. Furthermore, since AirAsia (BUY, FV: MYR3.94) shifted its Bangkok hub to Don Mueang Airport, Nok Air has benefited from spillover traffic of connecting flights to Thailand’s second and third tier provinces, for which it is the only dominant player. These routes are still deemed underserved, given the carrier’s high load factor.
Superior earnings growth. Nok Air’s revenue is expected to grow by at
least 43% / 30% / 28% respectively for FY13-FY15, in tandem with its capacity growth. The growth in capacity will be bolstered by aircraft deliveries, as well as optimized seat configurations, new routes and higher aircraft utilization rate. With lower projected variable unit costs on improved operating efficiencies, coupled with greater economies of scale, we expect Nok Air to record superior core earnings growth of 86% y-o-y in FY13. With new aircraft coming in progressively, earnings for FY14 and FY15 are expected to grow by 27% and 41% respectively, bringing its projected core earnings CAGR over the next three years to 49% y-o-y.
Flying with the bird. We value Nok Air at THB37.6, premised on an
adjusted FY14F EV/EBITDAR multiple of 7.5x. This pegs its FY14 P/E at 13.1x and EV/EBITDA at 7.1x, which is at a discount to its Asian low-cost carrier (LCC) peers’ FY14 EV/EBITDA of 7.4x. At the company’s CAGR of 49% for FY13-FY15 core earnings, this translates into a PEG of 0.3x, which is at a deep discount to its Asian peers’ average 0.6x. Initiate coverage with a BUY.
Nok Airlines (NOK TB) 19 June 2013
See important disclosures at the end of this report 2
Executive Summary
Valuations. We value Nok Air at THB37.6 per share, premised on an adjusted
FY14F EV (enterprise value) to EBITDAR (earnings before interest, tax, depreciation and rental) multiple of 7.5x. This implies FY14 EV/EBITDA of 7.1x and a P/E of 13.1x.
Nok Air’s FY14 EV/EBITDA of 4.05x is still at a 45% discount to its Asian LCC peers’ FY14F EV/EBITDA of 7.4x. At a CAGR of 49% for FY13-FY15F core earnings, this translates to a PEG of 0.3x, which is at a deep discount of 50% to its Asian peers’ average of 0.6x. We initiate coverage on Nok Air with a BUY rating.
Figure 1: Nok Air’s valuation Capitalized Fleet Value (x 8 years) - THBm 16,766.1 Less: Net Cash - THBm 6,801.8
Nok Air NOK TB 527.3 11.5 9.0 6.5 4.1 3.1 46.0 0.2
31% 16% 28% 45% 51% -226% 63%Discount / (Premium) to Average Asia LCCs Source: RHB estimates, Bloomberg
*Last price as of 18 June 2013 at respective local currencies
Nok Air is valued at 7.5x adjusted EV/EBITDAR, giving it a FV of THB37.6. At a CAGR of 50% for FY13-FY15 core earnings, this translates to a PEG of 0.3x, which is at a deep discount to its Asian peers’ average of 0.6x.
Nok Airlines (NOK TB) 19 June 2013
See important disclosures at the end of this report 3
Steady dividend policy. Given its high passenger yields and the potential for further
cost reductions from its rejuvenated fleet, we reckon that Nok Air can sustain steady dividend payouts. In the past two years, it had paid out more than 50% of its earnings. We project a dividend per share of THB1.13 / THB1.44 / THB2.03 for FY13 / FY14F / FY15F respectively. Its IPO price of THB26 per share translates into dividend yields of 4.3% / 5.5% / 7.8% for FY13 / FY14F / FY15F respectively.
Capex allocation. Nok Air will use the IPO proceeds (of THB3.25bn) mostly on
aircraft procurement (purchase and deposits), and the remainder on working capital and investments in non-aircraft day-to-day operations to facilitate its business expansion. The carrier currently operates an asset-light strategy given that its existing 17 aircraft are leased from third parties. With a new equity funding in place, Nok Air aims to start purchasing turbo prop aircraft. Of the eight new turbo props to be added to its fleet by 2015, it plans to directly own six, with the remaining two under operating leases. Over the longer term, the carrier will start acquiring Boeing Max as its balance sheet strengthens to enable gearing for cheaper debt funding. Ownership of its own fleet will give Nok Air the added incentives of higher investment tax allowance and reduced rental and maintenance costs. We expect capex over the next three years to be to the tune of THB5.5bn. Favorable macro outlook and capitalizing on Don Mueang spillover. We like
Thailand’s favorable demographics landscape given its rising per capita income and increased urbanization rate. This bodes well for air travel growth and gives Nok Air the scope to expand its fleet. Furthermore, since AirAsia shifted its Bangkok hub to the Don Mueang Airport, Nok Air has benefited from the spillover traffic of connecting flights to second and third tier provinces, for which it is the only dominant player. These routes are still deemed underserved, given the high load factor the carrier has consistently achieved. Superior earnings growth. New aircraft deliveries are expected to boost Nok Air’s
revenue by at least 43% / 30% / 28% respectively for FY13 / 14F / 15F, in tandem with its capacity growth. The growth in capacity will also be fueled by optimized seat configurations, new routes and higher aircraft utilization rate. With lower expected variable unit costs on improved operating efficiencies, coupled with greater economies of scale, we expect Nok Air to chalk up superior core earnings growth of 86% y-o-y. With its new aircraft scheduled to arrive progressively, we expect FY14F and FY15F earnings to grow by 27.4% and 41% respectively, bringing its projected core earnings CAGR over the next three years to 49% y-o-y. Strong balance sheet with no debt. Nok Air has no borrowings and runs its
operations purely on a cash basis given its current asset-light model. Cash is king for an airline business that is still at its infancy and attempting to grow its fleet ownership. This gives room for Nok Air to employ debt funding moving forward when opportunities for aircraft acquisition arise. Leader in yields. Nok Air is ranked third in terms of passenger yields among Asean
carriers, thanks to its extensive coverage of high-yield feeder routes to Thailand’s second and third tier provinces. Its FY12 EBITDAR margin was respectably high at 22.5%. Once the carrier achieves greater economies of scale as it expands its fleet, we project its EBITDAR margin to improve to 32.6% by FY15. To put it into perspective, AirAsia, the biggest LCC in Asia, has over the past three years consistently achieved an EBITDAR margin (excluding aircraft lease income) of at least 28%.
We project dividend yield of 4.3% / 5.5% / 7.8% for FY13 / FY14 / FY15 respectively.
Nok Air will use the IPO proceeds mostly on aircraft procurement (purchase and deposits), and the remainder on working capital and investments in non-aircraft day-to-day operations. We expect capex over the next three years to be to the tune of THB5.5bn.
Nok Air has benefited from the traffic spillover from AirAsia since the latter shifted to Don Mueang Airport.
Nok Air is expected to post superior core earnings CAGR of 49% for FY13-FY15.
Nok Air has room for gearing as it has zero borrowings.
Nok Air’s FY12 EBITDAR margin was respectably high at 22.5%. Once the carrier achieves greater economies of scale, we project its EBITDAR margin to improve to 32.6% by FY15.
Nok Airlines (NOK TB) 19 June 2013
See important disclosures at the end of this report 4
Key Focus Charts
Figure 3: Passenger yield (THB) for Nok Air was high, thanks to its extensive exposure to high-yield feeder routes. Figures as of FY12
Figure 4: Fleet expansion to boost ASK (available seat km) and RPK (revenue passenger km)
Title:
Source:
Please fill in the values above to have them entered in your report
3.56
3.49
3.35
3.00
2.82
2.72
2.68
2.61
2.27
2.23
2.21
1.88
0.00 0.50 1.00 1.50 2.00 2.50 3.00 3.50 4.00
Garuda - Domestic
* Silk Air (FYE Mar 13)
Nok Air
Garuda - All
* Singapore Airlines (FYE Mar 13)
Thai Airways
Garuda - International
Malaysia Airlines
Cebu Air
Thai AirAsia
Malaysia AirAsia
Indonesia AirAsia
Title:
Source:
Please fill in the values above to have them entered in your report
0
1,000
2,000
3,000
4,000
5,000
6,000
7,000
8,000
78%
79%
80%
81%
82%
83%
84%
85%
Dec-10 Dec-11 Dec-12 Dec-13F Dec-14F Dec-15F
ASK (m) - RHS RPK (m) - RHS
Load Factor (%) - LHS
Source: RHB estimates, Company
*To standardize with peers for a meaningful comparison, our calculation on passenger yield is based on all revenues earned from passengers and airline related businesses (inclusive of charter aircraft revenue and ancillary income) divided by total RPK
(revenue passenger kilometer)
Source: Company
*RPK: The number of revenue passengers carried times distance in kilometers
*ASK: The number of seats available for the transportation of passengers times
distance in kilometers
* Load Factor: RPK divided by ASK and expressed as a percentage. Describes the
utilization level of available seats
Figure 5: Improvement in CASK (cost of available seat km) to lower breakeven load factor moving forward
Figure 6: CASK expected to dip on improved economies of scale. Figures as of FY12
Title:
Source:
Please fill in the values above to have them entered in your report
Please fill in the values above to have them entered in your report
1.32
1.39
1.65
1.83
2.26
2.28
2.44
2.45
2.57
2.59
2.74
0.0 0.5 1.0 1.5 2.0 2.5 3.0
Indonesia AirAsia
Malaysia AirAsia
Thai AirAsia
Cebu Air
Garuda - International
* Singapore Airlines (FY13)
Garuda - All
* Silk Air (FYE Mar 13)
Nok Air
Malaysia Airlines
Garuda - Domestic
Source: Company
* CASK is calculated by totaling all operating expenses related to airline operations divided by the ASK
* Breakeven load factor is the minimum load factor needed to breakeven
Source: RHB estimates, Company
*CASK is calculated by totaling all operating expenses related to airline operations divided by the ASK
Nok Airlines (NOK TB) 19 June 2013
See important disclosures at the end of this report 5
Industry Outlook
Liberalising Thailand’s aviation landscape
Among the Asean countries, Thailand was the first to fully deregulate its aviation industry by removing restrictions on international and domestic flight access. This move probably made it the most liberalized country in the region after Singapore. The country’s aviation landscape was progressively liberalized as early as 1988, with the deregulaton of the domestic market in 1991, followed by the opening of the domestic industry to the foreign market in 1997, which allowed foreign ownership of airline companies in Thailand. However, despite allowing foreign shareholding in local air carriers, air travel and flight routes were still confined to the domestic market. In 2001, more international routes were extended to non-national flagged carriers, subject to Thailand’s bilateral airline service agreements (ASAs) and traffic availability. Competition from foreign carriers was still limited until 2004, when the 10 Asean members signed an integrated roadmap for Asean’s air liberalization, thereby opening up the market to more competition. Since the industry was fully deregulated in 2000, a number of new domestic airlines have emerged, with some discontinuing operations after running into financial difficulties due to the fierce competition, while others were suspended due to safety concerns. The liberalization of Thailand’s aviation market is not entirely surprising, considering the Government’s early attempts in promoting the country’s tourism. On the same note, this was also the case with its automotive industry, which has become South-East Asia’s own Detroit-style auto manufacturing hub, attracting massive FDIs from global manufacturers, notably from the auto industry.
In the same vein, Singapore had also deregulated its aviation industry early to promote the country as a key business and transit hub for connecting flights.
Thailand’s aviation industry on a growth path
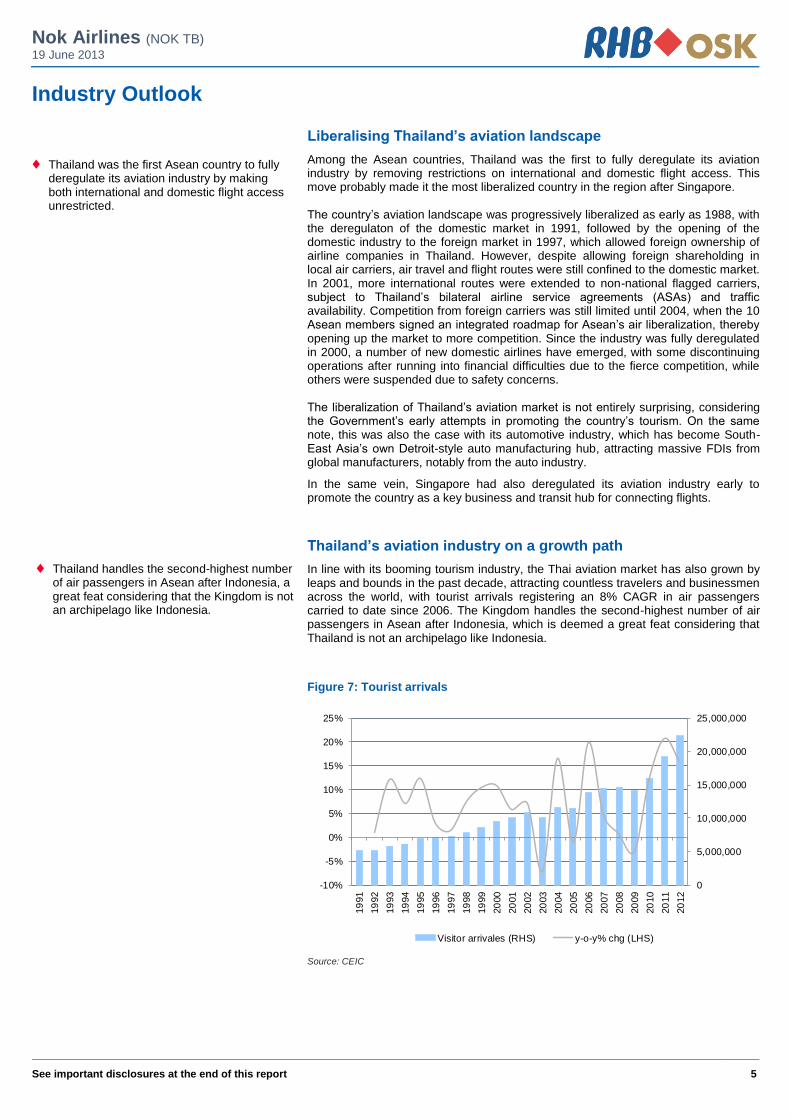
In line with its booming tourism industry, the Thai aviation market has also grown by leaps and bounds in the past decade, attracting countless travelers and businessmen across the world, with tourist arrivals registering an 8% CAGR in air passengers carried to date since 2006. The Kingdom handles the second-highest number of air passengers in Asean after Indonesia, which is deemed a great feat considering that Thailand is not an archipelago like Indonesia.
Figure 7: Tourist arrivals
Title:
Source:
Please fill in the values above to have them entered in your report
0
5,000,000
10,000,000
15,000,000
20,000,000
25,000,000
-10%
-5%
0%
5%
10%
15%
20%
25%
19
91
19
92
19
93
19
94
19
95
19
96
19
97
19
98
19
99
20
00
20
01
20
02
20
03
20
04
20
05
20
06
20
07
20
08
20
09
20
10
20
11
20
12
Visitor arrivales (RHS) y-o-y% chg (LHS)
Source: CEIC
Thailand was the first Asean country to fully deregulate its aviation industry by making both international and domestic flight access unrestricted.
Thailand handles the second-highest number of air passengers in Asean after Indonesia, a great feat considering that the Kingdom is not an archipelago like Indonesia.
Nok Airlines (NOK TB) 19 June 2013
See important disclosures at the end of this report 6
Figure 8: Tourism receipts (THBm)
Title:
Source:
Please fill in the values above to have them entered in your report
See important disclosures at the end of this report 7
Positioning as a transit hub
Thailand is strategically located within a four-hour radius to China and India, the two most populated countries in the world.
Among the Asean nations, Thailand connects to most countries within a two-hour radius, ahead of other transit hubs such as Indonesia and Singapore, as well as the neighboring Indochina countries. Thailand is progressively positioning itself as a key transit hub connecting flights from the Middle East, India, Europe, North America and North Asia to other Asean countries and the South West Pacific countries (Australia and New Zealand). With its cheaper landing and parking rates, accommodative airport infrastructure and tourism appeal, Thailand’s position as a transit hub has attracted major carriers from all over the world.
Figure 10: At a sweet spot
Source: S-A-P
Minimum wage boost
Thailand’s new ruling Government mandated the implementation of minimum wages from 1 April 2012 to spur domestic spending. The new minimum wage of THB300 per day is on average 30%-40% higher for most states and a jump of up to 90% in some poorer areas. Meanwhile, corporate income tax, which had been cut from 30% to 23% in 2012, will be further slashed to 20% in 2013 to lessen the tax burden of employers. The population’s increasing propensity to spend will be positive for the broader economy, with the multiplier effect set to sustain air travel demand going forward, thus giving some upside to air fares and overall yields. We see LCCs as the biggest beneficiary to tap into Thailand’s growing low-cost passenger market.
Figure 11: Average monthly wage (THB)
Title:
Source:
Please fill in the values above to have them entered in your report
0
2,000
4,000
6,000
8,000
10,000
12,000
14,000
-15%
-10%
-5%
0%
5%
10%
15%
20%
25%
30%
Jan-0
2
Jul-0
2
Jan-0
3
Jul-0
3
Jan-0
4
Jul-0
4
Jan-0
5
Jul-0
5
Jan-0
6
Jul-0
6
Jan-0
7
Jul-0
7
Jan-0
8
Jul-0
8
Jan-0
9
Jul-0
9
Jan-1
0
Jul-1
0
Jan-1
1
Jul-1
1
Jan-1
2
Jul-1
2
Jan-1
3
Average Monthly Wage (THB) % y-o-y change
Source: CEIC
Among the Asean nations, Thailand connects to most countries within a two-hour radius, ahead of other transit hubs in Indonesia and Singapore, as well as the neighboring Indochina countries.
The population’s increasing propensity to spend augurs well for the broader economy, with the multiplier effect set to sustain air travel demand going forward.
Nok Airlines (NOK TB) 19 June 2013
See important disclosures at the end of this report 8
Company Profile
Background and history
Nok Air is a low-cost carrier (LCC) established back in 2004 under the name of Sky Asia. The carrier was founded by the Management team and backed by a private equity fund specializing in aviation investments and Thai Airways (BUY, FV: THB42.6). Since then, the number of investors has increased. The company started off with an initial capital outlay of THB500m and has not required additional capital injections.
Figure 12: Shareholding pre-IPO
Title:
Source:
Please fill in the values above to have them entered in your report
Asvinvichit, 5% King Power,
5%
SCB, 5%
CPB Equity, 6%
K' Patee, 5%
Aviation Investment,
25%
Thai Airways, 49%
Source: Company
Operations background
Nok Air operates out of Don Mueang Airport, serving domestic routes between major Thai cities and its second and third tier provinces. It has made earlier attempts to ply the international routes to India back in 2007 but was unable to operate feasibly, as opposed to more lucrative domestic routes. Furthermore, following the opening of the Suvanabhumi International Airport, airlines operating out of Don Mueang Airport were restricted from operating international scheduled flights. Since then, Nok Air had flown to international destinations only on a charter basis. However, the restriction to operate scheduled international flights out of Don Mueang Airport was lifted in mid-2012.
Although affiliated with Thai Airways, Nok Air operates independently and as its operation is based out of Don Muaeng, there is no cost sharing with Thai Airways.
Fleet
The fleet composition of Nok Air as of 31 March 2013:
Boeing 737-800: 10 aircraft with an average age of five to seven years. As this is a new generation Boeing aircraft, the seat capacity is 189 seats.
Boeing 737-400: two aircraft with an average age of eight years. Lower seat capacity of only 160 seats.
ATR 72-200/500: four aircraft with a seat capacity of 68 seats each.
SAAB 340B (operated by Nok Air’s partner, Siam General Aviation): five aircraft with an average seat capacity of 34 seats each.
Currently, all of Nok Air’s aircraft are under operating leases but with the cash proceeds from the IPO exercise, Nok Air intends to start owning its aircraft moving forward.
Nok Air started off with an initial capital outlay of THB500m and has not required additional capital injections
Nok Air operates out of Don Mueang Airport, plying domestic routes between major Thai cities and its second and third tier provinces.
Nok Air intends to start owning its aircraft moving forward.
Nok Airlines (NOK TB) 19 June 2013
See important disclosures at the end of this report 9
Note, however, that the five SAAB 340B aircraft are operated by another entity, Siam General Aviation. Under this arrangement, Nok Air generates revenue from ticket sales under the Nok Mini brand. Flight costs, also known as charter costs, are fixed and charged on a per flight basis.
Routes serviced by Nok Air
Nok Air is the dominant leader in terms of domestic route coverage given its extensive network and flight frequencies. Based on the number of passengers handled by Thailand’s low-cost carriers, Nok Air’s market share was estimated at 41% as Dec 2012. Nok Air does not operate any scheduled international flights.
Figure 13: Market share by % of passengers served
Title:
Source:
Please fill in the values above to have them entered in your report
41.3% 37.0% 34.9%
17.5% 21.2% 23.7%
24.6% 24.7% 26.6%
16.7% 17.1% 14.8%
0.0%
20.0%
40.0%
60.0%
80.0%
100.0%
120.0%
2010 2011 2012
Thai Airways Nok Air AirAsia Others
Source: DCA
Nok Air operates out of two hubs, Don Mueang and Chiang Mai airports, plying a total of 23 routes at an average of 483 round trips per week. Its domestic routes can be categorized into three distinct categories below:
Primary routes: Highly competitive routes to key cities and destinations served by many other carriers. Thailand’s primary routes handle more than 300,000 passengers per annum. These include routes out of Don Mueang to/from Chiang Mai, Udon Thani, Phuket, Hat Yai, Surat Thani, Nakhon Si Thammarat, Ubon Ratchathani and Chiang Rai.
Secondary routes: Currently served by three airlines, collectively ferrying around 50,000-300,000 passengers per annum. Nok Air currently serves three routes from its two hubs, ie Don Mueang-Trang, Don Mueang-Phitsanulok and Chiang Mai-Mae Hong Sorn.
Feeder routes: Currently, only two airlines serve feeder routes that cover third tier provinces, where airport infrastructure may be limited and thus are able to accommodate only smaller aircraft such as turbo props. These are the highly lucrative routes for Nok Air given the limited market competition. Nok Air currently serves a total of 12 routes. Its feeder route business has grown tremendously, as measured by flight frequency, from only 12 round trips per week in 2010 to 140 trips currently.
Nok also charters aircraft for the operations of its affiliated company Nok Mini.
Based on the number of passengers handled by Thailand’s low-cost carriers, Nok Air’s market share was estimated at 41% as of 2012.
Nok Air serves a total of 23 routes, operating an average of 483 round trips per week
Feeder routes to third tier provinces are Nok Air’s highest-yielding routes
Nok Airlines (NOK TB) 19 June 2013
See important disclosures at the end of this report 10
Figure 14: Routes served
Source: Company
As per Figure 14, among Thailand’s scheduled domestic routes, 11 feeder routes are served only by Nok Air with no rivals. The carrier has at least a 40% market share in eight of the other total routes, while the remaining ones are mostly competitive key major routes popularly served by other carriers.
Of the 23 scheduled domestic routes served, 11 feeder routes are served only by Nok Air with no rivals.
Figure 15: Nok Air has the most extensive route and destination coverage
Source: DCA, Ministry of Transportation
Nok Airlines (NOK TB) 19 June 2013
See important disclosures at the end of this report 11
Figure 16: Peers’ comparison of domestic route coverage (number of round trips per week)
Title:
Source:
Please fill in the values above to have them entered in your report
266 291 308
196
28
77 28
140
14
14
0
100
200
300
400
500
600
Nok Air AirAsia Thai Airways Bangkok Airways Orient Thai
Primary route Secondary route Feeder route
483
333308
210
28
Source: DCA
Figure 17: Historical growth of Nok Air’s flight frequency
Title:
Source:
Please fill in the values above to have them entered in your report
147
226259 266
39
49
63 77
12
56
126140
0
100
200
300
400
500
600
2010 2011 2012 Present
Feeder route
Secondary route
Primary route
198
331
448483
Source: DCA
Strategy and Future Plans
Nok Airlines (NOK TB) 19 June 2013
See important disclosures at the end of this report 12
Nok Air’s key strategic initiatives to chart its next growth phase:
Aggressive capacity expansion
Nok Air is expected to grow its fleet from 17 aircraft (excluding the five chartered aircraft for the Nok Mini brand) to 30 by end-2015.
Route expansion and frequency increase
These include plans to increase flight frequencies and create additional domestic inter-provincial routes. With the deliveries of new Boeing planes, Nok Air also aims to expand its route coverage to international routes such as Indochina, South-East Asia and China.
Fleet ownership
Nok Air’s IPO proceeds will be mostly used for future aircraft acquisitions. This will see it shift from running an asset-light strategy – it leases its fleet currently – to an asset-ownership strategy.
Improving operational efficiencies and scalability
With its aggressive aircraft expansion moving forward, Nok Air will be able to see costs improvements across the board.
Aggressive capacity expansion
Nok Air is currently rejuvenating its fleet as its existing B737-400 planes are aging, some of which are more than 20 years old. Two of its older existing ATRs will be disposed of. Nok Air is expected to have a net addition of 13 aircraft over the next three years, which comprise six ATRs and 12 B-737-800s. This will increase its fleet size from 17 aircraft (excluding five chartered aircraft for the Nok Mini brand) to 30 aircraft by end-2015.
With its fleet rejuvenation exercise, Management intends to reduce the average age of its aircraft from 13 years to seven years, which will reduce fuel consumption per seat by 12.8% and lower maintenance costs. These younger aircraft also will allow Nok Air to increase aircraft utilization hours from seven hours to 10 hours.
Fleet rejuvenation exercise will improve unit costs due to reduced fuel and maintenance costs.
Figure 18: Projected fleet growth
Title:
Source:
Please fill in the values above to have them entered in your report
610
3 3
3
810
1418
22
2
23
4 2
5
8
0
5
10
15
20
25
30
35
2010 2011 2012 1Q2013 2013F 2014F 2015F
Flee
t
ATR
B737-800
B737-400
15 14
1716
23
30
8
Source: Company
Nok Airlines (NOK TB) 19 June 2013
See important disclosures at the end of this report 13
Nok Air will have a fleet of new generation B737-800 used planes this June. As the new B737-800s has 18% more seat density with a total seat capacity of 189 seats per aircraft compared with 160 in the older B737-400s, the impact on capacity will be quite sizeable. Factoring in longer aircraft utilization hours, we estimate Nok Air’s available seat kilometer (ASK) is expected to increase from 2.9bn in 2012 to 7.2bn by 2017, representing a CAGR of 35% y-o-y.
Route expansion and frequency increases
Domestic expansion will continue to be Nok Air’s key focus market. The carrier plans to increase flight frequencies and open additional inter-provincial routes, such as to Krabi, Khonkhean, Narathiswas, Lumpang and Koh Samui.
We understand that Nok Air typically ends its operations by 7pm, after which aircraft utilization would be on a charter basis mostly flying to cities in China. However, with the capacity boost from the new aircraft deliveries, it intends to extend the operating hours of its scheduled flights beyond 7pm.
With the new deliveries of B737-800, which is more fuel efficient with an estimated 12.8% reduction per seat, Nok Air aims to expand its route coverage to international destinations – ie Indochina by 2H 2013 (mostly to Myanmar cities), China and South-East Asia by 2014, and possibly India in the longer run. However, Nok Air is taking a cautious approach in its global expansion by not penetrating into several countries simultaneously.
Having a fleet of its own
Nok Air’s IPO proceeds (of THB3.25bn) will be used mostly for future aircraft acquisitions. This will see it shift from running an asset-light strategy –it leases its fleet currently – to an asset-ownership strategy.
Over the immediate to medium term, Nok Air will start purchasing used ATRs, which are cheaper at a cost of around USD18m each.
Nok Air has no intention of purchasing the soon-to-be-delivered B737-800s, which will stay under operating lease, as Management prefers to own the upcoming new B737 Max model, which are deemed to be more fuel efficient. Boeing will make the first deliveries of the B737 Max to its customers in 2017, at the earliest.
Furthermore, Nok Air’s less aggressive approach in owning its own B737 fleet is also due to Management’s cautious stance in expanding into international routes. However, given the sizeable amount from the IPO raised, coupled with its growing cash pile on the back of strong future earnings, we foresee that Management may place advance orders for the B737 Max to secure deliveries in view of Boeing’s huge backlog.
We estimate Nok Air’s ASK to increase from 2.9bn in 2012 to 7.2bn by 2017, representing a CAGR of 35% y-o-y.
Nok Air will continue to focus on growing the domestic market due to its lucrative yields.
Nok Air will start purchasing ATRs while putting the plan to acquire B737-800s on hold.
Nok Airlines (NOK TB) 19 June 2013
See important disclosures at the end of this report 14
Competitive Advantage And Key Merits
Garnering premium yields
As depicted in the table below, our analysis shows that Nok Air’s premium yields mostly came from its high-yielding feeder routes. This is not surprising given the limited competition serving the feeder routes to Thailand’s second and third tier provinces and noting the fact that airlines typically generate the highest yields on shorter routes. Furthermore, with its mixed fleet composition, Nok Air is also able to rejig its capacity allocation to maximize yield generation. We believe this is how Nok Air has been able to generate relatively higher yields compared to its peers.
Figure 19: Revenue per pax based on route type (THB)
Title:
Source:
Please fill in the values above to have them entered in your report
1800 1794 1831
16751767 1762
25582414
2093
0
500
1000
1500
2000
2500
3000
2010 2011 2012
Primary Secondary Feeder
Source: RHB estimates, Company
As depicted in the figure below, Nok Air is ranked third in terms of yield generation among airlines in the region. The leader of the pack, Garuda’s domestic operations, share the same characteristics with Nok Air as the former also operates turbo prop aircraft to second and third tier provinces, which are high-yielding routes.
Figure 20: Comparison of FY12 passenger yields (THB)
Title:
Source:
Please fill in the values above to have them entered in your report
3.56
3.49
3.35
3.00
2.82
2.72
2.68
2.61
2.27
2.23
2.21
1.88
0.00 0.50 1.00 1.50 2.00 2.50 3.00 3.50 4.00
Garuda - Domestic
* Silk Air (FYE Mar 13)
Nok Air
Garuda - All
* Singapore Airlines (FYE Mar 13)
Thai Airways
Garuda - International
Malaysia Airlines
Cebu Air
Thai AirAsia
Malaysia AirAsia
Indonesia AirAsia
Source: RHB estimates, Company
*To standardize with peers for a meaningful comparison, our calculation on passenger yield is based on all
revenues earned from passengers and airline related businesses (inclusive of charter aircraft revenue and ancillary income) divided by total RPK (revenue passenger km)
Nok Air’s premium yields were mostly attributed to its high-yielding feeder routes.
Nok Air is ranked third by yield generation among airlines in the region.
Nok Airlines (NOK TB) 19 June 2013
See important disclosures at the end of this report 15
Nok Air’s passenger yields are expected to weaken as competition with AirAsia for some of the overlapping routes intensifies, as reflected in its weaker yield in 1QFY13, which declined 5% y-o-y. However, on a positive note, as it currently provides complimentary food onboard and baggage allowance of up to 15kg, there could be an upside to passenger yields on higher ancillary revenue should it start charging for these services to boost its yields and revenue.
Management, however, has no intention of charging for baggage below 15kg as the service remains a differentiating factor in its value proposition to passengers.
Figure 21: Passenger yields and revenue per available seat km (RASK) (THB)
Title:
Source:
Please fill in the values above to have them entered in your report
3.36 3.36 3.32 3.353.16
3.30 3.30 3.31
2.77 2.69 2.74 2.82 2.77 2.74 2.71 2.72
0.00
0.50
1.00
1.50
2.00
2.50
3.00
3.50
4.00
FY10 FY11 1QFY12 FY12 1QFY13 FY13f FY14f FY15f
Passenger Yield RASK
Source: RHB estimates, Company
* Our calculation on Passenger yield is based on all revenues earned from passengers and airline related businesses (inclusive of charter aircraft revenue and ancillary income) divided by total RPK (revenue
passenger km)
* RASK is calculated based on all revenues earned from passengers and airline related businesses (inclusive of charter aircraft revenue and ancillary income) divided by total ASK (available seat km)
First-mover advantage
Due to its scale of operations serving an extensive domestic coverage, Nok Air has the first-mover advantage in securing the best time slots. In addition, its turbo prop fleet gives it access to the limited runaway infrastructure at third tier provinces.
Extensive distribution channel
As Thailand’s internet penetration is still low in the second and third tier provinces, the need for an extensive distribution channel is very important. Nok Air’s extensive distribution channel extends not only to its booking platforms but also to the various choices of payment methods. For example, payment for a ticket booked over the phone can be made at Krungthai Bank’s outlets and ATMs.
Nok Air’s passenger yields are expected to weaken as competition with AirAsia for some of the overlapping routes intensifies.
Nok Air has the first-mover advantage in securing the best time slots.
Nok Airlines (NOK TB) 19 June 2013
See important disclosures at the end of this report 16
Capitalizing on AirAsia’s expansion
The approval by the Government to reopen Don Mueang Airport for international flights since mid-2012 last year and AirAsia’s move to the said airport has been a blessing in disguise for Nok Air, despite initial fears of intensifying competition due to potential overlapping routes. AirAsia’s move has since created some spillover traffic of connecting flights to Thailand’s second and third tier provinces, for which Nok Air is the only dominant player. These routes are still deemed underserved given the high load factor the carrier has consistently achieved.
The incentives dangled out to international carriers keen to shift to Don Mueang Airport from the congested Suvarnabhumi Airport, if successful, would translate to more spillover of traffic feeds for Nok Air. We understand that AirAsia X – a sister company of AirAsia serving long-haul routes – is in the midst of possibly setting up a second hub in Bangkok targeted to commence operations sometime in mid-2014.
While AirAsia’s presence bodes well for Nok Air in terms of traffic feeds for its domestic routes to second and tier provinces, it could be a hindrance for its international routes expansion due to potential overlapping routes.
Tax incentives
We gather from Management that Nok Air has received approval for an investment tax allowance on its existing fleet. Management has applied for tax allowances on future aircraft acquisitions until 2016 and expects to get the approvals in the coming months. These investment allowances comprise the exemptions of import duty, VAT on import, and corporate income tax for eight years. Management is not able to quantify the size of these investment allowances for now, but as a yardstick, based on the guidance of its airline peers, these tax incentives will reduce the effective tax rate to mid-teens, below the actual statutory tax rate.
Getting discounts at Don Mueang
Like AirAsia, which was incentivized to operate out of Don Mueang Airport (from Suvarnabhumi Airport earlier), Nok Air too will see a reduction in landing and parking fees from the incentives provided by Airports of Thailand (AOT; BUY, FV: THB188), with discounts of 30% in the first year (commenced in Oct 2012), 20% in the second year and 10% in the third.
Low breakeven load factor
Nok Air’s FY12 unit cost (cost per ASK) stood at a comfortable THB2.57/ASK, which translated to a breakeven load factor of 77%. This means that Nok Air will need to fill in 77% of total seats on average for it to break even, which is comfortably low considering that its load factor of 84.2% in FY12. Moving forward, given better economies of scale, we anticipate its unit cost to be further reduced. With new aircraft reducing its overall unit costs, Nok Air managed to lower its cost of available seat kilometers (CASK) by 14% y-o-y to THB2.36/ASK in 1QFY13. We expect Nok Air to cut CASK substantially to THB2.34/ASK by FY13, which would lower its breakeven load factor to 71%.
AirAsia’s move to Don Mueang has created some spillover traffic of connecting flights to the second and third tier provinces, for which Nok Air is the only dominant player.
Tax incentives will reduce the effective tax rate to mid-teens, below the actual statutory tax rate.
Nok Air too will see a reduction in landing and parking fees from the incentives provided by AOT.
Nok Airlines (NOK TB) 19 June 2013
See important disclosures at the end of this report 17
Figure 22: Cost per available seat km (CASK)
Title:
Source:
Please fill in the values above to have them entered in your report
2.36
2.572.74
2.57
2.36 2.34 2.34 2.31
1.59 1.571.72 1.64
1.52 1.45 1.43 1.41
0
0.5
1
1.5
2
2.5
3
FY10 FY11 1QFY12 FY12 1QFY13 FY13f FY14f FY15f
CASK CASK (ex fuel)
Source: RHB estimates
*CASK is calculated by totaling all operating expenses related to airline operations divided by the ASK
Figure 23: FY12 CASK comparison against peers
Title:
Source:
Please fill in the values above to have them entered in your report
1.32
1.39
1.65
1.83
2.26
2.28
2.44
2.45
2.57
2.59
2.74
0 0.5 1 1.5 2 2.5 3
Indonesia AirAsia
Malaysia AirAsia
Thai AirAsia
Cebu Air
Garuda - International
* Singapore Airlines (FY13)
Garuda - All
* Silk Air (FYE Mar 13)
Nok Air
Malaysia Airlines
Garuda - Domestic
Source: RHB estimates
* CASK is calculated by totaling all operating expenses related to airline operations divided by the ASK
Figure 24: FY12 breakeven load factor comparison against peers
Title:
Source:
Please fill in the values above to have them entered in your report
99%
84%
81%
81%
81%
77%
77%
74%
70%
70%
63%
0% 10% 20% 30% 40% 50% 60% 70% 80% 90% 100%
Malaysia Airlines
Garuda - International
Garuda - All
Cebu Air
* Singapore Airlines (FY13)
Garuda - Domestic
Nok Air
Thai AirAsia
Indonesia AirAsia
* Silk Air (FYE Mar 13)
Malaysia AirAsia
Source: RHB estimates
* Breakeven load factor is the minimum load factor needed to break even
Nok Airlines (NOK TB) 19 June 2013
See important disclosures at the end of this report 18
Risks While Thailand offers a compelling growth story, the potential risks that could dent demand for air travel include:
Global macroeconomic outlook: Thailand is a global manufacturing hub and leading exporter of automobiles, electronics, textiles, clothing and food. As such, a poor macroeconomic outlook could adversely affect demand for leisure travel, notably from overseas tourists.
Political instability: Frequent changes in the Government, street demonstrations and riots.
Diseases/ epidemics: An outbreak of a flu-related pandemic could cripple travel demand.
Weather and natural disasters: Frequent flash floods. For instance, the 2011 flood was the worst to have hit Thailand in 50 years. Nok Air suffered badly from the flood as it had to shift its operations to Suvarnabhumi Airport for a few months in 4QFY11 and 1QFY12. Operating at the said airport was costlier due to higher fuel expenses caused by runway congestion.
High jet fuel costs: These may drag down profits, making it unfeasible to operate routes that have high breakeven load factors.
Competition: More notably from the proliferation of low-cost carriers (LCCs).
High-speed rail networks: High-speed rail travel could be a more economical and reliable substitute for air travel. This would affect air routes that overlap with rail routes.
Of the six points above, political instability is the biggest headwind for Thailand’s aviation and tourism industry as such concerns will deter tourist arrivals. Thus far, the new Government remains accommodative with regard to the current aviation sector policy.
In the past decade, Thailand’s tourism industry has been rocked by one crisis after another, mostly by political-related events such as a military coup, the occupation of the capital's two airports by anti-Government protesters and street fighting that turned chaotic. However, these have been proven to be short-lived following quick recoveries as seen in the past.
Competition
Thailand has a low penetration rate for air travel compared to Singapore and even Malaysia. The population’s improving spending power will likely boost the long-term growth for air travel, especially with the recent proliferation of LCCs. This does not bode well for most full-service carriers – Garuda (BUY, FV IDR800) and Malaysia Airline System (MAS; NEUTRAL, FV: MYR0.41) – and will likely cap any upside to their yields.
While it is undeniable that competition is clearly intensifying, we believe that Nok Air has the upper hand in the domestic market with the first-mover advantage and high-yield feeder routes, as it has been able to secure the best time slots.
However, with AirAsia operating out of the same airport, and potentially other new LCCs as well, an expansion into international routes could prove more challenging.
Managing fuel cost volatility
As with any typical airline, fuel represents a key risk to profitability as it represents an average 40% of total operating costs. During the oil crisis back in 2008, Nok Air had to downsize its business due to a spike in oil prices. In 2012, jet fuel costs accounted for 37% of its total operating costs. Assuming an average jet fuel price of USD135 per barrel, we expect jet fuel costs to account for 39% of the total operating costs this year.
Thailand’s political turmoil has proven to be short-lived following quick recoveries as seen in the past.
Nok Airlines (NOK TB) 19 June 2013
See important disclosures at the end of this report 19
However, there is scope for further downside in jet fuel costs as YTD jet fuel has averaged only USD123 per barrel. Furthermore, Nok Air’s fleet renewal exercise is expected to improve fuel mileage moving forward, as we understand that its new B737-800 fleet is expected to cut unit seat fuel consumption by some 12.8% as opposed to its previous fleet of B737-400s. In an attempt to manage fuel costs, Management has also hedged 30% of its yearly fuel costs requirement. These hedging positions are physical in nature given the small volume it procures and will not be reflected in its balance sheet, thus allowing accounting transparency. This makes the assessment of profitability on its income statement more valid due to the absence of any hedging gains or losses from its derivative positions.
High-speed railway
Of the four high-speed rail routes set to be completed by 2018, only the Bangkok-Phitsanulok route will affect air travel. As this route will only account for less than 2% of total traffic handled by Airports of Thailand (AOT; BUY, FV: THB188), it is safe to say that airlines and AOT will not be impacted from now until 2022, when the high-speed railway extensions to the four original routes are completed.
By 2022, routes to Chiang Mai will be heavily affected as it is the leading domestic destination after Bangkok. Other smaller airports, such as Hat Yai, Surat Thani, Hua Hin and Ubon Ratchathani will also be hurt due to the railway accessibility. This would not bode well for the feeder routes currently served by Nok Air.
Assuming that the railways from China and Laos will also be linked by 2022, this too will eat into the market share of the aviation sector. Chinese visitors currently top visitor arrivals to Thailand. However, we estimate that not all Chinese tourists came directly from China as some may come from Hong Kong. In addition, we think long-distance travels are faster and more convenient by flight than by high-speed rail.
High-speed railway accessibility linking Thailand with its neighboring countries will boost logistics and economics of trades in the region. Accessibility to the north and north-eastern sides of the Kingdom will also enhance tourism activities there.
In conclusion, with rising spending propensity from increased urbanization, we see an overall positive net impact on Thailand’s aviation sector. This would offset any impact from declining passenger numbers caused by the overlapping high-speed rail routes over the longer run.
Nok Air’s fleet renewal exercise is expected to improve fuel mileage moving forward.
It is safe to say that airlines and AOT will not be significantly impacted by the high-speed railway from now until 2022.
Chiang Mai and other smaller airports, such as Hat Yai, Surat Thani, Hua Hin and Ubon Ratchathani, among others, will also be hurt due to the railway accessibility by 2022.
In view of rising spending propensity from increase urbanization, we see an overall positive net impact on Thailand’s aviation sector. This would offset any impact from declining passenger numbers caused by the overlapping high-speed rail routes over the longer run.
Nok Airlines (NOK TB) 19 June 2013
See important disclosures at the end of this report 20
Financials
Strong earnings growth profile
Nok Air’s aggressive fleet expansions – we estimate average ASK CAGR of 35% over the next three years – will see its revenue and earnings growing strongly. Thailand’s macro picture continues to be favorable on the back of higher income per capita, which should sustain air travel demand growth. This reinforces our view of a positive outlook for the carrier.
While yield growth is expected to moderate as competition intensifies on capacity expansion, earnings could come from better operating efficiencies on the back of greater economies of scale due to its growing fleet base. This is likely to be attributed to unit cost reduction from operating a younger fleet with a much more optimized seat configuration, which will lead to lower fuel consumption per kilometer and lower maintenance costs. Furthermore, its self-owned ATRs due to be delivered will also eliminate the higher charges of operating an aircraft under operation lease terms.
Margin-wise, Nok Air has been able to rake in fairly decent margins, with EBITDAR at a respectable 22.5% in FY12. However, this is still lower than the EBITDAR margins achieved by Malaysia’s AirAsia and Thai’s AirAsia at 28% and 27% respectively in FY12. With Nok Air’s fleet rejuvenation exercise kicking in, coupled with its aggressive expansion plans, we see margins likely to perk up moving forward due to economies of scale. As of 1QFY13, Nok Air’s margins had notched up to 28%.
Factoring in all these positive factors, we estimate that core earnings could grow by an impressive 86% for FY13, 27% for FY14 and 41% for FY15, which will translate to a CAGR of 49% over the three-year period.
Zero debt and high cash flow
Nok Air’s balance sheet is free from debts and this bodes well for future aircraft acquisitions, should the company feel the need to gear its balance sheet with heavy borrowings, which is a cheaper source of funding compared to equity.
In terms of cash flow, Nok Air probably generates the highest cash flow returns among Asean LCCs on the back of its lucrative feeder routes. We expect its annual operating cash flow to reach THB1.6bn come FY13. As of FY12, its cash balance including short-term investments amounted to THB1.66bn, up from THB1.25bn in FY11.
Capex
Moving forward, Nok Air will focus its fleet acquisitions in the near- to mid-term on ATRs priced at approximately USD18m each. The proceeds from the IPO will be utilized mostly on fleet acquisitions and deposits (advance payments) on future aircraft orders, while the remainder will be on working capital purposes and operation-related expenses, such as leasehold improvement, computer hardware and software, as well as other office equipment-related expenses. We project a capex of THB5.5bn over the next three years.
Dividends
In the prospectus, it was stated that the company’s dividend payout ratio, if any, would not be less than 25%. However, this is subject to the company’s performance and approval from its shareholders.
Nok Air has over the past two years paid out more than 50% of its earnings. Given its strong earnings outlook and high cash balance, this could again be the case for future dividends. We have assumed a 50% dividend payout over the next three years.
Given its high passenger yields and the potential for further cost reductions from its rejuvenated fleet, we reckon that Nok Air can sustain steady dividend payouts. In the past two years, it had paid out more than 50% of its earnings. We project a dividend per share of THB1.13 / THB1.44 / THB2.03 for FY13 / FY14 / FY15 respectively. At its IPO price of THB26 per share this translates into dividend yields of 4.3% / 5.5% / 7.8% for FY13 / FY14 / FY15 respectively.
We estimate that earnings could grow by an impressive 86% for FY13, 27% for FY14 and 41% for FY15, which will translate to a CAGR of 49% over the three-year period.
Nok Air’s balance sheet is free from any debts.
We project a capex of TH5bn over the next three years.
Nok Air has over the past two years paid out more than 50% of its earnings.
Nok Airlines (NOK TB) 19 June 2013
See important disclosures at the end of this report 21
Figure 25 Historical dividend track record and potential future payout
FY10 FY11 FY12 FY13F FY14F FY15F
Special dividends declared for the year (THBm) 0 0 300 0 0 0
Final Dividends declared for the year (THBm) 100 114 250 707 900 1268
Actual cash payment out (THBm) 0 100 414 250 707 900
Payout (%) 17% 57% 109% 50% 50% 50%
DPS based on post IPO share base (THB) 0.16 0.18 0.88 1.13 1.44 2.03
See important disclosures at the end of this report 22
1QFY13 Results Review
A strong start to the year
In 1QFY13, Nok Air’s revenue and earnings grew by 50% y-o-y and a whopping 4,424% y-o-y (45-fold) respectively, while its EBITDAR soared by 230% y-o-y. The strong growth was attributed to the 58% y-o-y growth in RPK (+49% y-o-y in ASK) and load factor nudging up by 4.9ppts to 87.6% over the same period. The ASK and RPK growth was contributed by the addition of two aircraft into its fleet (to 17 aircraft) as well as the improved seat optimization following the change of its Boeing fleet from B737-400s to B737-800s, which have 29 more seats (18% more seats) each. Fleet utilization also increased from 7.1 hours to 8.5 hours.
It is worth noting that in 4QFY11 and 1QFY12, Nok Air’s earnings took a hit as it had to operate out of Suvarnabhumi Airport as Don Mueang Airport was temporarily closed down due to the flooding. This caused Nok Air’s operating expenses to escalate due to higher fuel expenses incurred as Suvarnabhumi’s runway traffic was congested. In addition, Nok Air also saw weaker passenger loads. Nonetheless, Nok Air’s high y-o-y growth performance was not only attributed to the low base effect from the flood crisis, but also due to its fleet expansion.
However, passenger yields dropped 5% y-o-y in 1QFY13 as expected, weighed by efforts to boost load factor of its enlarged capacity, coupled with intensifying competition from AirAsia on some of its overlapping routes.
1QFY13 vs our FY13 estimate
With 1QFY13 operating metrics and earnings accounting for 24%-30% of our full-year forecast, the numbers are so far on track to meet our earnings estimates. Our projections are fairly conservative as we assume a high jet fuel price of USD135/barrel for FY13 vs. the current YTD average of USD123/barrel. Hence, there is scope for more earnings upgrade in the future.
* Our calculation on passenger yield is based on all revenues earned from passengers and airline related businesses (inclusive of charter aircraft revenue and ancillary income) divided by total RPK (revenue passenger km)
* RASK is calculated based on all revenues earned from passengers and airline related businesses (inclusive of charter aircraft
revenue and ancillary income) divided by total ASK (available seat km)
Nok Air’s revenue and earnings grew by 50% y-o-y and 4,424% y-o-y (45-fold) respectively, while EBITDAR expanded by 230% y-o-y.
So far, the company’s numbers are on track to meet our estimates.
Nok Airlines (NOK TB) 19 June 2013
See important disclosures at the end of this report 23
Valuation and Recommendation
Pricing premium for superior growth
We apply an adjusted EV/EBITDAR to value Nok Air as the carrier leases its aircraft rather than owning them. As such, a P/B assessment would prove to be unfeasible. Our capitalized fleet valuation is calculated by multiplying the carrier’s annual lease expenses by 8x to reflect its eight-year lease contracts. We use FY14 as its earnings base as investors are forward looking and by then Nok Air would have full-year contributions from its new B737-800s.
Valuations. We value Nok Air at THB37.6 per share, premised on an adjusted
FY14F EV to EBITDAR multiple of 7.5x. This implies an FY14F EV/EBITDA and P/E multiples of 7.1x and 13.1x respectively.
Nok Air’s FY14F EV/EBITDA of 4.05x is still at a 45% discount to its Asian LCC peers’ FY14F EV/EBITDA of 7.4x. At a CAGR of 49% for FY13-FY15 core earnings, this translates to a PEG of 0.3x, which is at a deep discount of 50% to its Asian peers’ average of 0.6x. We initiate coverage on Nok Air with a BUY call.
Figure 27: Valuation of Nok Air Capitalized Fleet Value (x 8 years) - THBm 16,766.1 Less: Net Cash - THBm 6,801.8
Nok Air NOK TB 527.3 11.5 9.0 6.5 4.1 3.1 46.0 0.2
31% 16% 28% 45% 51% -226% 63%Discount / (Premium) to Average Asia LCCs
Source: RHB estimates, Bloomberg
*Last price as of 18 June 2013 at respective local currencies
Nok Air is valued at 7.5x adjusted EV/EBITDAR giving it a FV of THB37.6. At a CAGR of 49% for FY13-FY15 core earnings, this translates to a PEG of 0.3x, which is at a deep discount of 50% to its Asian peers’ average of 0.6x
Nok Airlines (NOK TB) 19 June 2013
See important disclosures at the end of this report 24
* Our calculation on Passenger yield is based on all revenues earned from passengers and airline related businesses (inclusive of charter aircraft revenue and ancillary income) divided by total RPK (revenue passenger km)
* RASK is calculated based on all revenues earned from passengers and airline related businesses (inclusive of charter aircraft revenue and ancillary income) divided by total ASK (available seat km)
Nok Airlines (NOK TB) 19 June 2013
See important disclosures at the end of this report 25
Detailed Income Statement
Profit & Loss (THBm) Dec-10 Dec-11 Dec-12 Dec-13f Dec-14f Dec-15f
Revenue from fares 3970.8 5726.9 7634.3 10828.2 14236.1 18295.8
Revenue from charters 0.6 22.4 187.1 280.7 294.7 303.5
Revenue from value added services 208.3 298.9 396.2 609.7 741.7 898.9
Total revenue 4179.7 6039.3 8217.6 11718.5 15272.5 19498.2
Cost of fuel -1151.1 -2246.2 -2691.6 -3790.8 -5127.9 -6459.7
The aircraft maintenance -510.4 -968.2 -1276.4 -1874.7 -2420.6 -3018.5
Airport fees -213.9 -330.4 -352.3 0.0 0.0 0.0
Costs of airport services -162.8 -275.0 -339.7 -796.2 -970.6 -1098.7
Other variable costs -367.9 -468.9 -616.5 -678.2 -746.0 -820.6
Expenses for employees -296.0 -349.5 -423.4 -550.4 -715.5 -930.2
Insurance information -56.8 -95.4 -96.0 -97.9 -98.9 -99.9
The cost of acquiring and restoring aircraft 0.0 -12.0 -55.2 -205.6 -249.4 -185.3
Other fixed costs -0.9 -2.4 -2.6 -3.4 -4.4 -5.7
Selling and administrative expenses -403.9 -440.0 -514.0 -558.4 -478.8 -530.1
Return on average assets (%) 0.0 11.7 23.7 28.4 19.0
Return on average equity (%) 0.0 26.0 59.9 46.0 27.7
Net debt to equity (%) (143.0) (156.4) (186.5) (87.9) (85.8)
DPS 0.20 0.23 1.10 1.13 1.44
Recurrent cash flow per share 1.43 0.64 1.69 2.82 3.07
Source: Company data, RHB Estimates
Nok Airlines (NOK TB) 19 June 2013
See important disclosures at the end of this report 28
SWOT Analysis
Thailand is a popular tourism hub
Favorable demographics
Strong branding
Extensive booking and payment distribution channel
Earnings are susceptible to volatility in jet fuel prices
Intensifying competition in the low-cost carrier space
Bangkok to be AirAsia X’s second hub
Room to increase gearing to fund more aircraft acquisitions
More profit upside on economies of scale
Balance sheet is not strong enough for massive aircraft acquisitions
Venturing into international routes could be challenging due to intensifying competition
0%
20%
40%
60%
80%
100%
120%
140%
160%
180%
Jan
-10
Jan
-11
Jan
-12
Jan
-13
Jan
-14
P/E (x) vs EPS growth
P/E (x) (lhs) EPS growth (rhs)
0%
10%
20%
30%
40%
50%
60%
70%
Jan
-10
Jan
-11
Jan
-12
Jan
-13
Jan
-14
P/BV (x) vs ROAE
P/B (x) (lhs) Return on average equity (rhs)
Source: Company data, RHB Estimates Source: Company data, RHB Estimates
Company Profile Nok Air is one of Thailand’s leading low-cost carriers with the most extensive domestic route coverage. It operates out of two hubs, in Chiang Mai and Don Mueang.
29
RHB Guide to Investment Ratings Buy: Share price may exceed 10% over the next 12 months Trading Buy: Share price may exceed 15% over the next 3 months, however longer-term outlook remains uncertain Neutral: Share price may fall within the range of +/- 10% over the next 12 months Take Profit: Target price has been attained. Look to accumulate at lower levels Sell: Share price may fall by more than 10% over the next 12 months Not Rated: Stock is not within regular research coverage Disclosure & Disclaimer All research is based on material compiled from data considered to be reliable at the time of writing, but RHB does not make any representation or warranty, express or implied, as to its accuracy, completeness or correctness. No part of this report is to be construed as an offer or solicitation of an offer to transact any securities or financial instruments whether referred to herein or otherwise. This report is general in nature and has been prepared for information purposes only. It is intended for circulation to the clients of RHB and its related companies. Any recommendation contained in this report does not have regard to the specific investment objectives, financial situation and the particular needs of any specific addressee. This report is for the information of addressees only and is not to be taken in substitution for the exercise of judgment by addressees, who should obtain separate legal or financial advice to independently evaluate the particular investments and strategies. RHB, its affiliates and related companies, their respective directors, associates, connected parties and/or employees may own or have positions in securities of the company(ies) covered in this research report or any securities related thereto, and may from time to time add to, or dispose off, or may be materially interested in any such securities. Further, RHB, its affiliates and related companies do and seek to do business with the company(ies) covered in this research report and may from time to time act as market maker or have assumed an underwriting commitment in securities of such company(ies), may sell them or buy them from customers on a principal basis and may also perform or seek to perform significant investment banking, advisory or underwriting services for or relating to such company(ies), as well as solicit such investment, advisory or other services from any entity mentioned in this research report. RHB and its employees and/or agents do not accept any liability, be it directly, indirectly or consequential losses, loss of profits or damages that may arise from any reliance based on this report or further communication given in relation to this report, including where such losses, loss of profits or damages are alleged to have arisen due to the contents of such report or communication being perceived as defamatory in nature. The term “RHB” shall denote where applicable, the relevant entity distributing the report in the particular jurisdiction mentioned specifically herein below and shall refer to RHB Research Institute Sdn Bhd, its holding company, affiliates, subsidiaries and related companies. All Rights Reserved. This report is for the use of intended recipients only and may not be reproduced, distributed or published for any purpose without prior consent of RHB and RHB accepts no liability whatsoever for the actions of third parties in this respect. Malaysia This report is published and distributed in Malaysia by RHB Research Institute Sdn Bhd (233327-M), Level 11, Tower One, RHB Centre, Jalan Tun Razak, 50400 Kuala Lumpur, a wholly-owned subsidiary of RHB Investment Bank Berhad (RHBIB), which in turn is a wholly-owned subsidiary of RHB Capital Berhad. Singapore This report is published and distributed in Singapore by DMG & Partners Research Pte Ltd (Reg. No. 200808705N), a wholly-owned subsidiary of DMG & Partners Securities Pte Ltd, a joint venture between Deutsche Asia Pacific Holdings Pte Ltd (a subsidiary of Deutsche Bank Group) and OSK Investment Bank Berhad, Malaysia which have since merged into RHB Investment Bank Berhad (the merged entity is referred to as “RHBIB”, which in turn is a wholly-owned subsidiary of RHB Capital Berhad). DMG & Partners Securities Pte Ltd is a Member of the Singapore Exchange Securities Trading Limited. DMG & Partners Securities Pte Ltd may have received compensation from the company covered in this report for its corporate finance or its dealing activities; this report is therefore classified as a non-independent report. As of 18 June 2013, DMG & Partners Securities Pte Ltd and its subsidiaries, including DMG & Partners Research Pte Ltd do not have proprietary positions in the securities covered in this report, except for: a) - As of 18 June 2013, none of the analysts who covered the securities in this report has an interest in such securities, except for: a) - Special Distribution by RHB Where the research report is produced by an RHB entity (excluding DMG & Partners Research Pte Ltd) and distributed in Singapore, it is only distributed to "Institutional Investors", "Expert Investors" or "Accredited Investors" as defined in the Securities and Futures Act, CAP. 289 of Singapore. If you are not an "Institutional Investor", "Expert Investor" or "Accredited Investor", this research report is not intended for you and you should disregard this research report in its entirety. In respect of any matters arising from, or in connection with this research report, you are to contact our Singapore Office, DMG & Partners Securities Pte Ltd. Hong Kong This report is published and distributed in Hong Kong by RHB OSK Securities Hong Kong Limited (“RHBSHK”) (formerly known as OSK Securities Hong Kong Limited), a subsidiary of OSK Investment Bank Berhad, Malaysia which have since merged into RHB Investment Bank Berhad (the merged entity is referred to as “RHBIB”), which in turn is a wholly-owned subsidiary of RHB Capital Berhad. RHBSHK, RHBIB and/or other affiliates may beneficially own a total of 1% or more of any class of common equity securities of the subject company. RHBSHK, RHBIB and/or other affiliates may, within the past 12 months, have received compensation and/or within the next 3 months seek to obtain compensation for investment banking services from the subject company.
30
Risk Disclosure Statements The prices of securities fluctuate, sometimes dramatically. The price of a security may move up or down, and may become valueless. It is as likely that losses will be incurred rather than profit made as a result of buying and selling securities. Past performance is not a guide to future performance. RHBSHK does not maintain a predetermined schedule for publication of research and will not necessarily update this report Indonesia This report is published and distributed in Indonesia by PT RHB OSK Securities Indonesia (formerly known as PT OSK Nusadana Securities Indonesia), a subsidiary of OSK Investment Bank Berhad, Malaysia, which have since merged into RHB Investment Bank Berhad, which in turn is a wholly-owned subsidiary of RHB Capital Berhad. Thailand This report is published and distributed in Thailand by RHB OSK Securities (Thailand) PCL (formerly known as OSK Securities (Thailand) PCL), a subsidiary of OSK Investment Bank Berhad, Malaysia, which have since merged into RHB Investment Bank Berhad, which in turn is a wholly-owned subsidiary of RHB Capital Berhad. Other Jurisdictions In any other jurisdictions, this report is intended to be distributed to qualified, accredited and professional investors, in compliance with the law and regulations of the jurisdictions. DMG & Partners Research Guide to Investment Ratings Buy: Share price may exceed 10% over the next 12 months Trading Buy: Share price may exceed 15% over the next 3 months, however longer-term outlook remains uncertain Neutral: Share price may fall within the range of +/- 10% over the next 12 months Take Profit: Target price has been attained. Look to accumulate at lower levels Sell: Share price may fall by more than 10% over the next 12 months Not Rated: Stock is not within regular research coverage DISCLAIMERS This research is issued by DMG & Partners Research Pte Ltd and it is for general distribution only. It does not have any regard to the specific investment objectives, financial situation and particular needs of any specific recipient of this research report. You should independently evaluate particular investments and consult an independent financial adviser before making any investments or entering into any transaction in relation to any securities or investment instruments mentioned in this report. The information contained herein has been obtained from sources we believed to be reliable but we do not make any representation or warranty nor accept any responsibility or liability as to its accuracy, completeness or correctness. Opinions and views expressed in this report are subject to change without notice. This report does not constitute or form part of any offer or solicitation of any offer to buy or sell any securities. DMG & Partners Research Pte Ltd is a wholly-owned subsidiary of DMG & Partners Securities Pte Ltd, a joint venture between OSK Investment Bank Berhad, Malaysia which have since merged into RHB Investment Bank Berhad (the merged entity is referred to as “RHBIB” which in turn is a wholly-owned subsidiary of RHB Capital Berhad) and Deutsche Asia Pacific Holdings Pte Ltd (a subsidiary of Deutsche Bank Group). DMG & Partners Securities Pte Ltd is a Member of the Singapore Exchange Securities Trading Limited. DMG & Partners Securities Pte Ltd and their associates, directors, and/or employees may have positions in, and may effect transactions in the securities covered in the report, and may also perform or seek to perform broking and other corporate finance related services for the corporations whose securities are covered in the report. This report is therefore classified as a non-independent report. As of 18 June 2013, DMG & Partners Securities Pte Ltd and its subsidiaries, including DMG & Partners Research Pte Ltd, do not have proprietary positions in the subject companies, except for: a) - As of 18 June 2013, none of the analysts who covered the stock in this report has an interest in the subject companies covered in this report, except for: a) - DMG & Partners Research Pte. Ltd. (Reg. No. 200808705N)
Kuala Lumpur Hong Kong Singapore
Malaysia Research Office
RHB Research Institute Sdn Bhd Level 11, Tower One, RHB Centre
Jalan Tun Razak Kuala Lumpur
Malaysia Tel : +(60) 3 9280 2185 Fax : +(60) 3 9284 8693
RHB OSK Securities Hong Kong Ltd.
(formerly known as OSK Securities Hong Kong Ltd.) 12th Floor
World-Wide House 19 Des Voeux Road Central, Hong Kong
Tel : +(852) 2525 1118 Fax : +(852) 2810 0908
DMG & Partners
Securities Pte. Ltd. 10 Collyer Quay
#09-08 Ocean Financial Centre Singapore 049315
Tel : +(65) 6533 1818 Fax : +(65) 6532 6211
Jakarta Shanghai Phnom Penh
PT RHB OSK Securities Indonesia
(formerly known as PT OSK Nusadana Securities Indonesia)
Plaza CIMB Niaga 14th Floor
Jl. Jend. Sudirman Kav.25 Jakarta Selatan 12920, Indonesia
Tel : +(6221) 2598 6888 Fax : +(6221) 2598 6777
RHB OSK (China) Investment Advisory Co. Ltd.
(formerly known as OSK (China) Investment Advisory Co. Ltd.)
Suite 4005, CITIC Square 1168 Nanjing West Road
Shanghai 20041 China
Tel : +(8621) 6288 9611 Fax : +(8621) 6288 9633
RHB OSK Indochina Securities Limited
(formerly known as OSK Indochina Securities Limited) No. 1-3, Street 271