IRM: Integrated Region Matching for Image Retrieval Jia Li Palo Alto Research Center Xerox Corporation Palo Alto, CA 94304 [email protected]James Z. Wang Dept. of Computer Science Stanford University Stanford, CA 94305 [email protected]Gio Wiederhold Dept. of Computer Science Stanford University Stanford, CA 94305 [email protected]ABSTRACT 1. INTRODUCTION 1.1 Related Work
Transcript
IRM: Integrated Region Matching for Image Retrieval�
ABSTRACTContent-based image retrieval using region segmentation hasbeen an active research area. We present IRM (IntegratedRegion Matching), a novel similarity measure for region-based image similarity comparison. The targeted imageretrieval systems represent an image by a set of regions,roughly corresponding to objects, which are characterized byfeatures re ecting color, texture, shape, and location prop-erties. The IRM measure for evaluating overall similaritybetween images incorporates properties of all the regions inthe images by a region-matching scheme. Compared withretrieval based on individual regions, the overall similarityapproach reduces the in uence of inaccurate segmentation,helps to clarify the semantics of a particular region, andenables a simple querying interface for region-based imageretrieval systems. The IRM has been implemented as a partof our experimental SIMPLIcity image retrieval system. Theapplication to a database of about 200,000 general-purposeimages shows exceptional robustness to image alterationssuch as intensity variation, sharpness variation, color dis-tortions, shape distortions, cropping, shifting, and rotation.Compared with several existing systems, our system in gen-eral achieves more accurate retrieval at higher speed.
1. INTRODUCTIONWith the steady growth of computer power, rapidly declin-ing cost of storage, and ever-increasing access to the Inter-net, digital acquisition of information has become increas-ingly popular in recent years. Digital information is prefer-able to analog formats because of convenient sharing and
�This work was supported in part by the National ScienceFoundation's Digital Libraries initiative. The authors wouldlike to thank the help of Oscar Firschein and anonymousreviewers. An on-line demonstration is provided at URL:http://WWW-DB.Stanford.EDU/IMAGE/yResearch performed when the author was with StanfordUniversity.zAlso of Medical Informatics, Stanford University.
distribution properties. This trend has motivated researchin image databases, which were nearly ignored by traditionalcomputer systems due to the enormous amount of data nec-essary to represent images and the di�culty of automaticallyanalyzing images. Currently, storage is less of an issue sincehuge storage capacity is available at low cost. However, ef-fective indexing and searching of large-scale image databasesremains as a challenge for computer systems. The auto-matic derivation of semantics from the content of an imageis the focus of interest for most research on image databases.Image semantics has several levels: semantic types, objectcomposition, abstract semantics, and detailed semantics.
1.1 Related WorkContent-based image retrieval is de�ned as the retrieval ofrelevant images from an image database based on auto-matically derived imagery features. The need for e�cientcontent-based image retrieval has increased tremendously inmany application areas such as biomedicine, crime preven-tion, military, commerce, culture, education, entertainment,and Web image classi�cation and searching.
There are many general-purpose image search engines. Inthe commercial domain, IBM QBIC [3, 16] is one of the ear-liest developed systems. Recently, additional systems havebeen developed at IBM T.J.Watson [23], VIRAGE [5], NECAMORA [14], Bell Laboratory [15], Interpix (Yahoo), Ex-calibur, and Scour.net. In the academic domain, MIT Pho-tobook [17, 18] is one of the earliest. Berkeley Blobworld [1],Columbia VisualSEEK and WebSEEK [22], CMU Informe-dia [24], UIUC MARS [12], UCSB NeTra [10], UCSD, Stan-ford (EMD [19], WBIIS [26]) are some of the recent systems.
Existing general-purpose CBIR systems roughly fall intothree categories depending on the signature extraction ap-proach used: histogram, color layout, and region-based search.There are also systems that combine retrieval results fromindividual algorithms by a weighted sum matching met-ric [5], or other merging schemes [20].
Histogram search [16, 19] characterizes an image by its colordistribution, or histogram. The drawback of a global his-togram representation is that information about object lo-cation, shape, and texture is discarded. Color histogramsearch is sensitive to intensity variation, color distortions,and cropping.
The color layout approach attempts to mitigate the prob-
lems with histogram search. For traditional color layoutindexing [16], images are partitioned into blocks and theaverage color of each block is stored. Thus, the color lay-out is essentially a low resolution representation of the orig-inal image. A later system, WBIIS [26], uses signi�cantDaubechies' wavelet coe�cients instead of averaging. Byadjusting block sizes or the levels of wavelet transforms, thecoarseness of a color layout representation can be tuned.The �nest color layout using a single pixel block is merelythe original image. We can hence view a color layout repre-sentation as an opposite extreme of a histogram. At properresolutions, the color layout representation naturally retainsshape, location, and texture information. However, as withpixel representation, although information such as shape ispreserved in the color layout representation, the retrievalsystem cannot \see" it explicitly. Color layout search is sen-sitive to shifting, cropping, scaling, and rotation becauseimages are characterized by a set of local properties.
Region-based retrieval systems attempt to overcome the de-�ciencies of color layout search by representing images atthe object-level. A region-based retrieval system appliesimage segmentation to decompose an image into regions,which correspond to objects if the decomposition is ideal.The object-level representation is intended to be close tothe perception of the human visual system (HVS).
Since the retrieval system has identi�ed objects in the im-age, it is relatively easy for the system to recognize similarobjects at di�erent locations and with di�erent orientationsand sizes. Region-based retrieval systems include the Ne-tra system [10], the Blobworld system [1], and the querysystem with color region templates [23]. We have devel-oped SIMPLIcity (Semantics-sensitive Integrated Matchingfor Picture LIbraries), a region-based image retrieval sys-tem, using high-level semantics classi�cation [27].
The NeTra and the Blobworld systems compare images basedon individual regions. Although querying based on a lim-ited number of regions is allowed, the query is performed bymerging single-region query results. Because of the great dif-�culty of achieving accurate segmentation, systems in [10, 1]tend to partition one object into several regions with none ofthem being representative for the object, especially for im-ages without distinctive objects and scenes. Consequently,it is often di�cult for users to determine which regions andfeatures should be used for retrieval.
Not much attention has been paid to developing similaritymeasures that combine information from all of the regions.One e�ort in this direction is the querying system devel-oped by Smith and Li [23]. Their system decomposes animage into regions with characterizations pre-de�ned in a�nite pattern library. With every pattern labeled by a sym-bol, images are then represented by region strings. Regionstrings are converted to composite region template (CRT)descriptor matrices re ecting the relative ordering of sym-bols. Similarity between images is measured by the closenessbetween the CRT descriptor matrices. This measure is sen-sitive to object shifting since a CRT matrix is determinedsolely by the ordering of symbols. Robustness to scaling androtation is not considered by the measure either. Becausethe de�nition of the CRT descriptor matrix relies on the
pattern library, the system performance depends criticallyon the library. Performance degrades if regions in an im-age are not represented in the library. The system in [23]uses a CRT library with patterns described only by color.In particular, the patterns are obtained by quantizing colorspace. If texture and shape features are added to distin-guish patterns, the number of patterns in the library willincrease dramatically, roughly exponentially in the numberof features if patterns are obtained by uniformly quantizingfeatures.
1.2 Overview of IRMTo re ect semantics more precisely by the region represen-tation, we have developed IRM, a similarity measure of im-ages based on region representations. IRM incorporates theproperties of all the segmented regions so that informationabout an image can be fully used. Region-based matchingis a di�cult problem because of inaccurate segmentation.Semantically-precise image segmentation is extremely di�-cult [21, 11, 28, 7, 8] and is still an open problem in computervision. For example, segmentation algorithm may segmentan image of a dog into two regions: the dog and the back-ground. The same algorithm may segment another imageof a dog into six regions: the body of the dog, the frontleg(s) of the dog, the rear leg(s) of the dog, the eye(s), thebackground grass, and the sky.
The IRM measure we have developed has the following ma-jor advantages:
1. Compared with retrieval based on individual regions,the overall similarity approach in IRM reduces the ad-verse e�ect of inaccurate segmentation, an importantproperty that previous work has virtually overlooked.
2. In many cases, knowing that one object usually ap-pears with another object helps to clarify the semanticsof a particular region. For example, owers typicallyappear with green leaves, and boats usually appearwith water.
3. By de�ning an overall image-to-image similarity mea-sure, the system provides users with a simple queryinginterface. To complete a query, a user only needs tospecify the query image. If desired, the system canalso be adjusted to allow users to query based on aspeci�c region or a few regions.
To de�ne the similarity measure, we �rst attempt to matchregions in two images. Being aware that segmentation can-not be perfect, we \soften" the matching by allowing one re-gion of an image to be matched to several regions of anotherimage. Here, a region-to-region match is obtained when theregions are relatively similar to each other in terms of thefeatures extracted.
The principle of matching is that the closest region pair ismatched �rst. We call this matching scheme Integrated Re-gion Matching (IRM) to stress the incorporation of regionsin the retrieval process. After regions are matched, the sim-ilarity measure is computed as a weighted sum of the simi-larity between region pairs, with weights determined by the
A 3-D feature space
Image 2
Image 1
Featurepoints of
points ofFeature
A region-to-regionmatch
A 3-D feature space
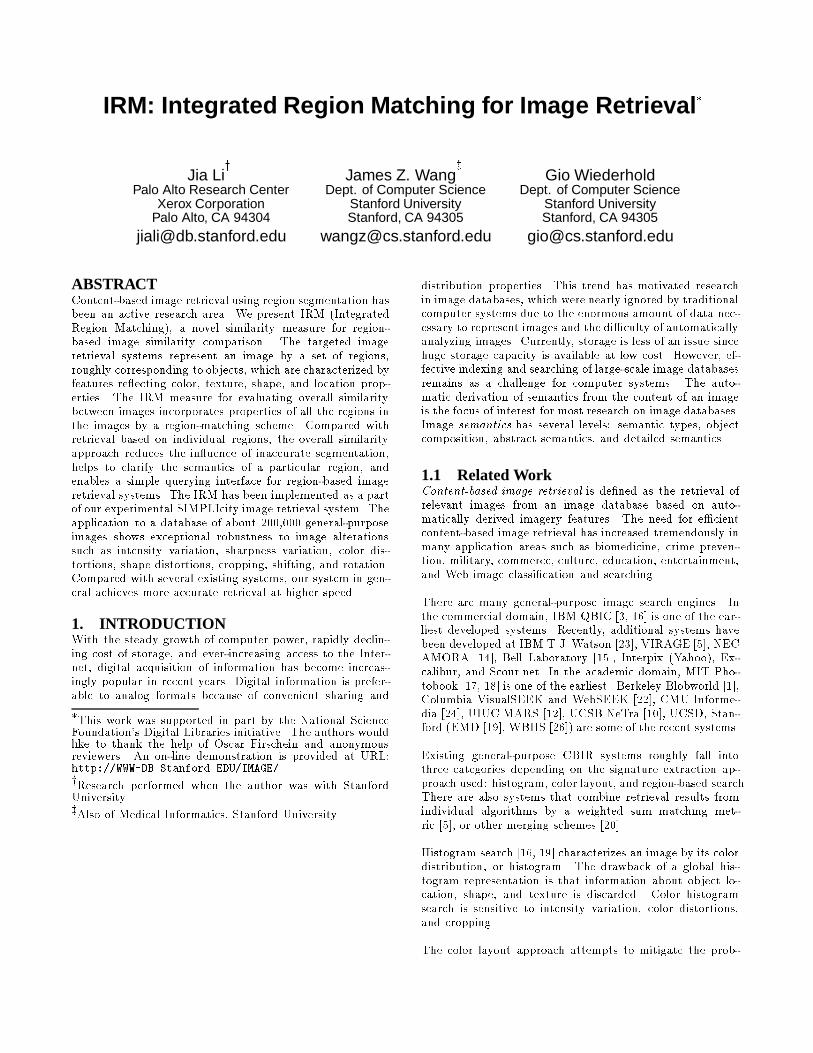
Figure 1: Region-to-region matching results are incorporated in the Integrated Region Matching (IRM)metric. A 3-D feature space is shown to illustrate the concept.
matching scheme. Figure 1 illustrates the concept of IRMin a 3-D feature space. The features we extract on the seg-mented regions are of high dimensions. The problem is muchmore sophisticated in a high-dimensional feature space.
1.3 Outline of the PaperThe remainder of the paper is organized as follows. In Sec-tion 2, the similarity measure based on segmented regions isde�ned. In Section 3, we describe the experiments we haveperformed and provide results. We conclude in Section 4.
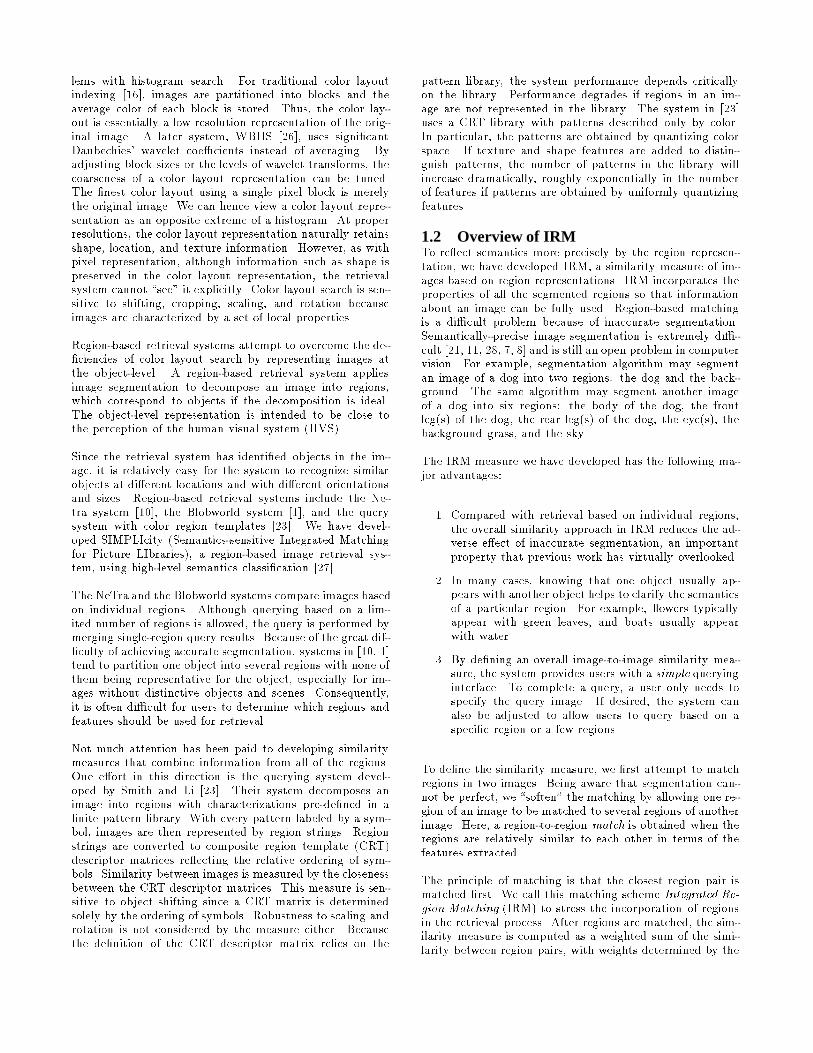
2. THE SIMILARITY MEASURE2.1 Image SegmentationThe similarity measure is de�ned based on segmented re-gions of images. Our system segments images based on colorand frequency features using the k-means algorithm [6]. Forgeneral-purpose images such as the images in a photo libraryor the images on the World-Wide Web (WWW), preciseobject segmentation is nearly as di�cult as computer se-mantics understanding. Semantically-precise segmentation,however, is not crucial to our system because we use a morerobust integrated region-matching (IRM) scheme which isinsensitive to inaccurate segmentation (Figure 2).
match
# regions = 2# regions = 6
Traditional region-based matching
match
# regions = 2# regions = 6
match
no match
Integrated Region Matching (IRM)
Figure 2: Integrated Region Matching (IRM) is ro-bust to poor image segmentation.
To segment an image, the system partitions the image into
blocks with 4�4 pixels and extracts a feature vector for eachblock. We choose this block size to optimize between texturee�ectiveness and segmentation coarseness. The k-means al-gorithm is used to cluster the feature vectors into severalclasses with every class corresponding to one region in thesegmented image. An alternative to the block-wise segmen-tation is a pixel-wise segmentation by forming a windowcentered around every pixel.
The segmentation results are available on the demonstra-tion web site. One main advantage of using the k-meansclustering algorithm for segmentation is that blocks in eachcluster does not have to be neighboring blocks. This way, wepreserve the natural clustering of objects and allow classi�-cation of textured images [9]. The number of regions, k, isselected adaptively. Experimental results have shown thatthe system is insensitive to the number of regions segmented.
Six features are used for segmentation. Three of them arethe average color components in a 4 � 4 block. The otherthree represent energy in high frequency bands of the wavelettransforms [2, 13], that is, the square root of the second or-der moment of wavelet coe�cients in high frequency bands.We use the well-known LUV color space, where L encodesluminance, and U and V encode color information (chromi-nance).
To obtain the other three features, a Daubechies-4 wavelettransform is applied to the L component of the image. Af-ter a one-level wavelet transform, a 4 � 4 block is decom-posed into four frequency bands: the LL, LH, HL, and HHbands [2]. Each band contains 2 � 2 coe�cients. Withoutloss of generality, suppose the coe�cients in the HL bandare fck;l; ck;l+1; ck+1;l; ck+1;l+1g. One feature is:
f =
1
4
1Xi=0
1Xj=0
c2k+i;l+j
! 1
2
:
The other two features are computed similarly from the LHand HH bands. The motivation for using the features ex-tracted from high frequency bands is that they re ect tex-ture properties. Moments of wavelet coe�cients in variousfrequency bands have been shown to be e�ective for repre-senting texture [25]. The intuition behind this is that coe�-cients in di�erent frequency bands show variations in di�er-ent directions. For example, the HL band shows activitiesin the horizontal direction. An image with vertical stripsthus has high energy in the HL band and low energy in theLH band.
2.2 Integrated Region Matching (IRM)In this section, we de�ne the similarity measure between twosets of regions. Assume that Image 1 and 2 are representedby region sets R1 = fr1; r2; :::; rmg and R2 = fr01; r
02; :::; r
0ng,
where ri or r0i is the descriptor of region i. Denote thedistance between region ri and r0j as d(ri; r
0j), which is writ-
ten as di;j in short. Details about features included in riand the de�nition of d(ri; r
0j) will be discussed later. To
compute the similarity measure between region sets R1 andR2, d(R1;R2), we �rst match all regions in the two images.When we judge the similarity of two animal photographs, weusually compare the animals in the images before comparingthe background areas in the images. The overall similarity ofthe two images depends on the closeness in the two aspects.The correspondence between objects in the images is crucialto our judgment of similarity since it would be meaninglessto compare the animal in one image with the background inanother. Our IRM matching scheme aims at building cor-respondence between regions that is consistent with humanperception. To increase robustness against segmentation er-rors, we allow a region to be matched to several regions inanother image. A matching between ri and r0j is assignedwith a signi�cance credit si;j , si;j � 0. The signi�cancecredit indicates the importance of the matching for deter-mining similarity between images. The matrix S = fsi;jg,1 � i � n, 1 � j � m, is referred to as the signi�cancematrix.
s2,4s1,1
1 2 3
a b dc
Image 1
Image 2
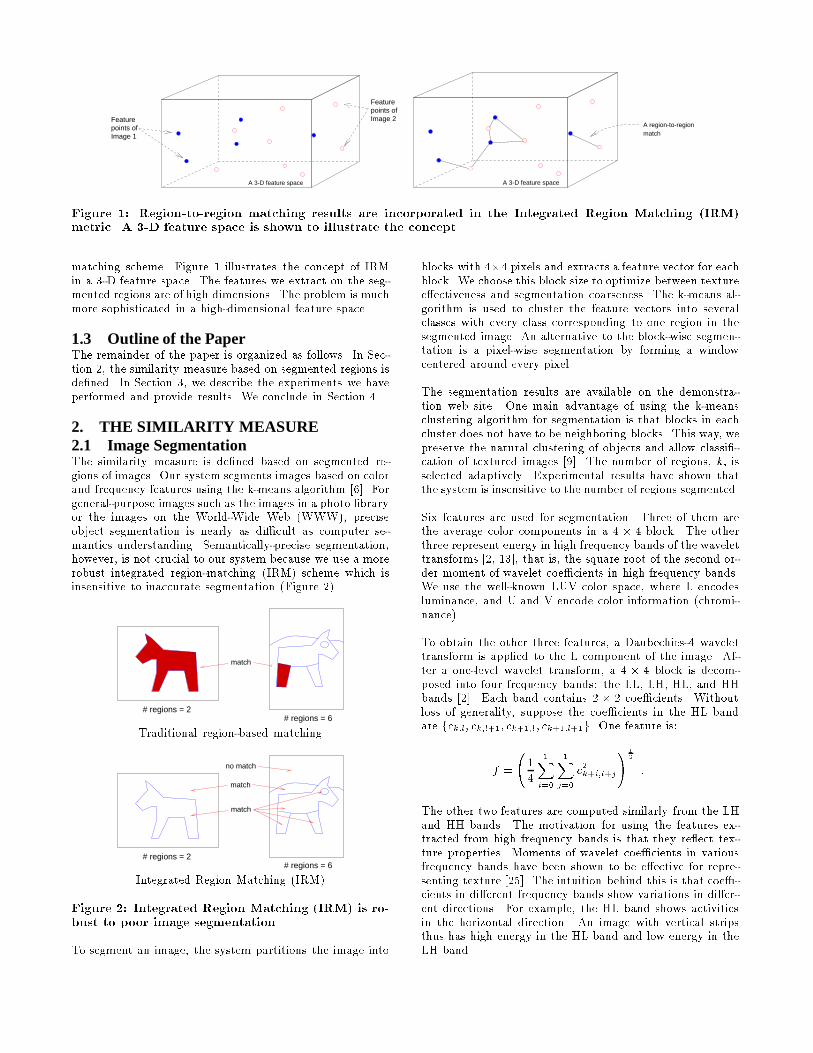
Figure 3: Integrated region matching (IRM) allowsone region to be matched to several regions.
A graphical explanation of the integrated matching schemeis provided in Figure 3. The �gure shows that matching be-tween images can be represented by an edge weighted graphin which every vertex in the graph corresponds to a region.If two vertices are connected, the two regions are matchedwith a signi�cance credit being the weight on the edge. Todistinguish from matching two sets of regions, we refer tothe matching of two regions as they are linked. The lengthof an edge can be regarded as the distance between the tworegions represented. If two vertices are not connected, thecorresponding regions are either from the same image or thesigni�cance credit of matching them is zero. Every match-ing between images is characterized by links between regionsand their signi�cance credits. The matching used to com-pute the distance between two images is referred to as theadmissible matching. The admissible matching is speci�edby conditions on the signi�cance matrix. If a graph rep-resents an admissible matching, the distance between thetwo region sets is the summation of all the weighted edgelengths, i.e.,
d(R1; R2) =Xi;j
si;jdi;j :
We call this distance the integrated region matching (IRM)distance.
The problem of de�ning distance between region sets is thenconverted to choosing the signi�cance matrix S. A naturalissue to raise is what constraints should be put on si;j so thatthe admissible matching yields good similarity measure. Inother words, what properties do we expect an admissiblematching to possess? The �rst property we want to enforceis the ful�llment of signi�cance. Assume that the signi�-cance of ri in Image 1 is pi, and r0j in Image 2 is p0j , werequire that
nXj=1
si;j = pi; i = 1; :::;m
mXi=1
si;j = p0j; j = 1; :::;n :
For normalization, we havePm
i=1 pi =Pn
j=1 p0j = 1. The
ful�llment of signi�cance ensures that all the regions play arole for measuring similarity. We also require an admissi-ble matching to link the most similar regions at the highestpriority. For example, if two images are the same, the ad-missible matching should link a region in Image 1 only to thesame region in Image 2. With this matching, the distancebetween the two images equals zero, which coincides withour intuition. Following the \most similar highest priority(MSHP)" principle, the IRM algorithm attempts to ful�llthe signi�cance credits of regions by assigning as much sig-ni�cance as possible to the region link with minimum dis-tance. Initially, assume that di0 ;j0 is the minimum distance,we set si0;j0 = min(pi0 ; p
0j0). Without loss of generality, as-
sume pi0 � p0j0 . Then si0;j = 0, for j 6= j0 since the link
between region i0 and j0 has �lled the signi�cance of regioni0. The signi�cance credit left for region j0 is reduced top0j0 � pi0 . The updated matching problem is then solving
si;j , i 6= i0, by the MSHP rule under constraints:
nXj=1
si;j = pi 1 � i � m; i 6= i0
Xi:1�i�m;i6=i0
si;j = p0j 1 � j � n; j 6= j0
Xi:1�i�m;i6=i0
si;j0 = p0j0 � pi0
si;j � 0 1 � i �m; i 6= i0; 1 � j � n :
We apply the previous procedure to the updated problem.The iteration stops when all the signi�cance credits pi andp0j have been assigned. The algorithm is summarized asfollows.
1. Set L = fg, denote M = f(i; j) : i = 1; :::;m; j =1; :::;ng.
2. Choose the minimum di;j for (i; j) 2 M � L. Labelthe corresponding (i; j) as (i0; j0).
3. min(pi0 ; p0j0 )! si0;j0 .
4. If pi0 < p0j0 , set si0;j = 0, j 6= j0; otherwise, set si;j0 =
0, i 6= i0.
5. pi0 �min(pi0 ; p0j0)! pi0 .
6. p0j0 �min(pi0 ; p0j0 )! p0j0 .
7. L + f(i0; j0)g ! L.
8. IfPm
i=1 pi > 0 andPn
j=1 p0j > 0, go to Step 2; other-
wise, stop.
We now come to the issue of choosing pi. The value of piis chosen to re ect the signi�cance of region i in the image.If we assume that every region is equally important, thenpi = 1=m, where m is the number of regions. In the casethat Image 1 and Image 2 have the same number of regions,a region in Image 1 is matched exclusively to one region inImage 2. Another choice of pi is the percentage of the imagecovered by region i based on the view that important objectsin an image tend to occupy larger areas. We refer to thisassignment of pi as the area percentage scheme. This schemeis less sensitive to inaccurate segmentation than the uniformscheme. If one object is partitioned into several regions, theuniform scheme raises its signi�cance improperly, whereasthe area percentage scheme retains its signi�cance. On theother hand, if objects are merged into one region, the areapercentage scheme assigns relatively high signi�cance to theregion. The current implementation of the system uses thearea percentage scheme.
The scheme of assigning signi�cance credits can also takeregion location into consideration. For example, higher sig-ni�cance may be assigned to regions in the center of an imagethan to those around boundaries. Another way to count lo-cation in the similarity measure is to generalize the de�nitionof the IRM distance to d(R1;R2) =
Pi;j si;jwi;jdi;j . The
parameter wi;j is chosen to adjust the e�ect of region i andj on the similarity measure. In the current system, regionsaround boundaries are slightly down-weighted by using thisgeneralized IRM distance.
2.3 Distance Between RegionsThe distance between a region pair, d(r; r0), is determined bythe color, texture, and shape characteristics of the regions.We have described in Section 2.1 the features used by the k-means algorithm for segmentation. The mean values of thesefeatures in one cluster are used to represent color and texturein the corresponding region. To describe shape, normalizedinertia [4] of order 1 to 3 are used. For a region H in kdimensional Euclidean space Rk, its normalized inertia oforder is
l(H; ) =
RHkx� x̂k dx
[V (H)]1+ =k
where x̂ is the centroid of H and V (H) is the volume of H.Since an image is speci�ed by pixels on a grid, the discreteform of the normalized inertia is used, that is,
l(H; ) =
Px:x2H kx� x̂k
[V (H)]1+ =k
where V (H) is the number of pixels in region H. The nor-malized inertia is invariant with scaling and rotation. Theminimum normalized inertia is achieved by spheres. Denotethe th order normalized inertia of spheres as L . We de�neshape features as l(H; ) normalized by L :
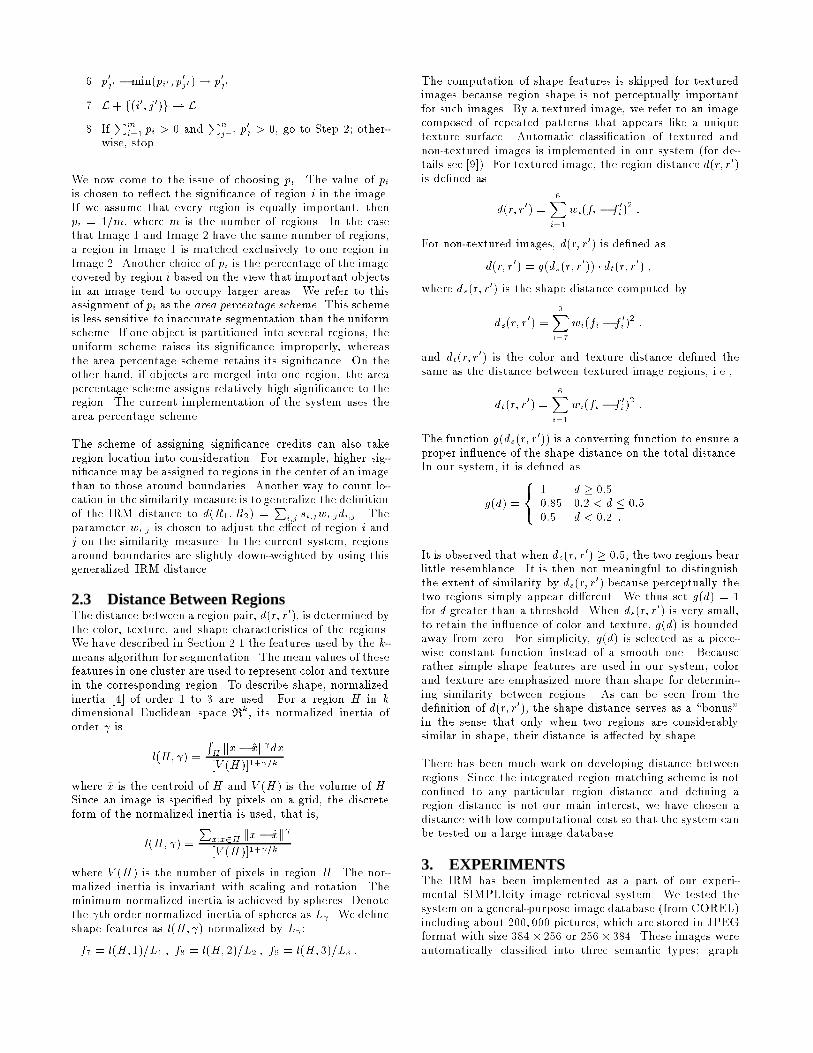
The computation of shape features is skipped for texturedimages because region shape is not perceptually importantfor such images. By a textured image, we refer to an imagecomposed of repeated patterns that appears like a uniquetexture surface. Automatic classi�cation of textured andnon-textured images is implemented in our system (for de-tails see [9]). For textured image, the region distance d(r; r0)is de�ned as
d(r; r0) =6X
i=1
wi(fi � f 0i)2 :
For non-textured images, d(r; r0) is de�ned as
d(r; r0) = g(ds(r; r0)) � dt(r; r
0) ;
where ds(r; r0) is the shape distance computed by
ds(r; r0) =
9Xi=7
wi(fi � f 0i)2 ;
and dt(r; r0) is the color and texture distance de�ned the
same as the distance between textured image regions, i.e.,
dt(r; r0) =
6Xi=1
wi(fi � f 0i)2 :
The function g(ds(r; r0)) is a converting function to ensure a
proper in uence of the shape distance on the total distance.In our system, it is de�ned as
g(d) =
8<:
1 d � 0:50:85 0:2 < d � 0:50:5 d < 0:2 :
It is observed that when ds(r; r0) � 0:5, the two regions bear
little resemblance. It is then not meaningful to distinguishthe extent of similarity by ds(r; r
0) because perceptually thetwo regions simply appear di�erent. We thus set g(d) = 1for d greater than a threshold. When ds(r; r
0) is very small,to retain the in uence of color and texture, g(d) is boundedaway from zero. For simplicity, g(d) is selected as a piece-wise constant function instead of a smooth one. Becauserather simple shape features are used in our system, colorand texture are emphasized more than shape for determin-ing similarity between regions. As can be seen from thede�nition of d(r; r0), the shape distance serves as a \bonus"in the sense that only when two regions are considerablysimilar in shape, their distance is a�ected by shape.
There has been much work on developing distance betweenregions. Since the integrated region matching scheme is notcon�ned to any particular region distance and de�ning aregion distance is not our main interest, we have chosen adistance with low computational cost so that the system canbe tested on a large image database.
3. EXPERIMENTSThe IRM has been implemented as a part of our experi-mental SIMPLIcity image retrieval system. We tested thesystem on a general-purpose image database (from COREL)including about 200; 000 pictures, which are stored in JPEGformat with size 384� 256 or 256� 384. These images wereautomatically classi�ed into three semantic types: graph
(clip art), textured photograph, and non-textured photo-graph [9]. For each image, the features, locations, and areasof all its regions are stored.
Compared with two color histogram systems [19] and theWBIIS (Wavelet-Based Image Indexing and Searching) sys-tem [26], our system in general achieves more accurate re-trieval at higher speed. However, it is di�cult to designa fair comparison with existing region-based searching al-gorithms such as the Blobworld system which depends onmanually de�ned complicated queries. An on-line demon-stration is provided1 . Readers are encouraged to visit theweb site since we cannot show many examples here due tolimited space.
3.1 AccuracyThe SIMPLIcity system was compared with the WBIIS sys-tem using the same image database. As WBIIS forms imagesignatures using wavelet coe�cients in the lower frequencybands, it performs well with relatively smooth images, suchas most landscape images. For images with details crucialto semantics, such as pictures containing people, the per-formance of WBIIS degrades. In general, the SIMPLIcitysystem performs as well as WBIIS for smooth landscapeimages. Examples are omitted due to limited space.
SIMPLIcity
WBIIS
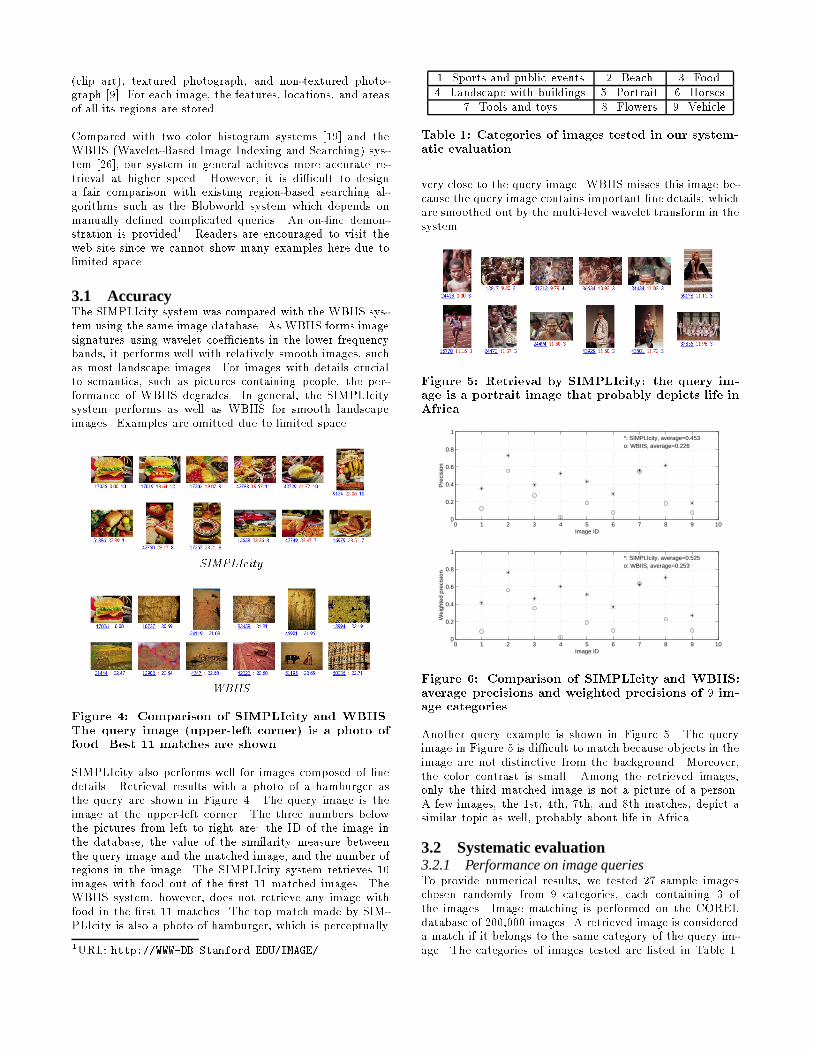
Figure 4: Comparison of SIMPLIcity and WBIIS.The query image (upper-left corner) is a photo offood. Best 11 matches are shown.
SIMPLIcity also performs well for images composed of �nedetails. Retrieval results with a photo of a hamburger asthe query are shown in Figure 4. The query image is theimage at the upper-left corner. The three numbers belowthe pictures from left to right are: the ID of the image inthe database, the value of the similarity measure betweenthe query image and the matched image, and the number ofregions in the image. The SIMPLIcity system retrieves 10images with food out of the �rst 11 matched images. TheWBIIS system, however, does not retrieve any image withfood in the �rst 11 matches. The top match made by SIM-PLIcity is also a photo of hamburger, which is perceptually
1URL: http://WWW-DB.Stanford.EDU/IMAGE/
1. Sports and public events 2. Beach 3. Food4. Landscape with buildings 5. Portrait 6. Horses
7. Tools and toys 8. Flowers 9. Vehicle
Table 1: Categories of images tested in our system-atic evaluation.
very close to the query image. WBIIS misses this image be-cause the query image contains important �ne details, whichare smoothed out by the multi-level wavelet transform in thesystem.
Figure 5: Retrieval by SIMPLIcity: the query im-age is a portrait image that probably depicts life inAfrica.
Figure 6: Comparison of SIMPLIcity and WBIIS:average precisions and weighted precisions of 9 im-age categories.
Another query example is shown in Figure 5. The queryimage in Figure 5 is di�cult to match because objects in theimage are not distinctive from the background. Moreover,the color contrast is small. Among the retrieved images,only the third matched image is not a picture of a person.A few images, the 1st, 4th, 7th, and 8th matches, depict asimilar topic as well, probably about life in Africa.
3.2 Systematic evaluation3.2.1 Performance on image queriesTo provide numerical results, we tested 27 sample imageschosen randomly from 9 categories, each containing 3 ofthe images. Image matching is performed on the CORELdatabase of 200,000 images. A retrieved image is considereda match if it belongs to the same category of the query im-age. The categories of images tested are listed in Table 1.
Most categories simply include images containing the speci-�ed objects. Images in the \sports and public events" classcontain humans in a game or public event, such as festival.Portraits are not included in this category. The \landscapewith buildings" class refers to outdoor scenes featuring man-made constructions such as buildings and sculptures. The\beach" class refers to sceneries at coasts or river banks.For the \portrait" class, an image has to show people as themain feature. A scene with human beings as a minor partis not included.
Precision was computed for both SIMPLIcity and WBIIS.Recall was not calculated because the database is large andit is di�cult to estimate the total number of images in onecategory, even approximately. To account for the ranks ofmatched images, the average of precisions within k retrievedimages, k = 1; :::; 100, is computed, that is,
�p =1
100
100Xk=1
nkk
;
nk = # of matches in the �rst k retrieved images :
This average precision is referred to as the \weighted pre-cision" because it is equivalent to a weighted percentage ofmatched images with a larger weight assigned to an imageretrieved at a higher rank. For each of the 9 image cate-gories, the average precision and weighted precision basedon the 3 sample images are plotted in Figure 6. The im-age category identi�cation number is assigned according toTable 1 scanned row wise. Except for the tools and toys cat-egory, in which case the two systems perform about equallywell, SIMPLIcity has achieved better results than WBIISmeasured in both ways. For the two categories of landscapewith buildings and vehicle, the di�erence between the twosystem is quite signi�cant. On average, the precision andthe weighted precision of SIMPLIcity are higher than thoseof WBIIS by 0:227 and 0:273 respectively.
3.2.2 Performance on image categorizationThe SIMPLIcity system was also evaluated based on a sub-set of the COREL database, formed by 10 image categories,each containing 100 pictures. Within this database, it isknown whether any two images are of the same category. Inparticular, a retrieved image is considered a match if andonly if it is in the same category as the query. This assump-tion is reasonable since the 10 categories were chosen so thateach depicts a distinct semantic topic. Every image in thesub-database was tested as a query, and the retrieval ranksof all the rest images were recorded. Three statistics werecomputed for each query: the precision within the �rst 100retrieved images, the mean rank of all the matched images,and the standard deviation of the ranks of matched images.
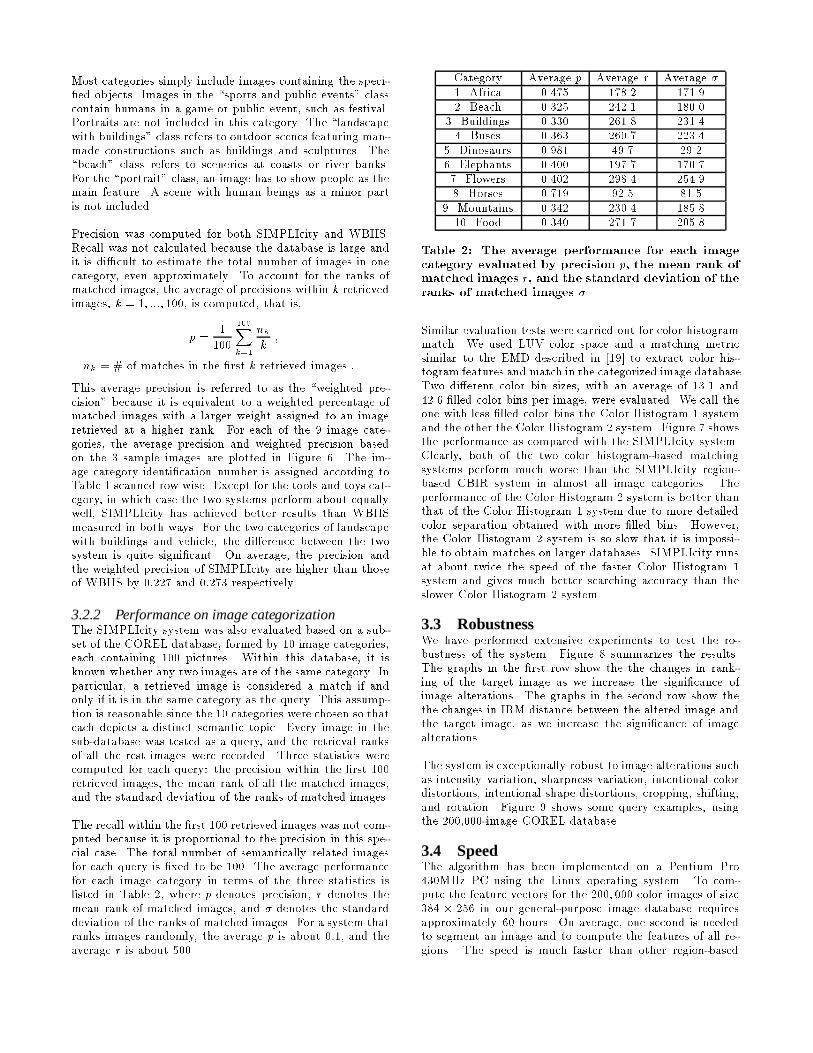
The recall within the �rst 100 retrieved images was not com-puted because it is proportional to the precision in this spe-cial case. The total number of semantically related imagesfor each query is �xed to be 100. The average performancefor each image category in terms of the three statistics islisted in Table 2, where p denotes precision, r denotes themean rank of matched images, and � denotes the standarddeviation of the ranks of matched images. For a system thatranks images randomly, the average p is about 0:1, and theaverage r is about 500.
Category Average p Average r Average �1. Africa 0.475 178.2 171.92. Beach 0.325 242.1 180.0
Table 2: The average performance for each imagecategory evaluated by precision p, the mean rank ofmatched images r, and the standard deviation of theranks of matched images �.
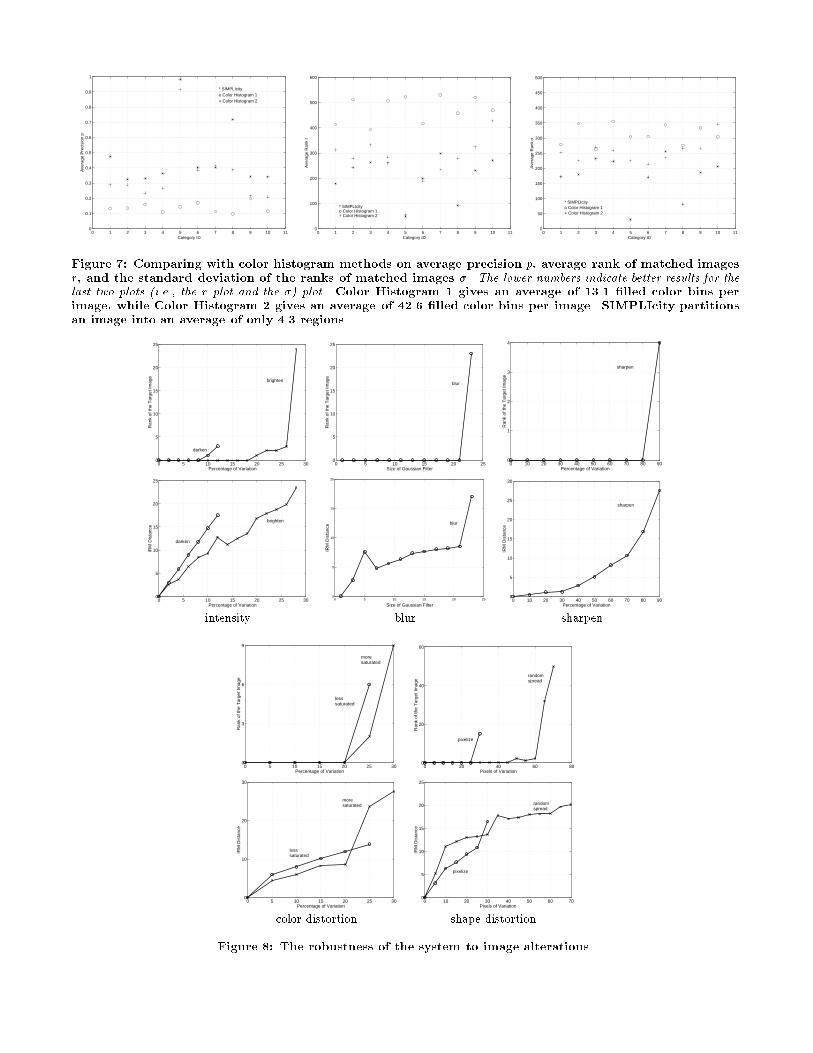
Similar evaluation tests were carried out for color histogrammatch. We used LUV color space and a matching metricsimilar to the EMD described in [19] to extract color his-togram features and match in the categorized image database.Two di�erent color bin sizes, with an average of 13.1 and42.6 �lled color bins per image, were evaluated. We call theone with less �lled color bins the Color Histogram 1 systemand the other the Color Histogram 2 system. Figure 7 showsthe performance as compared with the SIMPLIcity system.Clearly, both of the two color histogram-based matchingsystems perform much worse than the SIMPLIcity region-based CBIR system in almost all image categories. Theperformance of the Color Histogram 2 system is better thanthat of the Color Histogram 1 system due to more detailedcolor separation obtained with more �lled bins. However,the Color Histogram 2 system is so slow that it is impossi-ble to obtain matches on larger databases. SIMPLIcity runsat about twice the speed of the faster Color Histogram 1system and gives much better searching accuracy than theslower Color Histogram 2 system.
3.3 RobustnessWe have performed extensive experiments to test the ro-bustness of the system. Figure 8 summarizes the results.The graphs in the �rst row show the the changes in rank-ing of the target image as we increase the signi�cance ofimage alterations. The graphs in the second row show thethe changes in IRM distance between the altered image andthe target image, as we increase the signi�cance of imagealterations.
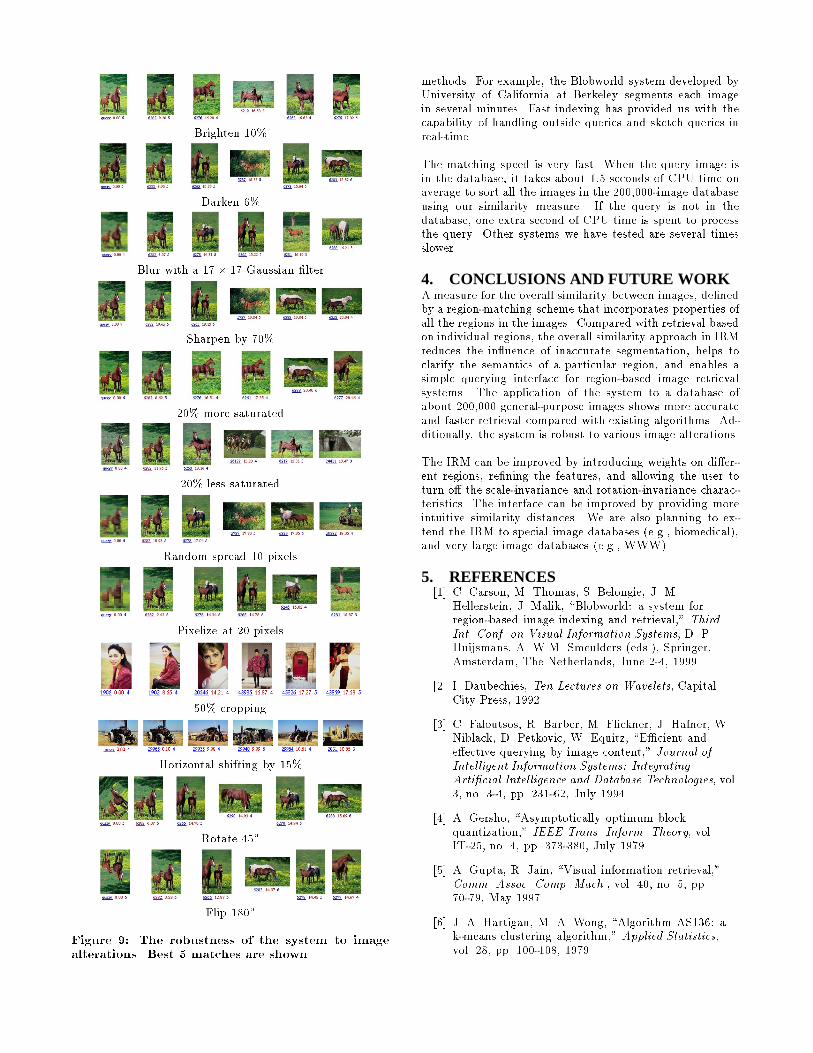
The system is exceptionally robust to image alterations suchas intensity variation, sharpness variation, intentional colordistortions, intentional shape distortions, cropping, shifting,and rotation. Figure 9 shows some query examples, usingthe 200,000-image COREL database.
3.4 SpeedThe algorithm has been implemented on a Pentium Pro430MHz PC using the Linux operating system. To com-pute the feature vectors for the 200; 000 color images of size384 � 256 in our general-purpose image database requiresapproximately 60 hours. On average, one second is neededto segment an image and to compute the features of all re-gions. The speed is much faster than other region-based
0 1 2 3 4 5 6 7 8 9 10 110
0.1
0.2
0.3
0.4
0.5
0.6
0.7
0.8
0.9
1
* SIMPLIcityo Color Histogram 1+ Color Histogram 2
Ave
rage
Pre
cisi
on p
Category ID0 1 2 3 4 5 6 7 8 9 10 11
0
100
200
300
400
500
600
* SIMPLIcityo Color Histogram 1+ Color Histogram 2
Ave
rage
Ran
k r
Category ID0 1 2 3 4 5 6 7 8 9 10 11
0
50
100
150
200
250
300
350
400
450
500
* SIMPLIcityo Color Histogram 1+ Color Histogram 2
Ave
rage
Ran
k σ
Category ID
Figure 7: Comparing with color histogram methods on average precision p, average rank of matched imagesr, and the standard deviation of the ranks of matched images �. The lower numbers indicate better results for thelast two plots (i.e., the r plot and the �) plot. Color Histogram 1 gives an average of 13.1 �lled color bins perimage, while Color Histogram 2 gives an average of 42.6 �lled color bins per image. SIMPLIcity partitionsan image into an average of only 4.3 regions.
0 5 10 15 20 25 300
5
10
15
20
25
Percentage of Variation
Ran
k of
the
Tar
get I
mag
e
brighten
darken
0 5 10 15 20 250
5
10
15
20
25
Size of Gaussian Filter
Ran
k of
the
Tar
get I
mag
e
blur
0 10 20 30 40 50 60 70 80 900
1
2
3
4
Percentage of Variation
Ran
k of
the
Tar
get I
mag
e
sharpen
0 5 10 15 20 25 300
5
10
15
20
25
Percentage of Variation
IRM
Dis
tanc
e
brighten
darken
0 5 10 15 20 250
5
10
15
20
Size of Gaussian Filter
IRM
Dis
tanc
e blur
0 10 20 30 40 50 60 70 80 900
5
10
15
20
25
30
Percentage of Variation
IRM
Dis
tanc
esharpen
intensity blur sharpen
0 5 10 15 20 25 300
3
6
9
Percentage of Variation
Ran
k of
the
Tar
get I
mag
e
lesssaturated
moresaturated
0 20 40 60 800
20
40
60
Pixels of Variation
Ran
k of
the
Tar
get I
mag
e
randomspread
pixelize
0 5 10 15 20 25 300
10
20
30
Percentage of Variation
IRM
Dis
tanc
e
lesssaturated
moresaturated
0 10 20 30 40 50 60 700
5
10
15
20
25
Pixels of Variation
IRM
Dis
tanc
e
pixelize
randomspread
color distortion shape distortion
Figure 8: The robustness of the system to image alterations.
Brighten 10%
Darken 6%
Blur with a 17 � 17 Gaussian �lter
Sharpen by 70%
20% more saturated
20% less saturated
Random spread 10 pixels
Pixelize at 20 pixels
50% cropping
Horizontal shifting by 15%
Rotate 45�
Flip 180�
Figure 9: The robustness of the system to imagealterations. Best 5 matches are shown.
methods. For example, the Blobworld system developed byUniversity of California at Berkeley segments each imagein several minutes. Fast indexing has provided us with thecapability of handling outside queries and sketch queries inreal-time.
The matching speed is very fast. When the query image isin the database, it takes about 1:5 seconds of CPU time onaverage to sort all the images in the 200,000-image databaseusing our similarity measure. If the query is not in thedatabase, one extra second of CPU time is spent to processthe query. Other systems we have tested are several timesslower.
4. CONCLUSIONS AND FUTURE WORKA measure for the overall similarity between images, de�nedby a region-matching scheme that incorporates properties ofall the regions in the images. Compared with retrieval basedon individual regions, the overall similarity approach in IRMreduces the in uence of inaccurate segmentation, helps toclarify the semantics of a particular region, and enables asimple querying interface for region-based image retrievalsystems. The application of the system to a database ofabout 200,000 general-purpose images shows more accurateand faster retrieval compared with existing algorithms. Ad-ditionally, the system is robust to various image alterations.
The IRM can be improved by introducing weights on di�er-ent regions, re�ning the features, and allowing the user toturn o� the scale-invariance and rotation-invariance charac-teristics. The interface can be improved by providing moreintuitive similarity distances. We are also planning to ex-tend the IRM to special image databases (e.g., biomedical),and very large image databases (e.g., WWW).
5. REFERENCES[1] C. Carson, M. Thomas, S. Belongie, J. M.
Hellerstein, J. Malik, \Blobworld: a system forregion-based image indexing and retrieval," ThirdInt. Conf. on Visual Information Systems, D. P.Huijsmans, A. W.M. Smeulders (eds.), Springer,Amsterdam, The Netherlands, June 2-4, 1999.
[2] I. Daubechies, Ten Lectures on Wavelets, CapitalCity Press, 1992.
[3] C. Faloutsos, R. Barber, M. Flickner, J. Hafner, W.Niblack, D. Petkovic, W. Equitz, \E�cient ande�ective querying by image content," Journal ofIntelligent Information Systems: IntegratingArti�cial Intelligence and Database Technologies, vol.3, no. 3-4, pp. 231-62, July 1994.
[4] A. Gersho, \Asymptotically optimum blockquantization," IEEE Trans. Inform. Theory, vol.IT-25, no. 4, pp. 373-380, July 1979.
[5] A. Gupta, R. Jain, \Visual information retrieval,"Comm. Assoc. Comp. Mach., vol. 40, no. 5, pp.70-79, May 1997.
[6] J. A. Hartigan, M. A. Wong, \Algorithm AS136: ak-means clustering algorithm," Applied Statistics,vol. 28, pp. 100-108, 1979.
[7] J. Li, R. M. Gray, \Text and picture segmentation bythe distribution analysis of wavelet coe�cients," Int.Conf. Image Processing, Chicago, Oct. 1998.
[8] J. Li, J. Z. Wang, R. M. Gray, G. Wiederhold,\Multiresolution object-of-interest detection ofimages with low depth of �eld," Proceedings of the10th International Conference on Image Analysis andProcessing, Venice, Italy, 1999.
[9] J. Li, J. Z. Wang, G. Wiederhold, \Classi�cation oftextured and non-textured images using regionsegmentation," Proceedings of the SeventhInternational Conference on Image Processing,Vancouver, BC, Canada, September, 2000.
[10] W. Y. Ma, B. Manjunath, \NaTra: A toolbox fornavigating large image databases," Proc. IEEE Int.Conf. Image Processing, pp. 568-71, 1997.
[11] W. Y. Ma, B. S. Manjunath, \Edge ow: aframework of boundary detection and imagesegmentation," CVPR, pp. 744-9, San Juan, PuertoRico, June, 1997.
[12] S. Mehrotra, Y. Rui, M. Ortega-Binderberger, T.S.Huang, \Supporting content-based queries overimages in MARS," Proceedings of IEEE InternationalConference on Multimedia Computing and Systems,pp. 632-3, Ottawa, Ont., Canada 3-6 June 1997.
[13] Y. Meyer, Wavelets Algorithms and Applications,SIAM, Philadelphia, 1993.
[14] S. Mukherjea, K. Hirata, Y. Hara, \AMORE: aWorld Wide Web image retrieval engine," WorldWide Web, vol. 2, no. 3, pp. 115-32, Baltzer, 1999.
[15] A. Natsev, R. Rastogi, K. Shim, \WALRUS: Asimilarity retrieval algorithm for image databases,"SIGMOD, Philadelphia, PA, 1999.
[16] ICASSPW. Niblack, R. Barber, W. Equitz, M.Flickner, E. Glasman, D. Petkovic, P. Yanker, C.Faloutsos, G. Taubin, \The QBIC project: queryingimages by content using color, texture, and shape,"Proc. SPIE - Int. Soc. Opt. Eng., in Storage andRetrieval for Image and Video Database, vol. 1908,pp. 173-87, San Jose, February, 1993.
[17] A. Pentland, R. W. Picard, S. Sclaro�, \Photobook:tools for content-based manipulation of imagedatabases," SPIE Storage and Retrieval Image andVideo Databases II, vol. 2185, pp. 34-47, San Jose,February 7-8, 1994.
[18] R. W. Picard, T. Kabir, \Finding similar patterns inlarge image databases," IEEE , Minneapolis, vol. V,pp. 161-64, 1993.
[19] Y. Rubner, L. J. Guibas, C. Tomasi, \The earthmover's distance, Shimulti-dimensional scaling, andcolor-based image retrieval," Proceedings of theARPA Image Understanding Workshop, pp. 661-668,New Orleans, LA, May 1997.
[20] G. Sheikholeslami, W. Chang, A. Zhang, \Semanticclustering and querying on heterogeneous features forvisual data," ACM Multimedia, pp. 3-12, Bristol,UK, 1998.
[21] J. , J. Malik, \Normalized cuts and imagesegmentation," Proceedings of IEEE ComputerSociety Conference on Computer Vision and PatternRecognition, pp. 731-7, San Juan, Puerto Rico, June,1997.
[22] J. R. Smith, S.-F. Chang, \An image and videosearch engine for the World-Wide Web," Storage andRetrieval for Image and Video Databases V (Sethi, IK and Jain, R C, eds), Proc SPIE 3022, pp. 84-95,1997.
[23] J. R. Smith, C. S. Li, \Image classi�cation andquerying using composite region templates," Journalof Computer Vision and Image Understanding, 2000,to appear.
[24] S. Stevens, M. Christel, H. Wactlar, \Informedia:improving access to digital video," Interactions, vol.1, no. 4, pp. 67-71, 1994.
[25] M. Unser, \Texture classi�cation andChansegmentation using wavelet frames," IEEETrans. Image Processing, vol. 4, no. 11, pp.1549-1560, Nov. 1995.
[26] J. Z. Wang, G. Wiederhold, O. Firschein, X. W. Sha,\Content-based image indexing and searching usingDaubechies' wavelets," International Journal ofDigital Libraries, vol. 1, no. 4, pp. 311-328, 1998.
[27] J. Z. Wang, J. Li, D. , G. Wiederhold,\Semantics-sensitive retrieval for digital picturelibraries," D-LIB Magazine, vol. 5, no. 11, DOI:10.1045/november99-wang, November, 1999.http://www.dlib.org
[28] S. C. Zhu, A. Yuille, \Region competition: unifyingsnakes, region growing, and Bayes/MDL formultiband image segmentation," IEEE Transactionson Pattern Analysis and Machine Intelligence, vol.18, no. 9, pp. 884-900, 1996.


![CHAPTER 5: OPTIMIZATION METHODS FOR IMAGE MATCHING …shodhganga.inflibnet.ac.in/bitstream/10603/37192/14/14_chapter5.pdf · Chapter 5: Optimization Methods for Image Matching [2014]](https://static.documents.pub/doc/80x56/5a7711947f8b9a9c548dc32c/chapter-5-optimization-methods-for-image-matching-chapter-5-optimization.jpg)


![Fast Size-Invariant Binary Image Matching Through ... · Image correlation and image subtraction [11] are perhaps the two most popular area-based methods for image matching and suffer](https://static.documents.pub/doc/80x56/5f120b57e910cd4c0a799c8f/fast-size-invariant-binary-image-matching-through-image-correlation-and-image.jpg)


