UNITED STATES ENVIRONMENTAL PROTECTION AGENCY REGION 4 Laboratory Services and Applied Science Division Quality Assurance and Program Services Branch 980 College Station Road Athens, Georgia 30605-2720 October 4, 2019 Mr. Patrick Butler North Carolina Department of Environmental Quality Division of Air Quality (DAQ) Green Square Office Complex 217 West Jones Street Raleigh, NC 27699-1641 Project Number: 18-0380 Mr. Butler: . We have reviewed the following document submitted for approval: Quality Assurance Project Plan (QAPP) for the North Carolina Division of Air Quality Northampton County Background-Monitoring Program, Revision 0, October 3, 2019. The quality assurance and technical elements within this QAPP were compared to EPA regulations and current guidance. The stated procedures appear to be clear, sound, and appropriate as written, to the extent they can be evaluated. The QAPP indicates that the agency's quality system and/or technical monitoring procedures are currently being revised or restructured and that the QAPP will be revised and resubmitted to EPA once those changes are finalized. Therefore, EPA approval of this document is conditionally granted. Please be aware that conditional approval of this QAPP does not constitute a waiver from any regulatory requirements. Your agency remains accountable for ensuring that the Northampton County special purpose background monitoring project adheres to all applicable requirements and that the data generated is of sufficient quality to be used for decision-making purposes. Conditional approval of the QAPP is granted for 2 years from the date of this letter; the QAPP must be revised and resubmitted to EPA by October 2021, if this special monitoring project is still in operation at that time. If you have any questions, piease contact Stephanie McCarthy at 706-355-8745 or via email at [email protected]. Sincerely, Quality Assurance Section Enclosure
Transcript
UNITED STATES ENVIRONMENTAL PROTECTION AGENCY REGION 4
Laboratory Services and Applied Science Division Quality Assurance and Program Services Branch
980 College Station Road Athens, Georgia 30605-2720
October 4, 2019
Mr. Patrick Butler North Carolina Department of Environmental Quality Division of Air Quality (DAQ) Green Square Office Complex 217 West Jones Street Raleigh, NC 27699-1641
Project Number: 18-0380
Mr. Butler: .
We have reviewed the following document submitted for approval:
Quality Assurance Project Plan (QAPP) for the North Carolina Division of Air Quality Northampton County Background-Monitoring Program, Revision 0, October 3, 2019.
The quality assurance and technical elements within this QAPP were compared to EPA regulations and current guidance. The stated procedures appear to be clear, sound, and appropriate as written, to the extent they can be evaluated. The QAPP indicates that the agency's quality system and/or technical monitoring procedures are currently being revised or restructured and that the QAPP will be revised and resubmitted to EPA once those changes are finalized. Therefore, EPA approval of this document is conditionally granted. Please be aware that conditional approval of this QAPP does not constitute a waiver from any regulatory requirements. Your agency remains accountable for ensuring that the Northampton County special purpose background monitoring project adheres to all applicable requirements and that the data generated is of sufficient quality to be used for decision-making purposes. Conditional approval of the QAPP is granted for 2 years from the date of this letter; the QAPP must be revised and resubmitted to EPA by October 2021, if this special monitoring project is still in operation at that time.
If you have any questions, piease contact Stephanie McCarthy at 706-355-8745 or via email at [email protected].
Sincerely,
~.~~ Quality Assurance Section
Enclosure
Quality Assurance Project Plan for the North Carolina Division of Air Quality
Northampton County Background-Monitoring Program
Prepared for:
Carol Kemker Acting, EPA Region IV Director ARD
U.S. Environmental Protection Agency Region IV
Atlanta Federal Building 61 Forsyth Street
Atlanta, GA 30303-8960
Submitted by:
Michael Abraczinskas, Director North Carolina Division of Air Quality
North Carolina Department of Environmental Quality 1641 Mail Service Center Raleigh, NC 27699-1641
ROY COOPER CC'.fll:,:ir
~UCHA.ELS. REGAN ~ .. ,.. ~1lCJIAEL A. 1\Blv\CZINSKAS Dim:iJ»
NORTH CAROLINA Department of Environmental Quality
NORTH CAROLIN A £11\/irM_...,,u,1 Q~al.ity
QAPP for the Northampton County Background-Monitoring Program Revision 0 10/3/2019
Page 2 of 111
DISCLAIMER This Quality Assurance Project Plan (QAPP) covers the Northampton County background-monitoring network for the North Carolina Department of Environmental Quality (DEQ) Division of Air Quality (DAQ).
QAPP for the Northampton County Background-Monitoring Program Revision 0 10/3/2019
Page 3 of 111
Quality Assurance Project Plan Acronym Glossary ADQ - Audit of data quality AQS - Air Quality System (EPA's Air database) AMTIC – Ambient Monitoring Technology Information Center ARM – Air Resources Manager BAM – Beta attenuation monitor CFR – Code of Federal Regulations Chief – Ambient Monitoring Section chief CO – carbon monoxide Coordinator – Raleigh Regional Office Monitoring Coordinator CV – Coefficient of variation DAQ - North Carolina Division of Air Quality DAS – Data acquisition system ° C – Degrees Celsius DEQ – North Carolina Department of Environmental Quality Director – Division of Air Quality Director DIT – North Carolina Department of Information Technology DQA - Data quality assessment DQI - Data quality indicators DQO - Data quality objectives ECB – Electronics and Calibration Branch e-log – electronic logbook EPA – United States Environmental Protection Agency FEM – Federal equivalent method FEP – Fluorinated ethylene propylene FRM – Federal reference method IBEAM – Internet-Based Enterprise Application Management IDL – Instrument Detection Limit LC – Local conditions LPM -Liters per minute LSASD – Laboratory Services and Applied Science Division MDL – Method detection limit MQO – Measurement quality objective NAAQS - National ambient air quality standards NIST - National Institute of Standards and Technology NO – Nitric oxide NO2 – Nitrogen dioxide NOx – Oxides of nitrogen (NO plus NO2) NPAP – National Performance Audit Program OAQPS – Office of Air Quality Planning and Standards
QAPP for the Northampton County Background-Monitoring Program Revision 0 10/3/2019
Page 4 of 111
PEP – Performance evaluation program PFA - Perfluoroalkoxy PM – Particulate matter PM2.5 – Particles with an average aerodynamic diameter of 2.5 microns or less, also known as fine
particles PM10 – Particles with an average aerodynamic diameter of 10 microns or less ppb – Parts per billion ± - plus or minus PPB – Projects and Procedures Branch ppm – Parts per million PQAO – Primary quality assurance organization PSD – Prevention of significant deterioration QA – Quality assurance QA Handbook - EPA Quality Assurance Handbook for Air Pollution Measurements Systems, Volume II QA/QC - Quality assurance/quality control QAPP - Quality assurance project plan QC – Quality control RCO – Raleigh central office RRO – Raleigh Regional Office SLAMS - State and local air monitoring station SO2 – Sulfur dioxide SOP - Standard operating procedure TSA - Technical systems audit µg/m3 – micrograms per cubic meter VIP – Value in performance VSCC – Very sharp cut cyclone ZPS – zero/precision/span
1.0 Approval Sheet
QAPP for the Northampton County Background-Monitoring Program RevisionO 10/3/2019
Page S of 111
Title: Quality Assurance Project Plan for the North Carolina Division of Air Quality
Northampton County Background-Monitoring Program (Revision O}
The Division of Air Quality recommends the attached Quality Assurance Project Plan for the North Carolina Division of Air Quality Northampton County Background-Monitoring Program for approval. This plan commits the State of North Carolina, Department of Environmental Quality (Division of Air Quality} to follow the elements described within.
DAQ, Ambient Monitoring Section Chief and Quality Assurance Manager
3)
4) Signature: ~ 1<.oX?ebt\6 Primary QAPP Aut or
Date 03 Q::t, '20\q
QAPP for the Northampton County Background-Monitoring Program Revision 0 10/3/2019
Page 6 of 111
2.0 Table of Contents DISCLAIMER .................................................................................................................................................. 2 Quality Assurance Project Plan Acronym Glossary ....................................................................................... 3 1.0 Approval Sheet ........................................................................................................................................ 5 2.0 Table of Contents .................................................................................................................................... 6
2.1 List of Tables ........................................................................................................................................ 9 2.2 List of Figures ...................................................................................................................................... 9
3.0 Distribution ........................................................................................................................................... 10 4.0 Project/Task Organization..................................................................................................................... 12
4.2.1 Projects and Procedures Branch ................................................................................................ 15 4.2.2 Electronics and Calibration Branch ............................................................................................ 16 4.2.3 Raleigh Regional Office .............................................................................................................. 17
4.3 Department of Information Technology ........................................................................................... 18 4.4 United States Environmental Protection Agency, Region 4 .............................................................. 18
5.0 Problem Definition and Background ..................................................................................................... 20 6.0 Project/Task Description ....................................................................................................................... 23
7.0 Quality Objectives and Criteria for Measurement Data ....................................................................... 27 7.1 Data Quality Objectives ..................................................................................................................... 27 7.2 Measurement Quality Objectives ..................................................................................................... 29 7.3 Type of Data Needed ........................................................................................................................ 31
8.0 Training Requirements .......................................................................................................................... 41 9.0 Documentation and Records ................................................................................................................ 43
9.1 Statewide Policy and Procedure Documentation ............................................................................. 45 9.2 Data Collection Records and Logbooks ............................................................................................. 45
9.2.1 Logbooks and Forms .................................................................................................................. 46 9.2.2 Electronic Data Collection .......................................................................................................... 46
9.3 QA/QC Records ................................................................................................................................. 47 9.4 Reference Materials .......................................................................................................................... 47 9.5 Data Archiving and Retrieval ............................................................................................................. 48
16.0 Instrument Calibration and Frequency ............................................................................................... 72 16.1 Calibration of “Local Primary Standards” ....................................................................................... 73
16.2 Calibration of Transfer Standards ................................................................................................... 74 16.2.1 Flow Transfer Standards .......................................................................................................... 74 16.2.2 Temperature Transfer Standards ............................................................................................. 74 16.2.3 Pressure Transfer Standards .................................................................................................... 74
QAPP for the Northampton County Background-Monitoring Program Revision 0 10/3/2019
17.0 Inspection/Acceptance of Supplies and Consumables ....................................................................... 76 18.0 Non-Direct Measurements ................................................................................................................. 77 19.0 Data Management .............................................................................................................................. 78
19.1 Purpose/Background....................................................................................................................... 78 19.2 Data Collection and Recording ........................................................................................................ 78 19.3 Data Transmittal and Transformation............................................................................................. 80 19.4 Data Verification and Validation ..................................................................................................... 81 19.5 Data Reduction and Analysis ........................................................................................................... 82 19.6 Data Submission .............................................................................................................................. 82 19.7 Data Storage and Retrieval ............................................................................................................. 83
20.0 Assessments and Response Actions ................................................................................................... 85 20.1 Network Reviews and Assessments ................................................................................................ 85
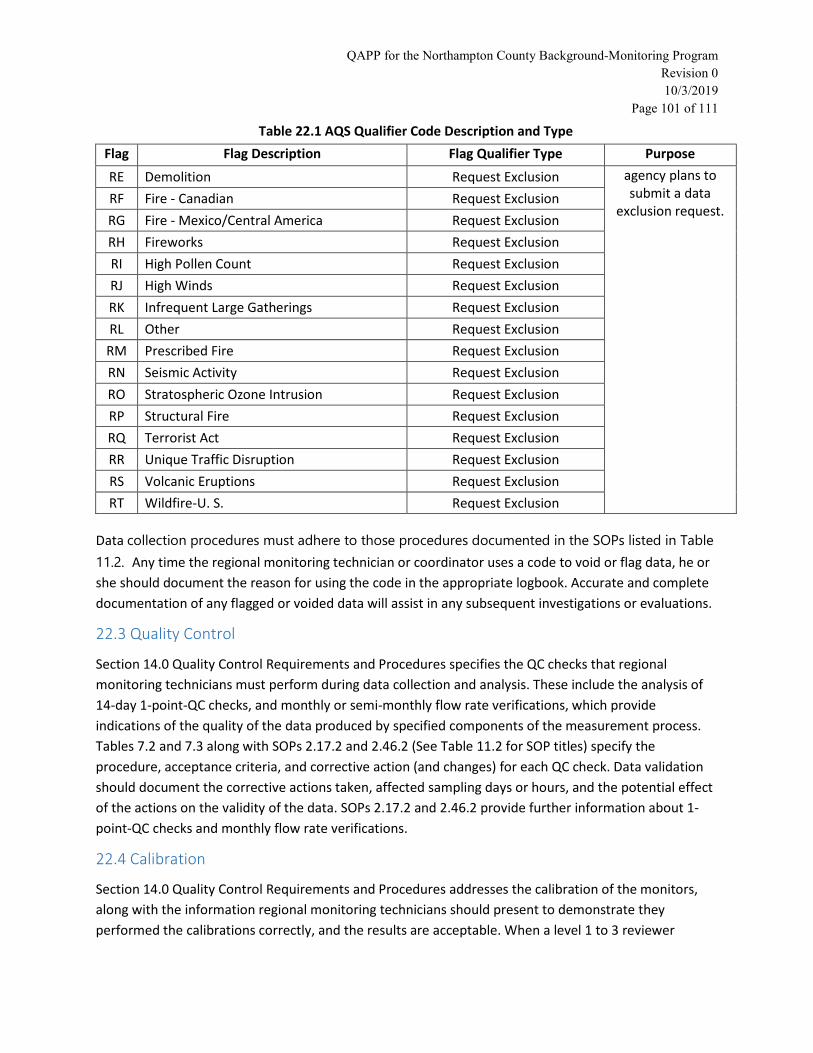
22.0 Data Validation and Usability .............................................................................................................. 96 22.1 Sampling Design .............................................................................................................................. 96 22.2 Data Collection Procedures ............................................................................................................. 97 22.3 Quality Control .............................................................................................................................. 101
QAPP for the Northampton County Background-Monitoring Program Revision 0 10/3/2019
Page 9 of 111
22.4 Calibration ..................................................................................................................................... 101 22.5 Data Reduction and Processing .................................................................................................... 102 22.6 Exceptional Events ........................................................................................................................ 102
23.0 Verification and Validation Methods ................................................................................................ 104 23.1 Validating and Verifying Data ....................................................................................................... 105 23.2 Verification .................................................................................................................................... 105 23.3 Validation ...................................................................................................................................... 105
24.0 Reconciliation with Data Quality Objectives ..................................................................................... 108 Revision History ........................................................................................................................................ 110 QAPP Annual Review Documentation ...................................................................................................... 111
2.1 List of Tables
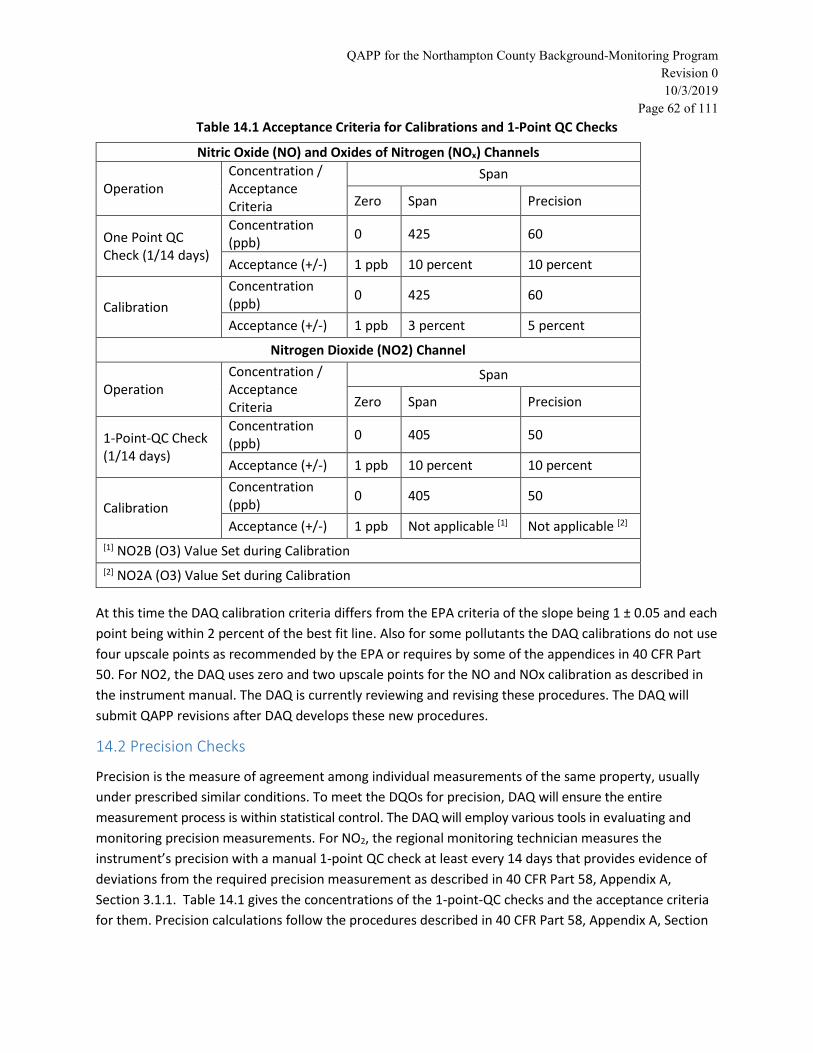
Table 3.1. DAQ Ambient Air Quality Northampton County Background-Monitoring Program QAPP Distribution List ………………………………………………………………………………………………………………………….………. 10 Table 5.1 National Ambient Air Quality Standards for NO2 and PM2.5 ………….………………..……………………. 19 Table 5.2 North Carolina Northampton County Background Location and Monitors ………………..……….…20 Table 5.3 Table of Activities.……………………….…………………………………………………………..……………………………20 Table 6. 1 Assessment Schedule ………………………………………………………………………………………………………….23 Table 6.2 Critical Documents and Records...………………………………….……………………………………………………. 24 Table 7.1. Acceptable Precision as Measured by Coefficient of Variation (CV) and Bias for the Northampton County Background-Monitoring Program ...………………………………………………..…….…..….…. 28 Table 7.2. Nitrogen Oxides Measurement Quality Objectives: Nitrogen Dioxide (NO2) (Chemiluminescence) ………………………………………………………………………………..…………………………….…………. 31 Table 7.3. PM2.5 Measurement Quality Objectives: PM2.5 (Continuous Met One BAM 1022, Local Conditions) ……….………………………………………………………………………………….……..……………………….……………. 34 Table 9.1. Documents and Records ……….……..…………………………….………………………..…………………….……. 41 Table 10.1. Requirements for Calculating Summary Statistics.……………………………………………………..……...50 Table 10.2. Northampton County Background-Monitoring Sampling Schedule and Frequency.…………. 50 Table 11.1. DAQ Northampton County Background-Monitoring Network Analyzers…………………………....51 Table 11.2. List of SOPs Associated with this Quality Assurance Project Plan.……………….….…..........….…. 53 Table 14.1 Acceptance Criteria for Calibrations and 1-Point QC Checks…………….…………………….……….…..60 Table 14.2. Corrective Actions ………………………………………………………………………………….……………...…….…...64 Table 21.1 Required AQS Data Reporting Periods…………………….……………………………………………………………92 Table 22.1. AQS Qualifier Code Description and Type …………………………………………………………………………. 96
2.2 List of Figures Figure 4.1 Project Organizational Chart………………………….………………………..………………………………………… 14 Figure 10.1 Aerial View of the Northampton Site Location and Surrounding Areas…………………………… 48 Figure 19.1 Northampton County Background-Monitoring Data Flow Path ……………….…………….…………. 78
QAPP for the Northampton County Background-Monitoring Program Revision 0 10/3/2019
Page 10 of 111
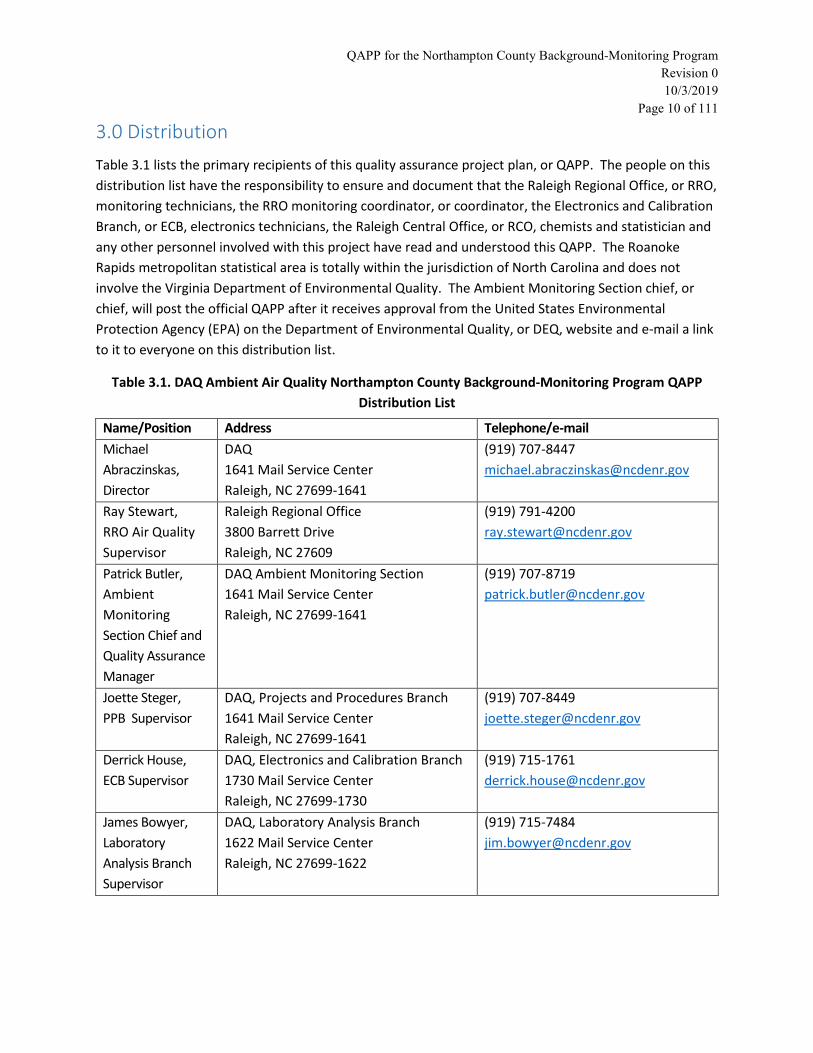
3.0 Distribution Table 3.1 lists the primary recipients of this quality assurance project plan, or QAPP. The people on this distribution list have the responsibility to ensure and document that the Raleigh Regional Office, or RRO, monitoring technicians, the RRO monitoring coordinator, or coordinator, the Electronics and Calibration Branch, or ECB, electronics technicians, the Raleigh Central Office, or RCO, chemists and statistician and any other personnel involved with this project have read and understood this QAPP. The Roanoke Rapids metropolitan statistical area is totally within the jurisdiction of North Carolina and does not involve the Virginia Department of Environmental Quality. The Ambient Monitoring Section chief, or chief, will post the official QAPP after it receives approval from the United States Environmental Protection Agency (EPA) on the Department of Environmental Quality, or DEQ, website and e-mail a link to it to everyone on this distribution list.
Table 3.1. DAQ Ambient Air Quality Northampton County Background-Monitoring Program QAPP Distribution List
Name/Position Address Telephone/e-mail Michael Abraczinskas, Director
DAQ 1641 Mail Service Center Raleigh, NC 27699-1641
QAPP for the Northampton County Background-Monitoring Program Revision 0 10/3/2019
Page 12 of 111
4.0 Project/Task Organization The State of North Carolina Division of Air Quality (DAQ) ambient air monitoring program is an independent primary quality assurance organization (PQAO) as defined in the Code of Federal Regulations (CFR) 40, Part 58, Appendix A, Section 1.2. The DAQ operates the Northampton County background-monitoring program as part of the DAQ PQAO. The DAQ director has organized the Ambient Monitoring Section into three main branches: The Projects and Procedures Branch, or PPB, the Laboratory Analysis Branch and the Electronics and Calibration Branch, or ECB. The chief has responsibility for managing these branches per stated policy. The chief delegates the responsibility and authority to develop, organize, and maintain and implement quality programs to the supervisors of each branch, in accordance with the EPA-approved quality management plan. These supervisors have direct responsibility for assuring data quality. The DAQ currently does not use the services of the Laboratory Analysis Branch to implement the Northampton County background-monitoring program. The Ambient Monitoring Section shares the monitoring responsibilities with regional monitoring technicians and coordinator in the Raleigh Regional Office, or RRO.
Figure 4.1 presents the organizational structure for the implementation of the monitoring program. The following information lists the specific responsibilities of each significant position within the Ambient Monitoring Section and the RRO.
4.1 DAQ Director
The DAQ director, or director, supervises the chief and RRO supervisor. The director is responsible for ensuring adequate human and financial resources are available to support DAQ’s Northampton County background-monitoring program. The director has ultimate responsibility and final authority on all aspects of the Northampton County background-monitoring program. The director has authority to stop or resume work. In the event of an emergency or inclement weather the director implements the Continuity of Operations Plan, including the hurricane readiness procedures. The director also serves as a liaison with other divisions in DEQ, with the North Carolina General Assembly, the North Carolina Department of Information Technology, or DIT, and with other regional air-monitoring agency organizations.
4.2 DAQ Ambient Monitoring Section
The Ambient Monitoring Section contains the PPB, the Laboratory Analysis Branch (not involved in Northampton County background monitoring) and the ECB. The Ambient Monitoring Section is responsible for coordinating the quality assurance, or QA, data collection, and data processing aspects of DAQ’s Northampton County background monitoring program.
Ambient Monitoring Section Chief: The Ambient Monitoring Section Chief, or chief serves as the QA manager, or QAM, and reports to and has direct access to the director on all matters relating to DAQ’s Northampton County background ambient monitoring operation. The chief has ultimate authority for the program’s data quality and is the ultimate decision maker. The chief’s duties include, but are not limited to the following:
QAPP for the Northampton County Background-Monitoring Program Revision 0 10/3/2019
Page 13 of 111
- Serving as the QAM and maintaining oversight of all QA activities; - Supervising the ambient monitoring staff and delegating responsibilities as appropriate; - Serving as the liaison to EPA Region 4 monitoring staff; - Maintaining overall responsibility for the monitoring network design and review, subject to the
director’s approval including oversight and approval of the annual network plan and 5-year assessment;
- Approving and distributing division standard operating procedures (SOPs) and QAPPs to the personnel listed in Table 3.1;
- Serving as the tie-breaker in the event of an impasse on how to handle corrective actions or make a final judgment call on data validity;
- Collaborating with DEQ staff in developing, administering and maintaining the quality management plan;
- Overseeing training for the ambient monitoring staff; - Authorizing the installation and discontinuation of monitors within the network; - Certifying the data every year in accordance with 40 CFR Section 58.15; - Reviewing the quarterly QA reports and the QC summaries to ensure the bias and precision
limits are attained; - Overseeing the management of the agency’s documents and records; - Tracking corrective actions and determining their success; - Participating in systems audits; - Assuring that QAPPs are established and effectively implemented for each project as applicable;
and - Reviewing budgets, contracts, grants and proposals.
If the section chief (or designee) is unavailable to perform these duties, the chief will assign someone to fulfill these duties, or if the chief is unable to make that assignment the director will assign someone to fulfill these duties.
Database Manager: Although the database manager does not report directly to the chief, he has direct access to the chief on all matters relating to management of DAQ’s Northampton County background ambient air monitoring database. The database manager’s duties include, but are not limited, to the following:
- Maintaining the RCO data polling station (I.e. Envista Air Resources Manager, or ARM), ensuring it polls hourly and minute data for each hour of every day as well as automated check data for each day;
- Ensuring correct data is being transferred to the DAQ Internet-Based Enterprise Application Management, or IBEAM, database and DAQ real-time air quality data webpage;
- Participating in systems audits; - Uploading environmental data to the EPA’s Air Quality System (AQS) and AirNow-Tech
databases; - Serving as the AQS administrator for DAQ;
QAPP for the Northampton County Background-Monitoring Program Revision 0 10/3/2019
Page 14 of 111
Figure 4.1: Project Organizational Chart
Director of Air Quality Division
Raleigh Regional Office Supervisor
Raleigh Regional Office Monitoring Coordinator
(Level 2 Reviewer)
Raleigh Regional Office Monitoring Technician
(Level 1 Reviewer)
Ambient Monitoring Section Chief and Quality Assurance
Manager
US Environmental Protection Agency R i 4
Projects and Procedures Branch
Supervisor
Raleigh Central Office Chemists
(Level 3 Reviewer)
Raleigh Central Office Statistician
Electronics and Calibrations Branch
Supervisor
ECB Electronics Technician
Database Manager
Department of Information Technology ---------------1 ___
-
I l---- .--------------------1 ___
I I
QAPP for the Northampton County Background-Monitoring Program Revision 0 10/3/2019
Page 15 of 111
- Maintaining and updating the RCO data polling software and AQS database when sites and monitors are established or shut down; and
- Other duties as assigned.
4.2.1 Projects and Procedures Branch
Projects and Procedures Branch Supervisor: The PPB supervisor reports to the chief. This supervisor’s duties include the following:
- Directing and supervising the activities of the branch staff; - Supporting and assisting the QAM in providing oversight of all QA activities; - Communicating with the QAM to bring to the attention of the QAM QA matters needing
attention; - Verifying implementation of all Ambient Monitoring Section QAPPs and procedures; - Assisting the chief with preparing the annual network plan and 5-year network assessment; - Responding to public records requests and statistical consulting requests; - Participating in systems audits; - Ensuring training availability and utilization; - Approving and implementing procedures; and - Other duties as assigned.
Raleigh Central Office Chemists: The RCO chemists report to the PPB supervisor and are responsible for the oversight of the DAQ Northampton County background-monitoring program. The RCO chemists’ duties include the following:
- Assessing the effectiveness of the network system; - Writing and ensuring timely and appropriate SOP and QAPP updates; - Coordinating with the regional and ECB staff the writing, revising and maintaining of SOP
updates, including documenting annual SOP and QAPP reviews; - Validating data by serving as the level 3 reviewer; - Verifying that all required quality assurance/quality control, or QA/QC, activities are
performed and that measurement quality standards are met; - Maintaining QA/QC records, flagging suspect data, and assessing and reporting on data
quality; - Conducting quarterly completeness evaluations and audits of data quality; - Participating in systems audits; - Conducting internal systems audits, as needed; - Identifying data quality problems and initiating corrective actions that result in solutions; - Providing training and certification to appropriate personnel; and - Other duties as assigned.
Statistician: The statistician reports to the PPB supervisor and provides statistical programming support to the branch supervisor and other RCO, ECB and RRO staff, including:
- Assisting the branch supervisor with responding to consulting and data requests;
-
QAPP for the Northampton County Background-Monitoring Program Revision 0 10/3/2019
Page 16 of 111
- Participating in training and certification programs to keep current on technology; - Interpreting data; - Developing each business day and maintaining statistical reports that include tabulations of
yesterday’s hourly raw data; - Preparing statistical analysis and summaries of the data, including graphs, for QA and
reporting; - Planning and conducting data quality assessments, or DQAs, based on interpretation of
data; - Participating in systems audits; - Preparing and delivering data and statistical interpretation of the data to the RRO and RCO; - Responding to public records requests and statistical consulting requests; - Uploading data to AQS; and - Other duties as assigned
4.2.2 Electronics and Calibration Branch
Electronics and Calibration Branch Supervisor: The Electronics and Calibration Branch (ECB) supervisor reports to and has direct access to the chief and has the responsibility and authority to:
- Identify quality problems and initiate corrective action which results in solutions; - Schedule and document annual performance evaluations and standard certifications; - Review and approve QAPPs and SOPs; - Supervise the ECB electronics technicians - Participating in systems audits; and - Provide and document training and certification of field personnel; and - Other duties as assigned.
Electronics and Calibration Branch Electronics Technicians: The ECB electronics technicians report to the ECB supervisor and have the following responsibilities:
- Installing all field equipment and monitoring sites; - Purchasing, maintaining and tracking an inventory of spare parts, spare equipment and
consumable supplies to prevent unnecessary downtime; - Calibrating, certifying and tracking transfer standards or sending them to the vendor to be
recertified; - Returning “local primary standards” to the vendor or EPA for recertification and periodically
checking the calibration of backup “local primary standards” to ensure quality calibrations; - Ordering calibration gases and ensuring DAQ participation in the gas verification program
operated by the EPA; - Maintaining documentation on all transfer standard, “local primary standard” and calibration
gas certifications; - Conducting annual performance evaluations on NO2 monitors; - Assisting in prescribing corrective actions; - Participating in systems audits;
-
QAPP for the Northampton County Background-Monitoring Program Revision 0 10/3/2019
Page 17 of 111
- Recommending changes, when needed, in the QA/QC program; and - Performing and documenting all major maintenance and repair of field equipment as described
by SOPs 2.17.1, section 9 and 2.37.1, section 4; and - Other duties as assigned.
4.2.3 Raleigh Regional Office
Raleigh Regional Office Air Quality Supervisor: The RRO air quality supervisor reports to the director and has direct access to the chief and director on all matters relating to DAQ’s Northampton County background monitoring program. The RRO supervisor’s duties include:
- Assuring that division policies are maintained at the regional office level; - Acquiring needed regional monitoring resources; - Verifying implementation of quality programs; - Recommending changes when needed in the QA/QC program; - Providing regional input for the design of the monitoring network; - Reviewing and approving the network plan as far as it affects the region; and - Supervising and delineating duties for the coordinator and regional monitoring technicians; and - Other duties as assigned.
RRO Monitoring Coordinator: The coordinator reports directly to the RRO supervisor. The coordinator has the overall responsibility of ensuring the implementation of the QA/QC program at the regional level. He or she coordinates the activities of the regional monitoring technicians. His or her responsibilities include:
- Coordinating and reviewing the collection of environmental data; - Implementing the DAQ QA/QC program within the region; - Acting as a conduit for information to the regional monitoring technicians; - Training other regional monitoring coordinators and regional monitoring technicians in the
requirements of the QAPP and SOPs; - Providing a backup to the regional monitoring technicians; - Participating in systems audits; - Recommending changes, when needed, in the QA program; - Providing regional input on the design and documentation of the monitoring network; - Performing level 2 data verification activities and flagging suspect data; - Overseeing transfer standard certifications ensuring equipment is returned for recertification
before expiration and that all certification documents are appropriately archived. - Reviewing electronic logbooks, or e-logs, other documentation and the work of the regional
monitoring technicians to ensure they follow the QAPP and associated SOPs; - Documenting and assessing corrective actions; and - Other duties as assigned
Regional Monitoring Technicians: The regional monitoring technicians report directly to the regional office air quality supervisor and work under the direction of the regional monitoring coordinator to ensure DAQ meets all monitoring requirements. The regional monitoring technicians’ duties include:
QAPP for the Northampton County Background-Monitoring Program Revision 0 10/3/2019
Page 18 of 111
- Perform all required quality control (QC) activities to ensure that measurement quality objectives or MQOs, are met as prescribed in the SOPs and QAPP;
- Participates in and provides hands-on training of new regional monitoring coordinators, regional monitoring technicians and RCO chemists in the requirements of the SOPs;
- Calibration and verification of the NO2 monitoring equipment; - Calibration, verification and auditing of PM monitoring equipment; - Perform preventative maintenance and small repairs on PM monitoring equipment; - Operating and completing preventative maintenance on all monitoring equipment; - Responsible for sending all PM flow transfer standards to ECB for calibration and certification,
and for checking calibration of primary standards to ensure quality calibrations; - Ensuring all transfer standards used are within their expiration date; - Maintaining a supply of expendable monitoring items; - Participating in training and certification activities; - Documenting deviations from established procedures and methods; - Reporting nonconforming conditions and corrective actions to the coordinator and the RRO
supervisor; - Participating in systems audits; - Performing level 1 data verification activities and flagging suspect data; - Conduct 40 CFR Part 58, Appendix E siting criteria evaluations annually as part of the annual
network review process; - Recommending changes, when needed, in the QA program; - Preparing corrective action reports, when needed, for the Ambient Monitoring Section; and - Other duties as assigned.
4.3 Department of Information Technology
The DIT provides security for the ambient monitoring computers. They manage in cooperation with the monitoring and ECB electronics technicians and database manager, the computer located at the monitoring site as well as the primary server that houses the Envista ARM database. Their responsibilities include ensuring the security of the computers and network, updating of the operating system and other standard software on the computer and ensuring that the regional monitoring and ECB electronics technicians maintain adequate access to the computers to perform all necessary monitoring functions.
4.4 United States Environmental Protection Agency, Region 4
The DAQ will operate the Northampton County background monitors as special purpose non-regulatory monitors for the first two years of their operation, following the procedures in 40 CFR Part 58.20 Special purpose monitors. As a result, the chief will include information on these monitors in the annual network-monitoring plan and the five-year network assessment and the EPA Region 4 Air and Radiation Division director will review, comment on and respond to the network plan each year. Likewise, the chief will include the data from these monitors in the annual certification request and the EPA Region 4 Air and Radiation Division director will review and apply concurrence codes in AQS in response to DAQ’s data certification request. The chief will also submit a QAPP to the EPA Region 4 Laboratory Services and Applied Science Division, or LSASD, for EPA approval. The chief may also request that the EPA
QAPP for the Northampton County Background-Monitoring Program Revision 0 10/3/2019
Page 19 of 111
Region 4 LSASD include the Northampton County background monitors in the Performance Evaluation Program (PEP) and National Performance Audit Program (NPAP).
QAPP for the Northampton County Background-Monitoring Program Revision 0 10/3/2019
Page 20 of 111
5.0 Problem Definition and Background The enactment of the Clean Air Act of 1970 resulted in a major shift in the federal government's role in air pollution control. This legislation authorized the development of comprehensive federal and state regulations to limit emissions from both stationary or industrial sources and mobile sources. It also established the national ambient air quality standards, or NAAQS. The Clean Air Act and its amendments provide the framework for protecting air quality. To protect air quality, active environmental data collection operations were established and operated in a manner that assures the collection of the most applicable and highest quality data.
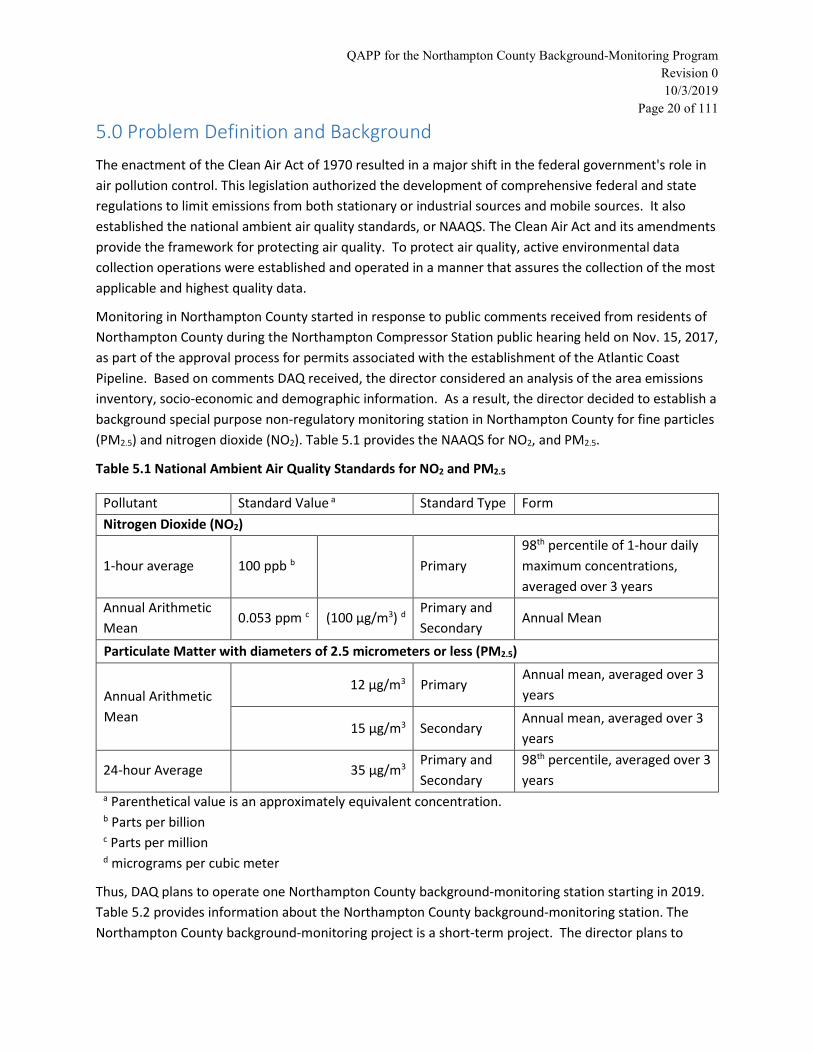
Monitoring in Northampton County started in response to public comments received from residents of Northampton County during the Northampton Compressor Station public hearing held on Nov. 15, 2017, as part of the approval process for permits associated with the establishment of the Atlantic Coast Pipeline. Based on comments DAQ received, the director considered an analysis of the area emissions inventory, socio-economic and demographic information. As a result, the director decided to establish a background special purpose non-regulatory monitoring station in Northampton County for fine particles (PM2.5) and nitrogen dioxide (NO2). Table 5.1 provides the NAAQS for NO2, and PM2.5.
Table 5.1 National Ambient Air Quality Standards for NO2 and PM2.5
Pollutant Standard Value a Standard Type Form Nitrogen Dioxide (NO2)
1-hour average 100 ppb b Primary 98th percentile of 1-hour daily maximum concentrations, averaged over 3 years
Annual Arithmetic Mean
0.053 ppm c (100 µg/m3) d Primary and Secondary
Annual Mean
Particulate Matter with diameters of 2.5 micrometers or less (PM2.5)
Annual Arithmetic Mean
12 µg/m3 Primary Annual mean, averaged over 3 years
15 µg/m3 Secondary Annual mean, averaged over 3 years
24-hour Average 35 µg/m3 Primary and Secondary
98th percentile, averaged over 3 years
a Parenthetical value is an approximately equivalent concentration. b Parts per billion c Parts per million d micrograms per cubic meter
Thus, DAQ plans to operate one Northampton County background-monitoring station starting in 2019. Table 5.2 provides information about the Northampton County background-monitoring station. The Northampton County background-monitoring project is a short-term project. The director plans to
QAPP for the Northampton County Background-Monitoring Program Revision 0 10/3/2019
Page 21 of 111
operate special purpose non-regulatory monitors for the first two years of the project. The director plans for the project to last two to five years, but has not established a firm end date. At the end of two years, the director and chief will reevaluate the designation of the monitors and change the designations as appropriate. Table 5.3 lists the projected schedule of activities for establishing the site and operating it.
Table 5.2 North Carolina Northampton County Background-Monitoring Location and Monitors
Site Name AQS Identifier Types of Monitors Operator
Northampton 37-131-0003 NO2 and continuous PM 2.5 (BAM 1022)
Raleigh Regional Office
Table 5.3 Anticipated Schedule of Activities
Activity Estimated Completion Date Submit QAPP to EPA for Approval March 29, 2018 Identify a Site Sept. 14, 2018 30-Day Public Comment Period Nov. 1 to 30, 2018 Site Setup Dec. 1, 2018 to April 15, 2019 Submit Amended Network Plan to EPA for Approval
Dec. 3, 2018
Receive Comments on QAPP from EPA Feb. 12, 2019 Respond to EPA Comments on QAPP Feb. 12 to March 12, 2019 Submit Revised QAPP to EPA March 12, 2019 Obtain EPA Approval of Amended Network Plan March 23, 2019 QAPP Approved by EPA May 31, 2019 Equipment Installation and Calibration June 1 to June 30, 2019 Data Collection / Analysis Hourly (NO2 every minute) Real-time Data Reporting Hourly to AirNow and website Data Verification Monthly, by end of 3rd week of following month Data Validation Monthly, within 20 days of data verification AQS Submittals Within 90 days after each quarter NO2 Performance Evaluations First quarter of operation, then annually Technical Systems Audit EPA every 3 years (if monitors converted to SLAMS) Internal Systems Audits RCO chemist every year Annual Certification Annually by May 1 of each year Review of Siting Criteria Annually Summary Report of Initial Results April 27, 2021 SLAMS – State and local air monitoring station
EPA policy requires that all projects involving the generation, acquisition, and use of environmental data
QAPP for the Northampton County Background-Monitoring Program Revision 0 10/3/2019
Page 22 of 111
be planned and documented and have an agency-approved QAPP. The QAPP is the critical planning document for any environmental data collection operation because it documents how the DAQ will implement QA and QC activities during the project’s life-cycle.
The purpose of this QAPP is to prescribe requirements, procedures, and guidelines for the DAQ Northampton County background-monitoring program. The DAQ intends this QAPP to serve as a reference document for implementing and expanding the QA program and provide detailed operational procedures for the measurement processes used by the DAQ. The QAPP should be particularly beneficial to the regional monitoring technicians, coordinator and RCO chemists responsible for implementing, designing, and coordinating the Northampton County background-monitoring project. The QAPP is a compilation of QA requirements, procedures, and guidelines applicable to air pollution measurement systems. The EPA and DAQ designed these requirements, procedures and guidelines to achieve a high percentage of valid data samples (greater than 75 percent) while maintaining integrity and accuracy. This QAPP clearly and thoroughly establishes QA protocols and QC criteria required to successfully implement and maintain the Northampton County background-monitoring program. The chief is responsible for ensuring the regional monitoring technicians, coordinator, ECB electronics technicians and RCO chemists implement and adhere to the QA programs for the field and data processing phases of the monitoring program.
The RCO chemists will review the QAPP and its associated SOPs annually and update them as needed or at least every five years. The RCO chemist will document the annual review of the QAPP by recording his or her name, signature, date and review results on the QAPP annual review documentation form.
QAPP for the Northampton County Background-Monitoring Program Revision 0 10/3/2019
Page 23 of 111
6.0 Project/Task Description The chief developed this QAPP to ensure that DAQ’s Northampton County background-monitoring network collects ambient pollutant data that meet or exceed EPA QA requirements. The database manager uploads these data into the EPA AQS database.
The Northampton County background-monitoring station will characterize background hourly NO2 and PM2.5 concentrations in Northampton County. The DAQ will also use the data from this site to provide the public with air pollution data in a timely manner by displaying the data on the DEQ and AirNow websites. In addition, after collecting 12 months of data, the DAQ may use the data for prevention of significant deterioration, or PSD, modeling for PSD permit applications. If the DAQ collects more than three complete calendar years of data, the chief may also use the data to determine if the area meets the NAAQS. Table 5.3 provides a timeline for establishing and operating the site. Section 10.1 provides additional objectives for the Northampton County background monitoring site.
The coordinator assigns the monitors operated at this site a scale of representativeness based on the definitions of 40 CFR Part 58, Appendix D. The spatial scale of representativeness describes the physical dimensions of a parcel of air, in which pollutant concentrations are reasonably homogeneous throughout. Based on the monitoring objective and site location, the data collected at the Northampton County background site will be representative of the background NO2 and PM2.5 concentrations on an urban scale level. This scale defines the concentrations within an area of city-like dimensions, approximately 4 to 50 kilometers.
The work required to collect, document, and report these data includes, but is not limited to:
- Establishing a monitoring network that has: · Appropriate density, location, and sampling frequency; and · Accurate and reliable data recording equipment, procedures, and software.
- Developing encompassing documentation for: · Data and report format, content, and schedules; · Quality objectives and criteria; and · SOPs providing activities and schedules for:
o Equipment operation and preventative maintenance; and o Instrument calibrations, zero, span and precision and accuracy
evaluations. - Establishing assessment criteria and schedules. - Verifying and validating data, according to the criteria and schedules established in this
QAPP - Certifying data.
Towards this end, the DAQ work products also include a series of assessments and reports to ensure the network and resulting data continuously meet or exceed regulatory requirements as specified in 40 CFR Part 58.12 and 58.16. The DAQ also maintains this QAPP and the associated SOPs reviewing and revising them every year and as needed, but at least once every five years, to ensure they continuously reflect
QAPP for the Northampton County Background-Monitoring Program Revision 0 10/3/2019
Page 24 of 111
the requirements of DAQ and the EPA. See Table 5.2 for a list of monitors at the Northampton County background-monitoring site.
6.1 Field Activities
DAQ personnel will perform those activities that support continued successful operation of the DAQ Northampton County background-monitoring network. Personnel will perform field activities that include, but are not necessarily limited to, conducting calibrations and routine QC checks, performing periodic preventative maintenance and servicing equipment located at the Northampton County background air monitoring station. Operational servicing activities may include, but may not be limited to, recording pertinent field data and restocking consumables at the monitoring site. Additional field activities include relocating the site and/or locating suitable monitoring sites for possible expansion of the network. Section 4.2.3 Raleigh Regional Office provides a more complete description of the field activities that regional monitoring technicians may perform. The ECB electronics technicians also perform annual performance evaluations on the deployed monitors.
6.2 ECB Activities
The DAQ ECB electronics technicians will perform those activities necessary to support the successful operation of the Northampton County background-monitoring network. They will perform electronic laboratory activities consistent with certifying, calibrating and testing all equipment before installing it in the field. In addition, ECB electronics technicians will perform any functions necessary to support the deployed field equipment. Section 4.2.2 Electronics and Calibration Branch provides a more complete description of the activities the ECB electronics technicians may perform.
6.3 Project Assessment Techniques
An assessment is an evaluation process used to measure the performance or effectiveness of a system and its elements. As used here, “assessment” is an all-inclusive term used to denote any of the following: audit, performance evaluation, peer review, inspection, or surveillance. Section 20.0 Assessments and Response Actions discusses the details of assessments. Table 6.1 provides information on the parties implementing assessments and their frequency.
Table 6.1 Assessment Schedule
Assessment Type Assessment Agency Frequency EPA Technical Systems Audit EPA Region 4 Every 3 years
Internal Systems Audit State As needed
Network Assessment EPA Region 4
State Every 5 years
Network Review and Network Plan EPA Region 4
State Annually
Quarterly Completeness State Quarterly
Annual Data Certification State Annually
QAPP for the Northampton County Background-Monitoring Program Revision 0 10/3/2019
Page 25 of 111
Table 6.1 Assessment Schedule
Assessment Type Assessment Agency Frequency Quality Assurance Project Plan Review and Updates
State Review annually
Update every 5 years
Standard Operating Procedures Reviews
State Review Annually
Update as needed and at least every 5 years
Data Quality Assessment State
AMP256 and AMP600 (regulatory monitors only)
Review Quarterly and Annually Control Chart
Review Daily and Monthly
Annual Performance Evaluation State At least once per calendar year and
every 365 days
National Performance Audit Program EPA-designated
contractor
20 percent of PQAO sites per year/each PQAO site once every six
years
PM2.5 Performance Evaluation Program
EPA-designated contractor
8 valid audits per year for PQAO/each PQAO primary monitor audited every
6 years
Semi-annual Flow Rate Audit State At least once every 6-months,
preferably every quarter
6.4 Project Records
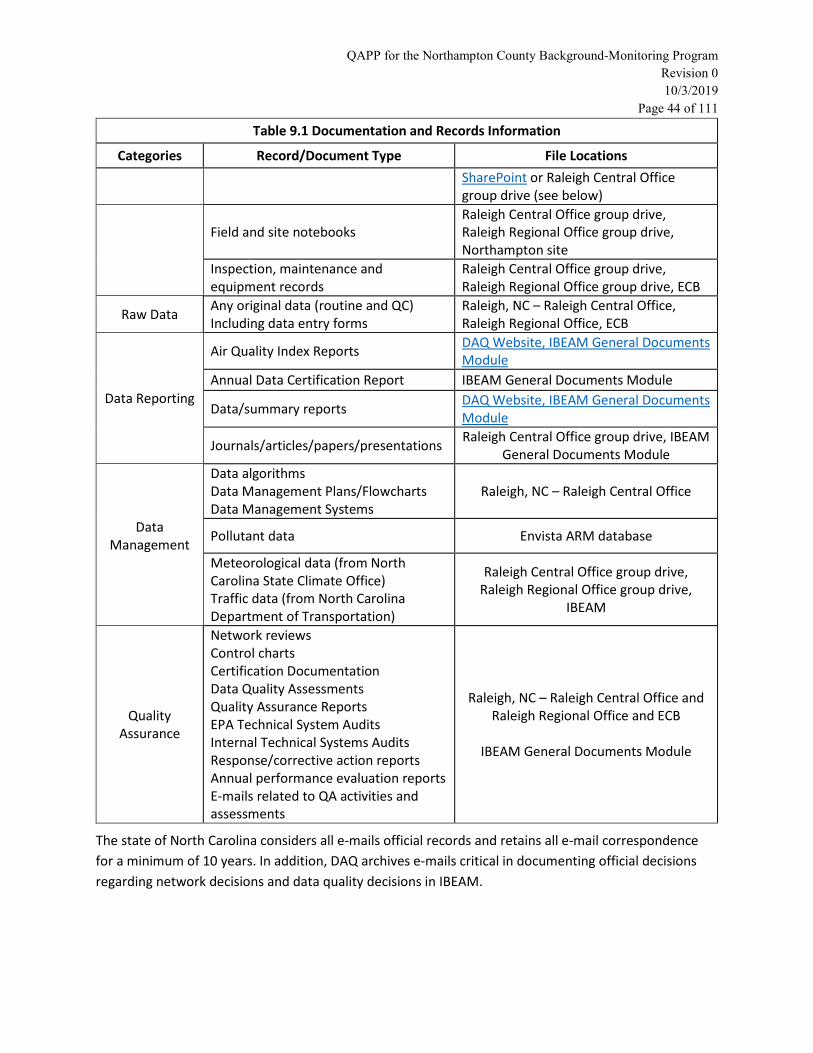
DAQ will establish and maintain procedures for the timely preparation, review, approval, issuance, use, control, revision, and maintenance of documents and records. Table 6.2 presents the categories and types of records and documents that are applicable to document control for ambient air quality information. Section 9.0 Documentation and Records explains information on key documents in each category in more detail.
Table 6.2 Critical Documents and Records
Categories Record/Document Type
Site Information
Network descriptions Site files Site maps Site pictures
Environmental Data Operations
Quality assurance project plans Standard operating procedures Field notebooks and logbooks Inspection/maintenance records
QAPP for the Northampton County Background-Monitoring Program Revision 0 10/3/2019
Page 26 of 111
Table 6.2 Critical Documents and Records
Categories Record/Document Type Raw Data Any original data (routine and QC) including data entry forms
Data Reporting Annual data certification Data/summary reports
Data Management Data algorithms Data management plans/flowcharts Data management systems
Quality Assurance
Network reviews and assessments Data quality assessments Quality assurance reports EPA Technical systems audit reports Internal systems audit reports Response/corrective action documentation Annual performance evaluation reports Certification documentation
QAPP for the Northampton County Background-Monitoring Program Revision 0 10/3/2019
Page 27 of 111
7.0 Quality Objectives and Criteria for Measurement Data The DAQ operates under an EPA-approved quality management plan that describes the agency’s system for communicating and implementing quality within the agency.
A quality system is a structured and documented set of management activities in which an organization applies sufficient QC practices to ensure the data produced by an operation will be of the type and quality needed and expected by the data user. Quality control defines the procedures implemented to assure that the regional monitoring technicians obtain and maintain acceptability in the generated data set. Quality control procedures, when properly executed, provide data that meet or exceed the minimally acceptable quality criteria established to assist management in making confident decisions. The policy of DAQ is to implement a QA program to assure the regional monitoring technicians collect data of known and acceptable precision, bias, sensitivity, completeness, comparability and representativeness within its ambient air-quality monitoring program.
Defined in Section 7.2, precision, bias, sensitivity, completeness, comparability, and representativeness are the principal data quality indicators (DQI) that provide qualitative and quantitative descriptions used in interpreting the degree of acceptability of data. Establishing acceptance criteria for these DQIs sets quantitative goals for the quality of data generated in the measurement process. Of the six principal DQIs, precision, sensitivity and bias are the quantitative measures, representativeness and comparability are qualitative measures and completeness is a combination of both qualitative and quantitative measures (US EPA QA/G-5, Appendix B1)”. The DAQ establishes the specific requirements of these six DQIs before data collection starts. The goal is to locate and eliminate (or minimize) bias, so the data collected show the true conditions of the area sampled. This includes consideration of siting criteria, spatial scales, monitoring objectives, climatic change, source configurations, and the duration of the study.
All individuals must adhere to the written procedures and methods in the QAPP for operating air monitoring instruments and handling data to assure quality data for 1) determining accurate background concentrations of NO2 and PM2.5 in Northampton County and 2) collecting data of sufficient quality to compare to the NAAQS, if the monitors operate for three complete calendar years. EPA-approved federal reference methods (FRM) are the designated methodologies and basis for operating pollutant-monitoring equipment, although the EPA allows agencies to use federal equivalent methods (FEM) as well.
7.1 Data Quality Objectives
This section provides a description of the data quality objectives (DQOs) for the Northampton County background-monitoring program for the state of North Carolina. Data quality objectives are qualitative and quantitative statements that:
QAPP for the Northampton County Background-Monitoring Program Revision 0 10/3/2019
Page 28 of 111
- Clarify the intended use of the data, - Define the type of data needed, and - Specify the tolerable limits on the probability of making an erroneous decision due to
uncertainty in the data.
In general, the goal of the Northampton County background-monitoring program is to determine the background one-hour concentrations of NO2 and PM2.5 expected in the Roanoke Rapids, North Carolina, core-based statistical area. The chief will also use the data to determine the air quality index and to report real-time data to AirNow and the DEQ website. After the DAQ collects 12 months of data, the DAQ may also use the data for PSD modeling in support of PSD permit applications. If the Northampton County background-monitoring program lasts for more than three complete calendar years, the DAQ will also use the data to ensure the air quality in Northampton County meets the NAAQS.
The data necessary to meet the goals of the Northampton County background-monitoring program are:
• Continuous hourly averaged NO2 (including nitric oxide [NO] and oxides of nitrogen [NOx]) and PM2.5 concentration data collected by FEMs;
• Continuous shelter temperature measurements for ensuring conformity to environmental requirements of the NO2 monitor;
• Precision measurements; • Bias measurements; • Locational measurements (geographical, topographical, etc.); and • Minute data for the gaseous pollutants.
The chief will use these data to:
- Determine background concentrations of NO2 and PM2.5 in Northampton County, - Provide real-time data to the public, - Provide data for PSD modeling in support of PSD permit applications, after the monitors
collect 12 months of data, and - Evaluate compliance with the NAAQS, if the monitors operate for three complete calendar
years or more.
The appendices to 40 CFR Part 58 explain the data reporting and handling conventions and computations necessary for determining whether the NAAQS are met for each pollutant.
The DQO process defines tolerable limits on the probability of making a wrong decision because of uncertainty in the data (that is, limits on the probability of coming up with a false positive or a false negative error). A decision maker encounters a false positive error when the data indicate a monitor exceeded the NAAQS when in fact, due to random deviations in the data, the monitor did not exceed it. Alternately, a decision maker encounters a false negative error when the data indicate the monitor did not exceed a NAAQS, when in fact, due to random deviations in the data, the monitor did exceed the NAAQS. Using the formal DQO process EPA determined the objectives to control precision and bias to reduce the probability of decision errors. The DQOs are provided in 40 CFR Part 58, Appendix A, Section 2.3.1. For the Northampton County background-monitoring program, the DAQ has adopted EPA’s DQOs
QAPP for the Northampton County Background-Monitoring Program Revision 0 10/3/2019
Page 29 of 111
listed in Table 7.1, with the acceptable precision, measured by coefficient of variation (CV), and acceptable bias for each pollutant. For the PM2.5 monitor, DAQ will determine precision at the Northampton County background-monitoring site based on precision measured at other collocated beta attenuation monitor (BAM) 1022 sites in the PQAO.
Table 7.1. Acceptable Precision as Measured by Coefficient of Variation (CV) and Bias for the Northampton County Background Monitoring Program
≤10 percent CV Within plus or minus (±) 10 percent
NO2 upper 90 percent confidence limit for the CV of ≤15 percent
Upper 95 percent confidence limit for the absolute bias of ≤15 percent
The DAQ calculates coefficient of variation and absolute bias using the procedures in 40 CFR Part 58, Appendix A, Section 4.
7.2 Measurement Quality Objectives
As air pollution measurement systems increase in both cost and complexity, it becomes essential to have a methodology that will, in a cost-effective manner, increase the completeness and precision and decrease the bias of the data produced by the air-pollution measurement systems.
Once a DQO is established, the DAQ evaluates and controls the quality of the data to ensure that the DAQ maintains data quality within the established acceptance criteria. The EPA designed the MQOs to evaluate and control various phases (sampling, preparation, analysis) of the measurement process to ensure that total measurement uncertainty is within the range prescribed by the DQOs. The DAQ defines the MQOs for North Carolina’s Northampton County background-monitoring program in terms of the following DQIs:
- Precision - “Precision is a measure of agreement between two replicate measurements of the same property, under prescribed similar conditions. (US EPA QA/G-5, Appendix B.” This agreement is calculated as the standard deviation. This is the random component of error. The DAQ calculates this value using percent difference as described in 40 CFR Part 58, Appendix A, Section 4.
- Bias - “Bias is the systematic or persistent distortion of a measurement process that causes errors in one direction (US EPA QA/G-5, Appendix B).” Bias is determined by estimating the positive and negative deviation from the true value as a percentage of the true value.
- Comparability - “Comparability is the qualitative term that expresses the confidence that two data sets can contribute to a common analysis and interpolation. Comparability must be carefully evaluated to establish whether two data sets can be considered equivalent regarding the measurement of a specific variable or groups of variables (US EPA QA/G-5, Appendix B).”
QAPP for the Northampton County Background-Monitoring Program Revision 0 10/3/2019
Page 30 of 111
- Representativeness - “Representativeness is a measure of the degree to which data accurately and precisely represent a characteristic of a population parameter at a sampling point or for a process condition or environmental condition. Representativeness is a qualitative term that DAQ evaluates to determine whether in situ or other measurements are made and physical samples collected in such a manner that the resulting data appropriately reflect the media and phenomenon measured or studied (US EPA QA/G-5, Appendix B).”
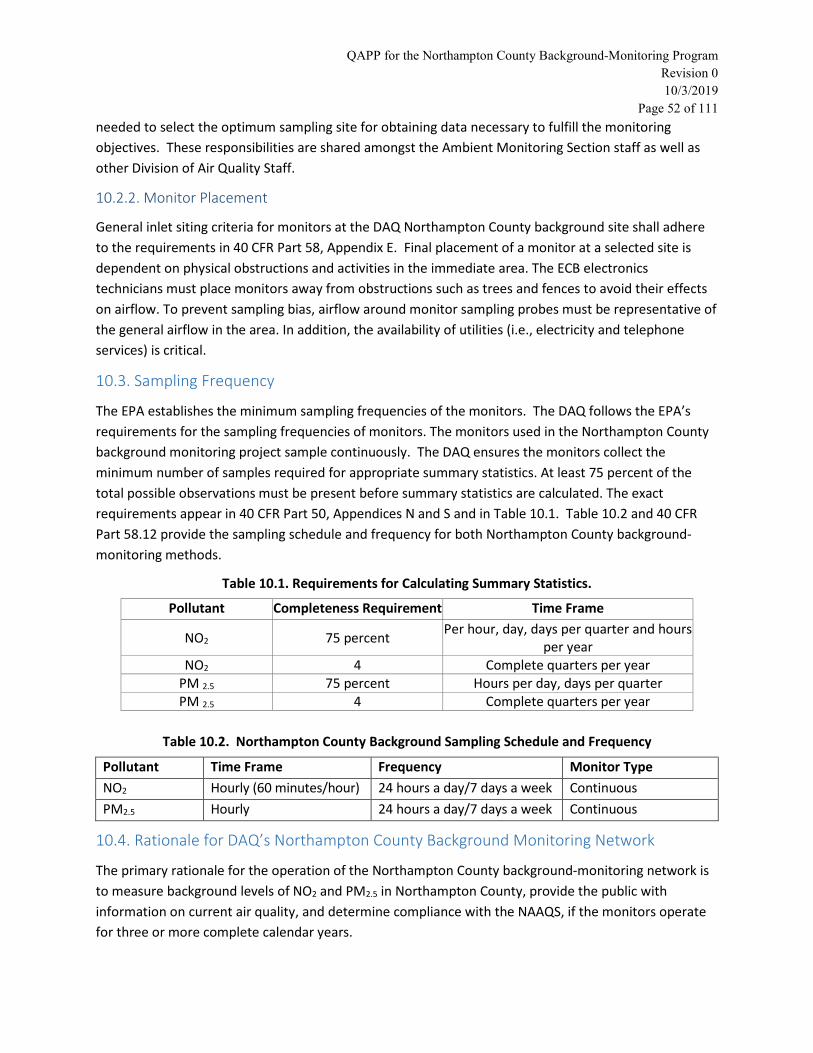
- Completeness - Completeness is a metric quantifying the amount of valid data obtained from a measurement system compared to the expected amount obtained under correct, normal conditions. The DAQ expresses completeness as a percentage. Data completeness requirements are included in 40 CFR Part 50, Appendix N (Sections 4.1 and 4.2) for PM2.5 and in 40 CFR Part 50, Appendix S for NO2.
- Sensitivity – “Sensitivity is the capability of a method or instrument to discriminate between measurement responses representing different levels of a variable of interest (US EPA QA/G-5, Appendix B).” The DAQ determines sensitivity by using the Single Point Precision and Bias Report on the EPA’s outdoor air quality site. Currently the DAQ does not perform annual MDL studies but relies on manufacturer’s specifications for IDL or something similar.
For each of these attributes, the RCO chemists developed acceptance criteria using various parts of 40 CFR Parts 50, 53 and 58 and EPA-supplied guidance documents. Tables 7.2 and 7.3 list the MQOs for North Carolina’s Northampton County background-monitoring program. The RCO chemists based these tables on the validation templates in the EPA Quality Assurance Handbook for Air Pollution Measurements Systems, Volume II, referred to as the QA Handbook. As described in the QA Handbook and implemented here, for each pollutant, Tables 7.2 and 7.3 list three validation criteria: critical, operational and systematic. The tables discriminate between:
• Criteria that must be met to ensure the quality of the data, i.e., critical criteria, • Criteria that indicate there may be issues with the quality of the data and further investigation is
warranted before determining the validity of the sample or samples, i.e., operational criteria, and
• Criteria that indicate a potentially systematic problem with the environmental data collection activity that may affect the ability to make decisions with the data, i.e., systematic criteria.
For each criterion, the tables include: (1) the requirement, (2) the frequency with which compliance is to be evaluated, (3) the acceptance criteria, and (4) information where the requirement can be found or additional guidance on the requirement.
North Carolina has adopted and implemented EPA Region 4’s LSASD recommended warning limits or an even stricter warning limit for NO2 monitoring. The RCO chemists define warning limits as the level of allowable imprecision before a regional monitoring technician must calibrate an analyzer or take other corrective action. The RCO chemists set the warning limits lower than the MQOs or control limits to reduce imprecision and bias and enhance data recovery.
QAPP for the Northampton County Background-Monitoring Program Revision 0 10/3/2019
Page 31 of 111
The RCO chemists define control limits as the level of allowable imprecision before data invalidation and corrective actions are required. The RCO chemists cannot set control limits higher than the MQOs. The RCO chemists use these limits when validating ambient air measurements against single point precision checks. The use of control limits strengthens the precision of these measurements and improves the data validation practices to meet regulatory requirements. Table 7.2 and 7.3 includes both the warning and control limits.
Other elements, as well as the SOPs associated with this QAPP that are specific to each monitor type, provide more detailed descriptions of these MQOs and how they will be used to control and assess measurement uncertainty.
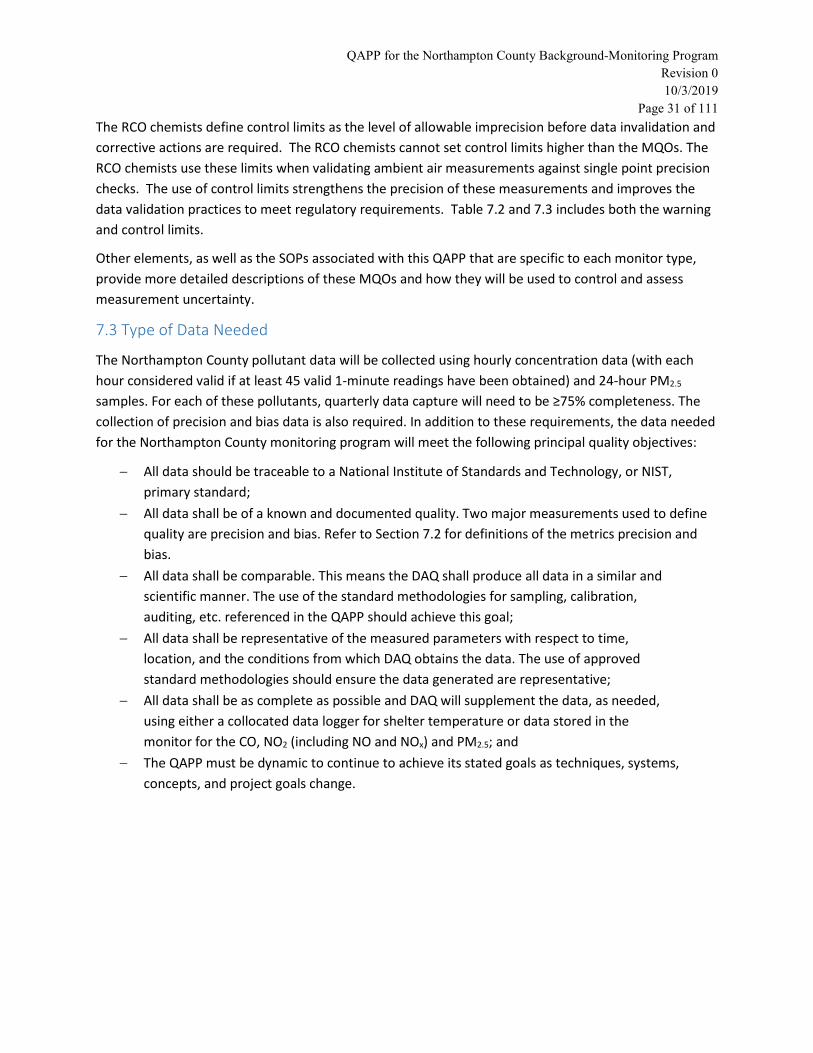
7.3 Type of Data Needed
The Northampton County pollutant data will be collected using hourly concentration data (with each hour considered valid if at least 45 valid 1-minute readings have been obtained) and 24-hour PM2.5 samples. For each of these pollutants, quarterly data capture will need to be ≥75% completeness. The collection of precision and bias data is also required. In addition to these requirements, the data needed for the Northampton County monitoring program will meet the following principal quality objectives:
− All data should be traceable to a National Institute of Standards and Technology, or NIST, primary standard;
− All data shall be of a known and documented quality. Two major measurements used to define quality are precision and bias. Refer to Section 7.2 for definitions of the metrics precision and bias.
− All data shall be comparable. This means the DAQ shall produce all data in a similar and scientific manner. The use of the standard methodologies for sampling, calibration, auditing, etc. referenced in the QAPP should achieve this goal;
− All data shall be representative of the measured parameters with respect to time, location, and the conditions from which DAQ obtains the data. The use of approved standard methodologies should ensure the data generated are representative;
− All data shall be as complete as possible and DAQ will supplement the data, as needed, using either a collocated data logger for shelter temperature or data stored in the monitor for the CO, NO2 (including NO and NOx) and PM2.5; and
− The QAPP must be dynamic to continue to achieve its stated goals as techniques, systems, concepts, and project goals change.
QAPP for the Northampton County Background-Monitoring Program Revision 0 10/3/2019
Control limit ≤ ±15.0 percent (percent difference) or <±1.5 ppb difference,
whichever is greater
1 and 2) 40 CFR Part 58, Appendix A, Section 3.1.1 3) Recommendation based on DQO in 40 CFR Part 58, Appendix A, Section 2.3.1.4 (see DAQ NO2 SOP for details.) QC check concentration range 0.005 - 0.080 ppm and 05/05/2016 Technical Note on AMTIC. Relative to routine concentrations
1 and 2) QA Handbook Volume 2 Section 12.3 3) Recommendation and related to DQO (see DAQ NO2 SOP for details.)
Converter Efficiency During multi-point calibrations, span
and audit 1/ 14 days
(≥96 percent) 96 – 104.1 percent
1) 40 CFR Part 50, Appendix F, Section 1.5.10 and 2.4.10 2) Recommendation (see DAQ NO2 SOP.) 3) 40 CFR Part 50, Appendix F, Section 1.5.10 and 2.4.10 Regulation states ≥ 96 percent, 96 – 104.1 percent is a recommendation.
Shelter Temperature Range Daily (hourly values) 20 to 30 ° C. (hourly average) 1, 2 and 3) QA Handbook Volume 2, Section 7.2.2
OPERATIONAL CRITERIA- NO2 Shelter Temperature Control Daily (hourly values) ≤ ± 2.0 ° C Standard Deviation over 24
Shelter Temperature Device Check 1/182 days and 2/calendar year ± 2.0 ° C of standard 1, 2 and 3) QA Handbook Volume 2, Section 7.2.2
Annual Performance Evaluation Single Analyzer 1/365 days and 1/ calendar year
Percent difference of audit levels 3-10 ≤ ±15.0 percent Audit levels 1 and 2 ± 1.5 ppb
difference or < ±15.1 percent
1) 40 CFR Part 58, Appendix A, section 3.1.2 2) 40 CFR Part 58, Appendix A, section 3.1.2 3) Recommendation - 3 audit concentrations not including zero. (See DAQ ECB NO2 SOP for details.) AMTIC guidance 5/3/2016
Federal Audits (NPAP) 100 percent of sites every 6 years;
20 percent of sites audited each calendar year
Audit levels 1 and 2 ≤ ± 1.5 ppb difference all other levels percent difference < ± 15.1
percent
1) 40 CFR Part 58, Appendix A, section 3.1.3 2) NPAP adequacy requirements on AMTIC 3) NPAP QAPP/SOP
(NO2) 2) Frequency 3) Acceptance Criteria Information /Action
Verification/Calibration
Upon receipt/adjustment/repair/ installation/moving/failure of
zero/span or 1-point-QC check 1/365 days
> 10.0 percent excess NO Span within ± 3 percent of expected
Precision point within ± 5 percent of expected Zero within ± 1 ppb of expected
(Instrument residence time ≤ 2 min All points
<± 2.1% or ≤ 1.5 ppb difference of best-fit straight line whichever is greater and Slope 1
± 0.5)
1) 40 CFR Part 50, Appendix F 2 and 3) Recommendation based on instrument manual and experience (see DAQ NO2 SOP for details.) Multi-point calibration (0 and 2 upscale points) (Verification/Calibration procedure being revised at the time of this QAPP revision - Slope criteria is a recommendation)
Gaseous Standards All gas cylinders
NIST Traceable (e.g., EPA Protocol Gas)
10-25 ppm b of NO in Nitrogen with < 1 ppm NO2
1) 40 CFR Part 50, Appendix F, Section 1.3.1 and 01/30/2018 EPA Technical Note 2) Not applicable Green book 3) 40 CFR Part 50, Appendix F, Section 1.3.1 requires 50 -100 ppm but to successfully calibrate the photolytic monitor DAQ found using 10 to 25 ppm works better Guidance Document Gas producer used must participate in EPA Ambient Air Protocol Gas Verification Program 40 CFR Part 58, Appendix A, section 2.6.1
Zero Air/ Zero Air Check 1/365 days and 1/ calendar year Concentrations below lower detectable level c 1) 40 CFR Part 50, Appendix F, Section 1.3.2 2 and 3) Recommendation
Gas Dilution Systems 1/365 days or after failure of 1-point-QC check or performance
evaluation; 1/calendar year Accuracy < ± 2.1 percent
1,2 and 3) Recommendation based on SO2 requirement in 40 CFR Part 50, Appendix A-1, Section 4.1.2
Detection (FEM/FRMs) Noise and lower detectable limits are part of the FEM/FRM requirements.
Noise Determined by manufacturer at purchase ≤ 0.005 ppm
1) 40 CFR Part 53.23 (b) (definition and procedure) 2) Not applicable 3) 40 CFR Part 53.20, Table B-1
Lower detectable level Determined by manufacturer at purchase ≤ 0.01 ppm
1) 40 CFR Part 53.23 (c) (definition and procedure) 2) Recommendation 3) 40 CFR Part 53.20, Table B-1
SYSTEMATIC CRITERIA- NO2 Standard Reporting Units All data ppb d (final units in AQS) 1,2 and 3) 40 CFR Part 50, Appendix S, Section 2 (c)
Rounding convention for All data 1 place after decimal with digits to right 1, 2 and 3) 40 CFR Part 50, Appendix S, Section 4.2 (a)
2) Frequency 3) Acceptance Criteria Information /Action
data reported to AQ S truncated
Completeness
Annual Standard
≥ 75 percent hours in year
1) 40 CFR Part 50, Appendix S, section 3.1(b) 2) 40 CFR Part 50, Appendix S, section 3.1(a) 3) 40 CFR Part 50, Appendix S, section 3.1(b)
1-hour standard
1) 3consecutive calendar years of complete data
2) 4 quarters complete in each year 3) ≥75 percent sampling days in quarter
4) ≥ 75 percent of hours in a day
1) 40 CFR Part 50, Appendix S, section 3.2(b) 2) 40 CFR Part 50, Appendix S, section 3.2(a) 3) 40 CFR Part 50, Appendix S, section 3.2(b) More details in 40 CFR Part 50, Appendix S
Sample Residence Time Verification 1/365 days and 1/calendar year ≤ 20 seconds
1) 40 CFR Part 58, Appendix E, section 9 (c) 2) Recommendation (See DAQ ECB NO2 SOP for details.) 3) 40 CFR Part 58, Appendix E, section 9 (c)
Sample Probe, Inlet, Sampling train All sites Borosilicate glass (e.g., Pyrex®) or Teflon™
1, 2 and 3) 40 CFR Part 58, Appendix E, section 9 (a) The EPA accepts FEP and PFA as equivalent material to Teflon™. Replacement every two years and more frequent if pollutant load or contamination dictate
a -National Institute of Standards and Technology b-parts per million c-Lower Detection Limit d-parts per billion
Siting 1/365 days and 1/calendar year Meets siting criteria or waiver documented
1) 40 CFR Part 58, Appendix E, sections 2-6 2) Recommendation (See DAQ Annual Network Review SOP) 3) 40 CFR Part 58, Appendix E, sections 2-6
Precision (using 1-point-QC checks)
Calculated annually and as appropriate for design value
1) 40 CFR Part 58, Appendix A, section 2.3.1.4 and 3.1.1 2) 40 CFR Part 58, Appendix A, section 4 (b) 3) 40 CFR Part 58, Appendix A, section 4.1.3
AMTIC – Ambient Monitoring Technology Information Center FEP – Fluorinated ethylene propylene
PFA - perfluoroalkoxy
QAPP for the Northampton County Background-Monitoring Program Revision 0 10/3/2019
Page 35 of 111
Table 7.3. PM2.5 Measurement Quality Objectives: PM2.5 (Continuous Met One BAM 1022, Local Conditions [LC]) 1) Criteria (PM2.5 LC) 2) Frequency 3) Acceptable Range Information /Action
CRITICAL CRITERIA - PM2.5 Continuous, BAM 1022, Local Conditions Field Activities Sampling Instrument
Sampler/Monitor Not applicable meets requirements listed in FRM/FEM designation
1) 40 CFR Part 58, Appendix C, Section 2.1 2) Not applicable 3) 40 CFR Part 53 and FRM/FEM method list
Firmware of monitor
At setup
1. Must be the firmware (or later version) as identified in the published method designation summary. 2. Firmware settings must be set for flowrate to operate and report at “local conditions” (i.e., not STP)
1. the calculation of an hour of data is dependent on the design of the method. 2. A 24-hour period is calculated in AQS if 18 or more valid hours are reported for a day.
See operator’s manual. Hourly data are always reported as the start of the hour on local standard time. 40 CFR Part 50, Appendix N, Section 3(c)
Sampling Instrument PM10 Inlet (if applicable to method designated)
At setup
Must be a Louvered PM10 size selective inlet as specified in 40
CFR Part 50, Appendix L, Figures L-2 through L-19
QAPP for the Northampton County Background-Monitoring Program Revision 0 10/3/2019
Page 36 of 111
Table 7.3. PM2.5 Measurement Quality Objectives: PM2.5 (Continuous Met One BAM 1022, Local Conditions [LC]) 1) Criteria (PM2.5 LC) 2) Frequency 3) Acceptable Range Information /Action
PM2.5 second state separator (if applicable to method designated)
At setup
Must be a BGI Inc. Very Sharp Cut Cyclone (VSCC™) or equivalent second stage
separator approved for the method.
The other approved second stage separator option for select FEMs is the Dichot.
Average Flow Rate every 24 hours of operation average within 5 percent of 16.67 liters/minute at local
conditions
1, 2 and 3) 40 CFR Part 50, Appendix L, Section 7.4.3.1
Variability in Flow Rate every 24 hours of operation
CV ≤ 2 percent 1, 2 and 3) 40 CFR Part 50, Appendix L, Section 7.4.3.2
One-point Flow Rate Verification
1/30 days, separated by 14 days
< ± 4.1 percent of transfer standard (DAQ’s warning limit is ≤± 3 percent of transfer standard); < ± 5.1 percent of flow rate design value (DAQ’s warning limit is ≤± 4 percent of flow rate design value)
1, 2 and 3) 40 CFR Part 50, Appendix L, Section 9.2.5 and 7.4.3.1 and 40 CFR Part 58, Appendix A, Section 3.2.3 and 3.3.2 3) DAQ’s warning limit for percent of transfer standard and flow design value is 3 and 4 percent respectively, DAQ BAM SOP, Section 7.0
Design Flow Rate Adjustment
After multi-point calibration or verification
< ± 2.1% of design flow rate 1, 2 and 3) 40 CFR Part 50, Appendix L, Section 9.2.6
External Leak Check
Before each flow rate verification/calibration and before and after PM2.5 separator maintenance
Method specific
See operator’s manual
1) 40 CFR Part 50, Appendix L, Section 7.4.6.1 2) 40 DFR Part 50, Appendix L, Section 9.2.3 and Method 2-12, Section 7.4.3 3) 40 CFR Part 50, Appendix L, Section 7.4.6.1
Internal Leak Check If failure of external leak check
QAPP for the Northampton County Background-Monitoring Program Revision 0 10/3/2019
Page 37 of 111
Table 7.3. PM2.5 Measurement Quality Objectives: PM2.5 (Continuous Met One BAM 1022, Local Conditions [LC]) 1) Criteria (PM2.5 LC) 2) Frequency 3) Acceptable Range Information /Action
1) 40 CFR Part 50, Appendix L, Section 9.2 2) 40 CFR Part 50, Appendix L, Section 9.1.3, Method 2.12 Table 6-1 and 6-3 3) Recommendation
Other Monitor Calibration/Checks
Per manufacturers’ operating manual
Annual zero test on Met One BAM 1022
Per manufacturers operating manual. NOTE: More frequent zero test may be appropriate in areas with seasonal changes in dew-point.
Precision
Collocated Samples Every 12 days or 15% of sites by method designation
CV < 10.1% of samples ≥ 3 µg/m3
1 and 2) 40 CFR Part 58, Appendix A, Section 3.2.3 3) Recommendation based on DQO in 40 CFR Part 58, Appendix A, Section 2.3.1.1
Accuracy
Temperature Audit Every 180 day and at time of flow rate audit < ± 2.1 ° C 1, 2 and 3) Method 2.12, Section 11.2.2
QAPP for the Northampton County Background-Monitoring Program Revision 0 10/3/2019
Page 38 of 111
Table 7.3. PM2.5 Measurement Quality Objectives: PM2.5 (Continuous Met One BAM 1022, Local Conditions [LC]) 1) Criteria (PM2.5 LC) 2) Frequency 3) Acceptable Range Information /Action
Pressure Audit Every 180 days and at time of flow rate audit
< ± 4.1 % of audit standard < ± 5.1 % of design flow rate
1 and 2) 40 CFR Part 58, Appendix A, Section 3.3.3 3) Method 2.12, Section 11.2.1, NC’s action limit goal for percent of transfer standard and flow design value is ± 3 and ± 4 percent respectively, NC DAQ BAM SOP, Section 5.0
Monitor Maintenance PM2.5 Separator (VSCC) Every 30 days Cleaned/changed 1, 2 and 3) Method 2.12, Section 8.3.3
Inlet Cleaning Every 30 days Cleaned /changed 1,2 and 3) Method 2.12, Section 8.3 Downtube Cleaning Every 90 days Cleaned 1, 2 and 3) Method 2.12 Section 8.4 Filter Housing Assembly Cleaning
Every 30 days Cleaned 1, 2 and 3) Method 2.12, Section 8.3
Circulating Fan Filter Cleaning
Every 30 days Cleaned 1, 2 and 3) Method 2.12 Section 8.3
Manufacturer-recommended Maintenance
Per manufacturers’ SOP
Per manufacturers’ SOP
Design Flow Rate Adjustment
At multi-point calibration ± 2 % of design flow rate 1, 2 and 3) 40 CFR Part 50, Appendix L, Section 9.2.6
BAM Specific Operational Criteria BAM check of membrane span foil Quarterly Average < + 5.1 % of ABS 1, 2 and 3) Applies on the BAM 1022
BAM electrical grounding
At setup
1. Is the chassis of the BAM grounded. 2. Is the downtube grounded to the chassis at the collar (i.e., with setscrews)?
Per operator manual
QAPP for the Northampton County Background-Monitoring Program Revision 0 10/3/2019
Page 39 of 111
Table 7.3. PM2.5 Measurement Quality Objectives: PM2.5 (Continuous Met One BAM 1022, Local Conditions [LC]) 1) Criteria (PM2.5 LC) 2) Frequency 3) Acceptable Range Information /Action
Nozzle Cleaning Every 30 days, or more often as needed Cleaned Per operator manual
Zero Test Yearly Standard deviation of the data
from a 72-hour zero test < 2.4 µg/m3
Per operator manual
SYSTEMATIC CRITERIA - PM2.5 Continuous, BAM 1022, Local Conditions
Siting 1/365 days Meets siting criteria or waiver documented
1) 40 CFR Part 58, Appendix E, sections 2-5 2) Recommendation 3) 40 CFR Part 58, Appendix E, sections 2-5
Data Completeness Annual Standard ≥ 75 percent 1, 2 and 3) 40 CFR Part 50, Appendix N, Section
4.1(b) and 4.2(a) 24-hour standard ≥ 75 percent
Reporting Units all hourly and 24-hour values
µg/m3 at ambient temperature/pressure (PM2.5)
1, 2 and 3) 40 CFR Part 50, Appendix N, Section 3.0(b)
Rounding convention for data reported to AQS
all 1-hour averages to 1 decimal place, with
additional digits to the right being truncated
1, 2 and 3) 40 CFR Part 50, Appendix N, Section 3.0(b)
Annual 3-yr average all concentrations nearest 0.1 µg/m3 (≥ 0.05 round up)
1, 2 and 3) 40 CFR Part 50, Appendix N, Section 3 and 4. Rounding rule for AQS data is a recommendation.
24-hour, 3-year average all concentrations nearest 1 µg/m3 (≥ 0.5 round
up)
1, 2 and 3) 40 CFR Part 50, Appendix N, Section 3 and 4. Rounding rule for AQS data is a recommendation.
Recertification of Standard Verifications and Calibrations - All standards should have multi-point certifications against NIST-Traceable standards
Flow Rate Transfer Standard Every 365 days and 1/year < ±2.1 % of NIST-traceable
standard
1) 40 CFR Part 58, Appendix L, Section 9.1 and 9.2 2) Method 2.12, Section 4.2.3 and 6.3.3 3) 40 CFR Part 58, Appendix L, Section 9.1 and 9.2
Field Thermometer Every 365 days and 1/year <±0.1 degrees C resolution, ± 0.5 degrees C accuracy 1, 2 and 3) Method 2.12, Section 4.2.2.2
QAPP for the Northampton County Background-Monitoring Program Revision 0 10/3/2019
Page 40 of 111
Table 7.3. PM2.5 Measurement Quality Objectives: PM2.5 (Continuous Met One BAM 1022, Local Conditions [LC]) 1) Criteria (PM2.5 LC) 2) Frequency 3) Acceptable Range Information /Action
Field Barometer Every 365 days and 1/year ± 1 mm mercury resolution ± 5mm mercury accuracy 1, 2 and 3) Method 2.12, Section 4.2.2.2
Field Manometer Every 365 days and 1/year ± 0.1 inches water resolution ± 1.0 inch water accuracy 1, 2 and 3) Method 2.12, Section 4.2.2.2
Clock / Timer Verification Once every 30 days ± 1 minute per month 1 and 2) Method 2.12, Table 8.1
3) 40 CFR Part 58, Appendix L, Section 7.4.12 Precision Single analyzer (collocated monitors 1/91 days CV ≤ 10.1 % for values ≥ 3.0
µg/m3 1, 2 and 3) Recommendation to provide early (quarterly) evaluation of achievement of DQOs.
Primary PQAO Annual and 3-year estimates
90 % confidence limit of CV < 10.1 percent for values ≥ 3.0
µg/m3
1,2 and 3) 40 CFR Part 58, Appendix A, Section 4.2.1, and 2.3.1.1
Bias
Performance Evaluation Program (PEP)
5 valid audits for PQAOs with < 5 sites 8 valid audits for PQAOs with > 5 sites; each PQAO primary monitor audited every six years
< ± 10 1 percent for values > 3.0 µg/m3
1,2 and 3) 40 CFR Part 58, Appendix A, Section 3.2.7, 4.3.2 and 2.3.1.1
CV= Coefficient of Variation LPM = liters per minute
QAPP for the Northampton County Background-Monitoring Program Revision 0 10/3/2019
Page 41 of 111
8.0 Training Requirements Adequate education and training are integral to any monitoring program that strives for reliable and comparable data. DAQ personnel will meet the educational requirements, accountability standards and training requirements for their positions. DAQ requires all staff to take specific, mandatory governmental training courses, such as safety training, defensive driving and harassment awareness courses, among others. The DAQ maintains records on personnel qualifications and training in several locations, dependent upon the applicability of the information. For example, staff may maintain copies of certificates received from classes or workshops, whereas human resources will keep records of personnel qualifications.
The DAQ aims ambient air monitoring training at increasing the effectiveness of employees as well as the effectiveness of DAQ as a whole. In general, training for the ambient-air monitoring program consists of a combination of required reading, monthly ambient monitoring workgroup calls, active cross-training amongst staff, completion of EPA-led training classes and attendance at DAQ and EPA workshops and conferences. Observations made during internal systems audits or EPA technical systems audits, or TSAs, may result in the need for specific refresher training provided by DAQ staff.
Regarding required reading, documents monitoring personnel must read shall include this QAPP and the SOPs and instrument manuals specific to the equipment personnel will be working with or servicing. Employee supervisors typically document required reading on a form indicating the employee has read and understood the QAPP or SOP; however, at the time of this QAPP revision the DAQ is working with DEQ management to develop alternate procedures.
All positions have a training guide that provides suggested training for employees to complete to achieve competency in that position. DAQ makes efforts to ensure staff receive timely training and periodic refreshers in accordance with the established training guide. Experienced staff members provide on-the-job training. As the RRO has the largest ambient monitoring staff with the most diversified monitoring equipment, the chief often calls upon the RRO to provide hands-on training when needed. The chief, PPB supervisor or equivalent typically arranges for this training. In some cases, the chief calls upon other regional offices, the ECB and PPB chemists to provide hands-on training. The employee documents this training in the employee’s VIP or the LMS.
The DAQ supervisors actively encourage all employees to pursue training opportunities whenever possible and as needed, because the chief continually evaluates DAQ’s monitoring network to ensure it continues to meet its objectives. Because of these evaluations, the chief could add new equipment, procedures or new personnel to the project. DAQ provides vendor-based training for its personnel when DAQ obtains new equipment. The employees document this training in the North Carolina Learning Management System, or LMS. Additionally, personnel are encouraged to periodically identify, request, and attend pertinent courses and seminars. The DAQ may provide these courses and seminars as videotapes, closed circuit transmission, web based real-time interactive formats and/or live instruction. Organizations that provide these training opportunities include local and regional universities, the Air and Waste Management Association, the Mid Atlantic Regional Air Management
QAPP for the Northampton County Background-Monitoring Program Revision 0 10/3/2019
Page 42 of 111
Association and EPA. The DAQ supervisors track this training for their employees in the LMS. Air monitoring personnel have enough training to perform necessary functions at an acceptable level. The DAQ supervisors also track and document this training in both the LMS and VIP. They also evaluate employee proficiency, based on performance and feedback from peers and other coworkers. During the VIP review, the supervisors recommend any refresher training the employee may need and develop a plan to receive the needed training. The LMS provides and archives certificates of completion for any course work documented in the LMS.
Additionally, the chief invites the coordinator and regional monitoring technicians to the North Carolina DAQ ambient monitoring workshop held each year. This workshop provides an opportunity to discuss and train on monitoring and the QC and QA processes including data review and verification, to ensure the collection of valid data. The DAQ and EPA staff provides training annually during the monitoring workshop.
DEQ - DAQ Training Links
Air Monitoring: http://www.epa.gov/ttn/amtic/training.html
Professional Skills: http://oshr.nc.gov/state-employee-resources/training
QAPP for the Northampton County Background-Monitoring Program Revision 0 10/3/2019
Page 43 of 111
9.0 Documentation and Records The following information describes DAQ’s management of documents and records, including this QAPP, for the Northampton County background- monitoring network. The chief serves as the document custodian by managing the documents and records. The chief must approve QAPP and SOP revisions, including changes to forms, before monitoring personnel use them. The DAQ also ensures adequate document control of all these records. The DAQ secures all electronic documents on encrypted laptops or password protected computers and paper documents in limited access areas.
Additionally, SOPs must not conflict with any part of this QAPP or with any other relevant local, state or federal regulation.
Table 9-1 lists the documents and records pertaining to all data the EPA requires DAQ to collect and all other data deemed important by DAQ’s policies and records management procedures, including documents and records required to support the concentration data reported to EPA.
Table 9.1 Documentation and Records Information
Categories Record/Document Type File Locations
Management and
Organization
State Implementation Plan Reporting agency information EPA directives Grant allocations Support contracts
Raleigh, NC – Raleigh Central Office
Quality Management Plan DEQ Website
Organizational structure Ambient Monitoring Administration Page on SharePoint
Personnel qualifications and training DEQ HR and DAQ Training page on SharePoint
Training records and certification Learning Management System and Value In Performance
Site Information
Network descriptions Site files Site maps Site pictures
Raleigh Central Office group drive, Raleigh Regional Office group drive, IBEAM General Documents Module
Environmental Data
Operations
Quality Assurance Project Plans
DEQ Website for official repository, Other file locations may include IBEAM General Documents Module for archived versions, NC AMS QAPP page on SharePoint or Raleigh Central Office group drive (see below)
Standard Operating Procedures
DEQ Website for official repository, Other file locations may include IBEAM General Documents Module for archived versions, NC AMS QAPP page on
QAPP for the Northampton County Background-Monitoring Program Revision 0 10/3/2019
Page 44 of 111
Table 9.1 Documentation and Records Information
Categories Record/Document Type File Locations SharePoint or Raleigh Central Office group drive (see below)
Field and site notebooks
Raleigh Central Office group drive, Raleigh Regional Office group drive, Northampton site
Inspection, maintenance and equipment records
Raleigh Central Office group drive, Raleigh Regional Office group drive, ECB
Raw Data Any original data (routine and QC) Including data entry forms
Raleigh, NC – Raleigh Central Office, Raleigh Regional Office, ECB
Data Reporting
Air Quality Index Reports DAQ Website, IBEAM General Documents Module
Annual Data Certification Report IBEAM General Documents Module
Data/summary reports DAQ Website, IBEAM General Documents Module
Journals/articles/papers/presentations Raleigh Central Office group drive, IBEAM General Documents Module
Data Management
Data algorithms Data Management Plans/Flowcharts Data Management Systems
Raleigh, NC – Raleigh Central Office
Pollutant data Envista ARM database
Meteorological data (from North Carolina State Climate Office) Traffic data (from North Carolina Department of Transportation)
Raleigh Central Office group drive, Raleigh Regional Office group drive,
IBEAM
Quality Assurance
Network reviews Control charts Certification Documentation Data Quality Assessments Quality Assurance Reports EPA Technical System Audits Internal Technical Systems Audits Response/corrective action reports Annual performance evaluation reports E-mails related to QA activities and assessments
Raleigh, NC – Raleigh Central Office and Raleigh Regional Office and ECB
IBEAM General Documents Module
The state of North Carolina considers all e-mails official records and retains all e-mail correspondence for a minimum of 10 years. In addition, DAQ archives e-mails critical in documenting official decisions regarding network decisions and data quality decisions in IBEAM.
QAPP for the Northampton County Background-Monitoring Program Revision 0 10/3/2019
Page 45 of 111
Most documentation and records produced by DAQ’s Northampton County background-monitoring program consist of data and information gathered to support the data collection activities. Documentation and records include:
• QAPPs; • SOPs, • Logbooks and data collection records in electronic and written format, • Instrument and equipment calibration information, • QA documentation in electronic and written format and • Documentation that supports data review, validation and certification activities.
Section 19.0 Data Management contains detailed information regarding how DAQ will manage data from the network, including information on data recording, transmittal, storage and retrieval.
9.1 Statewide Policy and Procedure Documentation
DAQ maintains records of program policy and procedure documentation. The DAQ publishes documents in this category with the date and revision information clearly noted, generally in a document header. Documents in this category include:
• QAPPs, • SOPs, • Electronic QA/QC data forms that technicians must document, and • QA and technical notes, which provide air monitoring policy interpretations or best practices.
As of this QAPP revision, DAQ is in the process of revising the document and record storage procedures and locations. The DAQ currently uses IBEAM for an internal locale for new and past revisions of SOPs and QAPPs. In IBEAM documents that are archived are marked as *OBSOLETE* in the title so that staff know not to use them for procedures. The QAM or his designee is responsible for changing titles to *OBSOLETE* when a new version is approved. The DEQ website is the official DAQ repository for controlled documents, i.e., current approved versions. All other documents not on the website are uncontrolled and therefore not considered official.
Also at the time of this QAPP revision, DAQ uses P: drive and SharePoint as repositories for working documents. Draft documents will be watermarked as *DRAFT* so that no confusion arises as to the finality of an SOP. The QAM or designee receives final versions for review and approval. Once QAPPS and SOPS are signed, the QAM or designee will ensure that the document is uploaded to the website and IBEAM. The QAM will notify staff of the issuance of the new document via e-mail and on the next ambient monitoring work group call. Staff are in the process of streamlining these procedures and the QAPP will be revised when a new framework is implemented.
9.2 Data Collection Records and Logbooks
Table 9.1 lists the documents and records DAQ must retain. The appropriate sections of this QAPP will discuss the details of these various documents and records. The DAQ will collect all raw data required
QAPP for the Northampton County Background-Monitoring Program Revision 0 10/3/2019
Page 46 of 111
for calculations, the submissions to the AQS database and QA/QC data electronically or in e-logs or spreadsheets; see Section 11.0 Sampling Methods Requirements.
The regional monitoring technicians, regional monitoring coordinator, ECB electronics technicians, RCO chemists and other DAQ personnel shall fill out information in the site visit logbook in indelible ink. In addition, the ECB electronics technicians will fill out instrument maintenance logs and 109 forms in indelible ink. They shall make corrections by inserting one line through the incorrect entry, initialing and dating this correction and placing the correct entry alongside the incorrect entry, if they can accomplish this legibly, or by providing the information on a new line if the above is not possible.
9.2.1 Logbooks and Forms
The DAQ uses a combination of bound paper and/or e-logs for record keeping for each sampling site, sampling instrument, specific program and individual. Each paper logbook should be hardbound and paginated. The DAQ uses paper logbooks to document site visits, and other activities, including who is at the site, when and why. Every visitor must sign the site logbook The e-logs capture monitor maintenance and QA/QC activities.
Each regional monitoring technician will be responsible for obtaining, maintaining and documenting the appropriate logbooks or associated QA/QC data forms. Each Northampton County background monitor type has an e-log created for that specific monitor type. The e-log contains all data entry forms required by a regional monitoring technician to document all routine operations. After each use, the regional monitoring technician uniquely numbers these e-logs by giving them a specific file name before saving them to a storage device such as a laptop computer. From the laptop computer, the regional monitoring technician will transfer the e-log to the RRO group drive. The regional monitoring technician will use these e-logs to record information about the site operations, as well as document routine operations. The ECB electronics technicians will fill out instrument maintenance logs and 109 forms.
Completion of e-logs, instrument maintenance logbooks and 109 forms associated with all routine environmental data operations, are required even when the site logbooks contain all appropriate and associated information required for the routine operation performed.
9.2.2 Electronic Data Collection
All instrument types currently used in the Northampton County background-monitoring network can provide an automated means for collecting information that DAQ would otherwise record on data entry forms. Section 19.0 Data Management details information on these systems. To reduce the potential for data entry errors, the DAQ will use automated systems where appropriate and will record the same information the regional monitoring technician would record on data entry forms. To provide a backup, the PPB staff will store electronic copies of the automated data collection information (daily poll) for an appropriate period on the RCO group drive. Electronic backup copies of automated data collection information will also be stored on the site computers, in the RRO and in the RCO or the western data center operated by the DIT.
QAPP for the Northampton County Background-Monitoring Program Revision 0 10/3/2019
Page 47 of 111
9.3 QA/QC Records
The DAQ achieves QA/QC through the performance of periodic activities such as:
• Technical systems audits, or TSAs, • Internal systems audits, • 1-point-QC checks, • Zero and span checks, • Verification/calibration procedures, • Maintenance activities, • Annual performance evaluations, • EPA performance audits such as the national performance audit program, or NPAP, and
performance evaluation program, or PEP, • Traceability certifications and calibrations and • Corrective actions.
The EPA and DAQ document TSAs and internal systems audits in the form of a written report. The DAQ typically documents and maintains most of the other QA/QC activities using a variety of activities, including e-mails, Excel spreadsheets, fillable PDF data forms, worksheets and data management systems such as Envidas Ultimate and Envista ARM. The associated SOPs describe the use of these methods to create air monitoring QA/QC records. The DAQ retains and archives these records according to the procedures identified in Section 9.5 Data Archiving and Retrieval. The DAQ corrects records either by crossing out the incorrect information with a single line and entering the correct information followed by the person’s initials or by creating a revised form from the original with the correct information, retaining both forms on the RCO group drive. The regional monitoring technician or coordinate names the revised document following naming conventions in SOPs 2.17.2 and 2.46.2.
However, for some of the QA/QC activities described above – such as the traceability certifications – the ECB retains many of those records at the ECB. Currently, the vendors provide the certificates of analyses that accompany gas cylinders in paper format, which the ECB stores in a designated and secured file cabinet on location. Certifications for PM equipment provided by the vendors is store in the Raleigh Regional Office and in IBEAM. Records for internal certifications of the photometers and calibrators used in the field and for audits are stored electronically on the group drive. The DAQ is currently reviewing this record retention process and will revise the QAPP when DAQ implements a new process.
9.4 Reference Materials
Because of the technical nature of ambient air monitoring, DAQ requires numerous reference materials to administer the Northampton County background-monitoring program effectively. This category includes publications such as instrument operation manuals, troubleshooting guides, EPA guidance documentation, EPA technical memoranda and various other reports. DAQ maintains access to applicable reference materials if DAQ has an administrative need for them. DAQ retains these documents at the RCO, in the IBEAM general documents module, or on the network-server group-drive.
QAPP for the Northampton County Background-Monitoring Program Revision 0 10/3/2019
Page 48 of 111
9.5 Data Archiving and Retrieval
The DAQ classifies documentation according to its intended use, future applicability and regulatory requirement for retention. The DAQ will retain all the information listed in Table 9.1 for four complete calendar years from the date of collection in accordance with 2 CFR Section 200.333. However, if a party starts any litigation, claim, negotiation, audit or other action involving the records before the expiration of the four-year period, DAQ will retain the records until completion of the action and resolution of all issues that arise from it, or until the end of the regular four-year period, whichever is later.
DAQ stores electronic records within the data management systems located at the Northampton County background-monitoring site, or Envidas, the RCO, or Envista ARM, and on network servers in the RRO and RCO. The DIT backs up data stored in Envista ARM as well as records on the network server in the RRO and RCO nightly and stores these back-ups off-site. The database manager regularly backs up the Envista ARM database to the RCO network drive.
QAPP for the Northampton County Background-Monitoring Program Revision 0 10/3/2019
Page 49 of 111
10.0 Network Description The primary function of the Northampton County background-monitoring program is to measure the background levels of NO2 and PM2.5 in Northampton County, provide real-time data to the public, and verify compliance with the NAAQS, if the monitors operate for three or more complete calendar years. Sampling network design and monitoring site selection comply with the following appendices of 40 CFR Part 58:
- 40 CFR Part 58, Appendix A - Quality Assurance Requirements for Monitors Used in Evaluations of National Ambient Air Quality Standards
- 40 CFR Part 58, Appendix D - Network Design Criteria for Ambient Air Quality Monitoring - 40 CFR Part 58, Appendix E - Probe and Monitoring Path Siting Criteria for Ambient Air Quality
Monitoring
10.1 Network Objectives
The chief designed the Northampton County background-monitoring network to determine the background concentrations in Northampton County. The Northampton County background-monitoring network uses the site selection and inlet criteria specified in 40 CFR Part 58, Appendices D and E, to establish the appropriate monitoring location necessary to meet these objectives.
The chief will assign each special purpose non-regulatory monitor within DAQ’s Northampton County background-monitoring network the monitoring objective designation of General Background.
Data collected within the network must be representative of the spatial area under study. The goal in siting a monitoring station is to match the spatial scale represented by the samples obtained with the spatial scale most appropriate for the monitoring objective of the station. For a discussion of the representative measurement scale for the Northampton County background site, see Section 6.0 Project/Task Description.
10.2 Site Selection
The Northampton County background-monitoring site is Northampton, AQS ID 37-131-0003, located at latitude 36.511708 and longitude -77.655389. Figure 10.1 displays an aerial photo of the site location. The monitoring site is located over 100 meters from trees in all directions. The coordinator estimates the tallest trees to be 15.2 meters tall. The monitoring site is located about 130 meters from the one-story school to the east. The land is relatively flat in this area. The nearest road is Hurricane Drive, located approximately 150 meters to the southeast. This road does not have traffic count data; however, Old Emporia Road, had an average annual daily traffic count of 820 in 2017. The probe height for NO2 will be approximately 3.6 meters. The inlet height for the PM2.5 monitor will be approximately 2.3 meters. Addendum 1 to the 2018-2019 network monitoring plan contains additional information on the site.
QAPP for the Northampton County Background-Monitoring Program Revision 0 10/3/2019
Page 50 of 111
-
- Figure 10.1 Aerial View of the Northampton Site Location and Surrounding Areas
When selecting a site, the chief adheres to the site selection criteria specified in 40 CFR Part 58, Appendix D. The selection of a specific monitoring site includes the following activities:
- Developing and understanding the monitoring objective and appropriate DQOs, - Identifying the spatial scale most appropriate for the monitoring objective of the site, - Identifying potential locations where the monitoring site could be placed, and - Identifying the specific monitoring site.
The regional monitoring technician will evaluate the monitoring site each year to assure it adheres to the site selection criteria specified in 40 CFR Part 58, Appendix E.
10.2.1 Site Location
The chief considered four criteria when evaluating potential Northampton County background-monitoring sites:
- Location of potential pollution sources, - Topography of the area, - Predominant wind direction in relation to any potential sources, and - Potential population exposure.
Selection per these criteria requires detailed information concerning the types and location of pollutant sources in Northampton County, geographic variability of ambient pollutant concentrations in the Northampton County background environment, meteorological conditions,
QAPP for the Northampton County Background-Monitoring Program Revision 0 10/3/2019
Page 51 of 111
and population density. Selection of the number, geographic locations, and types of Northampton County background stations is, therefore, a complex process. The chief also considered the following factors in the sampling site selection process:
- Economics - The quantity of resources required to accomplish all data collection activities, including instrumentation, installation, maintenance, data retrieval, data analysis, QA, and data interpretation, must be established.
- Security - In some cases, a preferred location may have associated problems that compromise the security of monitoring equipment (i.e., high risk of theft, vandalism, etc.). If such problems cannot be remedied using standard measures such as additional lighting, fencing, etc., then an attempt to locate the site as near to the preferred location as possible shall be made.
- Logistics - This process includes procurement, maintenance, and transportation of material and personnel for the monitoring operation. The logistics process requires full knowledge of all aspects of the data collection operation: planning, reconnaissance, training, scheduling, safety, staffing, procuring goods and services, communications, and inventory management.
- Atmospheric Considerations - These considerations may include spatial and temporal variability of pollutants and their transport. Effects of buildings, terrain, and heat sources or sinks on air trajectories can produce localized anomalies of pollutant concentrations. The chief considered meteorology in determining the geographic location of the site as well as the height, direction, and extension of sampling probes. Evaluation of a local wind rose was essential to locate properly the Northampton County background-monitoring site.
- Topography – The chief evaluated the local topography based upon land use maps, U.S. Geological Survey topographic maps, and other available resources. The chief also identified and evaluated minor and major topological features that affect both the transport and diffusion of air pollutants. Minor features may include an adjacent tree-lined stream or tall structures either upwind or downwind of a point source, each of which may exert small influences on pollutant dispersion patterns. Major features include river canyons or deep valleys, mountain ranges, and large lakes. Major features significantly affect the prevailing wind patterns or create their own local weather such as katabatic or anabatic winds.
- Pollutant Considerations – The monitoring site location for a specific pollutant may or may not be appropriate for another pollutant. The chief evaluated the changes that pollutants undergo temporally and spatially to determine the applicability of the Northampton County background monitoring site for both pollutants.
An interdependence exists between all the factors listed above. Consequently, the chief employed an iterative procedure to select successfully appropriate sites that can provide the data necessary to accomplish the stated objectives of the project. In situations where the sites do not specifically meet the requirements necessary to obtain the project objectives, reevaluation of the project priorities may be necessary before the final monitoring site selection. Experience in the operation of air quality measurement systems; estimates of air quality; field and theoretical studies of air diffusion; and considerations of atmospheric chemistry and air pollution effects make up the required expertise
QAPP for the Northampton County Background-Monitoring Program Revision 0 10/3/2019
Page 52 of 111
needed to select the optimum sampling site for obtaining data necessary to fulfill the monitoring objectives. These responsibilities are shared amongst the Ambient Monitoring Section staff as well as other Division of Air Quality Staff.
10.2.2. Monitor Placement
General inlet siting criteria for monitors at the DAQ Northampton County background site shall adhere to the requirements in 40 CFR Part 58, Appendix E. Final placement of a monitor at a selected site is dependent on physical obstructions and activities in the immediate area. The ECB electronics technicians must place monitors away from obstructions such as trees and fences to avoid their effects on airflow. To prevent sampling bias, airflow around monitor sampling probes must be representative of the general airflow in the area. In addition, the availability of utilities (i.e., electricity and telephone services) is critical.
10.3. Sampling Frequency
The EPA establishes the minimum sampling frequencies of the monitors. The DAQ follows the EPA’s requirements for the sampling frequencies of monitors. The monitors used in the Northampton County background monitoring project sample continuously. The DAQ ensures the monitors collect the minimum number of samples required for appropriate summary statistics. At least 75 percent of the total possible observations must be present before summary statistics are calculated. The exact requirements appear in 40 CFR Part 50, Appendices N and S and in Table 10.1. Table 10.2 and 40 CFR Part 58.12 provide the sampling schedule and frequency for both Northampton County background-monitoring methods.
Table 10.1. Requirements for Calculating Summary Statistics.
Pollutant Completeness Requirement Time Frame
NO2 75 percent Per hour, day, days per quarter and hours per year
NO2 4 Complete quarters per year PM 2.5 75 percent Hours per day, days per quarter PM 2.5 4 Complete quarters per year
Table 10.2. Northampton County Background Sampling Schedule and Frequency
Pollutant Time Frame Frequency Monitor Type NO2 Hourly (60 minutes/hour) 24 hours a day/7 days a week Continuous PM2.5 Hourly 24 hours a day/7 days a week Continuous
10.4. Rationale for DAQ’s Northampton County Background Monitoring Network
The primary rationale for the operation of the Northampton County background-monitoring network is to measure background levels of NO2 and PM2.5 in Northampton County, provide the public with information on current air quality, and determine compliance with the NAAQS, if the monitors operate for three or more complete calendar years.
QAPP for the Northampton County Background-Monitoring Program Revision 0 10/3/2019
Page 53 of 111
11.0 Sampling Methods Requirements
11.1 Sample Methodology
In accordance with 40 CFR Part 58, Appendix C, Section 2.1, a criteria pollutant monitoring method used for making NAAQS decisions at a state and local air monitoring station, or SLAMS, site must be a reference or equivalent method. Even though the Northampton County background-monitoring site is not a SLAMS site, the DAQ will use only EPA-approved FEM instrumentation to measure criteria pollutants at this site. Criteria pollutant analyzer methods that have received FEM status have been rigorously tested, in accordance with 40 CFR Part 53 requirements, and found to meet or be comparable to the EPA reference methods codified in 40 CFR Part 50, Appendices F and L. For the detailed specifications upon which a specific monitoring method has received its FRM or FEM status, see the List of Designated Reference and Equivalent Methods, issued by the EPA Office of Research and Development, which can be found on the Ambient Monitoring Technology Information Center (AMTIC) website(https://www3.epa.gov/ttn/amtic/criteria.html). The DAQ will operate each analyzer in accordance with these designation specifications. To ensure the monitors meet these specifications DAQ uses the criteria in the validation templates in Section 7.0. These sampling methods use real-time or near real-time (continuous) sample analysis. As a result, the DAQ does not collect physical samples. The analyzer performs “in-situ” analysis of the composition of the sample within the analyzer itself using a specific methodology. This subsection describes the sampling methods used in the DAQ Northampton County background-monitoring network. Table 11.1 lists the specific methods used. The methods for NO2 and PM2.5 are FEMs.
Table 11.1 DAQ Northampton County Background Monitoring Network Analyzers
Met One BAM 1022 (with PM10 head and VSCC) 209 EQPM-1013-209
Indoor Shelter
Temperature
Comet Temperature Sensor Model T0310 013 No FRM or FEM
11.1.1. Nitrogen Oxides (Chemiluminescence)
Nitrogen oxides (NOx) is the sum of NO and NO2. The principle of measurement is based upon the reaction of a NO molecule with an internal source of ozone in an evacuated reaction cell that results in the emission of light. Single channel instruments divide the sample into two streams. The first stream passes the sample directly to the evacuated reaction cell. A reaction between the NO present in the sample and the analyzer-supplied ozone occurs. The detector in the analyzer monitors the resulting light
QAPP for the Northampton County Background-Monitoring Program Revision 0 10/3/2019
Page 54 of 111
emitted by the reaction and the software in the analyzer correlates it to the concentration of NO in the sample.
The second stream of sample gas passes through a converter. For NOx, a photolytic converter selectively reduces the NO2 to NO. This second stream, now containing NO from both the reduction of NO2 and the original NO, cycles through the evacuated reaction cell where the new augmented concentration of NO is measured. The measurement of the untreated sample provides an NO concentration, while the measurement of the converted sample provides a measurement of the NOx concentration. Subtracting the NO concentration from the NOx concentration yields the NO2 concentration. Periodically, the monitor takes a background measurement to correct the zero offset of the instrument to maintain zero stability.
A beta attenuation monitor (BAM) is composed of sensing and control units. At the heart of the sensing unit is the carbon-14 beta radiation source and glass fiber filter tape, which combine in a measurement technique for making near-real-time direct measurement of particle mass collected on the filter tape. This measuring equipment can determine the fine changes in mass that accumulate on the filter tape as a constant stream of air passes through it.
The Met One Instruments, Inc. Model BAM 1022 Continuous particulate matter (PM) Monitoring System uses the principle of beta ray attenuation to accurately measure and report the concentration of airborne PM in ambient air at local conditions of temperature and atmospheric pressure. The centerpiece of the measurement system is a small, carbon-14 source that emits a consistent supply of electrons, in the energy of the Beta spectrum to the mass to be measured, and a sensitive detector that counts the incident electrons. A vacuum pump draws air, at a rate of 16.67 liters per minute (LPM), through a size selective inlet, down the inlet tube, and deposits the airborne PM on a filter tape that is located between the beta source and detector. The accumulation of mass onto the filter tape increasingly attenuates beta ray transmission through the media. The detector continuously monitors the beta attenuation through the filter tape throughout the measurement cycle. The software in the monitor uses the degree of beta ray attenuation to determine the mass of PM deposited on the filter tape. During sampling, the BAM control unit precisely controls the flow rate. Having determined both mass and sample volume, the BAM 1022 calculates and reports the ambient PM concentration, expressed as μg/m3 or milligrams per cubic meter.
11.1.3. Indoor Shelter Temperature
The DAQ measures shelter temperature using a Comet temperature transmitter. The sensor measures temperature in the range of - 30 to + 80 °C with an accuracy of ± 0.4 °C and resolution of 0.1 °C. The DAQ collects shelter temperature measurements every minute. The DAQ collects backup temperature measurements using a HOBO data logger and temperature sensor. The regional monitoring technician downloads data from the HOBO at least once a month and archives the data. The data verifiers and validators only use the HOBO data when the Comet data are unavailable.
QAPP for the Northampton County Background-Monitoring Program Revision 0 10/3/2019
Page 55 of 111
11.2 Data Collection Methodology
Table 11.2 lists specific SOP titles used in the network.
Table 11.2. List of SOPs Associated with this Quality Assurance Project Plan
Section 2.3.3 Certification and Accuracy Check of Field Barometers and Thermometers, Revision 7, Nov. 1, 2011
Section 2.3.6 Protocol Gas Verification for Compressed Gas Cylinders Containing Either SO2, NO or CO, Revision 0, Nov. 30, 2009
Section 2.17.1 Teledyne Model T200UP Nitrogen Dioxide Monitoring System SOPs for the Electronics and Calibration Branch, Revision 1.1, April 22, 2016
Section 2.17.2 Model T200UP Nitrogen Dioxide Monitoring System SOPs for Operators, Revision 1.1, Nov. 2016
Section 2.37.1 Installation, Calibration and Maintenance Responsibilities of the Electronics and Calibration Branch for the Met One Instruments Beta Attenuation Monitor, Revision 0, Oct. 8, 2008
Section 2.39 SOP for Preparing SOPs for the DAQ, Revision 0, Nov. 1, 2010 Section 2.41.3 Regional Office Polling and Data Review: Envidas set-up; Retrieval, Review, Correction
and Storage of Data; Report Submission; QA SOPs, Revision 0, March 31, 2018 Section 2.41.4 Data Review and Validation for Continuous Gaseous and Non-Speciated PM Monitors,
RCO Responsibilities, Revision 1.6, Oct. 15, 2014 Section 2.43 SOP for Completing the Annual Network Review for the DAQ, Revision 2, Sep. 29, 2017 Section 2.46.2 Met One BAM 1022 Standard Procedures for Operators, Revision 0, November 10,
2016 Section 2.61 SOP for Quarterly Completeness Data Review, Revision 0, February 27, 2019
Electronic data collection is possible for the continuous monitors through the network’s data acquisition system, or DAS, which is currently Envidas Ultimate and wireless modems. This equipment is in a shelter where the data acquisition system records the data history and the modem provides a path to download the data for analysis. The database manager configures the computers in the state’s RCO or in the Western Data Center, managed by DIT, to connect automatically to the station at least hourly to retrieve these data for analysis. Monitoring personnel can log into the station remotely to retrieve data or determine the status of the systems. The Envista ARM data software sends all data automatically to AirNow-Tech and the IBEAM database for real time reporting of ambient concentrations and the air quality index to the public via EPA’s AirNow website and the DEQ real time web page.
11.3 Support Facilities
This subsection describes the monitoring shelters used in the DAQ Northampton County background-monitoring network.
QAPP for the Northampton County Background-Monitoring Program Revision 0 10/3/2019
Page 56 of 111
11.3.1 Monitoring Station Design
The monitoring station design must encompass the operational needs of the equipment, provide an environment that supports sample integrity, and allow the regional monitoring technicians, who operate the site, to safely and easily service and maintain the equipment. The chief considers winter and hurricane weather conditions during site selection to meet the station safety and serviceability requirements.
11.3.2 Shelter Criteria
The ECB electronics technicians house NO2 analyzers in a shelter capable of fulfilling the following conditions:
- The regional monitoring technicians must maintain the shelter temperature at a temperature that meets the reference or equivalency method requirements for all instrumentation that it contains.
- The shelter and platform power supply should not vary more than ±10 percent from 117 alternating current voltage (VAC). The ECB electronics technicians should provide some type of voltage regulation to accomplish this, if needed.
- The shelter must protect the instrumentation from precipitation and excessive dust and dirt, provide third-wire grounding, as in modern electrical codes, and meet federal Occupational Safety and Health Administration regulations.
- The regional monitoring technician must clean the shelter regularly to prevent a buildup of dust.
- The shelter must protect the instrumentation from any environmental stress such as vibration, corrosive chemicals, intense light, or radiation.
At the Northampton site, the DAQ uses an Ekto shelter, with a sealant applied to the roof to keep moisture from entering the building and rotting the flooring. Although the Ekto shelter has roof access, the DAQ will place the PM2.5 monitor on a platform at least three meters from the shelter.
The ECB electronics technicians use insulated heat-tape wrapped single sample lines to provide ambient air to the monitor. In addition, the ECB electronics technicians attach the probe lines to a PM filter to prevent contaminants from entering the analyzer. They typically locate the filter within the protected shelter, between the probe inlet and the analyzer. The analyzer draws sample from the probe inlet. The probe material must be either borosilicate glass or an acceptable inert plastic, such as polytetrafluoroethylene, perfluoroalkoxy (PFA), or other Teflon™-type materials.
The ECB electronics technicians use Teflon™ probe lines to ensure the probe material is non-reactive with NO2. The probe, intake vent, and interconnecting tubing design must provide a minimum number of bends to avoid particles impacting on the surfaces. Impacted particles may provide surfaces to which NO2 may adsorb, or, if the impacted particle is metallic, catalyze to a non-criteria species. Additionally, the ECB electronics technicians use part of a Teflon™ filter holder on the end of the probe to prevent rainwater from entering the analyzers. Any liquid water will absorb
QAPP for the Northampton County Background-Monitoring Program Revision 0 10/3/2019
Page 57 of 111
pollutants, affecting the NO2 concentration by removing it from the sample, and consequently, yielding inaccurate environmental data.
The residence time in the probe must be 20 seconds or less. The regional monitoring technician evaluates the residence time at every site visit and documents it in the e-log. If the physical configuration of the probe restricts the flow such that the probe configuration cannot meet the residence time, then the ECB electronics technicians modify the physical configuration to fix this deficiency. They may accomplish this by reducing the length of interconnecting tubing, increasing the tubing and/or decreasing the number of bends in the tubing between the probe and analyzer, or other alterations that allow the system to meet the residence time requirements.
The ECB electronics technicians replace all probe sample lines at least once every two years or as needed when the line is damaged or contaminated. Based on years of monitoring experience and evaluation of the data, DAQ has not observed any problems with probe lines between one and two years except in situations where other problems occurred. Issues that cause probe problems include the monitor pulling rain or other precipitation into the probe, insects getting into the probe or a cold spot developing along the probe that causes condensate to form in the probe.
The BAM 1022 PM2.5 monitor, which operates unprotected from ambient conditions, has no need to be housed in a shelter capable of fulfilling the above requirements.
QAPP for the Northampton County Background-Monitoring Program Revision 0 10/3/2019
Page 58 of 111
12.0 Sample Handling and Custody The Northampton County background- monitoring program does not require the regional monitoring technician to take any samples that would warrant a sample custody procedure. The instrumentation located at the Northampton County background monitoring location directly analyzes all ambient air samples.
QAPP for the Northampton County Background-Monitoring Program Revision 0 10/3/2019
Page 59 of 111
13.0 Analytical Methods The Northampton County background-monitoring program does not use any laboratory analytical methodologies to complete the analysis of any NO2 or PM2.5 samples. The respective operation manuals provide specifics on the NO2 and PM2.5 monitor’s analytics. Section 11.1 Sample Methodology provides a summary of how the monitors work.
QAPP for the Northampton County Background-Monitoring Program Revision 0 10/3/2019
Page 60 of 111
14.0 Quality Control Requirements and Procedures The DAQ must perform two distinct and important interrelated functions to assure the quality of data from air monitoring measurements. One function is the control of the measurement process through broad QA activities, such as establishing policies and procedures, developing DQOs, assigning roles and responsibilities, conducting oversight and reviews, and implementing corrective actions. The other function is the control of the measurement process through the implementation of specific QC procedures, such as audits, calibrations, checks, replicates, routine self-assessments, etc.
Quality control is the overall system of technical activities that measure the attributes and performance of a process, item, or service against defined standards to verify they meet the stated requirements established by the end user. For the Northampton County background-monitoring network, the DAQ uses QC activities to ensure DAQ maintains measurement uncertainty, as discussed in Section 7.0 Quality Objectives and Criteria for Measurement Data, within acceptance criteria for the attainment of the DQOs. The SOPs (see Table 11.2) and instrument manuals provide lists of pertinent QC checks.
The DAQ achieves QC through:
• Daily automated calibration checks, consisting of a zero, span and 1-point-QC check, • Daily review of instrument measurements, • Annual, or as needed, multipoint calibrations, • Monthly operational checks by regional monitoring technicians, • Performance evaluations, • Periodic maintenance; • Flow rate audits; • Acceptance test procedures; • Accuracy, bias, and precision checks; and collocated instruments (in the PQAO), • Control charts, and • Other verification techniques.
Data analyzed from monitors in the DAQ Northampton County background network do not undergo routine post-processing to correct for zero and span drift. In the sections that follow, the RCO chemists embedded the calculations for the following QC procedures in e-log books. Regional monitoring and ECB technicians do not compute any calculations by hand. The RCO chemists derived the formulas from relevant sections of 40 CFR Part 58 and the Appendices to 40 CFR Part 50. Tables 7.2 and 7.3 provide specific QC procedures.
14.1 Calibrations
Adjusted calibration, which DAQ calls calibration, is the process used to verify and rectify an instrument’s measurements to minimize deviation from a standard. This multiphase process begins with certifying a calibration or transfer standard against an authoritative, NIST-traceable standard. The regional monitoring technician compares the instrument’s measurements to this calibration or transfer standard. If significant deviations exist between the instrument’s measurements and the calibration or
QAPP for the Northampton County Background-Monitoring Program Revision 0 10/3/2019
Page 61 of 111
transfer standard’s measurements, the regional monitoring technician adjusts the instrument’s response to rectify the analytical instrument’s measurements.
SOPs 2.17.2 and 2.46.2 and the specific instruments’ operations manuals provide calibration requirements for the critical field equipment. For the particle monitors, the operator adjusts flow rate when performing a calibration, upon installation, after a failed verification, after major maintenance, and annually. The design (desired) flowrate of low-volume particle samplers is 16.67 LPM which is equivalent to 1 m3 per hour. The measurement principle is based on particles separated by size and collected in a filter. Therefore, the flow rate is set higher than human air intake (normally 0.5 LPM) to collect a quantity of particulate matter that is enough for a reliable and repeatable measurement. One benefit of such a comparatively high flow rate is that it minimizes diffusion losses of the smallest particles and allows for a sharp cut-off curve at the upper limit for coarse particles.
Calibration of the sampler’s flow rate measurement device must consist of at least three separate flow rate measurements (a multi-point calibration), evenly spaced within the range of -10 to +10 percent of the sampler’s operational flow rate (40 CFR Part 50, Appendix L, Section 9.2.4). The sampler’s flow control system shall allow for operator adjustment of the operational flow rate of the sampler over a range of at least ±15 percent of the targeted flow rate (40 CFR Part 50, Appendix L, Section 7.4.2).
After the regional monitoring technician has adjusted the flow rate, the operator performs a post-calibration validation of the flow rate to ensure the calibration is successful. Using a certified flow transfer standard (FTS), flow rate is measured and a comparison between the known (transfer standard) and the measured (sampler) is calculated using percent difference. This calibration validation must be within 2 percent for the calibration to be successful.
To calibrate the gaseous analyzer for the Northampton County background-monitoring network the DAQ uses a gas dilution system to generate specific upscale calibration points. The ECB electronics technicians established the calibration scales for the NO2 monitor at 500 ppb based on the highest average minute concentrations expected to occur at the site. See Table 14.1 below; the zero and span represent the calibration scale. Calibrations are performed at installation, when the 1-point-QC check fails, when the monitor is without power for 72-hours, after major maintenance and annually. For the NO2 monitor the DAQ is following the calibration frequencies in the 2017 QA Handbook Volume 2 rather than the TAD. For the NO2 monitor, which are nonlinear, the regional monitoring technician adjusts the zero and two upscale point during a calibration. In addition, the regional monitoring technician does a two-point gas-phase titration to confirm the linearity of the photolytic converter. The adjusted points and gas-phase titration points have tight acceptance ranges, between which the analyzers’ measured values must fall.
After the regional monitoring technician calibrates the monitor, the regional monitoring technician verifies the calibration by repeating the points and doing additional points. SOPs 2.17.2 and the instruments’ operation manuals provide specific calibration requirements for the NO2 analyzer. Table 14.1 shows a summary of calibration as well as QC requirements, which the next section will discuss in detail. At the time of this QAPP revision, the DAQ is modifying some of these procedures as well as the terminology used to describe them.
QAPP for the Northampton County Background-Monitoring Program Revision 0 10/3/2019
Page 62 of 111
Table 14.1 Acceptance Criteria for Calibrations and 1-Point QC Checks
Nitric Oxide (NO) and Oxides of Nitrogen (NOx) Channels
Operation Concentration / Acceptance Criteria
Span
Zero Span Precision
One Point QC Check (1/14 days)
Concentration (ppb) 0 425 60
Acceptance (+/-) 1 ppb 10 percent 10 percent
Calibration Concentration (ppb) 0 425 60
Acceptance (+/-) 1 ppb 3 percent 5 percent
Nitrogen Dioxide (NO2) Channel
Operation Concentration / Acceptance Criteria
Span
Zero Span Precision
1-Point-QC Check (1/14 days)
Concentration (ppb) 0 405 50
Acceptance (+/-) 1 ppb 10 percent 10 percent
Calibration Concentration (ppb) 0 405 50
Acceptance (+/-) 1 ppb Not applicable [1] Not applicable [2] [1] NO2B (O3) Value Set during Calibration [2] NO2A (O3) Value Set during Calibration
At this time the DAQ calibration criteria differs from the EPA criteria of the slope being 1 ± 0.05 and each point being within 2 percent of the best fit line. Also for some pollutants the DAQ calibrations do not use four upscale points as recommended by the EPA or requires by some of the appendices in 40 CFR Part 50. For NO2, the DAQ uses zero and two upscale points for the NO and NOx calibration as described in the instrument manual. The DAQ is currently reviewing and revising these procedures. The DAQ will submit QAPP revisions after DAQ develops these new procedures.
14.2 Precision Checks
Precision is the measure of agreement among individual measurements of the same property, usually under prescribed similar conditions. To meet the DQOs for precision, DAQ will ensure the entire measurement process is within statistical control. The DAQ will employ various tools in evaluating and monitoring precision measurements. For NO2, the regional monitoring technician measures the instrument’s precision with a manual 1-point QC check at least every 14 days that provides evidence of deviations from the required precision measurement as described in 40 CFR Part 58, Appendix A, Section 3.1.1. Table 14.1 gives the concentrations of the 1-point-QC checks and the acceptance criteria for them. Precision calculations follow the procedures described in 40 CFR Part 58, Appendix A, Section
QAPP for the Northampton County Background-Monitoring Program Revision 0 10/3/2019
Page 63 of 111
4. For particulate monitoring, viewing data integrity with control charts will provide evidence of deviations from the required precision measurement.
14.2.1 One-Point QC Checks
Pursuant to 40 CFR Part 58, Appendix A, Section 3.1.1, a 1-point QC check or auto zero/precision/span (ZPS) check must be performed at least once every 2 weeks on each continuous analyzer used to measure the gaseous criteria pollutants. The QC check is made by challenging the trace-level analyzer with a QC check gas of a known concentration that is representative of the mean or median concentrations at the site. At DAQs Northampton County background-monitoring site the QC check gas concentration must be between the prescribed range of 5 and 80 parts per billion (ppb) for both NO2, per 40 CFR Part 58, Appendix A. The Northampton air monitoring network performs both manual and automated checks. Manual ZPS checks are performed every 14 days for NO2 at the Northampton County background-monitoring site. DAQ performs automated nightly “diagnostic auto-ZPS". For these ZPS checks, the percent difference is calculated for at each point; each point must be within the specifications in Tables 7.2 for the check to pass. These checks are considered diagnostic and are not reported to AQS.
The calculation for the precision measurement (i.e., percent difference) is found in 40 CFR Part 58, Appendix A, Section 4.1.1, and is embedded in the e-logs used by field technicians.
Precision checks (1-pt QC and ZPSs) verify (confirm) the analyzer is in good working order, and, therefore, support the defensibility of the data.
A calibration must be performed if the 1-point QC check or ZPS fails and the instrument is found to be in good working order. Normally if either of these checks fail, there is a problem within the monitoring system that needs addressing (i.e., results in equipment maintenance and/or repair). If the zero check or span check exceed the specifications in Tables 7.2, then a calibration will be done after the equipment failure is diagnosed, repaired, and the instrument is cleared for normal operation.
However, if a typical slow drift causes the check to fail, no routine maintenance may be necessary – it simply indicates it is time to recalibrate the analyzer. DAQ staff do not adjust ambient concentration data to correct for zero drift. A failure at the zero or span points will require investigation and if deemed appropriate (based on a weight-of-evidence approach), the data will be invalidated based on the failed check.
14.2.2 Flow Rate Verifications
In accordance with 40 CFR Part 58, Appendix A, Sections 3.2, the regional monitoring technician must perform a one-point flow-rate verification check at least once every month on each sampler used to measure PM2.5. DAQ has set a goal to complete these verifications every 14 – 18 days, except during audit months. The regional monitoring technician makes the verification by checking the operational flow rate of the sampler. If the regional monitoring technician makes the verification in conjunction with a flow rate adjustment (calibration), he or she must complete the verification before the adjustment. The regional monitoring technician compares the flow rate of the transfer standard to
QAPP for the Northampton County Background-Monitoring Program Revision 0 10/3/2019
Page 64 of 111
the flow rate measured by the sampler. Then he or she calculates percent difference for the two readings and compares the results to the acceptance criteria in Table 7.3 using the calculations embedded in the e-log. The regional monitoring technician also calculates percent difference between the design flow rate of the sampler (i.e., 16.67 LPM) and the flow rate measured by the transfer standard during the check for PM2.5 using the calculations embedded in the e-log. These QC checks verify (confirm) the PM sampler is in good working order and, therefore, support the defensibility of the data.
14.3 Accuracy or Bias Checks
The EPA defines accuracy as the degree of agreement between an observed value and an accepted reference value. Accuracy is a combination of random error (precision), and systematic error (bias).
PZS checks can provide data capable of identifying bias for gaseous monitors.
For the PM2.5 monitor, percent difference measurements, flow rates, obtained during flow rate verifications, in lieu of concentrations, are used to assess the bias as described in 40 CFR Part 58, Appendix A, Section 4.2.2. The DAQ will also monitor data integrity with control charts to provide evidence of deviations from the required precision measurement. Accuracy and bias requirements for the applicable instrumentation are found in the SOPs 2.17.2, and 2.46.2 (see Table 11.2 for SOP titles) and in the specific instruments’ operations manuals. Bias calculations follow the procedures described in 40 CFR Part 58, Appendix A, Section 4.1.3.
14.3.1 Annual Performance Evaluations
For the gaseous instruments, ECB electronics technicians will perform an annual performance evaluation at least every 365 days and once per calendar year and whenever requested by the chief. The ECB electronics technicians perform these evaluations by comparing the analyzer measurements to independent standards or references. The ECB electronics technicians determine the audit concentrations following requirements in 40 CFR Part 58, Appendix A, Section 3.1.2.1. The audit concentrations selected for evaluation include a value at or near the detection limit of the monitor, a value near the level of the NAAQS, and a value that is less than the 99th percentile of the data within the network. The ECB electronics technician uses a different gas cylinder and calibrator to complete the audit than the gas cylinder and calibrator used to calibrate the monitor and complete the QC checks. However, the ECB may reference both the calibration standard and the audit standard to the same primary standard. The DAQ designates the ECB electronics technicians, who are not normally involved in the routine operational activities of the NO2 monitor, to do the annual performance evaluation using dedicated QA equipment. The applicable instruments’ operations manuals and SOP 2.17.1 (see Table 11.2 for SOP title) provide details for implementing annual performance evaluation. The EPA has designed these checks to access the accuracy and measure the bias.
14.3.2 Flow Rate Audits
For the PM2.5 instrument, a regional monitoring technician other than the regular operator must perform a flow rate audit at least every 6 months and preferably every quarter. The auditor completes
QAPP for the Northampton County Background-Monitoring Program Revision 0 10/3/2019
Page 65 of 111
the audit by measuring the analyzer's normal operating flow rate using a certified flow-rate transfer standard. The flow rate standard used for auditing must not be the same flow rate standard used to calibrate the analyzer. However, both the calibration standard and the audit standard may be referenced to the same primary flow rate or volume standard. The applicable instruments’ operations manuals and SOP 2.46.2 provides details for implementing flow audits. The regional monitoring technician uses the calculations embedded in the e-log to determine the percent differences. See Table 14.1 for example corrective actions for failed flow rate audits.
14.3.3 External Agency Audits
The DAQ participates in the EPA PEP and NPAP. Information on the PEP and NPAP is available at https://www3.epa.gov/ttn/amtic/npepqa.html. Because the Northampton County background monitors are not SLAMS, the EPA will only include them in the NPAP and PEP audit program at the specific request of the chief. See Table 6.1 and Tables 7.2 and 7.3 for information regarding the frequencies and acceptance criteria related to PEP and NPAP audits.
14.4 Reference Membrane Span Foil Verification
For the BAM 1022 instruments, the operator must perform a reference-membrane span foil verification every 90 days. The reference-membrane span foil verification monitors the stability and performance of the beta counter. If the verification fails, the operator will call the ECB to have the BAM 1022 replaced.
14.5 BAM Background Tests
The operator must perform a zero background test on the BAM 1022, after the initial installation and calibration, as soon as the weather conditions meet the minimum weather requirements: 72 hours of clear weather with no precipitation forecasted. A zero background test may also be performed indoors before the monitor is installed by the Electronic and Calibrations Branch: weather requirements are waived in this circumstance, yet the smart heater still must be used. This test corrects the background value to compensate for minor variations caused by local conditions such as grounding and shelter characteristics. Subsequent background tests will be performed on an annual basis in early spring (March/April/May) or fall (September/October/November) when dew points are generally at a low point. The test collects data for 72 consecutive hours having the PM10 and PM 2.5 inlets replaced with a HEPA filter (BX-302) on a flow audit adapter. At the end of a completed 72-hour period, the data must be downloaded and statistically analyzed using a spreadsheet template. After the new background value has been calculated and compared with the factory zero, it is recommended that the new coefficient be audited for 24 hours prior to resuming normal data collection; especially if the BAM is close to failing the background test.
14.4 Corrective Actions
All DAQ personnel take corrective action measures as necessary to ensure the DAQ attains the MQOs. Given the diversity of monitoring activities and the complexity of the instruments, a potential exists that issues may arise with analytical measurement systems. For the Northampton County background-
QAPP for the Northampton County Background-Monitoring Program Revision 0 10/3/2019
Page 66 of 111
monitoring network, the DAQ has anticipated many of the issues in advance, and prepared and equipped the staff to address the issues as they arise.
However, the staff will encounter unexpected or unforeseen circumstances, such as a failed QA/QC check, so they will also need to implement corrective actions on an "as-necessary" basis. The DAQ SOPs (see Table 11.2) contain examples of corrective actions that the staff may need to complete under certain circumstances. Regional monitoring technicians should consult SOPs 2.17.2 and 2.46.2 for technique-specific checks, required frequency of checks, acceptance criteria, and additional corrective action guidance. Table 14.2 is an abridged list for typical problems that require corrective action. According to DAQ policy, the regional monitoring technicians, ECB electronics technicians, and RCO chemists must report the need for corrective actions to the coordinator or appropriate supervisor within two business days and address the issue as soon as possible, ideally within five business days. The regional monitoring technicians, ECB electronics technicians and RCO chemists can resolve most problems within one or two business days, but occasionally it takes longer to identify what caused the problem and find a solution. When equipment is down, staff must work to repair the problem as quickly as possible to limit the amount of data loss.
Table 14.2. Corrective Actions
Activity Problem Likely Actions
QA/QC Check
Out of specification;
flow rate check or
failed flow rate audit exceeds
acceptance criteria
1) Verify / reproduce performance check findings (e.g. Zero, Span and Precision). Use an alternate transfer standard to confirm failures.
2) Perform alternate performance checks to determine cause (for example – leak tests to aid in flow rate issues).
3) For the NO2 monitor, replace the solenoid and send the old solenoid to ECB for testing.
4) Recalibrate the monitor following the SOP. 5) Identify any required procedural changes to prevent reoccurrence. 6) Document actions in e-log or site logbook as appropriate. 7) Notify the chief of performance audit failures as soon as practical.
Probe Line Integrity
Check
Probe wet or contaminated
1) Verify probe inlet is intact and protectors from rain, insects and dirt are in place.
2) Check line for cold spots and bends or low points where water could accumulate.
3) Blow line out with zero air and dry for several hours if needed. 4) Document cause and any actions in the e-log or site logbook as appropriate.
Power Loss or
interruptions
1) Verify power supply integrity. 2) Verify circuit breaker and fuse integrity. 3) Document cause and actions taken in the e-log or site logbook as
appropriate.
QAPP for the Northampton County Background-Monitoring Program Revision 0 10/3/2019
Page 67 of 111
Table 14.2. Corrective Actions
Activity Problem Likely Actions
Annual Performance
Evaluation
Out of specification
1) Verify integrity of the audit equipment. 2) If a problem exists with the audit equipment, repair the equipment and repeat the audit. 3) If the audit equipment is good, verify the monitor is operating correctly and if problems exist, fix them. 4) If no problems exist with the audit equipment or monitor, notify the operator so the operator can recalibrate the monitor. 3) Document cause and actions taken on the audit data sheets or site logbook as appropriate.
Data Review
Data missing from data acquisition
system (DAS)
1) Verify DAS operation. 2) Ensure monitor polling is current. 3) Isolate telecommunications problem by connecting to the monitor using
alternate processes. 4) Verify monitor operations remotely. 5) Notify the database manager or ECB, as appropriate. 6) Perform site visit to resolve monitor or telecommunication issues.
14.7 Documentation
The regional monitoring technicians and ECB electronics technicians will document all events, including routine site visits, calibrations, analyzer maintenance, and calibration equipment maintenance, in 109 forms and in e-logs and site logbooks. The ECB electronics technicians will also write in indelible ink field maintenance activities associated with equipment used by the regional monitoring technicians in dedicated instrument logbooks as well, which are stored at the ECB. The records generated by the regional monitoring technician or at the monitoring site will normally be controlled by the coordinator and located in the field site when in use or at the RRO when being reviewed or used for data verification. The regional coordinator transfers these records to the RCO group drive for the RCO chemist to use to validate the data.
QAPP for the Northampton County Background-Monitoring Program Revision 0 10/3/2019
Page 68 of 111
15.0 Equipment Testing, Inspection and Maintenance Requirements
15.1 Purpose/Background
Preventative maintenance is a foundational element to an effective QA program. The ECB in the Maywood facility houses the maintenance and repair shop (referred to as the "shop") for off-site repair, maintenance, and field readiness certification of equipment. This section discusses the procedures regional monitoring and ECB electronics technicians use to maintain all instruments and equipment, including spare analyzers, in sound operating condition and verify they can operate at acceptable performance levels. Refer to the instrument specific SOPs (listed in Table 11.2) for more details on the specific preventative maintenance and repair activities. The regional monitoring and ECB electronics technicians must document and file all instrument inspection and maintenance activities. See Section 9.0 Documentation and Records for document and record details.
15.2 Testing
At the time of this QAPP, the DAQ is revising the testing procedures to clarify and streamline them. For all criteria pollutant monitors used in the monitoring network, the DAQ shall purchase equipment listed on the EPA’s List of Reference or Equivalent Methods. Therefore, the DAQ assumes the monitors and procedures used to be of sufficient quality for the data collection operation. For indoor shelter temperature where EPA equivalent or reference methods do not exist, DAQ will follow EPA guidance. Table 11.1 identifies the model designations. Currently when the DAQ purchases new monitors, the DAQ makes every effort to evaluate the monitor as soon as possible after receipt to ensure the monitor is working so DAQ can address any problems while the monitor is still under warranty. The ECB electronics technicians will create a new maintenance logbook for each new piece of equipment.
Before the ECB electronics technicians install the monitors at the Northampton County background-monitoring site, the ECB electronics technicians assemble and operate newly purchased or repaired monitors at the ECB. For the gaseous monitors and spares, the analyzers shall successfully undergo at least one zero/span and multi-point calibration and must meet the specifications in SOP 2.17.1. If any of these checks are out of specification, the ECB electronics technician will contact the vendor for initial corrective action. If the monitor meets the acceptance criteria, the ECB electronic technician allows it to operate in the shop until he can confirm functionality. Following site installation, the regional monitoring technicians will initiate, observe and document the successful completion of a zero and span cycle by the ECB electronics technicians installing the equipment. If the analyzer meets the zero and span acceptance criteria (see Table 7.2), the ECB electronics technicians will assume the monitors are operating properly and ready for calibration by the regional monitoring technician. The ECB electronics technicians will properly document and file these tests in the instrument maintenance logbooks stored at the ECB. When DAQ purchases new monitors, the DAQ makes every effort to evaluate the monitor as soon as possible after receipt to ensure the monitor is working so that any problems can be addressed while the monitor is still under warranty.
QAPP for the Northampton County Background-Monitoring Program Revision 0 10/3/2019
Page 69 of 111
For the PM2.5 monitors, the ECB electronics technicians will perform external and internal leak checks and temperature, pressure and flow rate multi-point verification checks. If any of these verifications are out of specification, the ECB will contact the vendor for initial corrective action. The ECB electronics technicians may also perform a background test on the monitor before installing it at the site. In general, the ECB electronics technician performs the following acceptance/testing activities upon receipt of new monitors and samplers. If the equipment is new and fails to meet the field readiness certification described below, the ECB electronics technician will contact the vendor. The ECB electronics technicians will properly document and file these tests in the instrument maintenance logbooks stored at the ECB.
• Verify that instrument contains its EPA equivalent or reference method decal and meets the specifications of the purchase request.
• Verify that all expected parts arrived with the instrument and that nothing is physically broken. Contact the vendor if there are issues.
• Perform field readiness “certification” testing, summarized as follows. Although the designation of the FRM/FEM status ensures the make/model of the instrument meets EPA requirements for use in the network, DAQ must still ensure individual instruments perform as expected before deployed in the field.
• Check the diagnostics of the sampler, looking for any fault lights or warnings, and document the status.
• Check, and if need be, calibrate, the temperature and pressure sensors. • Perform flow rate checks and make sure they fall within the acceptance criteria. • For continuous particulate samplers, the ECB electronic technician runs the sampler in
the lab and observes the ambient concentration values; they should be low (as this is indoor air) and track steadily.
• After this testing in the shop, the sampler is deployed to field where final testing is performed; the sampler is “run” in the field, collocated against the existing particulate sampler on site for multiple days. The regional monitoring technician compares the results between these two samplers; if acceptable, data collection can then officially begin.
If an instrument has undergone significant repair and fails to meet the field readiness certification (testing), the ECB electronics technician will contact the vendor. If after working with the vendor, the ECB electronics technician cannot repair the instrument such that it passes performance testing, then he will shelve the instrument (i.e., discontinue its field use). At that point, the ECB electronics technician tags the instrument as inoperable and uses it for spare parts. If the shelved and tagged instrument was a back-up instrument, then the ECB will begin the process to purchase a new instrument to replace it, such that a spare is once again available for use.
Once installed at the site, the regional monitoring technicians will again run the tests mentioned above. If the sampling instrument meets the acceptance criteria, the ECB electronics technician will assume the monitor is operating properly. The ECB electronics technician will properly document and file these tests in the instrument maintenance logbooks stored at the ECB.
QAPP for the Northampton County Background-Monitoring Program Revision 0 10/3/2019
Page 70 of 111
15.3 Inspection
Several items periodically require field inspection. The applicable equipment SOPs 2.17.1 and 2.46.2 (see Table 11.2 for SOP titles) and operations manuals present detail on these items and procedures. In general, the following inspection activities are used:
• The regional monitoring technicians inspect monitoring shelters, ample inlets and other enclosures during each site visit and at least once a month to ensure conditions do not adversely affect monitor operation or data integrity. The ECB electronics technicians inspect monitoring shelters, sample inlets and other enclosures during each site visit and at least once per year to ensure conditions do not adversely affect monitor operation or data integrity.
• A zero-air system is a vital piece of support equipment maintained at the Northampton County background monitoring station. The calibrator blends zero air with calibration gases to dilute them to the necessary concentrations for conducting routine calibrations, precision checks, including 1-point-QC checks and zero-span-precision checks, and performance evaluations or audits. Zero air systems used by DAQ for conducting these QA/QC checks and audits should be able to deliver 10 LPM of air that is free of O3, NO, NO2, SO2, CO and non-methane hydrocarbons to below the instruments’ method detection limits. Zero air supplies do not have to be NIST-traceable but will be inspected and tested semi-annually by the ECB electronics technicians to ensure they remain free of contaminates.
• The regional monitoring technicians, coordinator and RCO chemists and statistician review data collection and data quality each business day. They inspect the data for trends and signs of problems. Data trends that signal inspection would include issues such as frozen numbers for multiple hours in a row or erratic spikes or valleys in concentrations obtained.
• Inspections on equipment also occur during site visits to verify the entire system is in good working order. Site visit checklists are available to the regional monitoring and ECB electronics technicians, who document equipment-operating parameters on the zero-span-precision, calibration and maintenance tracking forms within the e-logs, as well as on performance-evaluation audit forms.
• The ECB electronics technicians test and inspect spare equipment at the time of purchase or after major repairs and before deployment to the field. The ECB electronics technicians certify equipment as field ready and store it on a shelf or monitoring bench (typically at the ECB) until deployment.
• The regional monitoring technicians review the site and monitors annually to ensure continuing compliance with 40 CFR Part 58, Appendices A, D and E. The regional monitoring technicians document the review on the DAQ site review forms.
In general, all monitors also undergo routine maintenance as part of the monthly site visit. If necessary, the regional monitoring technicians may contact the ECB electronics technicians for specific non-routine maintenance.
QAPP for the Northampton County Background-Monitoring Program Revision 0 10/3/2019
Page 71 of 111
15.4 Routine Maintenance
The following are general routine maintenance protocols:
• The ECB electronics technicians maintain a limited supply of critical spare parts in the ECB maintenance / repair shop to aid in rapid response to issues. For example, pump rebuild kits, spare pumps, filters, and other expendable supplies are routinely on hand.
• The regional monitoring and ECB electronics technicians schedule preventative maintenance ahead of time, so they can have all parts and tools easily available to complete the tasks and thereby minimize data loss.
• The regional monitoring technicians typically perform preventative maintenance activities in the field, although the ECB electronics technicians may complete some activities in the shop.
The routine preventive activities and schedules are detailed in the specific equipment SOPs 2.17.1, 2.17.2, 2.46.1 and 2.46.2 (see Table 11.2 for SOP titles) and supplemented by the equipment user manuals. The regional monitoring technicians perform diagnostic checks and document them before and after preventive maintenance. They document these diagnostic checks in the e-log. The regional monitoring technicians service all PM inlet heads monthly, VSCC monthly and down-tubes at least quarterly. They also replace NO2 gaseous instrument filters at least monthly.
QAPP for the Northampton County Background-Monitoring Program Revision 0 10/3/2019
Page 72 of 111
16.0 Instrument Calibration and Frequency The EPA defines “calibration” as the comparison of a measurement standard, instrument, or item with a standard or instrument of higher accuracy to detect and quantify inaccuracies and to report or eliminate those inaccuracies by adjustment. Use of the term "calibration" indicates that an adjustment in the instrument or the software occurred. The EPA recommends that regional monitoring technicians minimize adjustments to prevent introducing measurement uncertainty and verifications, "i.e., checks without correction (adjustment)," be used to confirm whether an instrument is operating within its acceptance range. Thus, the purpose of calibration is to minimize bias. Section 14.0 Quality Control Requirements and Procedures discusses calibrations in more detail. SOPs 2.17.2 and 2.46.2 (see Table 11.2) describe calibration procedures for each analyzer.
Title 40 CFR Part 58, Appendix A, Section 2.6 requires that gaseous standards (i.e., gas cylinders) and flow rate standards used in the ambient-air monitoring network be traceable to NIST. The ECB electronics technicians procure and maintain dedicated traceable standards for the certification of the ambient air quality monitoring systems. These standards provide a direct link to established national standards (i.e. NIST) and are the foundation for the collection of the highest quality ambient air pollution data possible in accordance with current procedures and existing federal regulations and guidelines. Traceable is defined in 40 CFR Parts 50 and 58 as meaning that a local standard (i.e., one maintained by a monitoring organization) has been compared and certified, either directly or via not more than one intermediate standard, to a primary standard such as a NIST Standard. Similarly, traceability is the property of a measurement result whereby DAQ or an auditor can relate the result to a stated reference through a documented unbroken chain of calibrations, each contributing to the measurement uncertainty. Standard traceability, therefore, is the process of transferring the accuracy or authority of a primary standard to a field-usable standard, resulting in a documented unbroken chain of calibrations/certifications. The applicable SOPs (see Table 11.2) or operation manuals provide specific calibration procedures and timeframes for certifications of field equipment.
To achieve and ensure traceability, DAQ adheres to the following principles:
• Devices are re-certified at least annually. The DAQ keeps records of these certifications at the ECB and in the RRO.
• Where applicable, in-house certification procedures (i.e., certifying a transfer standard against a certified primary standard - i.e., one of higher authority) are performed using SOPs 2.3.3, 2.3.5 and 2.3.6. The ECB maintains the documentation of these procedures in the ECB shop on appropriate forms.
• The coordinator maintains records of all instrument calibrations, using the traceable standards (with instrument identification numbers clearly documented), on the appropriate group network drives in the RRO and RCO.
In this manner, documentation exists that provides a documentation trail that links all DAQ calibrations back to NIST.
The following summarizes the standards used in the DAQ network and their recertification process. The regional monitoring and ECB electronics technicians monitor all certification periods to ensure the
QAPP for the Northampton County Background-Monitoring Program Revision 0 10/3/2019
Page 73 of 111
regional monitoring technicians do not use equipment beyond the documented certification expiration dates. The regional monitoring technician is responsible for verifying the equipment he or she is using is within certification and contacting the ECB at least 30 days before the certification expires.
16.1 Calibration of “Local Primary Standards”
A primary standard is a standard that is sufficiently accurate such that it is not calibrated by or subordinate to other standards. Primary standards are used to calibrate other standards referred to as working standards. The DAQ uses “local primary standards” or standards certified against NIST-traceable standards and kept in the ECB shop for the sole purpose of certifying transfer standards used in the field to calibrate equipment and verify equipment calibrations. The DAQ owns two “local primary standards” for each type of device. The ECB sends each “local primary standard” to the vendor for recertification in alternate years ensuring that one local primary standard is always available for use and has been certified within 365 days. DAQ staggers the rotation of standards such that one device always remains in certification. The ECB electronics technician compares the “local primary standard” that did not return to the vendor to the one that did return to the vendor to certify it and uses it to certify equipment for the next year.
The ECB is responsible for procuring and maintaining dedicated traceable standards and gases for the calibration of the ambient air quality monitoring systems. These standards provide a direct link to established national standards (NIST) and are the foundation for the collection of the highest quality ambient air pollution data possible in accordance with current procedures and existing Federal Regulations and Guidelines.
16.1.1. “Local Primary Flow Rate Standard”
The ECB uses an Alicat mass flow meters as a “local primary flow standard” used to certify the accuracy of the calibrator mass flow controllers. An ECB electronics technician sends it to the vendor for recertification every 365 days.
16.1.2. “Local Primary Temperature Standard”
The ECB uses an Omega Digital Thermometer DPT-1 with a bridge sensor as a “local primary temperature standard” to verify the accuracy of the field-temperature transfer standards. An ECB electronics technician sends the “local primary standard” to the vendor for recertification against a NIST primary standard every 365 days.
16.1.3. “Local Primary Pressure Standard”
The ECB uses a Mensor Model # 2500 as a “local primary pressure standard” used to verify the accuracy of the field-barometer transfer standards. An ECB electronics technician sends it to the vendor for recertification every 365 days.
16.1.4. “Local Primary Time Standard”
The ECB and regional monitoring technicians use the WWV NIST atomic clock in boulder, CO (telephone number: 1-303-499-7111) as a primary time standard. The correct time can also be obtained via the
QAPP for the Northampton County Background-Monitoring Program Revision 0 10/3/2019
Page 74 of 111
website http://nist.time.gov. Regional monitoring technicians can also call the ECB electronics technicians to request the NIST Time. The DIT configures all state network resources and devices, including the site computer at Northampton, to receive time settings from the web clock at Nist.gov (primary) and the Internet Time Service at bldroc.gov (backup). The DIT also configures the site computer at Northampton to remain on Eastern Standard Time throughout the year, which is the local standard time for Northampton County.
16.2 Calibration of Transfer Standards
The ECB electronics technicians or the vendor certifies all transfer standards against either a primary standard or the “local primary standard”. This establishes the traceability of the calibration.
16.2.1 Flow Transfer Standards
The field flow transfer standards used for PM2.5 monitor flow rate calibration will have their own certifications and will be NIST-traceable to the factory primary flow rate standard. The ECB will supply streamline flow transfer standard or Tetra-Cal (or equivalent) for field calibrations and flow rate verifications of the flow rates of the Northampton County background-monitoring analyzer. The ECB will also provide an additional set of field flow transfer standards to conduct independent performance audits. All devices have the advantage of providing volumetric flow rate values directly, without requiring conversion for mass flow measurements, temperature, pressure, or water vapor content. The manufacturer establishes (and verifies as needed) a calibration relationship for the flow rate standard, such as an equation, curve, or family of curves, as accurate to within 2 percent over the expected range of ambient temperatures and pressures at which the flow rate standard is used. The vendor shall recalibrate and recertify the flow rate standards at least annually.
16.2.2 Temperature Transfer Standards
The field temperature transfer standards used for calibration of temperature sensors will be mineral thermometers or Tetra-Cals that have their own certification by the vendor. The mineral thermometers will be re-verified/recertified at least annually against the “local primary temperature standard”, or auditor’s transfer standard, to within ± 1 ° C, over the expected range of ambient temperatures at which the temperature standard is used, by the ECB electronics technicians.
16.2.3 Pressure Transfer Standards
The field-pressure transfer standards will be handheld digital barometers or Tetra-Cals that will have their own certification by the vendor. The ECB electronics technicians will re-verify or recertify the handheld digital barometers at least annually against the “local primary pressure standard”.
16.2.4 Calibrators
The field calibrators are transfer standards that will have their own certification against “local primary standards.” The ECB electronics technicians use the Teledyne (Model T700U) calibrators as the field calibration device and as the audit device for NO2 monitoring. The ECB electronics technicians certify the mass flow controllers within field calibrators every 12 months
QAPP for the Northampton County Background-Monitoring Program Revision 0 10/3/2019
Page 75 of 111
and audit calibrators every nine months using Alicat flow measurement units. SOP 2.3.7 contains further details on the certification procedures.
16.3 Calibration Gases
All NO calibration gases must be EPA Protocol (NIST-traceable) and include the following information:
• Cylinder serial number, • NO concentration, • Recertification status, • Gas type, • Cylinder pressure (double checked upon receipt), • Impurity concentration, and • Expiration date.
The ECB electronics technicians service the zero air generators used at the Northampton County monitoring site annually, or more frequently if needed. The ECB electronics technicians maintains independent gas standards purchased from the same vendor and are designated for independent NO2 performance audits. The calibration gas standards will have their own certifications. The vendor will re-verify or recertify the NO calibration-gas standards after three years.
16.4 Documentation
See the appropriate SOP for field QC checks that include frequency and acceptance criteria and references for calibration and verification tests of analyzer concentration responses, sampler flow rates, temperature, pressure, and time synchronization. The PM2.5 field-analyzer flow rate, temperature- and pressure-sensor verification checks include one-point checks at least monthly. The NO2 analyzer verification checks include 1-point-QC check for NO2, NO and NOx at least every 14 days (DAQ does daily checks for NO and NOx) and multipoint calibrations at least annually, as documented by tracking on control charts.
All these events, as well as sampler and calibration equipment maintenance, will be documented in field data records and logbooks and annotated with the flags required in 40 CFR Section 58.20, and the manufacturer’s operating instruction manuals. The regional monitoring technicians will also keep field activities associated with the equipment they use in record logbooks as well. The coordinator will normally control these records. The records are located in the field site when in use or at the RRO when being reviewed or used for data validation.
The ECB electronics technicians will retain calibrator certification documentation at the ECB facility in Raleigh, North Carolina. Please reference Table 9.1 for the storage location of all documentation.
QAPP for the Northampton County Background-Monitoring Program Revision 0 10/3/2019
Page 76 of 111
17.0 Inspection/Acceptance of Supplies and Consumables DAQ SOPs (see Table 11.2) itemize the apparatus, equipment, materials, and supplies required for various monitoring equipment. In general, the ECB electronics technicians procure supplies and consumables directly from the vendor manufacturing the monitors used by DAQ. Most manufacturers' operating manuals itemize parts lists, including recommended replacement schedules. DAQ uses this information to determine the appropriate procurement schedule and volume of consumables required to support continuing operations.
The regional monitoring technicians track supplies and consumables (e.g., BAM filter tape and gas analyzer in-line particulate filters). When the regional monitoring technician needs replacements, he or she notifies the ECB. The ECB then supplies the needed items out of its inventory or purchases what the regional monitoring technician needs. The ECB electronics technicians maintain an inventory of supplies in the ECB shop for later distribution. The ECB electronics technicians inspect received materials to ensure they received the proper part number as ordered. They also perform a general inspection to identify any damaged products. They do not retain supplies deemed unsuitable. The ECB electronics technicians date parts received so they can easily determine storage duration. The ECB uses a revolving inventory system (first in, first out) to ensure storage times do not affect the material's integrity. If a manufacturer or EPA requirement indicates a specific expiration period for supplies, the ECB discards those supplies exceeding expiration dates if not used within the acceptable period.
Sample lines and fittings are important supplies. If used in the sampling train of a reactive gaseous analyzer, they must be fluorinated ethylene propylene (FEP) Teflon™ or equivalent. A consumable that is critical to the successful operation of the gaseous monitors are the gas cylinders used for calibration and QC checks of NO2 analyzers, as well as gas cylinders used to conduct internal performance audits. Gas cylinders ordered by DAQ are EPA Protocol Cylinders. The ECB electronics technicians review certificates of analyses upon receipt of new gas cylinders to ensure the cylinders meet purchase specifications. The certificates indicate the expiration date of the gases contained within the cylinders. DAQ abides by these expiration dates; the ECB electronics technicians track dates and usage, replacing cylinders when the regional monitoring technicians notify them that less than 500 psi remains in the cylinder or before they expire. Additionally, DAQ participates in the EPA Ambient Air Protocol Gas Verification program (https://www3.epa.gov/ttn/amtic/aapgvp.html). This program allows the independent assessment of gas cylinders to ensure their integrity and that of the supplier.
QAPP for the Northampton County Background-Monitoring Program Revision 0 10/3/2019
Page 77 of 111
18.0 Non-Direct Measurements This section addresses data the DAQ uses to support the Northampton County background-monitoring program but does not obtain by direct measurement. This includes data provided by outside sources and historical monitoring data. These databases and types of data and information include:
- Chemical and physical properties data - Sampler manufacturers' operational literature - Geographic location data - Historical monitoring information - External monitoring databases - Census data - Emissions inventory or other source emissions modelling data - National Weather Service data and - Traffic count data from the North Carolina Department of Transportation
Any use of outside data will be quality-controlled and documented to the extent possible following QA procedures outlined in this document and in applicable EPA guidance documents.
QAPP for the Northampton County Background-Monitoring Program Revision 0 10/3/2019
Page 78 of 111
19.0 Data Management
19.1 Purpose/Background
The primary work product of the Northampton County background-monitoring program is data. Accordingly, the DAQ needs formalized procedures to ensure successful data management. Data management describes an inter-related set of standardized processes used to acquire, transmit, transform, reduce, analyze, store and retrieve data. When documented and followed, a data management system helps maintain the data integrity and validity throughout its entire life-cycle. DAQ's air monitoring data follows a documented flow path. The data life-cycle starts before data collection begins and ends with use of the data. The following subsections identify the processes and procedures DAQ follows to acquire, transmit, transform, reduce, analyze, store and retrieve data. These processes and procedures maintain the data integrity and validity through application of the identified data custody protocols.
Figure 19.1 displays the generalized flow path of the DAQ ambient air monitoring data, including the QA/QC data collected within the network. The regional monitoring technicians, coordinator, RCO chemists and statistician and database manager acquire and process the ambient air monitoring data. Section 4.0 Project/Task Organization described staff responsibilities.
19.2 Data Collection and Recording
Ambient air monitoring analyzers which have been designated by EPA as reference or equivalent methods (FRMs or FEMs) will be used to collect data used for NAAQS compliance. Upon installation and at regular intervals as specified, ambient air monitoring instrumentation is calibrated in accordance with the specific pollutant SOPs identified in Table 11.2 of this QAPP. Note: When DAQ establishes a new site, the coordinator and ECB electronics technicians manually collect metadata for the site (GPS coordinates, etc.). The database manager maintains the metadata and uploads it into AQS, as appropriate. The regional monitoring technician and coordinator review the metadata annually during the network review and update it as needed.
For the Northampton County background-monitoring network, DAQ records most data electronically. The site computer is equipped with a DAS, called Envidas Ultimate, and a wireless modem used to transmit data to the master polling system, i.e., the Envista ARM data storage database, which is a separate software package located on a state server. The DAS and site computer have the capability to record the output of the monitors at the site, perform any required data transformation and format the resulting data in preparation for downloading to the Envista ARM database. The Envidas and Envista ARM database do not allow raw (original) data to be deleted. The DAQ uses the Envista ARM database for data verification, validation and reporting; the database uses replicate versions of the raw data to avoid violating the integrity of the original dataset. Data stored in the Envista ARM “edit” database can be modified, flagged, or voided, as needed; an edit history is recorded and available to track changes made to the data.
QAPP for the Northampton County Background-Monitoring Program Revision 0 10/3/2019
Page 79 of 111
Figure 19.1 Northampton County Background-Monitoring Data Flow Path
!Ambient Data from Northampton County Background Monitors
Continuous Northampton County Monitors
Master Polling System
Data archived for 4 years on NC DIT server
!Flow Rate Verifications & Semi-Annual Flow Rate Audits for PM
Check/ Audit Transfer Standard
Regio monitoring technician manually records
results in e-Lo
egio momtonng coordinator manually
copies e-log to RO Share Drive
Regional monitoring coordinator reviews and
approves e-log
e-log archived for 4 years on RO sharedrive
IAnunal Performance Exal11ation Pata from the N02 Monitor
Raw data archived at ECB for 4-years
AQ-12 1 Archived
in!BEAM
Regional monitoring technician reviews and
verifies the data
Regional monitoring coordinator review and
verifies the data
Regional monitoriug coordinator manually copies e-log to RCO share
drive
R CO chemist reviews and approves e-log
entr o ce c enust manually creates electronic
transaction file for upload to
R CO chemist certifies data as com lete
The RCO chemist manually runs and reviews AQS AMP
reports to verify
The RCO chemist certifies data as com lete
The database manager manually uploads t ransaction
files to A S
The RCO chemist manually runs and reviews AQS AMP
The RCO chemist certifies data as complete
QAPP for the Northampton County Background-Monitoring Program Revision 0 10/3/2019
Page 80 of 111
The DAQ also collects data manually. Monitoring and ECB technicians keep e-logs for most parameters, documenting QA/QC activities and preventive maintenance. For example, the operators document activities such as operational checks. Leak check results, flow check results, audit results, filter changes and calibrations in these spreadsheets. This manually recorded data (e-logs) are uploaded to the RRO group drive and then transferred to the RCO group drive for subsequent incorporation into the data validation process, discussed in Section 23 of this QAPP. Additionally, the results of the QA/QC checks are compiled manually from these e-logs for submission into the AQS database.
IBEAM (Internet-Based Enterprise Application Management) is a Java-based web application system used by DAQ as a primary repository and tracking system for many of the division’s business processes, including ambient monitoring data, forecast data and DAQ business documents, among others. For the AQ-121 data forms, which are the ECB annual performance evaluation reports, the PPB supervisor creates a transaction file manually, archives a scanned copy of the paper document in IBEAM and files the paper copy in a secured file cabinet in the RCO. The database manager electronically transfers the data using the transaction file to AQS.
The DAQ modeled the design architecture of IBEAM after the standard n-tier architecture supported by Tomcat Application Server running on a Windows Server. The system uses a thin client interface for presenting information, via HTML and Java Server Pages, or JSP’s, in Internet Explorer. The DAQ designed the system in a modular format with each module containing sub categories as appropriate. The DAQ defined security at the module level with a range of security options appropriate to staff requirements. Although IBEAM displays systems in a modular format, it stores the data in the background in an integrated data structure managed by the Oracle Relational Database Management System, or RDBMS. This means no duplication of data or data entry and a single point source for reporting and information dissemination.
19.3 Data Transmittal and Transformation
Data transmittal is accomplished using wireless communication to access a site modem. Downloading collected data does not delete data from the DAS. The Envidas software removes data from the site computer by overwriting data on a first-in, first-out basis. This configuration requires the Envista ARM software to extract data from the site computer on a regular basis to prevent any data loss. If communications problems arise, the Envista ARM software retrieves the data from the Envidas system when it can once again communicate with the site. The regional monitoring technician must make a site visit if the database manager or ECB electronics technician informs him or her that he or she cannot correct the communications problems in a timely fashion.
For the NO2 monitor, the DAS reads instantaneous NO, NO2 and NOx values from the monitor and averages each 60-second interval to create a one-minute average. The DAS stores each minute average, and this average acts as the base unit for all measurements taken by the NO2 monitor at the Northampton County background-monitoring site. The monitor, as well as the Envidas system, averages the stored 1-minute averages to form averaged hourly values, which are the blocks of ambient gaseous
QAPP for the Northampton County Background-Monitoring Program Revision 0 10/3/2019
Page 81 of 111
measured concentrations that the database manager submits to the EPA. Envidas transmits all these values to Envista ARM for retention.
For the PM2.5 monitor, the DAS reads hourly PM values from the continuous monitor. The DAS stores each hour and this acts as the base unit for all measurements taken by the PM monitor at the Northampton County background-monitoring site. Envidas transmits all these values to Envista ARM database for retention. The monitors and the ENVISTA ARM system then average the stored hourly averages to form averaged 24-hour values. However, the database manager only submits hourly PM values to the EPA AQS database for the continuous PM monitor. The AQS database then averages the submitted hourly averages to form 24-hour values and weighted annual averages.
19.4 Data Verification and Validation
Data verification and validation is an important routine process that involves several steps to ensure the regional monitoring technicians, coordinator and RCO chemists have correctly carried out the field and data processing operations. The verification and validation process will identify data with errors, biases and physically unrealistic values before the DAQ or the EPA uses them for the identification of NAAQS exceedances, for further analysis, or for modeling. Once the RRO or RCO have identified these problems, the regional monitoring technicians, coordinator and RCO chemists can correct, flag or invalidate the data. If necessary, the regional monitoring and ECB electronics technicians can take corrective actions to address monitor-related issues identified during the data review process.
Each of the network’s analytical instruments employed to measure the ambient concentrations of the criteria pollutants undergoes periodic audits, 1-point-QC checks or monthly flow rate validations and calibrations. SOPs 2.17.1, 2.17.2 and 2.46.2 (see Table 11.2 for SOP titles) outline these procedures. Audits and verification checks ascertain the accuracy, precision and repeatability of each instrument in performing its required function.
The instrument-generated data are stored on site in the DAS. When Envista ARM accesses the data through the wireless modems, it downloads the data into its database, where the data undergo verification, reduction and analysis (level 0). The regional monitoring technician using Envista ARM performs data verification electronically by searching the data for status flags and comparing reported values to acceptable range criteria (level 1). After the regional monitoring technician flags data as questionable, level 2 (preliminary) and 3 (final) reviewers evaluate the flagged data to identify underlying causes and decide whether the data are valid. If the data are invalid, DAQ and the EPA do not use them in calculations. If the data are valid, but flagged due to some extenuating circumstance, then DAQ and the EPA may use the data in calculations, accompanied by a comment documenting the situation. Section 23.0 of this QAPP discusses the data review process in more detail.
At the time of this QAPP revision, DAQ is in the process of updating and streamlining its data review procedures and developing new SOPs. The DAQ will revise this QAPP once DAQ implements the new procedures.
QAPP for the Northampton County Background-Monitoring Program Revision 0 10/3/2019
Page 82 of 111
19.5 Data Reduction and Analysis
As described in the subsections above, data reduction activities take place throughout the entire data management process. The Envista ARM system aggregates data into hourly and 24-hour averages, as appropriate; once validated, data are uploaded into the AQS database. The EPA compares submitted results to the NAAQS for NO2 and PM2.5.
The regulations at 40 CFR Part 50, define the quantity of valid data points required within a data set. For most pollutants, the EPA requires a minimum data capture of 75 percent of the interval – hour, day, quarter – for the EPA to consider the interval valid for use in NAAQS comparisons. Tables 7.2 and 7.3 summarize these completeness requirements as well as provide specific references to the CFR.
The DAQ analyzes data periodically throughout the data collection and validation process. For example, data can be downloaded from Envidas directly into Microsoft Excel spreadsheets. The regional monitoring technicians, coordinator, RCO chemists and statistician use Microsoft Excel spreadsheets solely for data analysis and in-depth study of the data. Each business day the statistician prepares a tabulation of the raw hourly data from the previous day, evaluating it for missing data, trends and data higher or lower than Tukey's fences for that day to ensure it is within specifications.
The RCO chemist and statistician also review all validated data looking for trends, data outside of three times the interquartile range, etc. to establish the reasonableness of the data sets. The RCO chemist and statistician accomplish these tasks by retrieving several reports from the AQS database, such as the AMP256, AMP430, AMP450 and AMP600 (for regulatory monitors), and analyzing the results.
19.6 Data Submission
After the regional monitoring technicians, coordinator and RCO chemists complete all three levels of verification and validation for a month of data, as described in Section 23.0 Verification and Validation Methods, the database manager or statistician uploads the data to the AQS. This submittal must occur no later than 90 days following the close of each calendar quarter, as specified in 40 CFR Section 58.16. The RCO chemist assigned to this task shall certify to the chief that the data are complete to the best of his or her knowledge. The quarterly data submittal shall contain the following summary data:
• The AQS site code, monitoring method code and parameter occurrence code; • The results of all valid precision, bias and accuracy tests performed during the quarter
for PM2.5 and NO2 (including NO and NOx); and • The ambient air quality data obtained for PM2.5 and NO2 (including NO and NOx).
At the end of each quarter, an RCO chemist runs the AMP251, AMP256, AMP350, AMP430 and AMP600 (for regulatory monitors) reports in AQS and verifies that all hourly data, annual performance evaluation, 1-point QC check, monthly flow rate verification and semi-annual flow rate audit data have been successfully entered. The DAQ will also notify the EPA if a monitor does not meet the completeness requirements summarized in Tables 7.2 and 7.3.
QAPP for the Northampton County Background-Monitoring Program Revision 0 10/3/2019
Page 83 of 111
Every year before the annual data certification due date, the chief reviews the data from the EPA AQS summary reports, along with internal performance evaluation and audit reports to confirm the data meet the required criteria. The RCO chemists address any concerns with the data.
If DAQ operates the monitors for more than two years, the DAQ shall submit to the EPA an annual AMP600 summary report of all the Northampton County background monitoring data from any FEM special purpose regulatory monitors that meet criteria in appendix A, in accordance with 40 CFR Section 58.15. DAQ will also submit a signed certification letter on DAQ agency letterhead signed by the chief. The chief will submit the report by May 1 of each year for the data collected from Jan. 1 through Dec. 31 of the previous year. The chief, or designee, must certify the report as accurate to the best of his or her knowledge. The chief will base this certification on the various assessments and reports performed by DAQ, including the annual QA report discussed in Section 21.0 Reports to Management that documents the quality of the ambient air quality data and the effectiveness of the quality system.
19.7 Data Storage and Retrieval
Once collected, data are stored in a variety of ways and for varying periods. Initially, data are stored in the monitor and/or the station-specific DAS. The monitors keep an unalterable record of instrument measurements for a period of days to weeks, depending on the amount of information stored. The on-site DAS also keeps an un-alterable record of instrument measurements for a period of months to years depending on the number of monitors operated at the site. The RCO Envista ARM database system automatically accesses data stored in the on-site Envidas system.
The DAQ archiving system makes possible the storage and retrieval of the air quality monitoring data. Backup and recovery procedures exist to ensure the regional monitoring and ECB electronics technicians and database manager can recover data in the event of a catastrophic failure. When storage space limits the amount of data that DAQ can keep in the database, procedures exist for moving the data into an archive database. Presently, data re backed up weekly using a Zip File. The most recent copy is kept on SharePoint. Data older than one-week old are polled directly from the site computer using Envidas. In the future the main database will be housed in DIT’s Western Data Center using a virtual server and mirrored to the current database computer. All data will be kept real time.
NOTE: The monitoring technicians also download data directly from instruments to laptops in the field for the continuous PM2.5 FEM twice a month; these data downloads serve as a back-up, as they are uploaded to RRO group drive for archival. The monitoring technicians also download backup site temperature data and store it on the RRO group drive for archival.
The DAQ retains all supporting electronic and written information, such as logbooks, maintenance logs, certifications and diagnostic information worksheets for a minimum period of four years, unless any litigation, claim, negotiation, audit or other action involving the records started before the expiration of the four-year period. When this type of situation occurs, the DAQ will retain the records until completion of the action and resolution of all issues that arise from it, or until the end of the regular four-year period, whichever occurs later. The DAQ shall store the data on electronic media or
QAPP for the Northampton County Background-Monitoring Program Revision 0 10/3/2019
Page 84 of 111
in hard copy, whichever format proves most advantageous. After the storage period has passed, the storage media may be disposed of or recycled.
QAPP for the Northampton County Background-Monitoring Program Revision 0 10/3/2019
Page 85 of 111
20.0 Assessments and Response Actions An assessment is the process used to measure the performance or effectiveness of the quality system, the Northampton County background-monitoring network and its site, and various measurement phases of the data operation. To ensure the adequate performance of the quality system, DAQ will perform the following assessments:
- Network reviews and assessments - DAQ and EPA Technical systems audits - External performance evaluations - Internal performance evaluations - Semi-annual flow rate audits - Quarterly completeness assessments - Annual data certification - Data quality audits - Data quality assessments - Internal systems audits
Table 6.1 provides information on the parties implementing assessments and their frequency.
20.1 Network Reviews and Assessments
Conformance with network requirements of the Northampton County background monitoring network as set forth in 40 CFR Part 58, Appendices A, C, D and E are determined through annual network reviews of the ambient air quality monitoring systems, as required by 40 CFR Section 58.10(a). The chief uses the network review to determine if an air-monitoring network collects adequate, representative and useful data in pursuit of its air monitoring objectives. Additionally, the annual network review may identify possible network modifications to enhance the system or correct deficiencies in attaining network objectives. Before implementing an annual network review, the regional monitoring technician compiles and evaluates significant data and information pertaining to the network. Such information might include:
- Network files (including metadata, updated site information and site photographs); - AQS reports, especially the AMP380 and AMP390 reports; - Network monitors’ five-year air quality summaries; - Local area emissions trend reports; - Traffic data; and - National Weather Service or State Climate Office weather summaries from stations nearby
the monitoring site. Upon receiving the information, the regional monitoring technician will check it to ensure it is current. The regional monitoring technician will note discrepancies and resolve them during the review. The regional monitoring technician will also identify and update files and photographs that need updating during the review. The DAQ emphasizes several categories during network reviews, such as the
QAPP for the Northampton County Background-Monitoring Program Revision 0 10/3/2019
Page 86 of 111
monitor location, nearby pollution sources, potential changes to nearby pollution sources, population density, changes in nearby land use, and other pertinent information. During the annual network review, the regional monitoring technician will reconfirm the stated objective for the monitoring site and re-verify the location’s spatial scale. If the site location does not support the stated objectives, or the designated spatial scale, the regional monitoring technician will propose changes to rectify the discrepancy. The RRO and RCO monitoring staff will then act to correct the information in AQS, relocate the monitors or site, or move the site to a more suitable location, if needed. Although proposed additions and discontinuations of SLAMS monitors are subject to EPA approval in accordance with 40 CFR Part 58.14, special purpose monitors are not subject to EPA approval for discontinuation or relocation. However, the chief informs EPA Region 4 of any changes to special purpose monitors.
In addition to the items included in the checklists, other subjects for discussion as part of the network review and overall adequacy of the monitoring program will include:
- Installation of new monitors, - Relocation of existing monitors, - Siting criteria problems and suggested solutions, - Problems with data submittals and data completeness, - Maintenance and replacement of existing monitors and related equipment, - Quality assurance problems, - Air quality studies and special monitoring programs, and - Other issues such as proposed regulations and funding.
The regional monitoring technician completes a network review of the Northampton County background- monitoring site and submits a network review form to the RCO every year. EPA regions are also required to perform these reviews. The regional monitoring technician considers the following criteria during the review:
- Date of last review; - Areas where attainment/non-attainment re-designations are likely to take place, or did take
place; - Results of special studies, saturation sampling, point source oriented ambient monitoring,
etc.; and - Proposed network modifications since the last network review.
20.1.1 Five-Year Network Assessment
The five-year network assessment is a more extensive evaluation of the Northampton County background-monitoring network. The assessment determines at a minimum:
− If the Northampton County background network meets the monitoring objectives defined in 40 CFR Part 58, Appendix D,
− Whether DAQ must add another background site, − Whether the existing background site is no longer needed and can be terminated, and
QAPP for the Northampton County Background-Monitoring Program Revision 0 10/3/2019
Page 87 of 111
− Whether new technologies are appropriate for incorporation into the Northampton County background-monitoring network.
During the network assessment, the ability of existing and proposed sites to support air quality characterization for areas with relatively high populations of susceptible individuals, for example, children with asthma, as well as the potential impact any sites proposed for discontinuance may have on other data users is considered. The DAQ submits a copy of the five-year assessment, along with a revised annual network plan, to the EPA Region 4. The Northampton County monitors will be included in the 2020 Network assessment due to EPA July 1, 2020. They may be included in future network assessments if they are still operating.
For more information about the Northampton County background monitoring location, please see the annual network plan at https://deq.nc.gov/about/divisions/air-quality/air-quality-data/annual-network-plan.
20.2 External Performance Evaluations
DAQ addresses performance evaluation activities by participating in the EPA’s NPAP and PEP. Because the Northampton County background monitors are not SLAMS, the EPA will only include them in the NPAP and PEP audit program at the specific request of the chief. Only qualified and authorized personnel execute performance audits. See Tables 6.1 and 7.2 and 7.3 for information regarding the frequencies and acceptance criteria related to PEP and NPAP audits.
20.3 Annual Performance Evaluations
The ECB electronics technicians, who do not operate the monitors, conduct performance evaluations at least once each calendar year and every 365 days on the NO2 monitor by challenging the monitor with known concentrations of gas using an independent calibrator and gas standard. The ECB electronics technicians certify the audit system and the monitor’s calibration system using the same primary standard for both. Likewise, the ECB purchases the gas standards for the audit system and monitor’s calibration system from the same vendor at the same time, so both come from the same lot of gas. The ECB electronics technicians follow the audit procedures in SOP 2.17.1. The results of these audits are documented on the AQ-121 form. If a monitor does not pass the evaluation, the RRO monitoring and ECB electronics technicians will take appropriate action to identify why the monitor failed the evaluation and to correct the situation.
20.4 Semi-annual Flow Rate Audits
A regional monitoring technician other than the regional monitoring technician who routinely operates the PM2.5 monitor completes a flow rate audit on the monitor at least once every 182 days and preferably once every quarter or 91 days. This monitoring technician uses different equipment to conduct the audit than the equipment used to calibrate the monitor and do the monthly or semi-monthly flow checks. The regional monitoring technician follows the audit procedures in SOP 2.46.2. The monitoring technician documents the semi-annual flow rate audits in the e-log. If a monitor does
QAPP for the Northampton County Background-Monitoring Program Revision 0 10/3/2019
Page 88 of 111
not pass the evaluation, the RRO monitoring staff will take appropriate action to identify why the monitor failed the evaluation and to correct the situation.
20.5 Quarterly Completeness Assessment
After the database manager uploads to AQS the data for a quarter, an RCO chemist assesses the data to ensure all data made it into AQS. The RCO chemist accomplishes the quarterly completeness assessment by running the AMP430 Completeness Report, the AMP350 Raw Data Report and the AMP251 QA Data Report. The RCO chemist compares the data in AQS with the data that should be in AQS based on the monitoring schedule. When the RCO chemist identifies missing data or some other problem, he or she informs the Level 3 reviewer and database manager who act to resolve the issue. The RCO chemist archives the AMP251, AMP350 and AMP430 reports used for the quarterly completeness review in IBEAM. If the monitor does not meet completeness requirements, the chief contacts EPA Region 4, providing information on what occurred and what actions DAQ plans to take to keep the event from reoccurring.
20.6 Annual Data Certifications
In accordance with 40 CFR Part 58.15, an annual air monitoring data certification letter is required to certify that the regulatory data from Jan. 1 to Dec. 31 of the previous year, collected by the FEM monitors at the Northampton County background-monitoring site, meet criteria in 40 CFR Part 58, Appendix A. Along with the certification letter, the chief must submit to EPA an annual summary report of all the ambient air quality data collected by the monitors, as well as a summary of the precision and accuracy data, for the previous year.
Data certification is the final process of assessing the Northampton County background monitoring data for the previous calendar year. The DAQ verifies and validates data monthly, as discussed in Section 23.0 Verification and Validation Methods. Additionally, the chief or designee assesses the data on a quarterly basis when an RCO chemist generates specific AQS reports to assess the DQIs as discussed in Section 20.8 Data Quality Assessments. With these assessments ongoing throughout the year, annual data certification, then, serves as the last assessment of the data – looking at it from an all-inclusive, annual perspective – to see if any unidentified anomalies or trends exist in the data that the DAQ review process did not previously identify. The annual data certification process starts with running and reviewing AMP reports contained in AQS. The reports typically queried include the following:
• AMP350 Raw Data • AMP251 QA Data • AMP430 Data Completeness • AMP600 Certification Evaluation (for regulatory monitors only) • AMP256 Data Quality Indicator • AMP504 Extract QA Data • AMP450 Quicklook Criteria Parameters • AMP450NC Quicklook All Parameters
QAPP for the Northampton County Background-Monitoring Program Revision 0 10/3/2019
Page 89 of 111
An RCO chemist and the PPB supervisor review these reports and confirm everything is complete and accurate. The RCO chemist and PPB supervisor also review the reports to ensure the statistical results indicate the monitoring data were in control over the course of the entire year and met the DQOs. If they identify problems, the RCO chemist investigates them in accordance with Section 24.0 Reconciliation with Data Quality Objectives.
Ultimately, this process verifies that the monitoring data submitted to AQS is correct and complete. Once the RCO chemists, statistician and database manager complete any necessary corrections, additions or deletions in AQS and the RCO chemist and PPB supervisor finalize the dataset, the chief officially recommends the data for certification to EPA Region 4. The data certification package provided to EPA includes a signed copy of the AMP600 report, along with a letter signed by the chief, certifying that the ambient concentration and QA data in AQS are complete and accurate, taking into consideration the QA findings, to the best of his knowledge.
The annual data certification package is due to EPA Region 4 by May 1 of each year.
20.7 Audit of Data Quality
An RCO chemist who does not review the data conducts the audit of data quality, or ADQ, which reveals how the level 1 to 3 reviewers handled data, what judgments they made and whether they made uncorrected mistakes and records exist to support the decisions made. An ADQ can often identify the means to correct systematic data reduction errors. Sufficient time and effort will be devoted to this activity so that the RCO chemist has a clear understanding and complete documentation of data flow. The RCO chemist shall perform this assessment quarterly in accordance with the quarterly data review as described in the SOP 2.61. The DAQ ensures the level 1 to 3 reviewers maintain data collection and handling integrity via the quarterly data review. If the RCO Chemist finds a problem during the ADQ, the RCO Chemist will work with the level 1 to 3 reviewers to correct the situation and modify the procedures to ensure the problem does not reoccur. See Section 23.0 of this document for more information related to the data review process which occurs monthly and/or quarterly.
20.8 Data Quality Assessments
Measurement uncertainty will be estimated for both automated data recording methods. Terminology associate with measurement uncertainty is found within 40 CFR Part 58, Appendix A. An RCO chemist will evaluate data quality on a quarterly basis using the AQS AMP256 for Appendix A pollutants and AMP600 reports for regulatory monitors. Because the Northampton County background-monitoring network has only one site, the DAQ bases the evaluation of the data quality on single monitors for this network. For the annual data certification, the Northampton County background monitoring site is combined with monitors from other DAQ-supported networks to determine an estimate of data quality for the agency or PQAO overall. The chief reports the individual results of these tests for each method or analyzer to the EPA annually as part of the AQS AMP600 report.
Level 1 data reviewers use the BAM continuous flow-rate control chart in the e-log semimonthly to identify unusual variations in the flow rate. The Level 1 data reviewers must take corrective action
QAPP for the Northampton County Background-Monitoring Program Revision 0 10/3/2019
Page 90 of 111
when the control chart shows the flow rate reaching the action level. The RCO chemist reviews control charts of the daily auto zero, span and 1-point-QC check for NO, NO2 and NOx every business day. When the control chart indicates the zero, span, or 1-point-QC check drifted out of range, the RCO chemist contacts the regional monitoring technician and asks them to take corrective action as specified in SOP 2.17.2. In addition, box and whisker plots are viewed at least annually for the 1-point-QC checks.
20.9 Technical Systems Audits
A technical system audit, or TSA, is a thorough, independent and systematic on-site qualitative assessment, where EPA auditors examine facilities, equipment, personnel, training procedures, protocols and recordkeeping for conformance with the regulatory requirements and this QAPP. EPA Region 4 QA staff conducts a TSA of DAQ every three years, in accordance with 40 CFR Part 58, Appendix A, Section 2.5. The EPA reports its findings to the DAQ director and chief. The chief regularly monitors progress on corrective actions required because of TSA findings and communicates progress to the director and EPA Region 4.
An EPA TSA team or an individual TSA auditor may segregate TSA activities into multiple categories. The auditor may audit the categories independently or together. Possible categories may include:
- Field activities – Monitor installation, calibration and sampling. - Data management activities – Collecting, flagging, editing, and uploading data and providing
data security.
During the audit, the auditors will interview key personnel with responsibilities for planning, field operations, equipment certification, QA/QC, data management and reporting.
Upon completion of the audit, EPA verbally alerts the DAQ director and chief of any deficiencies or findings during an on-site TSA exit briefing. This briefing allows DAQ staff to begin formulating or implementing corrective actions. The EPA typically distributes a draft TSA report within 30 days of the completion of the audit. EPA Region 4 allows a brief comment period of the draft report for factual accuracy. After EPA receives comments from DAQ, EPA finalizes the TSA report and resubmits the report to the director and chief. The director and chief must complete and submit to EPA Region 4 within 30 days a formal response to address the TSA findings. The chief will communicate with EPA routinely after submitting the corrective action plan to provide progress updates on a periodic basis until DAQ has completed the corrective actions.
If the Northampton County background monitoring program collects data for three or more complete calendar years to verify compliance with the NAAQS, the EPA shall conduct TSAs once during every three-year period that the Northampton County background-monitoring program operates.
20.10 Internal Technical Systems Audits
At the time of this QAPP revision internal technical systems audits are not being completed. However, DAQ is considering implementing a schedule in the future. Ideally, an RCO chemist performs an internal technical systems audit on the Northampton County background-monitoring program, at least once,
QAPP for the Northampton County Background-Monitoring Program Revision 0 10/3/2019
Page 91 of 111
which may include the RRO, ECB and RCO activities. An internal audit is like a technical systems audit performed by the EPA. It is a thorough and systematic qualitative audit, where an auditor examines facilities, equipment, personnel, training procedures, protocols and record keeping for conformance with established regulations and statewide policies governing the collection, analysis, validation, and reporting of ambient air quality data.
A systems audit team or an individual systems auditor may separate systems audit activities into two categories for systems audits. They may audit the categories independently or together. The categories may include:
• Field activities – performing routine maintenance of equipment, maintaining certification records, performing associated QA/QC activities, etc.
• Data management activities – collecting, flagging, editing and uploading data and providing data security, etc.
The auditor will interview the key personnel responsible for planning, field operations, QA/QC, data management and reporting. The following sections list the reporting and corrective actions which follow an internal technical systems audit.
20.10.1 Post-Audit Activities
The post-audit activity is the preparation of the systems audit report. The report will include:
• Audit title, identification number, date of report and any other identifying information; • Audit team leaders, audit team participants and audited participants; • Background information about the project, purpose of the audit, dates of the audit,
measurement phase or parameters that were audited and a brief description of the audit process;
• Summary and conclusions of the audit and corrective action required; and • Attachments or appendices that include all audit evaluations and audit findings.
The auditor will prepare a written report summarizing the findings. The following areas may be included but all reports will include items 3, 4 and 5:
1. Planning, 2. Field operations, 3. QA/QC, 4. Data management, and 5. Reporting.
The report will document problems with specific areas and recommend corrective actions for the monitoring staff to implement.
To prepare the report, the auditor will compare observations with collected documents and results of interviews with key personnel. The auditor will compare expected QAPP implementation with observed accomplishments and deficiencies. The monitoring staff will review the audit findings in detail and,
QAPP for the Northampton County Background-Monitoring Program Revision 0 10/3/2019
Page 92 of 111
within 30 calendar days of the completion of the audit, the auditor will generate and distribute an audit report to senior staff for comment.
If the RRO, ECB or RCO has written comments or questions concerning the audit report, the auditor will review and incorporate them as appropriate. Subsequently, a modified report will be prepared and submitted to the audited unit or units, management and the chief in final form within 30 days of receipt of the written comments. The report will include an agreed-upon schedule for corrective action implementation.
20.10.2 Follow-up and Corrective Action Requirements
As part of corrective action and follow-up, the RCO, RRO or ECB will generate an audit finding response form for each finding in the systems audit report with a corrective action report where appropriate. The appropriate supervisor over the area audited signs the audit finding response form and sends it to the systems audit team, which reviews and accepts or rejects the corrective action. Within 30 days of acceptance of the audit report, the parties involved will complete the audit response form.
The results of the internal systems audit may result in additional or refresher training for air monitoring staff. The DAQ may provide the training in the form of additional communications regarding DAQ’s approved practices along with discussions of the elements necessary to satisfy these requirements. It may also be in the form of hands-on technical training. Section 21.8 of this QAPP contains additional information on corrective actions.
20.10.3 Audit Schedule
The DAQ will perform a TSA anytime senior staff feels it is appropriate to assist in identifying deficiencies and providing timely corrective actions.
QAPP for the Northampton County Background-Monitoring Program Revision 0 10/3/2019
Page 93 of 111
21.0 Reports to Management This section describes the quality-related reports and communications to management necessary to support Northampton County background network operations and the associated data acquisition, validation, assessment, and reporting. Besides the reports discussed in this section, staff meetings occur regularly on either a weekly, a biweekly or a monthly schedule depending on the part of the organization involved. In addition, DAQ holds as-needed meetings with the affected parties to address any additional issues that may arise. See Section 20.0 of this document for additional information regarding the types of reports generated from AQS used to inform management of QA issues.
The EPA's Air Quality Assessment Division within the Office of Air Quality Planning and Standards (OAQPS) provide guidance for management report format and content. The following subsections describe these reports.
21.1 Quarterly Data Reports
The DAQ monitoring staff will edit, validate and upload air quality data submitted for each reporting period to AQS using the procedures described in the EPA’s AQS User Guide, EPA’s AQS Data Coding Manual (https://www.epa.gov/aqs/aqs-manuals-and-guides) and DAQ’s data handling and validation SOPs 2.41.3 and 2.41.4. After the database manager uploads all data for the quarter to AQS, an RCO chemist pulls and reviews the following quarterly reports from AQS: the AMP251, AMP256, AMP350, AMP350MX, AMP430 and AMP600. After reviewing the reports, the RCO chemist archives the reports in the IBEAM general documents module and sends an e-mail to the Level 3 reviewer summarizing the review and any corrective action needed.
When data capture for a monitor falls below 75 percent for the quarter, an RCO chemist prepares for the chief a memo explaining why and the corrective action taken. Otherwise the PPB supervisor documents that the quarterly data submittal is complete and the data meets 75 percent completeness by sending an e-mail to the chief. Table 21.1 provides the date by which the DAQ uploads the previous quarter’s data.
Table 21.1 provides the dates by which the DAQ uploads the previous quarter’s data.
Table 21.1 Required AQS Data Reporting Periods Quarter Reporting Period Last Day to Upload Data to AQS
Q1 Jan. 1 to March 31 June 29 Q2 April 1 to June 30 Sept. 28 Q3 July 1 to Sept. 30 Dec. 29 Q4 Oct. 1 to Dec. 31 March 30 or 31 (of following year)
21.2 Annual Performance Evaluations
The ECB electronics technicians conduct performance evaluations, sometimes referred to as audits, of the NO2 monitors at least once each calendar year, using specially designated audit equipment. All
QAPP for the Northampton County Background-Monitoring Program Revision 0 10/3/2019
Page 94 of 111
gaseous transfer standards used in the air-monitoring network must be traceable to a primary standard such as a NIST standard reference material or an EPA/NIST-approved certified reference material.
The ECB electronics technicians document the results of each performance evaluation on the AQ-121 form. After the ECB supervisor reviews and approves the form, he routes the form to the chief for review and approval. After the chief reviews and approves the form, the PPB supervisor distributes the form to the RRO supervisor, coordinator and RCO chemists.
21.3 Annual Network Review
By October 31 of each year the regional monitoring technicians will conduct an annual site review documenting the information requested on the annual site review forms which is part of DAQ’s overall annual network review of the Northampton County background-monitoring site. This process is described in SOP 2.43. The review determines if the monitoring site and probe locations meet the siting requirements and monitoring objectives defined in 40 CFR Part 58, Appendices D and E. The review identifies needed modifications to the site and network including termination or relocation of unnecessary stations or monitors or establishment of new stations or monitors. The regional monitoring technician submits the form to the regional monitoring coordinator, who reviews the form and submits it to the RCO by Dec 31. The PPB supervisor archives the network review forms in the IBEAM general documents module and provides them to the public and the EPA as appendices to the annual network-monitoring plan.
21.4 Annual Data Certification
The chief will prepare a data certification package for his signature by May 1 of each year. The report will consist of a letter, for signature, along with AQS generated summaries of Northampton County background monitoring concentration data collected during the previous year, and all applicable QA data. The OAQPS and EPA Region 4 specify the exact AQS reports for the chief to submit. Generally, the chief submits an AMP600 and AMP450NC report.
The EPA requires state and local programs to report periodic assessments of SLAMS data quality for the PM network to EPA (40 CFR Part 58, Appendix A, Section 1.4). The DAQ issues the annual data certification report to meet this requirement. This document describes the quality objectives for measurement data as well as how DAQ met those objectives.
21.5 Annual Network Monitoring Plan
Following the requirements in Title 40 CFR Part 58.10(a), the DAQ prepares and submits to the regional administrator an annual monitoring network plan by July 1 of each year. The plan provides for the establishment and maintenance of an air-quality surveillance system consisting of a network of SLAMS and special purpose monitoring stations. The plan includes: (1) a statement of purpose for each monitor and (2) evidence that siting and operation of each monitor meets the requirements of 40 CFR Part 58, Appendices A, C, D and E, where applicable. Before submission to EPA, the DAQ makes the annual monitoring network plan available for public inspection for at least 30 days.
QAPP for the Northampton County Background-Monitoring Program Revision 0 10/3/2019
Page 95 of 111
As required by 40 CFR Part 58, Appendix A, Section 5.1, DAQ provides a list of all monitoring sites and their AQS site identification codes to EPA Region 4 each year in the network plan. The DAQ keeps AQS up-to-date by creating site data records with the date DAQ established a site and other pertinent info. DAQ also sends any appropriate data to AirNow-Tech. Whenever there is a change in this list of monitoring sites or in a reporting organization between network plans, DAQ reports this change to EPA Region 4 via electronic mail and to AQS and AirNow-Tech by updating the appropriate site records.
21.6 Five-Year Network Assessment
DAQ conducts and submits to the EPA regional administrator an assessment of the air-quality surveillance system every 5 years, which is due on July 1. At a minimum, this assessment determines if the network meets the monitoring objectives defined in 40 CFR Part 58, Appendix D, whether DAQ needs to add new sites, whether DAQ no longer needs existing sites and can terminate them, and whether new technologies are appropriate for incorporation into the ambient-air monitoring network. In the network assessment, DAQ considers the ability of existing and proposed sites to support air quality characterization for areas with relatively high populations of susceptible individuals (e.g., children with asthma). For any sites that DAQ proposes for discontinuance, DAQ also considers the effect on users of the data, other than the agency itself, such as nearby states and tribes or health effects studies. For PM2.5, the assessment also identifies needed changes to population-oriented sites. The chief submits a copy of this 5-year assessment, along with a revised annual network plan, to the regional administrator.
21.7 Internal Systems Audit Reports
At this time DAQ is not completing internal systems audits at the Northampton County background-monitoring site. An RCO Chemist will perform an internal systems audit if completed, to verify that the Northampton County background-monitoring program meets the data MQOs outlined in section 7.2. The RCO chemist will distribute copies of the systems audit report to the RRO, RCO chemist, ECB, the PPB supervisor and the chief.
21.8 Response/Corrective Action Report
Currently the regional monitoring technician documents any corrective action taken at the site in an e-log. The e-logs are not sent to management but are reviewed by the RRO monitoring coordinator and the RCO chemists. When the corrective action needed is beyond what the regional monitoring technician can handle at the site, the regional monitoring technician contacts the regional monitoring coordinator and the ECB. The ECB documents all corrective actions taken on a 109 Form which is reviewed by the ECB and PPB supervisors. When corrective action is needed to correct data reported to AQS, the changes are documented on a data correction form. If the corrective action affects several days or months’ worth of data, involves systematic issues, or endangers meeting completeness, the corrective action is documented in a memo to the chief and cc’s to the RRO supervisor. At the time of this QAPP revision, these procedures are undergoing review and may be revised to streamline and improve the process.
QAPP for the Northampton County Background-Monitoring Program Revision 0 10/3/2019
Page 96 of 111
22.0 Data Validation and Usability Data review is the in-house examination to ensure that the data has been recorded, transmitted and processed correctly. It includes completeness checks to determine if there are any deficiencies such as missing data or lost integrity. The level one to three reviewers should compare the data under evaluation to actual events, as per guidance (Guidance on Environmental Data Verification and Data Validation (EPA QA/G-8)). In addition, DAQ expects that some of the QC checks will indicate that the data fail to meet the acceptance criteria. The level one to three reviewers shall flag data identified as suspect or does not meet the acceptance criteria with AQS codes prior to upload to AQS.
Data verification is the process for evaluating the completeness, correctness, and conformance/compliance of the data set against method, procedural and contractual specifications. Verification can be further defined as confirmation, through provision of objective evidence, that specified requirements have been fulfilled.
Data validation is a routine process designed to ensure that reported values met the quality goals of the environmental data operations. Data validation is further defined as examination and provision of objective evidence that the particular requirements for a specific intended use are fulfilled.
The primary intended use for the Northampton data set is to measure background concentrations of NO2 (including NO and NOx) and particulate matter.
A progressive, systematic approach to data validation must be used to ensure and assess the quality of data. Data validation includes the review of the Northampton data sets against the individual pollutant MQOs. Reviewing data long-term (over a monthly or quarterly period) provides information about the structure of the data and may identify patterns, relationships or potential anomalies. If the RCO chemist finds a problem or discrepancy, he or she will conduct further investigations to find the source of the error and then correct it. Deviations from operational procedures or QA requirements that do not result in data invalidation may require that data be qualified with QA qualifier flags prior to upload to AQS.
22.1 Sampling Design
Sampling network and monitoring site selection must comply with the following:
- 40 CFR Part 58, Appendix A - Quality Assurance Requirements for Monitors Used in Evaluations of National Ambient Air Quality Standards
- 40 CFR Part 58, Appendix D - Network Design Criteria for Ambient Air Quality Monitoring - 40 CFR Part 58, Appendix E - Probe and Monitoring Path Siting Criteria for Ambient Air Quality
Monitoring
Guidance on Choosing a Sampling Design for Environmental Data Collection (EPA QA/G-5S)2 provides additional guidance.
2 Available at: https://www.epa.gov/sites/production/files/2015-08/documents/g9r-final.pdf
QAPP for the Northampton County Background-Monitoring Program Revision 0 10/3/2019
Page 97 of 111
The regional monitoring technician shall thoroughly document any deviations from the minimum siting criteria (e.g., shelter location, probe placement and/or monitor sight path requirements) in the site’s QC documentation. Examples of deviations include, but are not limited to, insufficient distance from roadways (i.e., marginal terrain criteria) and insufficient distance from influencing objects (e.g., dripline of an adjacent tree or a cell phone tower installed after the monitoring site was established).
The chief included the proposed Northampton County background-monitoring site in the 2018-2019 network-monitoring plan as an addendum. The DAQ did not receive any public comments on the addendum. The EPA will approve the network plan addendum sometime in 2019.
22.2 Data Collection Procedures
Section 11.0 Sampling Methods Requirements outlines data collection procedures. The Envidas DAS routinely identifies potentially unacceptable data points in the database through electronic application of Envidas-applied status flags. The database manager has associated each instrument-specific flag with a unique error. The level 1 to 3 reviewers routinely review these Envidas-applied status flags as part of the data validation process. This activity assists in identifying suspect or potentially bad data points that could invalidate the resulting averaging periods. Table 22.1 presents a compilation of the AQS error flags and null codes.
The monitoring technician must document any deviation from the established data collection plan in the e-log or site logbook. Accurate and complete documentation of any data collection deviations will assist in any subsequent investigations or evaluations.
Table 22.1 AQS Qualifier Code Description and Type Flag Flag Description Flag Qualifier Type Purpose
IA African Dust Informational Only To provide information on
events that influenced the
measured values.
IB Asian Dust Informational Only IC Chem. Spills and Industrial Accidents Informational Only ID Cleanup After a Major Disaster Informational Only IE Demolition Informational Only IF Fire - Canadian Informational Only To provide
information on events that
influenced the measured values.
IG Fire - Mexico/Central America Informational Only IH Fireworks Informational Only II High Pollen Count Informational Only IJ High Winds Informational Only IK Infrequent Large Gatherings Informational Only IL Other Informational Only IM Prescribed Fire Informational Only IN Seismic Activity Informational Only IO Stratospheric Ozone Intrusion Informational Only IP Structural Fire Informational Only
QAPP for the Northampton County Background-Monitoring Program Revision 0 10/3/2019
Page 98 of 111
Table 22.1 AQS Qualifier Code Description and Type Flag Flag Description Flag Qualifier Type Purpose
IQ Terrorist Act Informational Only IR Unique Traffic Disruption Informational Only IS Volcanic Eruptions Informational Only IT Wildfire-U. S. Informational Only J Construction Informational Only
1C A 1-Point-QC check exceeds acceptance criteria but there is compelling evidence that the analyzer data is valid
Null Data Qualifier
Void the data and submit the code in
its place.
AA Sample Pressure out of Limits Null Data Qualifier AB Technician Unavailable Null Data Qualifier AC Construction/Repairs in Area Null Data Qualifier AD Shelter Storm Damage Null Data Qualifier AE Shelter Temperature Outside Limits Null Data Qualifier AF Scheduled but not Collected Null Data Qualifier AG Sample Time out of Limits Null Data Qualifier AH Sample Flow Rate or CV out of Limits Null Data Qualifier AI Insufficient Data (cannot calculate) Null Data Qualifier AJ Filter Damage Null Data Qualifier AK Filter Leak Null Data Qualifier AL Voided by Operator Null Data Qualifier AM Miscellaneous Void Null Data Qualifier AN Machine Malfunction Null Data Qualifier AO Bad Weather Null Data Qualifier AP Vandalism Null Data Qualifier AQ Collection Error Null Data Qualifier AR Laboratory Error Null Data Qualifier AS Poor Quality Assurance Results Null Data Qualifier AT Calibration Null Data Qualifier AU Monitoring Waived Null Data Qualifier AV Power Failure Null Data Qualifier AW Wildlife Damage Null Data Qualifier AX Precision Check Null Data Qualifier
Void the data and submit the code in
its place.
AY QC Control Points (zero/span) Null Data Qualifier AZ QC Audit Null Data Qualifier BA Maintenance/Routine Repairs Null Data Qualifier BB Unable to Reach Site Null Data Qualifier
QAPP for the Northampton County Background-Monitoring Program Revision 0 10/3/2019
Page 99 of 111
Table 22.1 AQS Qualifier Code Description and Type Flag Flag Description Flag Qualifier Type Purpose
BC Multi-point Calibration Null Data Qualifier BD Auto Calibration Null Data Qualifier BE Building/Site Repair Null Data Qualifier BF Precision/Zero/Span Null Data Qualifier
BG Missing ozone data not likely to exceed level of standard Null Data Qualifier
BH Interference/co-elution/misidentification Null Data Qualifier BI Lost or damaged in transit Null Data Qualifier BJ Operator Error Null Data Qualifier BK Site computer/data logger down Null Data Qualifier BL QA Audit Null Data Qualifier BM Accuracy check Null Data Qualifier BN Sample Value Exceeds Media Limit Null Data Qualifier BR Sample Value Below Acceptable Range Null Data Qualifier CS Laboratory Calibration Standard Null Data Qualifier
DA Aberrant Data (Corrupt Files, Aberrant Chromatography, Spikes, Shifts) Null Data Qualifier
DL Detection Limit Analyses Null Data Qualifier FI Filter Inspection Flag Null Data Qualifier
MB Method Blank (Analytical) Null Data Qualifier SA Storm Approaching Null Data Qualifier SC Sampler Contamination Null Data Qualifier ST Calibration Verification Standard Null Data Qualifier
TC Component Check and Retention Time Standard Null Data Qualifier
TS Holding Time or Transport Temperature Is Out of Specs. Null Data Qualifier
XX Experimental Data Null Data Qualifier
1 Deviation from a CFR/Critical Criteria Requirement Quality Assurance Qualifier
QAPP for the Northampton County Background-Monitoring Program Revision 0 10/3/2019
Page 100 of 111
Table 22.1 AQS Qualifier Code Description and Type Flag Flag Description Flag Qualifier Type Purpose
CB Values have been Blank Corrected Quality Assurance Qualifier Flag indicating the quality of the data.
In some cases, the data may not meet all the criteria but
is still valid.
CL Surrogate Recoveries Outside Control Limits Quality Assurance Qualifier
DI Sample was diluted for analysis Quality Assurance Qualifier EH Estimated; Exceeds Upper Range Quality Assurance Qualifier FB Field Blank Value Above Acceptable Limit Quality Assurance Qualifier FX Filter Integrity Issue Quality Assurance Qualifier HT Sample pick-up hold time exceeded Quality Assurance Qualifier
LB Laboratory blank value above acceptable limit Quality Assurance Qualifier
LJ Identification of Analyte is Acceptable; Reported Value Is an Estimate Quality Assurance Qualifier
LK Analyte Identified; Reported Value May Be Biased High Quality Assurance Qualifier
LL Analyte Identified; Reported Value May Be Biased Low Quality Assurance Qualifier
MD Value less than MDL Quality Assurance Qualifier MS Value reported is 1/2 MDL substituted. Quality Assurance Qualifier MX Matrix Effect Quality Assurance Qualifier ND No Value Detected Quality Assurance Qualifier NS Influenced by nearby source Quality Assurance Qualifier QX Does not meet QC criteria Quality Assurance Qualifier SQ Values Between SQL and MDL Quality Assurance Qualifier SS Value substituted from secondary monitor Quality Assurance Qualifier SX Does Not Meet Siting Criteria Quality Assurance Qualifier TB Trip Blank Value Above Acceptable Limit Quality Assurance Qualifier TT Transport Temperature is Out of Specs. Quality Assurance Qualifier V Validated Value Quality Assurance Qualifier
VB Value below normal; no reason to invalidate Quality Assurance Qualifier
W Flow Rate Average out of Spec. Quality Assurance Qualifier
X Filter Temperature Difference or Average out of Spec. Quality Assurance Qualifier
Y Elapsed Sample Time out of Spec. Quality Assurance Qualifier RA African Dust Request Exclusion
Flags data influenced by an
exceptional event for which the
RB Asian Dust Request Exclusion RC Chemical Spills and Industry Accidents Request Exclusion RD Cleanup After a Major Disaster Request Exclusion
QAPP for the Northampton County Background-Monitoring Program Revision 0 10/3/2019
Page 101 of 111
Table 22.1 AQS Qualifier Code Description and Type Flag Flag Description Flag Qualifier Type Purpose
RE Demolition Request Exclusion agency plans to submit a data
exclusion request. RF Fire - Canadian Request Exclusion RG Fire - Mexico/Central America Request Exclusion RH Fireworks Request Exclusion RI High Pollen Count Request Exclusion RJ High Winds Request Exclusion RK Infrequent Large Gatherings Request Exclusion RL Other Request Exclusion RM Prescribed Fire Request Exclusion RN Seismic Activity Request Exclusion RO Stratospheric Ozone Intrusion Request Exclusion RP Structural Fire Request Exclusion RQ Terrorist Act Request Exclusion RR Unique Traffic Disruption Request Exclusion RS Volcanic Eruptions Request Exclusion RT Wildfire-U. S. Request Exclusion
Data collection procedures must adhere to those procedures documented in the SOPs listed in Table 11.2. Any time the regional monitoring technician or coordinator uses a code to void or flag data, he or she should document the reason for using the code in the appropriate logbook. Accurate and complete documentation of any flagged or voided data will assist in any subsequent investigations or evaluations.
22.3 Quality Control
Section 14.0 Quality Control Requirements and Procedures specifies the QC checks that regional monitoring technicians must perform during data collection and analysis. These include the analysis of 14-day 1-point-QC checks, and monthly or semi-monthly flow rate verifications, which provide indications of the quality of the data produced by specified components of the measurement process. Tables 7.2 and 7.3 along with SOPs 2.17.2 and 2.46.2 (See Table 11.2 for SOP titles) specify the procedure, acceptance criteria, and corrective action (and changes) for each QC check. Data validation should document the corrective actions taken, affected sampling days or hours, and the potential effect of the actions on the validity of the data. SOPs 2.17.2 and 2.46.2 provide further information about 1-point-QC checks and monthly flow rate verifications.
22.4 Calibration
Section 14.0 Quality Control Requirements and Procedures addresses the calibration of the monitors, along with the information regional monitoring technicians should present to demonstrate they performed the calibrations correctly, and the results are acceptable. When a level 1 to 3 reviewer
QAPP for the Northampton County Background-Monitoring Program Revision 0 10/3/2019
Page 102 of 111
identifies calibration problems, a level 1 to 3 data reviewer should flag or void any data produced between the suspect calibration event and any subsequent recalibration to alert data users. SOPs 2.17.2, 2.37.2 and 2.46.2 (see Table 11.2 for SOP titles) provide further information about calibrations.
22.5 Data Reduction and Processing
As mentioned in the above sections, the EPA will perform TSAs and DAQ will perform internal systems audits to ensure the level 1 to 3 data reviewers follow the data reduction and processing activities mentioned in the QAPP. The level 1 to 3 data reviewers will review data monthly to ensure that associated flags or any other data qualifiers have been appropriately associated with the data. An RCO chemist not involved in data collection and processing will review the data quarterly to ensure that monitoring and ECB electronics technicians, coordinators and other RCO chemists took appropriate corrective actions.
22.6 Exceptional Events
The regulations at 40 CFR Section 50.14 allow the EPA Administrator to exclude certain data from use for determinations of exceedances and violations of a NAAQS, so long as a state or local agency demonstrates to the Administrator's satisfaction that the exceedance or violation was caused by an "exceptional event." The regulations at 40 CFR Section 50.1 define an "Exceptional Event" as an event or events, in which:
• The resulting emissions affect air quality in such a way that there exists a clear causal relationship between the specific event(s) and the monitored exceedance(s) or violation(s);
• The event(s) is not reasonably controllable or preventable; and • The event(s) is caused by a human activity that is unlikely to recur at that location or is a natural
event(s).
An exceptional event does not include:
• Air pollution relating to source noncompliance; • Stagnation of air masses or meteorological inversions; and • Meteorological events involving high temperatures or lack of precipitation.
Conditions involving high temperatures, or a lack of precipitation may promote occurrences of some types of exceptional events, such as wildfires or high wind events, which do directly cause emissions.
The EPA does not consider data affected by an exceptional event "representative" of air quality for NAAQS comparison purposes, or calculation of certain summary statistics. The RCO chemist should flag all concentration data affected by an exceptional event with an AQS information code linked within AQS to an event description. The RCO chemist should add exceptional event codes and descriptions to AQS during the monthly data review or as soon thereafter as possible but no later than the schedule established by federal rulemaking.
QAPP for the Northampton County Background-Monitoring Program Revision 0 10/3/2019
Page 103 of 111
It is the responsibility of the RCO chemist with the assistance of the regional office staff and air quality forecasters to analyze the data for potential exceptional events and to add the necessary flags and descriptions into AQS by the applicable regulatory due dates.
To obtain concurrence with an exceptional event the RCO must notify and cooperate with the EPA Regional Office to prepare a demonstration package for the EPA administrator. When the chief submits a demonstration package, the RCO chemist working with the database manager will change the informational flags in AQS to request exclusion flags.
Exceptional event data in AQS must receive concurrence from the EPA administrator. Data that does not receive a concurrence is still eligible for NAAQS comparisons, regardless of the application of request exclusion flags.
QAPP for the Northampton County Background-Monitoring Program Revision 0 10/3/2019
Page 104 of 111
23.0 Verification and Validation Methods Data verification is the process of evaluating the completeness, correctness, and conformance of a specific data set against the method, procedural, or contractual requirements, as specified in both the SOPs and 40 CFR Part 58. Data validation is a routine process that extends the evaluation of data beyond method, procedural, or contractual compliance (i.e. data verification) to ensure that reported values meet the quality goals of the environmental data operations and that the data can be used for its intended purpose.
The DAQ uses the validation templates provided in Table 7.2 and 7.3 for the weight of evidence approach afforded to PQAOs within 40 CFR Part 58, Appendix A. The DAQ follows the guidance in the QA Handbook regarding the use of these templates and handles the criteria as follows:
• Critical criteria are criteria deemed critical to maintaining the integrity of an ambient air concentration value. The level 1 to 3 reviewers should invalidate observations that do not meet each criterion on the critical table unless there are compelling reasons and justification for not doing so. Basically, the concentration value or group of concentration values that do not meet one or more of these criteria is invalid until proven otherwise. In most cases, the CFR dictates the requirement, the implementation frequency of the criteria and the acceptance criteria so these criteria are therefore regulatory in nature.
• Operational criteria are situations were violations of a criterion or criteria may be cause for invalidation of the data. The level 1 to 3 reviewers should consider other QC information that may or may not indicate the data are acceptable for the parameter they want to control. Therefore, the data, which do not meet one or more of these criteria, are suspect unless other QC information demonstrates otherwise and the reviewers have adequate documentation of that information. The level 1 to 3 reviewers should investigate, mitigate or justify the reason for not meeting the criteria.
• Systematic criteria include those criteria which are important for the correct interpretation of the data, but do not usually impact the validity of a datum or data. An example criterion is that at least 75 percent of the days for each quarter should successfully collect 18 or more hours of valid concentration values. The DQOs are also included in this table. If the data do not meet the DQOs, this does not invalidate any of the data, but it may impact the confidence in the attainment/non-attainment decision.
• The designation of QC checks as operational or systematic does not imply that the regional monitoring and ECB electronics technicians do not need to perform these QC checks. Not performing an operational or systematic QC check required by regulation can be a basis for invalidation of all associated data. The DAQ applies the validation templates only to small datasets of single values or a few weeks of information and does not allow a criterion to be in non-conformance simply because it is operational or systematic.
QAPP for the Northampton County Background-Monitoring Program Revision 0 10/3/2019
Page 105 of 111
23.1 Validating and Verifying Data
The validation and verification procedures that DAQ will employ for this operation shall conform to the validation SOPs listed in Table 11.2. Guidance on Environmental Data Verification and Data Validation, (EPA QA/G-8) also discusses at length verification and validation issues. The regional monitoring technicians and coordinator shall perform all verification activities. The RCO chemists shall provide additional support through a final review of all data reconciling any anomalies through discussions with the RRO. Following the final review, the RCO chemists will provide a final validation of all data. The RCO chemists will also provide QA/QC support.
The DAQ compares data under evaluation to actual events as specified in the applicable SOPs. However, significant or unusual field events may occur, and field activities may negatively affect the integrity of the data. In addition, the DAQ expects some of the QC checks will indicate the data fail to meet the acceptance criteria in Tables 7.2 and 7.3. The DAQ shall void or flag data identified as suspect, or does not meet the acceptance criteria as indicated in Table 22.1.
The DAQ verifies and validates the routine and the associated QC data monthly. Presently, monthly review is the most efficient period for these verification and validation activities. The DAQ finds that if DAQ can control the measurement uncertainty each month, then DAQ will maintain the overall measurement uncertainty for the one-year and three-year periods within the precision and bias DQOs.
23.2 Verification
After the previous month of data is available, the level 1 and 2 reviewers conduct a thorough review of the data for completeness and accuracy. Once the database manager enters the data into the Envista ARM database, the regional monitoring technician will review the data for routine data outliers and conformance to acceptance criteria. The regional monitoring technician will void or flag appropriately unacceptable or questionable data. The coordinator will verify all flagged data again to ensure the regional monitoring technician entered the flags and voids correctly, and that the data are acceptable for use. The level 1 and 2 reviewers document their review in Envista ARM along with their data review decisions.
23.3 Validation
Validation of continuously obtained measurement data requires two stages, one at the measurement value level and another after the previous month of data becomes available. The Envista ARM database retains records of all invalid data. Information shall include a summary of why the level 1 to 3 reviewers invalidated the measurement along with the associated flags. Logbook notes shall have more detailed information regarding the reason a reviewer voided or flagged a measurement.
The DAQ brackets all gaseous pollutant data by 1-point-QC checks or manual calibration checks before and after any invalidated period. This requirement helps to ensure that the NO2 monitors were in proper operating condition before and after the incident. In the same way, the DAQ brackets PM data by flow rate verifications or a calibration before and after any invalidated period. When a monitor fails, the level 1, 2 and 3 reviewers invalidate any data after the last passing 1-point-QC check.
QAPP for the Northampton County Background-Monitoring Program Revision 0 10/3/2019
Page 106 of 111
Data validation occurs monthly. The discussion below outlines the review, verification and validation processes. The organizational chart in Figure 4.1 labels the specific roles for review level 1 through 3 within the organization.
Level 0 Review – The Envidas DAS does the level 0 review.
• Acquire minute averages from second averages and hourly averages from minute averages. • Flag missing and irregular data with pre-programmed, user-defined status flags.
Level 1 Review - The regional monitoring technician does the level 1 review
• Review daily for anomalies and completeness and acquire missing data if available. • Verify that all daily precision checks fall within acceptable ranges. • Invalidate data collected during an hour where the shelter temperature was not within the
acceptable range. • Evaluate automated nightly zero/precision/span checks and take appropriate corrective action if
necessary. • Review minute data. • Verify maximum daily values for validity and take appropriate action if necessary. • Assess data for values or outliers outside of the acceptable ranges. • Review the hourly values for any exceedances and take appropriate action if necessary. • Review minute data as needed when completing the level 1 review procedures • Flag data as necessary for further investigation • Apply necessary AQS codes from Table 22.1 for hours in which maintenance or calibrations were
occurring.
Level 2 Review (Verification) - The coordinator does the level 2 review
• Review site records (operator logbook, site logbook). • Review operator checks (leak checks, filter changes, monthly flow verifications, very sharp cut
cyclone or VSCC cleaning, and maintenance). • Assess data for values or outliers outside of the acceptable ranges. • Review minute data as needed when completing the level 2 review procedures • Compare pollutant data with wind direction data. • Determine if mobile or area source specific emissions caused any irregularities. • Flag data as necessary for further investigation. • Ensure level 1 reviewers used consistent reasons for data invalidation throughout the
monitoring period to indicate calibrations, audits, etc. • Resolve any inconsistencies, anomalies or systemic issues. • Verify that all daily precision checks fall within acceptable ranges.
Level 3 Review (Validation) - The RCO chemist does the level 3 review.
• Ensure the proper null codes are used.
QAPP for the Northampton County Background-Monitoring Program Revision 0 10/3/2019
Page 107 of 111
• Ensure level one and two reviewers bracketed all invalidated data with the appropriate void codes and the correct checks of analyzer accuracy.
• Ensure all data falls within the acceptable ranges as stated in the MQOs in Tables 7.2 and 7.3. • Ensure all data is acceptable and can be used for its intended purpose. • Review minute data as needed when completing the level 3 review procedures • Add informational AQS flags (from Table 22.1) to describe data that is out of the ordinary but
may be considered “valid.” • Provide final validation signature.
The DAQ uses a weight of evidence approach in validating data. After level 1 and 2 verifications, the independent level 3 reviewer determines the validity of the data by reviewing:
• The one minute and hourly values, • Daily automatic QC checks, flow verifications, any manual checks and the 14-day checks, • Leak checks • e-logs and the information documented therein, • Correspondence with the regional monitoring and ECB electronics technicians and coordinator
and • The results of DAQ and EPA performance evaluations and semi-monthly flow rate audits.
The weight the reviewer should give to the available evidence depends on factors such as the quality of the data, consistency of results, nature and severity of effects, and relevance of the information. The weight of evidence approach requires use of scientific judgment and, therefore, it is essential to provide adequate and reliable documentation.
As a general principle, the more information provided, the stronger the weight of evidence is. The regional monitoring technician, coordinator and RCO chemist should present the information in a structured and organized way and consider the robustness and reliability of the different data sources to support any justification for validating or invalidating data. At the time of this QAPP revision the data validation SOPs are undergoing review and will be augmented with more detailed procedures. The DAQ will update this QAPP when DAQ completes those revisions.
The regional monitoring technicians and coordinator will complete the level 1 and 2 reviews within 20 days from the end of the monitoring month. The RCO chemist will complete the level 3 review 20 days after the level 2 review is completed. Within 40 calendar days after the level 3 review is completed, an independent RCO chemist will complete a review of the validated data once the database manager has uploaded it to AQS.
As discussed earlier, the EPA and DAQ have developed certain criteria based upon federal requirements and field operator judgment that the level 1 to 3 reviewers will use to invalidate a sample or measurement. The level 1 to 3 reviewers shall use the null data codes listed in Table 22.1 to indicate they have invalidated individual measurements, or groups of measurements from an instrument.
QAPP for the Northampton County Background-Monitoring Program Revision 0 10/3/2019
Page 108 of 111
24.0 Reconciliation with Data Quality Objectives Section 5.0 Problem Definition and Background describes the objectives of the Northampton County background-monitoring program. Section 7.0 Quality Objectives and Criteria for Measurement Data describes the DQO’s for the Northampton County background-monitoring program.
The AQS AMP256 and AMP600 reports are automated reports based on data uploaded to AQS. These reports provide summary statistics for the data collected. Because the DAQ uses warning limits that are more stringent than EPA’s control limits for its data and implements EPA’s critical criteria for all monitoring, DAQ should not have to directly calculate confidence intervals annually because all data should statistically meet the DQOs.
An RCO chemist will analyze the results of both the AQS AMP256 and AMP600 reports on a quarterly and annual basis to ensure both monitors at the Northampton site in Northampton County meet the required DQO’s. If the data from any of the monitors violates the DQI bias and/or precision limits, then the RCO chemist will investigate to uncover the cause of the violation. The RCO chemist may compare data from the monitors at Northampton to other monitors operated by the DAQ to determine if the cause is at the agency level (regional monitoring technician training) or higher (problems with method designation). If only the monitor at Northampton violates the DQI, the cause is more likely specific to the site (regional monitoring technician, problem with the site). Tools for determining the cause include reviewing:
- Data from a local or tribal program or nearby reporting organization; - Data from performance audits (DAQ, NPAP, or PEP); and - QC trends.
Once DAQ has identified a cause, DAQ will implement an appropriate corrective action. Some courses of action include:
- Determining the level of aggregation at which DAQ violated the DQOs: Results of the DQA process tell which monitors have problems, since the EPA developed the DQOs at the monitor level. To determine the level at which to take corrective action, the DAQ must determine whether the violations of the DQOs are unique to the Northampton site, multiple sites or a network of similar monitors, or caused by a broader problem. The AQS generates QA reports summarizing bias and precision statistics at the national and reporting organization levels by method designation. Examination of these reports may assist in determining the level at which the DQOs are being violated.
- Communicating with EPA Region 4: If DAQ finds a violation of the bias and precision DQOs, the chief will remain in close contact with EPA for both assistance and for communication.
- Extensively reviewing quarterly data until DAQ achieves the DQOs: The chief will continue to review extensively the quarterly QA reports and the QC summaries until the DAQ attains the bias and precision limits.
QAPP for the Northampton County Background-Monitoring Program Revision 0 10/3/2019
Page 109 of 111
Ultimately specifying tolerable error limits reduces the probability of making an error in a decision due to uncertainty in the data. Decision makers, such as EPA and the director, need to determine if the data collected within the DAQ monitoring network will be adequate for meeting the monitor objectives listed earlier in Section 5.0 Problem Definition and Background. The annual data certification process and reports generated as part of the certification provide a quantitative assessment of the measurement uncertainty for the Northampton monitors. By controlling uncertainty in the data to the extent prescribed by the DQOs, decision makers can use DAQ's ambient air monitoring data with confidence.
When DAQ has collected at least 12 months of data, DAQ will perform an analysis of the data to evaluate ambient concentration levels measured in Northampton County against the DQIs for this project and to compare them to the AQI. When the monitor is meeting the DQIs and the director has determined the monitoring objectives for this site are fulfilled, DAQ may choose to shut down these monitors.
QAPP for the Northampton County Background-Monitoring Program Revision 0 10/3/2019
Page 110 of 111
Revision History Northampton County background-monitoring program is a new program, and this is a new QAPP.
QAPP for the Northampton County Background-Monitoring Program Revision 0 10/3/2019
Page 111 of 111
QAPP Annual Review Documentation
Date of Review Name of Reviewer Signature of Reviewer Results of Review