Iron Distribution in Size-Resolved Aerosols Generated byUV-Femtosecond Laser Ablation: Influence of Cell Geometryand Implications for In Situ Isotopic Determinationby LA-MC-ICP-MS
Francois-Xavier d’Abzac (1, 2)*, Andrew D. Czaja (1, 2, 3), Brian L. Beard (1, 2), James J. Schauer (4)
and Clark M. Johnson (1, 2)
(1) Department of Geoscience, University of Wisconsin, 1215W Dayton Street, Madison, WI, 53706, USA(2) NASA Astrobiology Institute, University of Wisconsin, Madison, WI, USA(3) Departments of Geology and Chemistry, University of Cincinnati, Cincinnati, OH, 45221, USA(4) Environmental Chemistry and Technology Program, University of Wisconsin, 660 North Park Street, Madison, WI, 53706-1484, USA* Corresponding author. e-mail: [email protected]
The influence of ablation cell geometry (Framessingle- and HelEx two-volume cells) and laserwavelength (198 and 266 nm) on aerosols pro-duced by femtosecond laser ablation (fs-LA) wereevaluated. Morphologies, iron mass distribution (IMD)and 56Fe/54Fe ratios of particles generated frommagnetite, pyrite, haematite and siderite were studied.The following two morphologies were identified:spherules (10–200 nm) and agglomerates (5–10 nm).Similarity in IMD and ablation rate at 198 and 266 nmindicates similar ablation mechanisms. 56Fe/54Feratios increased with aerodynamic particle size as aresult of kinetic fractionation during laser plasma plumeexpansion, cooling and aerosol condensation. TheHelEx cell produces smaller particles with a largerrange of 56Fe/54Fe ratios (1.85‰) than particlesfrom the Frames cell (1.16‰), but the bulk aerosolmatches the bulk substrate for both cells, demonstrat-ing stoichiometric fs-LA sampling. IMD differences arethe result of faster wash out of the HelEx cell allow-ing less time for agglomeration of small, low-d 56Feparticles with larger, high-d 56Fe particles in the cell.Even with a shorter ablation time, half the total Feion intensity, and half the ablation volume, the HelExcell produced Fe isotope determinations for magne-tite that were as precise as the Frames cell, even whenthe latter included an aerosol-homogenising mixingchamber. The HelEx cell delivered a more constantstream of small particles to the ICP, producing amore stable Fe ion signal (0.7% vs. 1.5% RSE for56Fe in a forty-cycle single analysis), constantinstrumental mass bias and thus a more precisemeasurement.
Les influences de la g�eom�etrie de la cellule d’ablation(cellule «Frames» et deux volume «HelEx») et de lalongueur d’onde laser (198 et 266 nm) sur les a�erosolsproduits par ablation laser femtoseconde (fs-LA) ont �et�e�evalu�ees. La morphologie, la distribution en masse de fer(IMD) et les rapports 56Fe/54Fe des particules g�en�er�ees �apartir de magn�etite, pyrite, h�ematite et sid�erite ont �et�e�etudi�es. Deux morphologies sont identifi�ees : sph�erules(10–200 nm) et agglom�erats (5–10 nm). Les similarit�esentre IMD et taux d’ablation �a 198 et 266 nm sugg�erentdes m�ecanismes d’ablation inchang�es. Le rapport56Fe/54Fe augmente avec le diam�etre a�erodynamiquedes particules en r�eponse �a un fractionnement cin�etiqueau cours de l’expansion du plasma induit, du refroidiss-ement et de la condensation de l’a�erosol. La cellule HelExproduit des particules fines qui montrent une plus grandevariation du rapport 56Fe/54Fe (1.85‰) que les parti-cules form�ees �a partir de la cellule Frames (1.16‰) maisla composition totale est identique �a celle du substratpour les deux cellules, d�emontrant un �echantillonnagesto�echiom�etrique. Les diff�erences d’IMD r�esultent d’uneextraction plus rapide avec la cellule HelEx, laissantmoins de temps pour l’agglom�eration de petites parti-cules (d56Fe faible) avec de plus larges (d56Fe haut) dansla cellule. Meme avec une dur�ee d’ablation plus courte,une intensit�e de signal moiti�e moindre, et un volumeablat�e deux fois plus petit, la cellule HelEx produit desanalyses isotopiques du fer dans la magn�etite aussipr�ecises qu’avec la cellule Frames, meme si cette derni�ereest �equip�ee d’un syst�eme d’homog�en�eisation des a�ero-sols. La cellule HelEx produit un flux plus constant departicules plus petites vers l’ICP, induisant un signal plusstable sur le fer (0.7% contre 1.5% RSE sur 56Fe au cours
d’une analyse de quarante cycles), un biais d’instrumen-tation constant et donc une mesure plus pr�ecise.
Mots-clés : ablation laser femtoseconde, a�erosols, isotopes,l’agglom�eration, temps de r�esidence.Received 18 Aug 13 – Accepted 26 Apr 14
Laser ablation-inductively coupled plasma-mass spec-trometry (LA-ICP-MS) has been an in situ analytical techniqueused successfully for the analysis of geological specimens formore than three decades (Gray 1985, Arrowsmith 1987,Niemax 2001, G€unther and Hattendorf 2005, Koch andG€unther 2011). Increasingly, LA-ICP-MS is being utilised forisotope ratio determination (Hirata and Ohno 2001, Wood-head et al. 2004, Horn et al. 2006a, b, Chmeleff et al. 2008,Shaheen and Fryer 2010, Yang et al. 2010, Fisher et al.2011, Pettke et al. 2012). Although high-precision isotoperatio determinations can be achieved for nanosecond (ns)lasers (Fisher et al. 2011, Pettke et al. 2012 Beltran-Trivinoet al. 2013), overall head-to-head comparisons of ns and fsLA systems show that fs-LA produces more stable ion signals(Poitrasson et al. 2003, Mozna et al. 2006, Gonzalez et al.2007a, b, Perdian et al. 2008, Shaheen et al. 2013), andmuch less dependency on optical and thermal absorption forall types of substrates compared with ps/ns-LA (Gonzalezet al. 2002, Laville et al. 2002, Guillong et al. 2003, Bekeet al. 2010). These differences are a result of distinct laser/matter interactions and ablation mechanisms with the incidentphoton beam. These interactions are thermally driven in thenanosecond regime, whereas femtosecond pulses are shorterthan any thermal or physical response from the target (Lorazoet al. 2003), leading to photo mechanical ablation that is freeof thermal effects for the substrate (von der Linde andSokolowski-Tinten 2000, Seydoux-Guillaume et al. 2010).These properties result in negligible residual thermal traces(Perez and Lewis 2003, Ben-Yakar et al. 2007, Seydoux-Guillaume et al. 2010, d’Abzac et al. 2012a, b, Shaheenet al. 2013). This interpretation is confirmed by consistency inmorphologies and particle size distributions of the aerosolparticles over a wide range of materials when usingfemtosecond pulses. In contrast, nanosecond ablation tendsto produce generally larger particles, including a substantialamount of melt ejection product, especially if the substrate is asemiconductor or conductor (Koch et al.2004, Liu et al.2004,Gonzalez et al. 2007a, b, Shaheen et al. 2013).
The differences in the response of substrates that areconductors or semiconductors to ns- and fs-pulsewidth lasershas made fs-LA a natural choice for Fe isotope determina-tions in iron oxides, iron sulfides, iron carbonates and
metals (Hirata and Ohno 2001, Horn et al. 2006a, b,Steinhoefel et al. 2009, Nishizawa et al. 2010, Yoshiyaet al. 2012, Czaja et al. 2013, Dziony et al. 2013, Li et al.2013); attainment of comparable data using ns-LA hasproven to be analytically challenging (Ko�sler et al. 2005a, b,Ko�sler et al. 2006, Horn et al. 2006a, b). To better addresshow to produce the most precise and accurate Fe isotopedetermination by fs-LA at the highest spatial resolution wereport LA-generated aerosol properties, including theirmorphology, aerodynamic size and the Fe isotope compo-sition of size-sorted particles. These parameters directly affection signal stability (d’Abzac et al. 2011), where poor controlof these parameters can result in poor precision, a decreasein spatial resolution and induce issues in transport of theaerosol from the ablation cell to the ICP torch thatcompromise precision and accuracy.
Several approaches have been proposed for optimisationof aerosol generation and transport. Shortening transportdistances is the simplest solution to reduce losses and gainsignal intensity (d’Abzac et al. 2011). Using He as the carriergas helps to produce finer aerosols and less thermal residueon the sample surface, due to its low viscosity and highthermal conductivity, compared with Ar (Horn and G€unther2003). Overall, investigations of the transport of the ablatedmaterial from the cell to the ICP torch show that the aerosoltransport is generally efficient to over 80% (Garcia et al.2007) unless the overall tubing length is greater than 4 m(d’Abzac et al. 2011). However, heterogeneous aerosol fluxescan be produced by creation of complex aerosol flow patternswithin the transport tubing if gas velocities are not optimised(Koch et al. 2008), if tubing of multiple diameters is used, or ifadditional tube connections are used (Autrique et al. 2008).
In contrast, numerous studies have shown that ablationcell design is a critical parameter that directly influences thewash-out time of a cell (Garcia et al. 2007, Gurevich andHergenr€oder 2007, Lindner et al. 2009). A cell wash-outtime is generally defined as the time it takes for the ion signalto drop to ~ 99% of the ion intensity after the laser hasstopped firing (Asogan et al. 2011). Common cell designsinclude cylindrical-, hexagonal- or droplet-shaped cells.These shapes are used because of their simple geometry,
which makes them easy to build, and their often largevolume allows one to load several samples at a time. Thewash-out time in these cells is usually longer than 1 s. It canbe shortened by using a smaller cell but this limits samplecapacity. In addition to cell shape, numerical simulationshave shown that gas flow patterns within a cell can changeas a function of gas velocity entering the ablation cell. Forexample, if the gas flow is insufficient in a cylindrical cell,aerosol flux can form vortices, whereas at higher gasvelocities the aerosol stream may be more homogenised,but undesirable effects such as unstable signals, high gasconsumption and cell overpressure can be produced (Kochet al. 2008). Recognition of these issues in the extraction ofthe aerosol from the cell highlights that establishing the bestgas flow conditions in the cell is an important tuningparameter for LA analyses and has lead to a number ofproposed designs to make aerosol extraction from the cellas efficient as possible (Pisonero et al. 2006, Hirata 2007,Autrique et al. 2008, Muller et al. 2009, Fricker et al. 2011).Among these, the two-volume geometry (Eggins et al. 2005,Muller et al. 2009) provides a large volume that housesseveral samples, and a smaller inner cell wherein LA-generatedparticles are confined. Gas flows from the top and the bottomof the inner cell allow for efficient and fast extraction of particles.Wash-out times are in this case shorter than 1 s.
The present study characterises the aerosol produced byfs-LA using two different laser wavelengths (198 nm and266 nm) and two cells of different design: a single volumeand a two-volume cell, in order to better understand theimpact of short ultraviolet wavelength and cell geometry onprecision of Fe isotope ratio analyses that preserve naturallyoccurring, mass-dependent variations. For this purpose, wecollected the aerosols produced by fs-LA of Fe-bearingminerals to determine their iron mass distribution, to evalu-ate whether the ablation mechanism is isotopically stoichi-ometric, and if there is a correlation between Fe isotopecomposition and the aerodynamic size of the aerosols. Weuse these fundamental studies of the aerosols extracted fromthe two different ablation cells to evaluate our observationthat it is possible to determine Fe isotope ratios by theablation of magnetite to the same precision, in less time andconsuming half of the volume of material if the HelEx cell isused (Li et al. 2013), compared with the Frames cell (Czajaet al. 2013) using the same laser and mass spectrometer.
Experimental methods
Laser systems and ablation cells
Two laser configurations were used, both distributed byPhoton Machines (San Diego, CA, USA). The first system used
a flash lamp-based Nd/YAG pumped Ti/sapphire femto-second source and a chirped pulse amplification device witha fourth harmonic generator to produce a UV beam withk = 198 nm and a pulse width of ~ 150 fs, where therepetition rate was adjustable from 1 to 10 Hz. The secondsystem used a diode-based Nd/YLF-pumped Ti/sapphirefemtosecond source and a chirped pulse amplificationdevice with a third harmonic generator to produce a UVbeam with k = 266 nm and a pulse width of ~ 150 fs, witha repetition rate adjustable between 1 to 250 Hz. The laserbeam delivery system from the harmonic generator to thesample for both lasers was the same (see Appendix S1).Two laser ablation cells manufactured by Photon Machineswere studied. The ‘Frames’ cell, used for tests at k = 198 nmand 266 nm, is a droplet-shaped, single-volume design(~ 20 cm3) that is intended to provide laminar-flow condi-tions over the entire sample substrate and has a character-istic aerosol wash-out time of 2 s (1% of ion intensity). The‘HelEx’ cell was used with the 266 nm laser and is atwo-volume cell, wherein samples are contained in alarge volume (~ 900 cm3) under Helium atmosphere at~ 105 Pa, and ablation takes place within a small innervolume cell (~ 7 cm3; Shuttleworth 2012) that has asecondary He flow directed in a spiral downward onto thesubstrate. The dual He flow from the bottom and top of theinner volume rapidly extracts the aerosol from the small innervolume. The HelEx has a characteristic wash-out time of< 0.7 s (1% of ion intensity).
Aerosol collection
Aerosol collection methods for the two cells were done tomake the collection as similar as possible to allow one toevaluate the physical characteristics of the aerosols as afunction of ablation cell properties. The tubing length fromthe cell outlet to the aerosol collection apparatus was thesame (~ 0.5 m). Additionally, the He gas flow conditions intothe cell for aerosol extraction are based on values that aretypically used for producing stable ion signal by ICP analysis.Aerosol particles generated by fs-LA of natural magnetite,haematite, siderite and pyrite were aerodynamically sizesorted using a Micro Orifice Uniform Diameter Impactor(MOUDI; Marple et al. 1991). The MOUDI consists of twelvejuxtaposed stages mounted together as a hermeticallyclosed cylinder: the ‘inlet’, ten consecutive plates, and the‘after filter’ stage. The size sorting is passively achieved bypressure differences between the successive stages, from thetop to the bottom of the column, which affect the velocities ofparticles, where impacts on each stage occur according toparticle kinetic energy. Consequently, the particles with thelargest aerodynamic diameters are impacted on the first(top) stages, and the smallest aerodynamic diameters on the
last (bottom). Particles losses with this device remain under5% for particles smaller than ~ 10 lm (Marple et al. 1991).
It is difficult to relate aerodynamic diameter (da) directlyto that of a particle’s diameter because da represents thediameter of a sphere with a density that settles at the samevelocity as the particle of interest (DeCarlo et al. 2004).Particles produced by fs-LA include complex-shapedagglomerates and spherules that have complimentarychemical compositions (Liu et al. 2004, Gonzalez et al.2007a, b, Glaus et al. 2010, d’Abzac et al. 2012a, b).These complex shapes and variable compositions make itchallenging to assign shape factors and densities to particlesand thus to calculate a particle diameter from its aerody-namic diameter reliably. Instead it is better to evaluate thetrue diameter of particles through microscopy, as shownbelow.
Prior to every experiment, total gas flow rate to theimpactor was adjusted to 30 l min-1 using a calibratedorifice and magnehelic gauge to measure pressure drop.Gas flowed from the ablation cell to the MOUDI via a~ 0.5 m aluminium tube and consisted of the 99.999%purity He carrier gas (1 l min-1 with the Frames cell and~ 0.6–0.8 l min-1 equally split between the two mass flowcontrollers, with the HelEx cell) that transported the ablatedparticles from the ablation cell. This flow was augmentedusing a rotometer-controlled complementary flow of Ar orN2 (~ 29.4 l min-1; depending on availability) that wasfiltered through a 0.2-lm HEPA filter and added using a ‘T’connector before the impactor inlet. No difference eitherin apparatus settings or observed results were noticedbetween Ar and N2. Pressure differences between the stageswere continuously monitored using a magnehelic gauge toensure that the cascade impactor operated with the correct(30 l min-1) total gas flow.
Aerosols were impacted on filters to determine therelative size distribution and Fe isotope composition ofdifferent sized particles (Teflon filter collection) and toevaluate their morphology and size by scanning electronmicroscopy (SEM; Polycarbonate filter collection). A total ofnineteen experiments were conducted (Table 1). Some ofthese experiments, marked with an asterisk in Table 1, arealso used in d’Abzac et al. (2013) to discuss Fe isotopicfractionation during particle generation. Particles weregenerated by ablating rectangular areas of several104 lm2 (raster mode) using a laser beam with a diameterof 12 lm on the sample surface, with a maximum of fourpasses in order to collect enough iron with a constantaerosol flux. Rastering was accomplished by using acomputer-controlled stage to move substrate mineral grains
embedded in epoxy and polished to within 0.05 lm.Parameters such as laser fluence and repetition rate werevaried during the first seven experiments (Table 1) in order toevaluate how these parameters affected the aerodynamicsize of the fs-LA-generated aerosols. We also evaluated theinfluence of laser wavelength using similar fluence and laserrepetition rates. The bulk of the aerosol collections was doneusing a 25 Hz repetition rate, a raster speed of 2 lm s-1,and a fluence of ~ 0.9 J cm-2 which is the fluence used forfs-LA Fe isotope determination. These same parameters wereused to evaluate how the mineral substrate may affect theproduced aerosol.
Scanning electron microscopy
The morphology of particles produced by fs-LA has beenevaluated using microscopic methods by a number ofworkers using a wide variety fs lasers, ablation cells andcollection methods (Liu et al. 2004, Gonzalez et al. 2007a,b, Glaus et al. 2010, d’Abzac et al. 2012a, b). Theseworkers all report similar findings: particles generated byfs-LA consist of small (< 1 lm diameter) spherules andcomplex-shaped agglomerates composed of spheres thatare ~ 5–10 nm in diameter. Thus, we have limited ourimpactor studies to using aerosols collected from ablationexperiments done in the HelEx cell. Particles collected onpolycarbonate substrates from ablation of siderite, pyrite andmagnetite were studied at the Material Sciences Center atthe University of Wisconsin, Madison. We used a ScanningElectron Microscope (LEO 1530; Zeiss-Leica, Switzerland/Germany) equipped with a field-emission gun (FEG),operated at 3 keV with a resolution of ~ 3 nm.
Iron mass distribution analysis
The iron mass distribution (IMD) as a function ofaerodynamic size was determined by measuring the Fecontent on each MOUDI filter stage. For short-durationexperiments, in which less than ~ 10 lg of Fe werecollected, the Fe content of each MOUDI stage wasmeasured using isotope dilution mass spectrometry (IDMS)using an enriched 57Fe tracer (see Appendix S1). In contrast,for longer duration experiments, in which the goal was toalso measure the Fe isotope composition of the differentsized aerosols, the Fe content was determined colorimetri-cally using the Ferrozine method (Stookey 1970). For bothmethods, the Fe from each Teflon filter was dissolved byplacing the filter in a 60 ml Savillex jar, followed by additionof mineral acid and then capping and heating the jar on ahot plate at ~ 175 °C for 12 hr. For IDMS, 7 mol l-1 HNO3
with a dissolved 57Fe tracer it was used. For the Ferrozineanalysis, 7 mol l-1 HCl was used to dissolve the Fe particles
because these samples were also purified by ion-exchangechromatography for Fe isotope determination (see below).
Iron isotopes ratio determination by solutionnebulisation
Size-sorted aerosol samples for complete Fe isotopedetermination were dissolved in 7 mol l-1 HCl. Followingdissolution, each sample was evaporated on a hot plate,and re-dissolved in 0.5 mol l-1 HCl, from which a smallaliquot was taken for the determination of total Fe contentusing Ferrozine and hydroxylamine hydrochloride. Theremainder of the fraction was loaded onto AG 1X4 anion-exchange resin to separate Fe from other cations usingconventional wet-chemistry methods, following thosereported in Beard et al. (2003). The accuracy of Fe isotopesanalyses for these low-level samples was evaluated bypreparing test solutions that contained between 0.5 to10 lg of Fe from a standard solution that had beenpreviously measured for its Fe isotope composition byconventional methods; this solution was spiked with otherelements to mimic the elemental composition of the mineralsubstrates. These test solutions were processed through theentire wet chemistry analytical procedure in the same fashionas unknown samples to evaluate possible matrix effects (seeAppendix S1). Following anion exchange purification, sam-ples and test solutions were analysed using conventionalsolution nebulisation techniques on a Micromass Isoprobe atthe University of Wisconsin, Madison, following the methodsof Beard et al. (2003), at a concentration of 0.6 lg ml-1
using a self-aspirating, concentric-flow nebuliser with anuptake rate of 50 ll min-1 and a desolvation unit (CetacAridus II). Acquisitions included one minute integration forblank acid subtraction, followed by forty integrations of 10 scycles of the analyte. Iron isotope compositions areexpressed as d values in units of per mil (‰):
d56Fe ¼56Fe=54Fesample
56Fe=54FeIgRxs- 1
" #� 103 ð1Þ
d57Fe ¼57Fe=54Fesample
57Fe=54FeIgRxs- 1
" #� 103 ð2Þ
d57=56Fe ¼57Fe=56Fesample
57Fe=56FeIgRxs- 1
" #� 103 ð3Þ
During the course of this study, the IRMM-014 referencematerial yielded an average d56Fe = -0.08 ± 0.10‰(2s, n = 36) relative to igneous rocks (Beard and Johnson
1999), a value that has remained unchanged since ourinitial report in Beard et al. (2003). Replicate analysesof our in-house reference materials J-M Fe and HPSFe yielded d56Fe = 0.25 ± 0.10‰ (2s, n = 48) andd56Fe = 0.48 ± 0.10‰ (2s, n = 69), respectively. The testsolutions made of pure Fe with no other matrix elementsyielded results accurate to 0.16‰ (2s). In contrast, Fesolutions that mimicked the chemical composition of thenatural minerals or the dissolved minerals themselves wereaccurate if 2 lg or more Fe were processed through the ion-exchange columns (Figure SA1). Smaller aliquots wereinaccurate by up to 0.48‰ (Figure SA1). We suspect thatinaccuracies for Fe masses < 2 lg are a result of matrixeffects caused by the presence of trace quantities of othercations (e.g., Albar�ede and Beard 2004), because the pureFe solutions do not display accuracy issues (Figure SA1).Based on the results of the test solutions, only Fe isotopedeterminations by wet chemistry of samples that are greaterthan 2 lg of Fe in size are considered accurate. Thus, wecombined a sequence of MOUDI stages to make compositesamples that were greater than 2 lg of Fe to achieveaccurate Fe isotope compositions. Based on replicateanalyses of our test solutions, the precision of our wetchemistry Fe isotope analyses was estimated to be ± 0.15‰(2s) for samples with 2–5 lg of Fe and ± 0.10‰ (2s) forsamples with more than 5 lg of Fe, and these uncertaintiesare used for discussion of the Fe isotope compositionsmeasured on the aerodynamic size-sorted particles.
Magnetite Fe isotope determination by fs-LA
Femtosecond-LA-MC-ICP-MS analyses of magnetite ref-erence materials presented in this study were conductedduring campaigns to measure the Fe isotope composition ofmagnetite from banded iron formations that were publishedrecently by Czaja et al. (2013) and Li et al. (2013). Thesedata sets are relevant to the present discussion because theyrepresent a large number of Fe isotope analyses acquiredover the course of several months, under routine conditions,and at the same time period during which the aerosolparticle studies were performed. We emphasise that for theentire data set of Li et al. (2013), and a large portion of thedata set of Czaja et al. (2013), the same 266 nmfemtosecond pulse width laser was used. Moreover, forboth studies, the same mass spectrometer was used(Micromass IsoProbe), and it was operated under the sameconditions for both studies (Table SA1). For the purposes ofthis discussion, we only consider magnetite analysesreported by Czaja et al. (2013) that used the 266 nmlaser with the analytical details reported in Table SA1,which represents sixty-one analyses of reference materialmineral grains.
The major difference between these studies is that forthat which used the Frames cell (Czaja et al. 2013), theanalysis was longer (sixty integrations of 5 s) and was doneat a higher 56Fe ion current (15 9 10-11–21 9 10-11 Ausing a 1010 Ω resistor) compared with the study of Li et al.(2013), which used the HelEx cell (forty integrations of 5 s)with a 56Fe ion current of 7.3 9 10-11–14.3 9 10-11 A(using the same resistor). Interestingly, both studies producedthe same in-run statistics defined as the 2 standard error(2SE), which was calculated as the standard deviation (2s)from a single analysis normalised by the square root of thenumber of accepted ratios. The same error minimisationroutine was used for all the analyses (Micromass IsoLynxsoftware error minimisation algorithm, with rejection level setto 15% of the total number of cycles, based on one standarddeviation of the mean for each analysis). The differences inion intensity reflect the fact that for the Frames cell the laserrepetition rate was 10 Hz whereas it was 5 Hz for the HelExcell. The other significant difference between the datacollected with the Frames cell from that of the HelEx was thata mixing chamber was placed before the ICP in order tohomogenise the aerosol flux. Without the mixing chamber, itwas difficult to obtain the same level of measurementrepeatability for a Fe isotope ratio determination comparedwith an analysis performed without the mixing chamber. Wealso note that the reproducibility for both data sets was thesame, where the reproducibility is defined as 2 standarddeviation (2s) of the mean for multiple analyses of areference material mineral grain that is considered isotopi-cally homogeneous. Reference materials were considered tobe isotopically homogeneous if conventional solution neb-ulisation Fe isotope determination (wet chemistry methods) ofmultiple single grains of the magnetite reference materialyielded the same reproducibility as our analyses of Fereference solutions such as IRMM-014.
Differences in the repetition rate and analysis time led toablation of different volumes of material. For the HelEx cell, atotal calculated volume of ~ 8640 lm3 was ablated. Forthe Frames cell, a total volume of ~ 18000 lm3 wasablated. These volumes are based on the areal extent ofablated material as measured using scanning electronmicroscopy. The depth was determined based on white-lightinterferometry imaging (see Appendix S1 for details).
Results
Particle morphologies
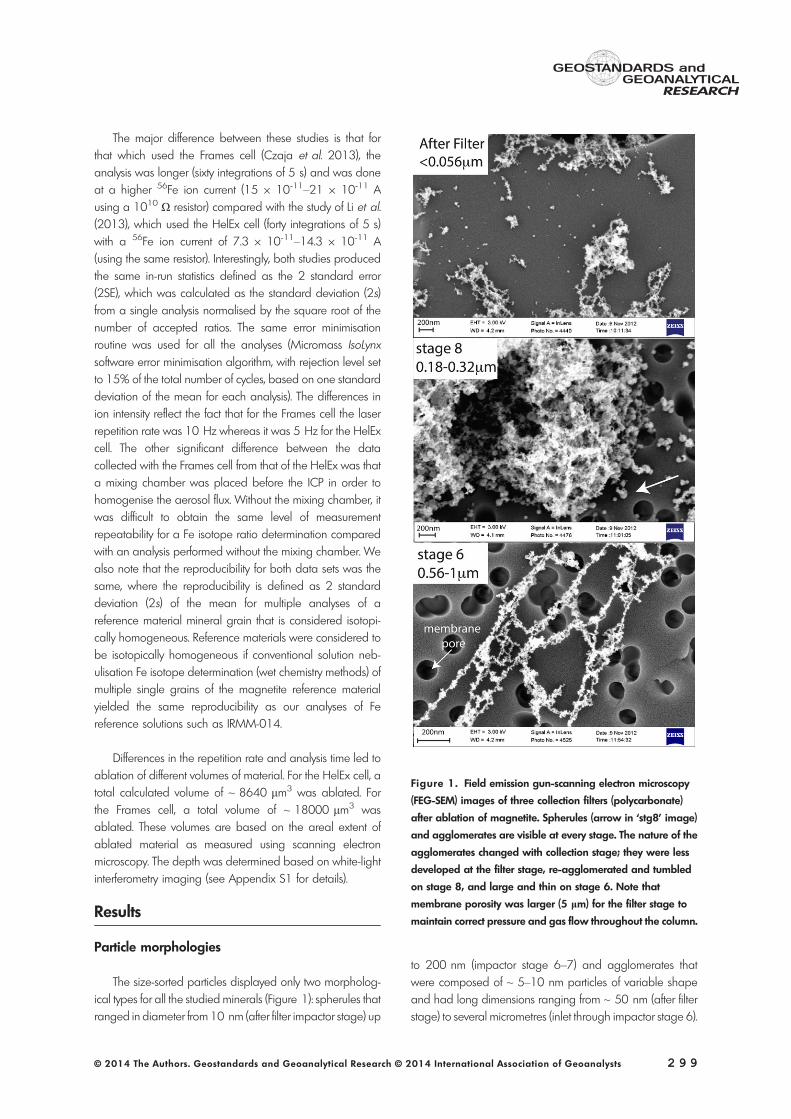
The size-sorted particles displayed only two morpholog-ical types for all the studied minerals (Figure 1): spherules thatranged in diameter from 10 nm (after filter impactor stage) up
to 200 nm (impactor stage 6–7) and agglomerates thatwere composed of ~ 5–10 nm particles of variable shapeand had long dimensions ranging from ~ 50 nm (after filterstage) to several micrometres (inlet through impactor stage 6).
Figure 1. Field emission gun-scanning electron microscopy
(FEG-SEM) images of three collection filters (polycarbonate)
after ablation of magnetite. Spherules (arrow in ‘stg8’ image)
and agglomerates are visible at every stage. The nature of the
agglomerates changed with collection stage; they were less
developed at the filter stage, re-agglomerated and tumbled
on stage 8, and large and thin on stage 6. Note that
membrane porosity was larger (5 lm) for the filter stage to
maintain correct pressure and gas flow throughout the column.
The agglomerates sometimes contain spherules [Figure 1,see also d’Abzac et al. (2013)], suggesting that agglomer-ation occurred before impaction on the substrate. Agglom-erate size is difficult to determine because most of theagglomerates are observed as accumulations of particles onthe substrates (impactor stages 7 to after filter), making itdifficult to evaluate whether some particles agglomerated orbroke apart during impaction. Sizes given here are estimatedfrom isolated bodies that were imaged and do not containevidence of breaking or accumulation.
Iron mass distribution
Iron mass distribution (IMD) graphs of the relative massesof Fe as a function of aerodynamic size are plotted inFigure 2 and numerical data are available in Table 1. InFigure 2a, the IMD of particles from fs-LA of magnetite in theFrames cell under different fluences and repetition rates areshown. The IMD profile was the same over the exploredrange of settings. Figure 2b shows that there was no effect onIMD as a function of changes in laser wavelength (198 and266 nm) or nature of the substrate (magnetite, pyrite orhaematite). The IMD was mono-modal, centred onda = 0.18 lm. The IMD of aerosols produced in the HelExcell for magnetite, siderite and pyrite were similar to oneanother, although distinct compared with the IMD producedin the Frames cell. It was bimodal, with a main peak atda = 0.14 lm (35% of the Fe), and a secondary peak atda < 0.015 lm representing ~ 20% of the total mass ofFe collected. With the HelEx cell, more than 60% of thetotal mass of Fe was contained in particles smaller thanda = 0.14 lm, whereas only ~ 30% lay in this size rangewith the Frames cell.
Fe isotope composition of size-sorted aerosolsderived from magnetite
There was a positive correlation between aerodynamicsize of impactor-sorted aerosols and their Fe isotope compo-sition (Figure 3, Table 2). Experiments performed with theFrames cell showed that the correlation between aerody-namic size-sorted aerosols and their Fe isotope compositionwas similar for experiments done with a laser wavelength of198 nm (exp 110408, Table 2) and an experiment doneusing 266 nm (exp 120508, Table 2). The total range ind56Fe values within an experiment varied from 0.65 to 1.16‰(Table 2). The Fe isotope composition of size-sorted aerosolscollected using the HelEx cell showed the same trend ofincreasing 56Fe/54Fe ratios with aerodynamic size. The onlysignificant difference is that the spread in d56Fe values waslarger for the HelEx cell (1.85‰; Table 2). Importantly, thecalculated mass-balance d56Fe value for the bulk aerosol,
based on the mass-weighted aerosols sizes (Table 2),matched that of the ablated substrate as determined byconventional wet chemical analysis (d56Fe = + 0.32 ± 0.05‰;d’Abzac et al. 2013). This highlights the critical conclusion thatalthough there are differences in the Fe isotope compositionsof different aerodynamically size-sorted particles, the bulkaerosol matches the bulk substrate and thus demonstrates thatfs-LA stoichiometrically samples the substrate (d’Abzac et al.2013).
Precision of Fe isotope determinationof magnetite by fs-LA
The precision of a single Fe isotope determination and thereproducibility of multiple analyses of magnetite referencematerial mineral grains attainable with both Frames andHelEx cells were comparable (Figure 4), but there aresignificant differences in the way this performance wasachieved (Table SA1). Analysis of magnetite using the Framescell required use of a mixing chamber on the transport line toproduce amore stable Fe ion signal, and these analyses wereconducted over 60 9 5 s on-peak integrations (i.e., 300 s ofablation), typically sampling a volume of ~ 18000 lm3.These conditions routinely produced a 2SE of ± 0.12‰ ind56Fe and a measurement reproducibility of ± 0.24‰ ind56Fe (2s), based on n = 61 analyses of magnetite referencematerial grains analysed during ten different analyticalsessions over the course of 2 months (Czaja et al. 2013;Figure 4a). Experiments done using the Frames cell showedthat if shorter integration times were used, or significantlysmaller volumes were ablated (e.g., more than 30% smaller),the overall performance for Fe isotope ratio determinationbecame poorer. In contrast, no mixing chamber was neededwith the HelEx cell, and Fe isotope analyses were based onthe average of forty 5 s on-peak integrations (i.e., 200 s ofablation), typically only sampling a volume of ~ 8640 lm3.These conditions routinely produced a measurement repeat-ability value (2SE) of ± 0.11‰ in d56Fe and a measurementreproducibility of ± 0.20‰ in d56Fe (2s), based on n = 115analyses of magnetite reference material grains analysedduring ten different analytical sessions over the course of5 months (Li et al. 2013; Figure 4b). Overall stability of thetwo cells can be quantified based on the stability of themeasured 56Fe ion intensity. For example, the relativestandard error (1 RSE) for the 56Fe ion intensity for a singledetermination if forty cycles are included was typically 1.52%for the Frames cell equipped with a mixing chamber and0.69% for the HelEx cell.
Discussion
The study of particle characteristics and their depen-dency on laser wavelength and ablation cell geometryrequires a careful comparison that must be validated bydiscarding any influence of secondary parameters. The datareported for the Frames cell with various fluences, repetitionrates, and using different mineral substrates allow thisvalidation, where, for example, the IMD was unchangedover a large range of fluences (~ 1–4 J cm-2), repetitionrates of 5 and 10 Hz (Figure 2a), and different minerals,including magnetite, pyrite and haematite (Figure 2b). The
-0.6 -0.4 -0.2
0 0.2 0.4 0.6 0.8
1 1.2 1.4
0.01 0.1 1 10 100
56Fe
da (μm)
Magnetite, Frames cell ( =198nm)
-0.6 -0.4 -0.2
0 0.2 0.4 0.6 0.8
1 1.2 1.4
0.01 0.1 1 10 100
56Fe
da (μm)
Magnetite, Frames cell ( =266nm)
-0.6 -0.4 -0.2
0 0.2 0.4 0.6 0.8
1 1.2 1.4
0.01 0.1 1 10 100
56Fe
da (μm)
Magnetite, HelEx cell
a
b
c
Figure 3. Iron isotope compositions of the size-sorted
aerosols collected from ablation of magnetite using the
Frames cell (a: experiment 110418 at 198 nm and b:
experiment 120508 at 266 nm) and the HelEx cell (c:
experiment 120726 at 266 nm), determined by con-
ventional solution-nebulisation Fe isotope determina-
tion of collected aerosols to eliminate post-ablation
mass biases. The d56Fe values are reported relative to
the average of igneous rocks (Beard et al. 2003), and
the bulk-sample Fe isotope composition is shown by
the solid line (d56Fe = 0.32 ± 0.05‰, 2s) determined
using the average Fe isotope composition of eight
analyses of individual magnetite grains analysed
using conventional solution nebulisation. Note that
there is a larger range of d56Fe values observed with
the HelEx cell (~ 2‰) (c) compared with the Frames cell
(0.8‰) (a, b), which is interpreted to reflect
agglomeration of particles with variable Fe isotope
compositions in the Frames cell resulting in a muted
range in size sorted Fe isotope compositions. Data from
reason for the consistent IMD is thought to result from theshort pulse width of fs laser. For example, fs-LA induces onlyminor thermal ablation (Perez and Lewis 2003, Ben-Yakaret al. 2007, Seydoux-Guillaume et al. 2010, d’Abzac et al.2012a, b), which avoids production of large particles(> 1 lm) through ejection of melt (Koch et al. 2004,Hergenr€oder 2006b, Shaheen et al. 2013). Second, parti-cles produced by fs-LA are generated within the laserplasma plume induced by matter breakdown (von der Lindeand Sch€uler 1996), following a pattern of condensation,coalescence, and agglomeration (Hergenr€oder 2006a,Gonzalez et al. 2007a, b, d’Abzac et al. 2012a, b) that isindependent of the ablated substrate and producessystematic morphologies of spherules and agglomerates(Figure 1; Gonzalez et al. 2007a, b, Glaus et al. 2010,
d’Abzac et al. 2012a, b, 2013). In contrast, it has beenshown that ns pulse width lasers produce variable particlesize distributions depending on whether the substrate is aconductor and thus prone to significant thermal heatingduring lasing or an insulator, which is much more resistant toablation heating (Gonzalez et al. 2007a, b).
A second unique feature of fs-LA is that there are noapparent differences in the ablation of substrates as afunction of wavelength. For example, the IMD of magnetiteshows that results obtained at 198 and 266 nm are thesame (Figure 2, Table 1). Moreover, the ablation rate,defined as total mass of Fe collected with the MOUDI,divided by the total number of laser shots, is the same at198 nm and 266 nm for a given fluence. For example,
0.00
0.10
0.20
0.30
0.40
0.50
0.60
0.70
0 20 40 60 80 100 120 Analysis number
0.00
0.10
0.20
0.30
0.40
0.50
0.60
0 10 20 30 40 50 60 70
δ56Fe
(a) Czaja et al. (2013)
(b) Li et al. (2013)
0.31 ± 0.24‰
0.34 ± 0.20‰
δ56Fe
0.70
Figure 4. Fe isotope determination in a magnetite mineral reference material (Biwabik Iron Formation, MN, USA)
made using the Frames and HelEx cells. The data from the Frames cell (a) is a subset of the data reported by Czaja
et al. (2013) (n = 61) consisting of analyses made using the 266 nm laser collected under the conditions reported in
Table EA1. Data for the HelEx cell (b) are from Li et al. (2013) (n = 115) and were collected using the methods
reported in Table EA1. The range bars represent the 2SE in-run statistics of a single analysis. The dashed line marks
the average value. The reference value, determined by multiple solution nebulisation analyses on eight mineral
grains was d56Fe = 0.32 ± 0.05‰. Values indicated on the right-hand side are the average and measurement
reproducibility of each data set. These values were similar from one cell to the other, but the sample volume used for
analysis using the HelEx cell (b) was ~ 2 times smaller.
experiment 110414 was conducted with the 198 nm fslaser where the ablation rate was 16 pg of Fe per laser shotat a fluence of ~ 1 J cm-2, whereas experiment 110603was done with the 266 nm fs laser, using an ablation rate of19 pg of Fe per laser shot at a fluence of ~ 1 J cm-2
(Table 1). The similarity in IMD and ablation rate at 198 and266 nm indicates similar ablation mechanisms, which is aresult of the fact that the laser energy lost via opticaltransmission through the sample (wavelength dependent) isnegligible with femtosecond pulses; this reflects the very highphoton flux that saturates the irradiated surface and inducesmulti-photon absorption and avalanche ionisation processes(Du et al. 1994, von der Linde and Sch€uler 1996). Anextreme case was studied by Courtieu et al. (2011), whoperformed fs-LA of quartz at 800 nm and reported anablation rate similar to that observed with opaque minerals.Hence, the ablation process does not change with wave-length and aerosols are always produced in the samefashion, and this is confirmed by the similar range in Feisotope composition of the size-sorted particles producedin the Frames cell using the two different wavelengths(Figure 3, Table 2).
Cell geometry and aerosols properties
All our data show that the cell geometry and, mostprobably, the wash-out time induced substantial changes inlaser-induced aerosol properties (Figures 2 and 3). We notethat for a subset of the experiments done with magnetite, thesame laser (266 nm) was used and operated at the samefluence and repetition rate for both the Frames and HelExcells (e.g., Experiments 120503, 120508, 120726;Table 1). Moreover, the path of the particles from the exitof the cell to the impactor was the same and thus weinterpret differences in the IMD between the two cells toreflect processes that occurred in the ablation cell. Wetherefore conclude that the fact that the IMD from the Framescell contains a smaller mass of small aerodynamic-sizedparticles is a result of particle agglomeration within the cell.Agglomeration depends on a particle’s probability ofcollision with other particles, and because the wash-outtime is longer for the Frames cell the residence time a particlespends in the cell will be longer relative to the HelEx cell,and thus it is more likely to undergo more collisions withother particles.
The differences in the magnitude of Fe isotope compo-sitions as a function of aerodynamic size, for experimentsdone using the HelEx and Frames cell, is consistent with thisagglomeration hypothesis. The larger variations in d56Fevalues for particles generated with the HelEx cell originatefrom kinetic fractionation during plasma expansion and fast
cooling, as discussed in d’Abzac et al. (2013). Becauseparticles in both cells are generated using the same laser,we expect these kinetic isotopic fractionations to be thesame, thus, the smaller range of d56Fe values measured withthe Frames cell (Figure 3a,b) is probably a result of mixing alarger range of isotopic compositions through agglomera-tion of the small, low-d56Fe particles with larger, high-d56Feparticles, resulting in a muted range of Fe isotope compo-sitions. The corollary to this interpretation is that the IMD isrelatively dependent on the wash-out time of the ablationcell. Here, the IMD measured with the HelEx cell might reflectthe most ‘primitive’ size distribution, reflecting little agglom-eration of the primary particles. The ‘original’ size distributionshould reflect the following processes:
(1) Growth inside the laser-induced plasma leads toformation of nanometre-size clusters that furthercoalesce at different levels (Hergenr€oder 2006a);
(2) Agglomeration is initially very limited, because theplasma expands rapidly, pushing particles awayfrom one another;
(3) Spherules are the result of a long coalescenceprocess due to their early condensation (d’Abzacet al. 2012a, b), and maximum sizes reach~ 200 nm; their size distribution does not evolvesignificantly after formation because they tend tobecome more isolated from agglomerates (Figure 1);
(4) Micrometre-size particles are very rare in fs-LA, andlikely reflect agglomeration after plasma cooling orejection from the pit (Hergenr€oder 2006b). The lattermorphology has not been observed in the presentstudy.
From our observations and the above constraints on theprimary IMD, we can propose an interpretation of theevolution of the IMD as a function of the wash-out time ofthe ablation cell (Figure 5). The peak of very small particles(da < 20 nm) that initially formed during plasma expansion(Figure 5, phase 1) is diminished in an ablation cell such asthe HelEx, as this size fraction becomes agglomeratedand creates a main peak around 0.1 < da < 0.18 lm(Figure 5, phase 2). If the wash-out time is longer, as inthe Frames cell, the main peak broadens and shiftstowards da = 0.32 lm (Figure 5, phase 3) because onlyagglomerates of da = 0.1 lm are available for collisions(Hergenr€oder 2006a).
Implications for stable isotope analysis by laserablation MC-ICP-MS
The precision of fs-La analyses of magnetite for a singleFe isotope determination and the reproducibility of multiple
analyses on reference material mineral grains was the samefor analyses conducted using the HelEx and Frames cell.However, there were significant differences in the totalnumber of ions counted using the different ablation cells,where the total 56Fe ion signal and on-peak counting timesfor the Frames cell were, on average, respectively, twice ashigh and 50% longer compared with the HelEx cell. The factthat the precision and measurement reproducibility were thesame is surprising, given the fact that the total number of ionscounted with the Frames cell was greater. We interpret this tobe a result of a more stable ion signal produced by theHelEx cell relative to that produced by the Frames cell. It isimportant to note that a multi-collector mass spectrometerwas used, which should compensate for ion signal instabilityfor the measurement of Fe isotope ratios because itsimultaneously measured 54Fe, 56Fe and 57Fe. We thereforeinfer that the changing ion signal was accompanied bychanging instrumental mass bias (e.g., Albar�ede and Beard2004). Thus, because the instrumental mass bias variedsubtly, longer analysis times were required for Fe isotoperatio measurements for analyses made using the Frames cellcompared with the HelEx cell. We infer that the less stableion signal delivered by the Frames cell was, in part,controlled by agglomeration processes in the cell in whichthe flux of aerosol particles changed because of the longerparticle residence time. Note that we do not believe that thedifferences in total ion counting times that are required to
produce the same precision reflects loss of particles ofdifferent aerodynamic size of variable Fe isotope composi-tion because our Fe isotope determination in pyrite using theFrames and HelEx cells showed the same observation:longer counting times at higher ion intensities were neededto produce the same precision for the Frames cell comparedwith the HelEx cell (Table SA2). This is a noteworthyobservation because the magnitude of Fe isotope fraction-ation as a function of aerodynamic size is strongly depen-dent on substrate. For example, the largest Fe isotopedifference between different aerodynamically sized particlesis for magnetite, followed by siderite and pyrrhotite (d’Abzacet al. 2013). In contrast, the variability in Fe isotopecompositions as a function of aerodynamic size is analyticallynot resolvable for pyrite (d’Abzac et al. 2013), which wouldimply that if any material was lost during transport it wouldnot affect Fe isotope compositions.
Conclusions
The influence of cell geometry and laser wavelength onthe size distribution and Fe isotope composition of size-sorted aerosol particles generated by fs-LA were investigatedto better constrain the requirements for precise Fe isotopedeterminations on as little material as possible using fs-LA-MC-ICP-MS. The Fe mass distribution and the Fe isotopecompositions of the size-sorted particles were independentat the laser wavelengths investigated (198 nm and266 nm) and were not changed as a function of laserrepetition rate (5–25 Hz) or fluence (~ 1 to ~ 4 J cm-2). Weinterpret these results to reflect fundamentally constant laser/matter interactions in the femtosecond regime, independentof the optical absorption properties of the substrate. Wehighlight that this consistency over a wide range of substratesis important for Fe isotope determination because the mostlikely phases to be analysed for Fe isotopes are ironoxides, sulfides, carbonates and metals. These materials aresemiconductors and conductors and are substantiallyheated during ablation if longer pulse length lasers areused. We highlight that the consistency of laser/matterinteraction for these different Fe-bearing substrates is welldisplayed by the fact that similar IMDs of aerosols areproduced by fs-LA.
The ablation cell geometry had a significant influence onthe IMD and on the Fe isotope composition of the size-sortedparticles. This is interpreted to reflect variable agglomerationlevels of generated particles. The two-volume HelEx cellminimised agglomeration of particles through fast aerosolextraction (< 0.7 s), which reduced the amount of time thatthe particles could potentially collide with one another. TheFrames cell had a longer wash-out time (~ 2 s) that
Iron
fract
ion
(%)
Particle size (nm)25 140 250
1 2
3
Figure 5. Interpretative framework proposed for the
evolution of the iron mass distribution (IMD) relative to
particle agglomeration extent. Phase 1 illustrates the
hypothetical IMD immediately after laser plasma
expansion. Phase 2 represents the IMD observed with
the fast wash-out (~ 0.7 s) cell (HelEx) and its low
agglomeration level, which is, in our scenario, the
evolution of Phase 1. Phase 3 shows the long residence
time (~ 2 s) cell (Frames cell) IMD, which is the result of
increased the amount of time that particles could collide withone another, which induced a more variable aerosol flux asshown by the greater ion signal instability compared withanalyses done using the HelEx cell. Despite these differ-ences, optimal conditions can be found for Fe isotopedetermination that produce similar performance in mea-surement repeatability and reproducibility (Czaja et al.2013, Li et al. 2013). Nevertheless, the use of the Framescell requires a mixing chamber and longer ion countingtimes at higher ion intensity compared with the HelEx cell.We interpret these differences to reflect subtle variations ininstrumental mass bias caused by a more variable ion signalproduced from the Frames cell compared with the HelEx cell.The larger ion instability for the Frames cell is inferred to becaused by non-steady-state aerosol delivery as a result ofagglomeration processes within the Frames cell.
Acknowledgements
The authors gratefully acknowledge use of facilities andinstrumentation supported by the NSF-funded University ofWisconsin Materials Research Science and EngineeringCenter (DMR-1121288). This study was funded by NSF andNASA grants to C.M.J. and B.L.B., including funding from theNASA Astrobiology Institute. The anonymous reviewers arethanked for their constructive comments.
References
d’Abzac F.X., Seydoux-Guillaume A.M., Chmeleff J.,Datas L. and Poitrasson F. (2011)Study of near infrared femtosecond laser induced particlesusing transmission electron microscopy and low pressureimpaction: Implications for laser ablation-inductively cou-pled plasma-mass spectrometry analysis of natural mon-azite. Spectrochimica Acta Part B, 66, 671–680.
d’Abzac F.X., Seydoux-Guillaume A.M., Chmeleff J.,Datas L. and Poitrasson F. (2012a)In situ characterization of infrared femtosecond laserablation in geological samples. Part A: The laser induceddamage. Journal of Analytical Atomic Spectrometry, 27,99–107.
d’Abzac F.X., Seydoux-Guillaume A.M., Chmeleff J.,Datas L. and Poitrasson F. (2012b)In situ characterization of infra red femtosecond laserablation in geological samples. Part B: The laser inducedparticles. Journal of Analytical Atomic Spectrometry, 27,108–119.
d’Abzac F.X., Beard B.L., Czaja A.D., Konishi H., SchauerJ.J. and Johnson C.M. (2013)Iron isotope composition of particles produced by UV-femtosecond laser ablation of natural oxides, sulfides andcarbonates. Analytical Chemistry, 85, 11885–11892.
Albar�ede F. and Beard B.L. (2004)Analytical methods for non-traditional isotopes. Reviews inMineralogy and Geochemistry, 55, 113–152.
Arrowsmith P. (1987)Laser ablation of solids for elemental analysis by inductivelycoupled plasma-mass spectrometry. Analytical Chemistry,59, 1437–1444.
Asogan D., Sharp B.L., O’Connor C.J.P., Green D.A. andWilkins J. (2011)Numerical simulations of gas flows through an open,non-contact cell for LA-ICP-MS. Journal of AnalyticalAtomic Spectrometry, 26, 631–634.
Autrique D., Bogaerts A., Lindner H., Garcia C.C. andNiemax K. (2008)Design analysis of a laser ablation cell for inductivelycoupled plasma-mass spectrometry by numerical simula-tion. Spectrochimica Acta Part B, 63, 257–270.
Beard B.L. and Johnson C.M. (1999)High precision iron isotope measurements of terrestrial andlunar materials. Geochimica et Cosmochimica Acta, 63,1653–1660.
Beard B.L., Johnson C.M., Skulan J.M., Nealson K.H., CoxL. and Sun H. (2003)Application of Fe isotopes to tracing the geochemicaland biological cycling of Fe. Chemical Geology, 195,87–117.
Beke S., Sugioka K., Midorikawa K. and Bonse J. (2010)Near-IR femtosecond and VUV nanosecond laser pro-cessing of TeO2 crystals. Proceedings of the SPIE – TheInternational Society for Optical Engineering, 7584,758415 (758410pp.).
Beltran-Trivino A., Winkler W. and Von Quadt A. (2013)Tracing Alpine sediment sources through laser ablationU-Pb dating and Hf-isotopes of detrital zircons. Sedimen-tology, 60, 197–224.
Ben-Yakar A., Harkin A., Ashmore J., Byer R.L. and StoneH.A. (2007)Thermal and fluid processes of a thin melt zone duringfemtosecond laser ablation of glass: The formation of rimsby single laser pulses. Journal of Physics D, 40, 1447–1459.
Chmeleff J., Horn I., Steinhoefel G. and von Blancken-burg F. (2008)In situ determination of precise stable Si isotope ratios byUV-femtosecond laser ablation high-resolution multi-col-lector ICP-MS. Chemical Geology, 249, 155–166.
Courtieu C., D’Abzac F.-X., Chmeleff J., Guillaume D. andSeydoux-Guillaume A.-M. (2011)Performances of 800 nm femtosecond laser ablation onnatural and synthetic quartz. European Journal of Miner-alogy, 23, 391–400.
Czaja A.D., Johnson C.M., Beard B.L., Roden E.E., Li W.and Moorbath S. (2013)Biological Fe oxidation controlled deposition of bandediron formation in the ca. 3770 Ma Isua Supracrustal Belt(West Greenland). Earth and Planetary Science Letters,363, 192–203.
DeCarlo P.F., Slowik J.G., Worsnop D.R., Davidovits P.and Jimenez J.L. (2004)Particle morphology and density characterization by com-bined mobility and aerodynamic diameter measurements.Part 1: Theory. Aerosol Science and Technology, 38,1185–1205.
Du D., Liu X., Korn G., Squier J. and Mourou G. (1994)Laser-induced breakdown by impact ionization in SiO2with pulse widths from 7 ns to 150 fs. Applied PhysicsLetters, 64, 3071–3073.
Dziony W., Horn I., Lattard D., Koepke J., Steinhoefel G.,Schuessler J.A. and Holtz F. (2013)In-situ Fe isotope ratio determination in Fe-Ti oxides andsulfides from drilled gabbros and basalt from the IODPHole 1256D in the eastern equatorial Pacific. ChemicalGeology, 363, 101–113.
Eggins S.M., Grün M., McCulloch M.T., Pike A.W.G.,Chappell J., Kinsley L., Mortimer G., Shelley M.,Murray-Wallace C.V., Spötl C. and Taylor L. (2005)In-situ U-series dating by laser-ablation multi-collectorICPMS: New prospects for quaternary geochronology.Quaternary Science Reviews, 24, 2523–2538.
Fisher C.M., McFarlane C.R.M., Hanchar J.M., SchmitzM.D., Sylvester P.J., Lam R. and Longerich H.P. (2011)Sm-Nd isotope systematics by laser ablation-multicollectorinductively coupled plasma-mass spectrometry: Methodsand potential natural and synthetic reference materials.Chemical Geology, 284, 1–20.
Fricker M.B., Kutscher D., Aeschlimann B., Frommer J.,Dietiker R., Bettmer J. and G€unther D. (2011)High spatial resolution trace element analysis by LA-ICP-MS using a novel ablation cell for multiple or largesamples. International Journal of Mass Spectrometry,307, 39–45.
Garcia C.C., Lindner H. and Niemax K. (2007)Transport efficiency in femtosecond laser ablation induc-tively coupled plasma-mass spectrometry applying abla-tion cells with short and long washout times.Spectrochimica Acta Part B, 62, 13–19.
Glaus R., Kaegi R., Krumeich F. and G€unther D. (2010)Phenomenological studies on structure and elementalcomposition of nanosecond and femtosecond laser-gen-erated aerosols with implications on laser ablation induc-tively coupled plasma mass spectrometry. SpectrochimicaActa Part B, 65, 812–822.
Gonzalez J., Mao X.L., Roy J., Mao S.S. and Russo R.E.(2002)Comparison of 193, 213 and 266 nm laser ablationICP-MS. Journal of Analytical Atomic Spectrometry, 17,1108–1113.
Gonzalez J.J., Liu C., Wen S.-B., Mao X. and Russo R.E.(2007a)Metal particles produced by laser ablation for ICP-MSmeasurements. Talanta, 73, 567–576.
Gonzalez J.J., Liu C., Wen S.B., Mao X. and Russo R.E.(2007b)Glass particles produced by laser ablation for ICP-MSmeasurements. Talanta, 73, 577–582.
Gray A.L. (1985)Solid sample introduction by laser ablation for inductivelycoupled plasma source-mass spectrometry. Analyst, 110,551–556.
Guillong M., Horn I. and G€unther D. (2003)A comparison of 266 nm, 213 nm and 193 nm pro-duced from a single solid state Nd:YAG laser for laserablation ICP-MS. Journal of Analytical Atomic Spectrom-etry, 18, 1224–1230.
G€unther D. and Hattendorf B. (2005)Solid sample analysis using laser ablation inductivelycoupled plasma-mass spectrometry. Trends in AnalyticalChemistry, 24, 255–265.
Gurevich E.L. and Hergenr€oder R. (2007)A simple laser ICP-MS ablation cell with wash-out time lessthan 100 ms. Journal of Analytical Atomic Spectrometry,22, 1043–1050.
Hergenr€oder R. (2006a)Hydrodynamic sputtering as a possible source for frac-tionation in LA-ICP-MS. Journal of Analytical AtomicSpectrometry, 21, 517–524.
Hergenr€oder R. (2006b)A model for the generation of small particles in laserablation ICP-MS. Journal of Analytical Atomic Spectrom-etry, 21, 1016–1026.
Hirata T. (2007)Development of an on-line low gas pressure cell for laserablation-ICP-mass spectrometry. Analytical Sciences, 23,1195–1201.
Hirata T. and Ohno T. (2001)In-situ isotopic ratio analysis of iron using laser ablation-multiple collector-inductively coupled plasma-mass spec-trometry (LA-MC-ICP-MS). Journal of Analytical AtomicSpectrometry, 16, 487–491.
Horn I. and G€unther D. (2003)The influence of ablation carrier gasses Ar, He and Ne onthe particle size distribution and transport efficiencies oflaser ablation-induced aerosols: Implications for LA-ICP-MS.Applied Surface Science, 207, 144–157.
Horn I., Schoenberg R. and von Blanckenburg F.(2006a)Comment on “Analysis of Fe isotopes in sulfides and ironmeteorites by laser ablation high-mass resolution multi-collector-ICP mass spectrometry” by J. Ko�sler, R.B. Pedersen,C. Kruber and P.J. Sylvester. Journal of Analytical AtomicSpectrometry, 21, 211–213.
Horn I., von Blanckenburg F., Schoenberg R., SteinhoefelG. and Markl G. (2006b)In situ iron isotope ratio determination using UV-femtosec-ond laser ablation with application to hydrothermal oreformation processes. Geochimica et Cosmochimica Acta,70, 3677–3688.
Koch J. and G€unther D. (2011)Review of the state-of-the-art of laser ablation inductivelycoupled plasma-mass spectrometry. Applied Spectroscopy,65, 155A–162A.
Koch J., Bohlen A.V., Hergenr€oder R. and Niemax K.(2004)Particle size distributions and compositions of aerosolsproduced by near-IR femto- and nanosecond laser abla-tion of brass. Journal of Analytical Atomic Spectrometry,19, 267–272.
Koch J., Walle M., Dietiker R. and G€unther D. (2008)Analysis of laser-produced aerosols by inductively coupledplasma-mass spectrometry: Transport phenomena andelemental fractionation. Analytical Chemistry, 80, 915–921.
Kosler J., Pedersen R.B., Kruber C. and Sylvester P.J.(2005a)Analysis of Fe isotopes in sulfides and iron meteorites bylaser ablation high-mass resolution multi-collector ICP massspectrometry. Journal of Analytical Atomic Spectrometry,20, 192–199.
Kosler J., Wiedenbeck M., Wirth R., Hovorka J., SylvesterP. and Mikova J. (2005b)Chemical and phase composition of particles produced bylaser ablation of silicate glass and zircon-implications forelemental fractionation during ICP-MS analysis. Journal ofAnalytical Atomic Spectrometry, 20, 402–409.
Kosler J., Pedersen R., Kruber C. and Sylvester P.(2006)“Comment on analysis of Fe isotopes in sulfides and ironmeteorites by laser ablation high-mass resolution multi-collector ICP mass spectrometry” – a reply. Journal ofAnalytical Atomic Spectrometry, 21, 214–216.
Laville S., Vidal F., Johnston T.W., Barth�elemy O., ChakerM., Drogoff B.L., Margot J. and Sabsabi M. (2002)Fluid modeling of the laser ablation depth as a function ofthe pulse duration for conductors. Physical Review E, 66,066415.
Li W., Huberty J.M., Beard B.L., Valley J.W. and JohnsonC.M. (2013)Contrasting behavior of oxygen and iron isotopes in bandediron formations as determined by in situ isotopic analysis.Earth and Planetary Science Letters, 384, 132–143.
von der Linde D. and Sch€uler H. (1996)Breakdown threshold and plasma formation in femtosec-ond laser–solid interaction. Journal of the Optical Societyof America. B, Optical Physics, 13, 216–222.
von der Linde D. and Sokolowski-Tinten K. (2000)The physical mechanisms of short-pulse laser ablation.Applied Surface Science, 154–155, 1–10.
Lindner H., Autrique D., Garcia C.C., Niemax K. andBogaerts A. (2009)Optimized transport setup for high repetition rate pulse-separated analysis in laser ablation-inductively coupledplasma mass spectrometry. Analytical Chemistry, 81,4241–4248.
Liu C., Mao X.L., Mao S., Zeng X., Greif R. and Russo R.E.(2004)Nanosecond and femtosecond laser ablation of brass:Particulate and ICP-MS measurements. Analytical Chem-istry, 76, 379–383.
Lorazo P., Lewis L.J. and Meunier M. (2003)Short-pulse laser ablation of solids: From phase explosionto fragmentation. Physical Review Letters, 91, 225502.
Mozna V., Pisonero J., Hola M., Kanicky V. and G€untherD. (2006)Quantitative analysis of Fe-based samples using ultravioletnanosecond and femtosecond laser ablation-ICP-MS. Jour-nal of Analytical Atomic Spectrometry, 21, 1194–1201.
Muller W., Shelley M., Miller P. and Broude S. (2009)Initial performance metrics of a new custom-designed ArFexcimer LA-ICPMS system coupled to a two-volume laser-ablation cell. Journal of Analytical Atomic Spectrometry,24, 209–214.
Niemax K. (2001)Laser ablation – reflections on a very complex technique forsolid sampling. Fresenius’ Journal of Analytical Chemistry,370, 332–340.
Nishizawa M., Yamamoto H., Ueno Y., Tsuruoka S.,Shibuya T., Sawaki Y., Yamamoto S., Kon Y., Kitajima K.,Komiya T., Maruyama S. and Hirata T. (2010)Grain-scale iron isotopic distribution of pyrite from Precam-brian shallow marine carbonate revealed by a femtosec-ond laser ablation multicollector ICP-MS technique: Possibleproxy for the redox state of ancient seawater. Geochimicaet Cosmochimica Acta, 74, 2760–2778.
Perdian D.C., Bajic S.J., Baldwin D.P. and Houk R.S.(2008)Time-resolved studies of particle effects in laser ablationinductively coupled plasma-mass spectrometry. Journal ofAnalytical Atomic Spectrometry, 23, 325–335.
Perez D. and Lewis L.J. (2003)Molecular-dynamics study of ablation of solids underfemtosecond laser pulses. Physical Review B, 67, 184102.
Pettke T., Oberli F., Aud�etat A., Guillong M., Simon A.C.,Hanley J.J. and Klemm L.M. (2012)Recent developments in element concentration and isotoperatio analysis of individual fluid inclusions by laser ablationsingle and multiple collector ICP-MS. Ore GeologyReviews, 44, 10–38.
Pisonero J., Fliegel D. and G€unther D. (2006)High efficiency aerosol dispersion cell for laser ablationICP-MS. Journal of Analytical Atomic Spectrometry, 21,922–931.
Poitrasson F., Mao X., Mao S.S., Freydier R. and RussoR.E. (2003)Comparison of ultraviolet femtosecond and nanosecondlaser ablation inductively coupled plasma-mass spectrom-etry analysis in glass, monazite and zircon. AnalyticalChemistry, 75, 6184–6190.
Seydoux-Guillaume A.M., Freydier R., Poitrasson F.,D’Abzac F.X., Wirth R. and Datas L. (2010)Dominance of mechanical over thermally induced dam-age during femtosecond laser ablation of monazite.European Journal of Mineralogy, 22, 235–244.
Shaheen M. and Fryer B.J. (2010)Improving the analytical capabilities of femtosecond laserablation multicollector ICP-MS for high precision Pbisotopic analysis: The role of hydrogen and nitrogen.Journal of Analytical Atomic Spectrometry, 25, 1006–1013.
Shaheen M.E., Gagnon J.E. and Fryer B.J. (2013)Laser ablation of iron: A comparison between femtosecondand picosecond laser pulses. Journal of Applied Physics,114, 8.
Shuttleworth S. (2012)Optimizing ablation cells and aerosol transport systems forlaser ablation ICP-MS. Winter Conference on PlasmaSpectrochemistry 2012, (Tucson, USA).
Steinhoefel G., Horn I. and von Blanckenburg F. (2009)Micro-scale tracing of Fe and Si isotope signaturesin banded iron formation using femtosecond laserablation. Geochimica et Cosmochimica Acta, 73,5343–5360.
Stookey L.L. (1970)Ferrozine – A new spectrophotometric reagent for iron.Analytical Chemistry, 42, 779–781.
Woodhead J., Hergt J., Shelley M., Eggins S. and KempR. (2004)Zircon Hf-isotope analysis with an excimer laser, depthprofiling, ablation of complex geometries, andconcomitant age estimation. Chemical Geology, 209,121–135.
Yang Z., Fryer B.J., Longerich H.P., Gagnon J.E. andSamson I.M. (2010)785 nm femtosecond laser ablation for improved precisionand reduction of interferences in Sr isotope analyses usingMC-ICP-MS. Journal of Analytical Atomic Spectrometry,26, 341–351.
Yoshiya K., Nishizawa M., Sawakia Y., Uenoa Y., KomiyaT., Yamada K., Yoshida N., Hirata T., Wada H. andMaruyama S. (2012)In situ iron isotope analyses of pyrite and organic carbonisotope ratios in the Fortescue Group: Metabolic variationsof a Late Archean ecosystem. Precambrian Research,212–213, 169–193.
Supporting information
Additional information may be found in the onlineversion of this article:
This material is available as part of the online articlefrom: http://onlinelibrary.wiley.com/doi/10.1111/j.1751-908X.2014.00281.x/abstract (This link will take you tothe article abstract).


![ComparativeStudyonTwoPretreatmentProcessesforChemical ...downloads.hindawi.com/journals/jamc/2019/1792792.pdf · methods include titration [21], atomic absorption spec- trometry (AAS)](https://static.documents.pub/doc/80x56/5f73a2584a43b1160252709b/comparativestudyontwopretreatmentprocessesforchemical-methods-include-titration.jpg)


